chapter 25: metabolism bio 211 lecture instructor: dr. gollwitzer 1
TRANSCRIPT

Chapter 25: Metabolism
BIO 211 LectureInstructor: Dr. Gollwitzer
1
• Today in class we will discuss:– The definitions of metabolism, catabolism, anabolism
and nutrient pool• Their relationship
– Carbohydrate metabolism• Glycolysis• Citric acid/tricarboxylic (TCA) cycle• Electron transport system (ETS)
– Oxidative phosphorylation• Sources for glucose
– Glycogenesis– Glycogenolysis– Gluconeogenesis
2

Energy
• Cells break down organic molecules to obtain energy– Used to generate ATP
• Most energy production takes place in mitochondria
3

Essential Materials
• Oxygen • Water• Nutrients– Organic substrates– Mineral ions– Vitamins
4

Sources of Essential Materials
• Oxygen– Absorbed at lungs
• Other substances– Absorbed at digestive tract
5

Materials Transport
• Cardiovascular system– Carries materials through body
• Materials diffuse– From bloodstream into cells
6

Metabolism
• Refers to all chemical reactions in an organism
7

Cellular Metabolism
• Includes all chemical reactions within cells• Provides energy to:– Maintain homeostasis– Perform essential functions
8

Metabolic Turnover
• Cell recycling• Periodic replacement of cell’s organic
components• Involves:– Catabolism = breakdown of organic substrates • Releases energy used to form high-energy
compounds (e.g., ATP)
– Anabolism = synthesis of new organic molecules
9

Functions of Organic Compounds
• Perform structural maintenance and repairs
• Support growth• Produce secretions• Store nutrient reserves– Lipids in adipose tissue, bone marrow, liver – Glycogen in muscle and liver
10
Nutrient Pool
• Contains all organic building blocks cell needs to:– Provide energy– Create new cellular components
• Source of substrates (nutrients) for catabolism and anabolism, e.g.,– Glucose, fatty acids, amino acids
11
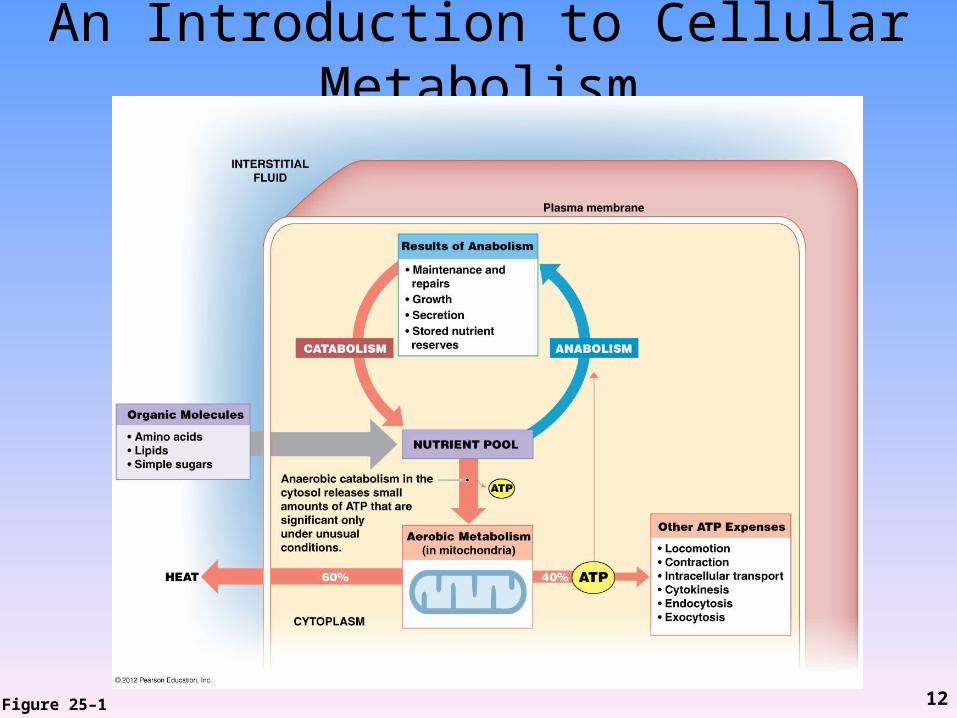
An Introduction to Cellular Metabolism
Figure 25–1 12

Nutrient Use in Cellular Metabolism
Figure 25–2 13

Key Organic Compounds• Glycogen– Most abundant storage carbohydrate– Branched chain of glucose molecules
• Triglycerides– Most abundant storage lipids– Primarily of fatty acids
• Proteins– Most abundant organic components in body– Perform many vital cellular functions
14

Preference for Energy Sources• Carbohydrates (glycogen)– short carbon chains, e.g., glucose
• Lipids (triglycerides)– FAs + glycerol
• Proteins– amino acids– Only used if other sources not available, e.g., in
starvation
15

Summary of Digestion
Figure 24-27 16

Carbohydrate Metabolism
• Generates ATP and other high-energy compounds by breaking down carbohydrates glucose– glucose + oxygen carbon dioxide + water
17

Step 1: Obtain Glucose
• From carbohydrate digestion– Polysaccharides (glycogen, starch)• Salivary and pancreatic amylases glucose
– Disaccharides, e.g., sucrose, maltose, lactose• Brush border enzymes
– e.g., sucrase, maltase, lactase glucose (from disaccharides)
– Monosaccharides• Glucose• Fructose, galactose glucose (in liver)
18

Disaccharide Digestion
Disaccharide(C12H22O11)
Enzyme(Brush Border)
Monosaccharide
(C6H12O6)
Sucrose Sucrase Glucose +Fructose
Lactose Lactase Glucose +Galactase
Maltose Maltase 2 molecules ofGlucose
19

Formation and Breakdown of Complex Sugars
Figure 2–12 20

Step 1: Obtain Glucose
• From glycogenolysis– Catabolic conversion of glycogen into glucose
• From gluconeogenesis– Synthesis of glucose from lipid or protein
21

Step 2: Use Glucose to Generate ATP
• Involves 2 pathways– Glycolysis• Anaerobic catabolism of glucose (C6) to pyruvic
acid (C3)
– Cellular respiration• Aerobic catabolism of pyruvic acid
22

Glycolysis • Anaerobic metabolism– Does not require O2
• Breaks down glucose (6C) in cytosol– Into 2 pyruvic acid (3C) molecules used by the mitochondria
• Energy yield– Net gain = 2 ATP/1 glucose molecule
• Only source of ATP for energy for RBCs (lack mitochondria)
• Used by muscle fibers during periods of active contraction (when O2 used up)
23

Glycolysis
Figure 25–3 24

Cellular Respiration• Aerobic metabolism– Requires O2
• Occurs in mitochondria– Consumes O2– Produces ATP
• Involves:– Tricarboxylic acid (TCA) cycle• aka citric acid cycle, Kreb’s cycle
– Oxidative phosphorylation• Electron transport system (ETS)• aka respiratory chain
25

Catabolism of Pyruvic Acid
• If O2 supplies adequate mitochondria absorb pyruvic acid molecules
• (In glycolysis, 1 glucose molecule) 2 Pyruvic acids (3C) – 2 Acetyl-CoAs (2C) + 2 CO2
26

TCA Cycle• Occurs in mitochondrial matrix• Acetyl-CoA (2C) + 4C 6C 5C 4C• C atoms removed and combined with O2
CO2• H atoms removed by coenzymes (FAD, NAD)
27

TCA Cycle
Figure 25–4a (Navigator), 7th edition 28

Oxidative Phosphorylation• Most important mechanism for generating ATP
(90% used by body)• Occurs in mitochondria• Requires:– O2– Coenzymes (FAD, NAD)– Electrons (from H atom)
• Results in:– 2 H2 + O2 2 H2O
29

Electron Transport System (ETS)
• Key series of reactions in oxidative phosphorylation
• Involves sequence of cytochromes (protein + pigment) in inner mitochondrial membrane
• Coenzymes (NAD, FAD) deliver H atoms to inner mitochondrial membrane
• H atom H+ + e- (electron)• Electrons– Enter ETS and pass along cytochromes
30

Oxidative Phosphorylation
Figure 25–5a (Navigator) , 7th edition 31

Oxidative Phosphorylation• Electrons– Transfer energy
• H+ – Pumped into intermembrane space– Re-enters matrix energy to generate ATP
• At end of ETS, e- + O- + H+ H2O• Energy yield = 36 ATP/glucose– 2 from glycolysis– 34 from oxidative phosphorylation
32

Oxidative Phosphorylation
Figure 25–5b 33

Summary: Energy Yield of Aerobic Metabolism = 36 ATP
Figure 25–6 34

Summary: Cellular Respiration• Begins with glucose• TCA CO2 of respiration• Oxidative phosphorylation– Uses O2 of respiration– Combines H + O H20
35

Summary: Carbohydrate Metabolism
• Involves:– Catabolism– Anabolism
• Independently regulated• Requires different sets of enzymes
36

Glycogen Metabolism
• Anabolism = glycogenesis– = Formation of glycogen from glucose– Occurs slowly – Glycogen stored in cytoplasmic granules
• Catabolism = glycogenolysis– = Breakdown of glycogen to form glucose– Occurs very quickly
37

Carbohydrate Catabolism and Anabolism
Figure 25–7 38

Gluconeogenesis
• = Synthesis of glucose from non-carbohydrate precursors:
– Lactic acid– Glycerol– Amino acids
• Glucose stored as glycogen in liver and skeletal muscle
39

• Today in class we will discuss:– Lipid metabolism• Lipogenesis• Lipolysis• Lipid transport and functional roles of:
– LDLs– HDLs
– Relative energy yields and importance of :• Carbohydrates (CHOs)• Lipids• Proteins
40

Lipids
• Largest energy reserve in adults (especially when glucose limited– Basis for Atkins diet
• Produce large amounts of ATP– FA release 1.5X energy of glucose but takes longer
• Excess CHOs converted into lipids• Stored as adipose tissue• Triglycerides = most abundant lipid in body
41

Lipid Catabolism
• Also called lipolysis• Breaks lipids down into pieces that can be:– Utilized for energy• Converted to pyruvic acid or acetyl-CoA and enter TCA
cycle
– Stored
• Occurs in mitochondria
42

Triglyceride Catabolism
• Hydrolysis splits TG into glycerol + 3 FA• Glycerol pyruvic acid TCA cycle• FA acetyl-CoA (via beta oxidation) TCA
cycle
43

Lipid Anabolism• Also called lipogenesis• Glycerol + FA(s) mono-/di-/tri-glycerides• Can use almost any organic substrate to
synthesize lipids– Because lipids, amino acids, and carbohydrates
can be converted to acetyl-CoA
44

Free Fatty Acids (FFAs)
• Are lipids• Important energy source:– When glucose supplies limited– During periods of starvation
• Liver cells, cardiac muscle cells, skeletal muscle fibers, etc.:– Metabolize free fatty acids
• In blood, are generally bound to albumin (most abundant plasma protein)
45

Lipoproteins• Lipid-protein complexes• Form in which most lipids circulate in
bloodstream• Distribution and formation controlled by liver• Classified according to size and proportions of
lipid (glycerides, cholesterol) vs. protein– Chylomicrons– LDLs– HDLs
46

Lipoproteins
• Chylomicrons– Largest lipoproteins– Produced in intestinal tract and enter lacteals
thoracic duct systemic circulation– Carry absorbed lipids from intestinal tract to
bloodstream(vs. other lipoproteins that carry lipids between tissues)
47

Lipoproteins
• LDLs (low-density lipoproteins)– “Bad” cholesterol– Deliver cholesterol to peripheral tissues for:• Membranes, hormones, storage
– Excess cholesterol plaques = atherosclerosis• Primary cause of coronary artery disease (CAD)• May myocardial infarction (heart attack)
48

Lipoproteins
• HDLs (high-density lipoproteins)– “Good” cholesterol– Transport excess cholesterol from peripheral
tissues back to liver for storage or excretion in bile– Do not cause circulatory problems
49

Lipid Transport and Utilization
Figure 25–9 50

Proteins
• Body synthesizes 100,000 to 140,000 proteins:– Each with different form, function, and structure
• All proteins are built from the 20 amino acids
51

Protein Metabolism
• Cellular proteins continuously recycled in cytosol– Peptide bonds broken amino acids (AAs)– Free AAs used in new proteins
52

Protein Metabolism
• If other energy sources (CHO, lipid) inadequate, AAs can enter TCA cycle ATP but:– More difficult to break apart– Produce toxic by-product, ammonia (NH3) which is
converted into urea in liver– Body needs protein for structural and functional
cell components
53

Deamination
• Prepares amino acid for breakdown in TCA cycle
• Removes amino group and hydrogen atom and generates NH4 (ammonium ion)
54

Ammonium Ions
• Highly toxic, even in low concentrations• Liver cells (primary sites of deamination) have
enzymes that use ammonium ions to synthesize urea (water-soluble compound excreted in urine)
55

Amino Acid Catabolism
Figure 25–10 (Navigator), 7th edition 56
Amino Acid Anabolism
• 12/22 AAs readily synthesized by body = nonessential AAs
• Other 10 = essential AAs– Must be acquired through diet
57

Amination
Figure 25–10, 7th edition 58
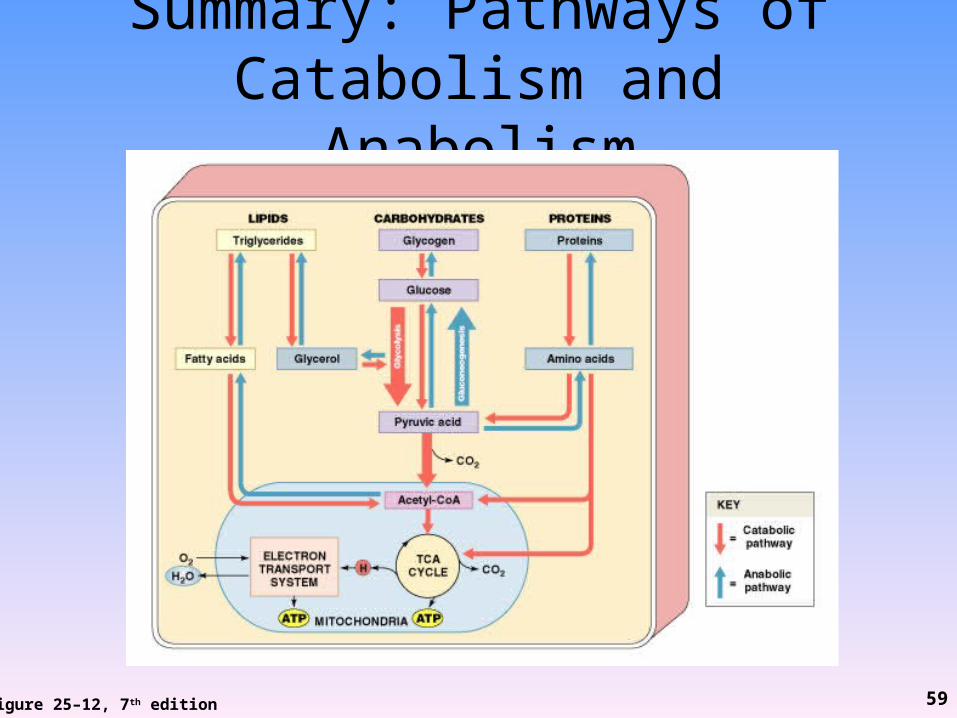
Summary: Pathways of Catabolism and Anabolism
Figure 25–12, 7th edition 59
Ketone Bodies
• During fasting or in absence of glucose (e.g., diabetes)– Lipid and amino acid catabolism acetyl-CoA
• Increased acetyl-CoA causes ketone bodies to form, e.g., acetone
60

Ketosis
• High concentration of ketone bodies in body fluids
• Lowers plasma pH• May cause dangerous drop in blood pH
(ketoacidosis)– pH < 7.05– May cause coma, cardiac arrhythmias, death
61

Energy Yield from Nutrients
• When nutrients (organic molecules) are catabolized they CO2 + H2O + ATP
• Energy released measured in calorimeter• Expressed in Calories (C)/gram• Calorie = amt of heat required to raise
temperature of 1 kg of water 1 degree C
62

Energy Yield from Nutrients
• Lipids 9.5 C/g– Greater because many C and H atoms already
bound to oxygen
• CHO 4.2 C/g• Protein 4.3 C/g• Calorie count of foods reflects mixture of fats,
CHO, proteins
63