chapter 23 radar navigation - thenauticalalmanac.com · 384 radar navigation radar sets utilize...
TRANSCRIPT

383
CHAPTER 23
RADAR NAVIGATION
PRINCIPLES OF RADAR OPERATION
2300. Introduction
Radar determines distance to an object by measuring
the time required for a radio signal (moving at the speed of
light) to travel from a transmitting antenna to the object,
reflect off that object, and return as a received echo.
Distance, or range, can be found by the simple formula:
range = 1/2 (C x t)
where range is in nautical miles
C = the speed of light in nautical miles per second, and
t = the time in seconds from the time of pulse transmis-
sion to echo reception.
Because the value of C is very large (162,000 NM/sec),
t is very small, 0.0001 sec for a target at a range of 10 miles
for example.
Such measurements can be converted into lines of po-
sition (LOP's) comprised of circles with radius equal to the
distance to the object. Since marine radars use directional
antennae, they can also determine an object's bearing. How-
ever, due to its design, radar's bearing measurements are
much less accurate than its distance measurements. Under-
standing this concept is crucial to ensuring the optimal
employment of the radar for safe navigation.
2301. Signal Characteristics
In most marine navigation applications, the radar
signal is pulse modulated. Signals are generated by a timing
circuit so that energy leaves the antenna in very short
pulses, usually less than one millionth of a second (or 1
µsec) in duration. When transmitting, the antenna is
connected to the transmitter but not the receiver. As soon as
the pulse leaves, an electronic switch disconnects the
antenna from the transmitter and connects it to the receiver.
Another pulse is not transmitted until after the preceding
one has had time to travel to the most distant target within
range and return. Since the interval between pulses is long
compared with the length of a pulse, strong signals can be
provided with low average power. The duration or length of
a single pulse is called pulse length, pulse duration, or
pulse width. This pulse emission sequence repeats a great
many times, perhaps 1,000 per second. This rate defines the
pulse repetition rate (PRR). The returned pulses are
displayed on an indicator screen or display.
2302. The Transmitter
In traditional marine radar sets, those produced since
the 1940s, the transmitter is a special electronic oscillator
diode tube known as a magnetron. The magnetron produces
very high power microwaves (25 KW and greater) for very
short periods of time.
Recently, another type of radar has been introduced
into the commercial marine industry know as solid state or
coherent radar. In modern solid state radars, the pulses gen-
erated by special circuitry in the transmitter are of much
less power, much longer in length, and of varying frequen-
cy. This type of radar does not use a magnetron and
generates an entirely different waveform. Presently, solid
state radar is only available in the S-Band and will be fur-
ther discussed in the following sections.
2303. The Receiver
The function of the receiver is to amplify the strength
of the very weak return echoes. The enhanced signals can
then be used to produce video signals which are presented
as targets on the display. The amplifiers in a traditional
magnetron radar have to deal with only one frequency,
either 3000 MHz or 10000 MHz depending on the radar set.
A solid state radar receiver however, must process a
much more complex signal with changing frequency. This
variable frequency, or chirp, necessitates signal processing
within the receiver known as pulse compression, which
shortens the comparatively long, 5 - 18 microsecond trans-
mitted pulse into a pulse of similar length to traditional
radars (0.05 - 1.0 µsec), while at the same time increasing
signal amplitude, thus yielding the same detection and
range measuring capabilities. A very great advantage of
solid state radars over magnetron radars is their superior
ability to filter out rain and sea clutter effects and therefore
assist the radar observer in identification of land targets
used in radar navigation.
2304. The Antenna
Nearly all modern commercial marine radars use a type
of antenna known as a slotted waveguide. See Figure 2304
Slotted waveguide antenna. Both solid state and magnetron

384 RADAR NAVIGATION
radar sets utilize this antenna configuration because it is
simple, efficient, and produces a beam that minimizes un-
wanted side lobes (side lobes will be discussed later in this
chapter).
2305. The Display
The radar display is often referred to as the plan
position indicator (PPI). On a PPI, the sweep appears as a
radial line, centered at the center of the scope and rotating
in synchronization with the antenna. Any returned echo
causes a brightening of the display screen at the bearing and
range of the object. The glow continues after the sweep
rotates past the target.
On a PPI, a target’s actual range is proportional to its
distance from the center of the scope. A movable cursor
helps to measure ranges and bearings. In the “heading-
upward” presentation, which indicates relative bearings,
the top of the scope represents the direction of the ship’s
head. In this destabilized presentation, the orientation
changes as the ship changes heading. In the stabilized
“north-upward” presentation, gyro north is always at the
top of the scope.
2306. The Radar Beam
The pulses of energy comprising the radar beam would
Figure 2304. Slotted waveguide antenna.

RADAR NAVIGATION 385
form a single lobe-shaped pattern of radiation if emitted in
free space. Figure 2306a shows this free space radiation
pattern, including the undesirable minor lobes or side lobes
associated with practical antenna design. This radiation pat-
tern, as well as the effects of diffraction, reflection and
attenuation described below, are common to both magne-
tron and solid state generated radar signals. Although the
radiated energy is concentrated into a relatively narrow
main beam by the antenna, there is no clearly defined enve-
lope of the energy radiated, although most of the energy is
concentrated along the axis of the beam.
The radiation diagram shown in Figure 2306b depicts
relative values of power in the same plane existing at the
same distances from the antenna or the origin of the radar
beam. Maximum power is in the direction of the axis of
the beam. Power values diminish rapidly in directions
away from the axis. The beam width is taken as the angle
between the half-power points.
The beam width depends upon the frequency or wave-
length of the transmitted energy, antenna design, and the
dimensions of the antenna. For a given antenna size (an-
tenna aperture), narrower beam widths result from using
shorter wavelengths. For a given wavelength, narrower
beam widths result from using larger antennas, or i.e.,
beam width is inversely proportional to antenna aperture.
Because marine radar antennas are long in the horizontal
dimension and narrow in the vertical dimension, they pro-
duce a beam that is narrow in the horizontal direction and
somewhat wider in the vertical direction. The narrow hor-
izontal beam is desirable for bearing accuracy while the
wide vertical beam is needed to account for the pitching
and rolling of a vessel in a seaway. If the vertical beam
was as narrow as the horizontal beam, a vessel in rough
weather would experience intermittent target response as
the beam would not intersect the horizon at all times.
The main lobe of the radar beam is composed of a
number of separate lobes in the vertical dimension, as op-
posed to the single lobe-shaped pattern of radiation as
emitted in free space. This phenomenon is the result of in-
terference between radar waves taking a direct line-of-
Figure 2306a. Freespace radiation pattern.
Figure 2306b. Radiation diagram.
Figure 2306c. Direct and indirect waves.

386 RADAR NAVIGATION
sight path to a target, and those waves that are reflected
from the surface of the sea before striking the target. There
is a slight difference in distance between which the direct
and indirect waves must travel. See Figure 2306c. These
reflected (indirect) waves interfere either constructively
or destructively with the direct waves depending upon the
waves' phase relationship. This sets up the possibility of
poor target response for objects at certain ranges from
own ship.
2307. Effects of Distance, Target Response, Attenuation
and Diffraction
Just as a light source reflected in a mirror appears much
dimmer than the direct image, radar echoes are much
weaker than the transmitted pulses due to the general
spreading out of the radar signal energy with distance. The
strengths of these echoes are also dependent upon the
amount of transmitted energy striking the targets and the
size and reflecting properties of the targets known as radar
cross section.
Attenuation is the scattering and absorption of the
energy in the radar beam as it passes through the
atmosphere. It causes a decrease in echo strength.
Attenuation is greater in 3-cm rather than 10-cm radar.
Atmospheric water particles (heavy fog, rain and snow) can
significantly degrade the performance of a 3-cm radar
system. During periods of heavy precipitation, the radar
observer should switch to the 10-cm set if one is available.
Diffraction is the bending of a wave as it passes an ob-
struction. Because of diffraction there is some illumination
of the region behind an obstruction or target by the radar
beam. Diffraction effects are greater at the lower frequen-
cies with longer wavelengths (S-Band). Thus, the radar
beam of 10-cm radar tends to illuminate more of the shad-
ow region behind an obstruction than the beam of X-Band
radar of 3-cm wavelength.
2308. Refraction
If the radar waves traveled in straight lines, the
distance to the radar horizon would be dependent only on
the power output of the transmitter and the height of the
antenna. In other words, the distance to the radar horizon
would be the same as that of the geometrical horizon for the
antenna height. However, atmospheric density gradients
bend radar rays as they travel to and from a target. This
bending is called refraction.
The distance to the radar horizon does not always limit
the distance from which echoes may be received from tar-
gets. Assuming that adequate power is transmitted, echoes
may be received from targets beyond the radar horizon if
their reflecting surfaces extend above it. The distance to the
radar horizon is the distance at which the radar rays pass
tangent to the surface of the Earth.
The following formula, where h is the height of the an-
tenna in feet, gives the theoretical distance to the radar
horizon in nautical miles:
D = the range in nautical miles
h = height of the antenna.
2309. Factors Affecting Radar Interpretation
Radar’s value as a navigational aid depends on the
navigator’s understanding its characteristics and
limitations. Whether measuring the range to a single
reflective object or trying to discern a shoreline lost amid
severe clutter, knowledge of the characteristics of the
individual radar used are crucial. Some of the factors to be
considered in interpretation are discussed below:
• Resolution in Range. In Part A of Figure 2309a, a
transmitted pulse has arrived at the second of two tar-
gets of insufficient size or density to absorb or reflect
all of the energy of the pulse. While the pulse has trav-
eled from the first to the second target, the echo from
the first has traveled an equal distance in the opposite
direction. At B, the transmitted pulse has continued on
beyond the second target, and the two echoes are re-
turning toward the transmitter. The distance between
leading edges of the two echoes is twice the distance
between targets and so the display will indicate two
distinct targets. The correct distance between targets
will be shown on the display, which is calibrated to
show half the distance traveled out and back. At C the
targets are closer together and the pulse length has been
increased. The two echoes merge, and on the scope
they will appear as a single, large target. At D the pulse
length has been decreased, and the two echoes appear
separated. The ability of a radar to separate targets
close together on the same bearing is called resolution
in range. It is related primarily to pulse length. The
minimum distance between targets that can be distin-
guished as separate is one half the pulse length. This
(half the pulse length) is the apparent depth or thick-
ness of a target but in no way represents that actual size
of a small isolated target like a buoy or boat. Thus, sev-
eral ships close together on nearly the same bearing
may appear as an island. Echoes from a number of
small boats, piles, breakers, or even a single large ship
close to the shore may blend with echoes from the
shore, resulting in an incorrect indication of the posi-
tion and shape of the shoreline.
• Resolution in Bearing. Echoes from two or more tar-
gets close together at the same range may merge to form
a single, wider echo. The ability to separate targets
close together at the same range is called resolution in
bearing. Bearing resolution is a function of two vari-
D 1.22 h .=

RADAR NAVIGATION 387
ables: horizontal beam width and range to the targets. A
narrower horizontal beam and/or a shorter distance to
the objects will allow for better bearing resolution.
• Height of Antenna and Target. If the radar horizon is
between the transmitting vessel and the target, the
lower part of the target will not be visible. A large
vessel may appear as a small craft, or a shoreline may
appear at some distance inland.
Figure 2309a. Resolution in range.
388 RADAR NAVIGATION
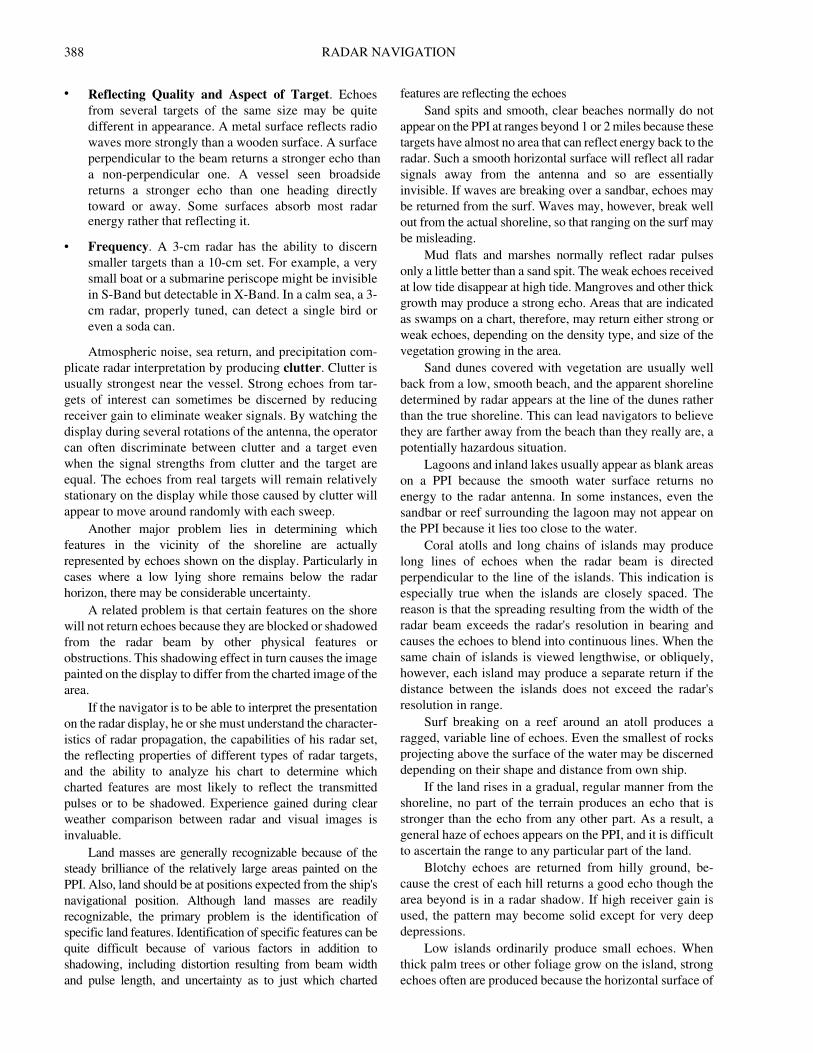
• Reflecting Quality and Aspect of Target. Echoes from several targets of the same size may be quite different in appearance. A metal surface reflects radio waves more strongly than a wooden surface. A surface perpendicular to the beam returns a stronger echo than a non-perpendicular one. A vessel seen broadside returns a stronger echo than one heading directly toward or away. Some surfaces absorb most radar energy rather that reflecting it.
• Frequency. A 3-cm radar has the ability to discern
smaller targets than a 10-cm set. For example, a very
small boat or a submarine periscope might be invisible
in S-Band but detectable in X-Band. In a calm sea, a 3-
cm radar, properly tuned, can detect a single bird or
even a soda can.
Atmospheric noise, sea return, and precipitation com-
plicate radar interpretation by producing clutter. Clutter is
usually strongest near the vessel. Strong echoes from tar-
gets of interest can sometimes be discerned by reducing
receiver gain to eliminate weaker signals. By watching the
display during several rotations of the antenna, the operator
can often discriminate between clutter and a target even
when the signal strengths from clutter and the target are
equal. The echoes from real targets will remain relatively
stationary on the display while those caused by clutter will
appear to move around randomly with each sweep.
Another major problem lies in determining which
features in the vicinity of the shoreline are actually
represented by echoes shown on the display. Particularly in
cases where a low lying shore remains below the radar
horizon, there may be considerable uncertainty.
A related problem is that certain features on the shore
will not return echoes because they are blocked or shadowed
from the radar beam by other physical features or
obstructions. This shadowing effect in turn causes the image
painted on the display to differ from the charted image of the
area.
If the navigator is to be able to interpret the presentation
on the radar display, he or she must understand the character-
istics of radar propagation, the capabilities of his radar set,
the reflecting properties of different types of radar targets,
and the ability to analyze his chart to determine which
charted features are most likely to reflect the transmitted
pulses or to be shadowed. Experience gained during clear
weather comparison between radar and visual images is
invaluable.
Land masses are generally recognizable because of the
steady brilliance of the relatively large areas painted on the
PPI. Also, land should be at positions expected from the ship's
navigational position. Although land masses are readily
recognizable, the primary problem is the identification of
specific land features. Identification of specific features can be
quite difficult because of various factors in addition to
shadowing, including distortion resulting from beam width
and pulse length, and uncertainty as to just which charted
features are reflecting the echoes
Sand spits and smooth, clear beaches normally do not
appear on the PPI at ranges beyond 1 or 2 miles because these
targets have almost no area that can reflect energy back to the
radar. Such a smooth horizontal surface will reflect all radar
signals away from the antenna and so are essentially
invisible. If waves are breaking over a sandbar, echoes may
be returned from the surf. Waves may, however, break well
out from the actual shoreline, so that ranging on the surf may
be misleading.
Mud flats and marshes normally reflect radar pulses
only a little better than a sand spit. The weak echoes received
at low tide disappear at high tide. Mangroves and other thick
growth may produce a strong echo. Areas that are indicated
as swamps on a chart, therefore, may return either strong or
weak echoes, depending on the density type, and size of the
vegetation growing in the area.
Sand dunes covered with vegetation are usually well
back from a low, smooth beach, and the apparent shoreline
determined by radar appears at the line of the dunes rather
than the true shoreline. This can lead navigators to believe
they are farther away from the beach than they really are, a
potentially hazardous situation.
Lagoons and inland lakes usually appear as blank areas
on a PPI because the smooth water surface returns no
energy to the radar antenna. In some instances, even the
sandbar or reef surrounding the lagoon may not appear on
the PPI because it lies too close to the water.
Coral atolls and long chains of islands may produce
long lines of echoes when the radar beam is directed
perpendicular to the line of the islands. This indication is
especially true when the islands are closely spaced. The
reason is that the spreading resulting from the width of the
radar beam exceeds the radar's resolution in bearing and
causes the echoes to blend into continuous lines. When the
same chain of islands is viewed lengthwise, or obliquely,
however, each island may produce a separate return if the
distance between the islands does not exceed the radar's
resolution in range.
Surf breaking on a reef around an atoll produces a
ragged, variable line of echoes. Even the smallest of rocks
projecting above the surface of the water may be discerned
depending on their shape and distance from own ship.
If the land rises in a gradual, regular manner from the
shoreline, no part of the terrain produces an echo that is
stronger than the echo from any other part. As a result, a
general haze of echoes appears on the PPI, and it is difficult
to ascertain the range to any particular part of the land.
Blotchy echoes are returned from hilly ground, be-
cause the crest of each hill returns a good echo though the
area beyond is in a radar shadow. If high receiver gain is
used, the pattern may become solid except for very deep
depressions.
Low islands ordinarily produce small echoes. When
thick palm trees or other foliage grow on the island, strong
echoes often are produced because the horizontal surface of

RADAR NAVIGATION 389
the water around the island forms a sort of corner reflector
with the vertical surfaces of the trees. As a result, wooded
islands give good echoes and can be detected at a much
greater range than barren islands.
Sizable land masses may be missing from the radar dis-
play because of shadowing. A shoreline which is continuous
on the PPI display when the ship is at one position, may not
appear continuous when the ship is at another position and
scanning the same shoreline. The radar beam may be blocked
from a segment of this shoreline by an obstruction such as a
promontory. An indentation in the shoreline, such as a cove
or bay, appearing on the PPI when the ship is at one position,
may not appear when the ship is at another position nearby.
Radar shadowing alone can cause considerable differences
between the PPI display and the chart presentation. This ef-
fect in conjunction with beam width and pulse length
distortion of the PPI display can cause even greater differenc-
es, possibly leading to confusion and navigational error.
The returns of objects close to shore may merge with
the shoreline image on the PPI, because of distortion effects
of horizontal beam width and pulse length. Target images
on the PPI are distorted angularly by an amount equal to the
effective horizontal beam width. Also, the target images al-
ways are distorted radially by an amount at least equal to
one-half the pulse length (150 meters per microsecond of
pulse length).
See Figure 2309b. It illustrates the effects of own ship
position, horizontal beam width, and pulse length on the ra-
dar image of a coastline. Because of beam width distortion,
a straight, or nearly straight shoreline often appears cres-
cent-shaped on the PPI. This effect is greater with the wider
beam widths. Note that this distortion increases as the angle
between the beam axis and the shoreline decreases. Figure
2309c, Figure 2309d and Figure 2309e correspond to posi-
tions A, B and C in Figure 2309b.
See Figure 2309f. View A shows the actual shape of
the shoreline and the land behind it. Note the steel tower on
the low sand beach and the two ships at anchor close to
shore. The heavy line in View B represents the shoreline on
the PPI. The dotted lines represent the actual position and
shape of all targets. Note in particular:
1. The low sand beach is not detected by the radar.
2. The tower on the low beach is detected, but it looks like a
ship in a cove. At closer range the land would be detected
and the cove-shaped area would begin to fill in; then the
tower could not be seen without reducing the receiver gain.
Figure 2309b. Effects of ship’s position, beam width, and pulse length on radar shoreline. Figure 2309c, Figure 2309d and
Figure 2309e correspond to position A, B and C in the image above.

390 RADAR NAVIGATION
3. The radar shadow behind both mountains. Distortion
owing to radar shadows is responsible for more
confusion than any other cause. The small island does
not appear because it is in the radar shadow.
4. The spreading of the land in bearing caused by beam
width distortion. Look at the upper shore of the
peninsula. The shoreline distortion is greater to the west
because the angle between the radar beam and the shore
is smaller as the beam seeks out the more westerly shore.
5. Ship No. 1 appears as a small peninsula. Its return has
merged with the land because of the beam width
distortion.
6. Ship No. 2 also merges with the shoreline and forms a
bump. This bump is caused by pulse length and beam
width distortion. Reducing receiver gain might cause
the ship to separate from land, provided the ship is not
too close to the shore. The rain clutter control could also
be used to attempt to separate the ship from land by
effectively reducing the pulse lengths within the
receiver.
2310. Recognition of Unwanted Echoes
Indirect or false echoes are caused by reflection of the
main lobe of the radar beam off own ship's structures such
as masts, stacks, kingposts or deck cargo, especially
containers. When such reflection from obstructions does
occur, the echo will return from a legitimate radar contact
to the antenna by the same indirect path. Consequently, the
echo will appear on the PPI at the bearing of the reflecting
surface. As shown in Figure 2310a, the indirect echo will
appear on the PPI at the same range as the direct echo
received, assuming that the additional distance by the
indirect path is negligible.
Characteristics by which indirect echoes may be recog-
nized are summarized as follows:
1. Indirect echoes will often occur in shadow sectors.
2. They are received on substantially constant relative
bearings (the direction of the obstruction), although
the true bearing of the radar contact may change
Figure 2309c. 12 mile scale. off-center display at 0700
position. See position A in Figure 2309b.
Figure 2309d. 12 mile scale display centered at 0730 position.
See position B in Figure 2309b.
Figure 2309e. 6 mile scale. display center at 0800 position.
See position C in Figure 2309b.

RADAR NAVIGATION 391
appreciably.
3. They appear at the same ranges as the
corresponding direct echoes.
4. When plotted, their movements are usually
abnormal.
5. Their distorted or fuzzy shapes may indicate that
they are not direct echoes.
Side-lobe effects are readily recognized in that they
produce a series of echoes (See Figure 2310b) on each side
of the main lobe echo at the same range as the latter. Semi-
circles, or even complete circles, may be produced.
Because of the low energy of the side-lobes, these effects
will normally occur only at the shorter ranges. The effects
may be minimized or eliminated, through use of the gain
and anti-clutter controls, but always at the risk of failing to
detect weaker targets like buoys or small boats. The intro-
duction of slotted wave guide antennas has drastically
reduced the side-lobe problem. Nevertheless, when strong
reflecting targets are present at close range, side lobe effects
will still be encountered and may be difficult to eliminate
entirely without severely reducing gain.
Multiple echoes may occur when a strong echo is re-
ceived from another ship at close range. A second or third
or more echoes may be observed on the radarscope at dou-
ble, triple, or other multiples of the actual range of the radar
contact (Figure 2310c).
Second-trace echoes (multiple-trace echoes) are
echoes received from a contact at an actual range greater
than the radar range setting. If an echo from a distant target
is received after the next pulse has been transmitted, the
echo will appear on the display at the correct bearing but
not at the true range. Second-trace echoes are unusual, ex-
cept under abnormal atmospheric conditions, or conditions
under which super-refraction or ducting is present. Second-
trace echoes may be recognized through changes in their
positions on the display when changing range scales with
different pulse repetition rates (PRR), their hazy, streaky, or
distorted shapes (especially noticeable with large land tar-
gets), and their erratic movements on plotting.
As illustrated in Figure 2310d, a target echo is detected
on a true bearing of 090° at a distance of 7.5 miles. On
changing the PRR from 2,000 to 1,800 pulses per second in
Figure 2310e, the same target is detected on a bearing of
090° at a distance of 3 miles. The change in the position of
the target indicates that the echo is a second-trace echo. The
actual distance of the target is the distance as indicated on
the PPI plus half the distance the radar waves travel be-
tween pulses. In this case,
(162,000 NM/sec ÷ 2000 PPS ÷ 2) + 7.5 = 48 nautical
miles.
Naturally, since we are on the 12-mile scale, the target
should not be visible and so must be a second-trace echo.
Electronic interference effects, which may occur when
near another radar operating in the same frequency band as
that of own ship, are usually seen on the radar as a large
number of small bright dots either scattered at random or in
the form of curving dotted lines extending from the center
to the edge of the PPI.
Interference effects are greater at the longer radar
range scale settings. Interference effects can be distin-
guished easily from normal echoes because they do not
appear in the same places on successive rotations of the
antenna. Most radar systems have interference rejection
controls (IR) that eliminate most of the unwanted
interference effects.
Stacks, masts, containers, and other structures, may cause a
reduction in the intensity of the radar beam beyond these
obstructions, especially if they are close to the radar antenna. If
the angle at the antenna subtended by the obstruction is more
Figure 2309f. Distortion effects of radar shadow, beam width, and pulse length.

392 RADAR NAVIGATION
than a few degrees, the reduction of the intensity of the radar
beam beyond the obstruction may produce a blind sector. Less
reduction in the intensity of the beam beyond the obstructions
may produce shadow sectors. Within a shadow sector, small
targets at close range may not be detected, while larger targets at
much greater ranges will appear.
The echo from an overhead power cable can be wrongly
identified as the echo from a ship on a steady bearing and de-
creasing range. Course changes to avoid the contact are
ineffective; the contact remains on a steady bearing, decreasing
range. This phenomenon is particularly apparent for the power
cable spanning the Straits of Messina.
2311. Aids to Radar Navigation
Radar navigation aids help identify radar targets and
increase echo signal strength from otherwise poor radar
targets.
Buoys are particularly poor radar targets. Weak, fluc-
tuating echoes received from these targets are easily lost in
the sea clutter. To aid in the detection of these targets, radar
reflectors, designated corner reflectors, may be used. These
reflectors may be mounted on the tops of buoys or designed
into the structure.
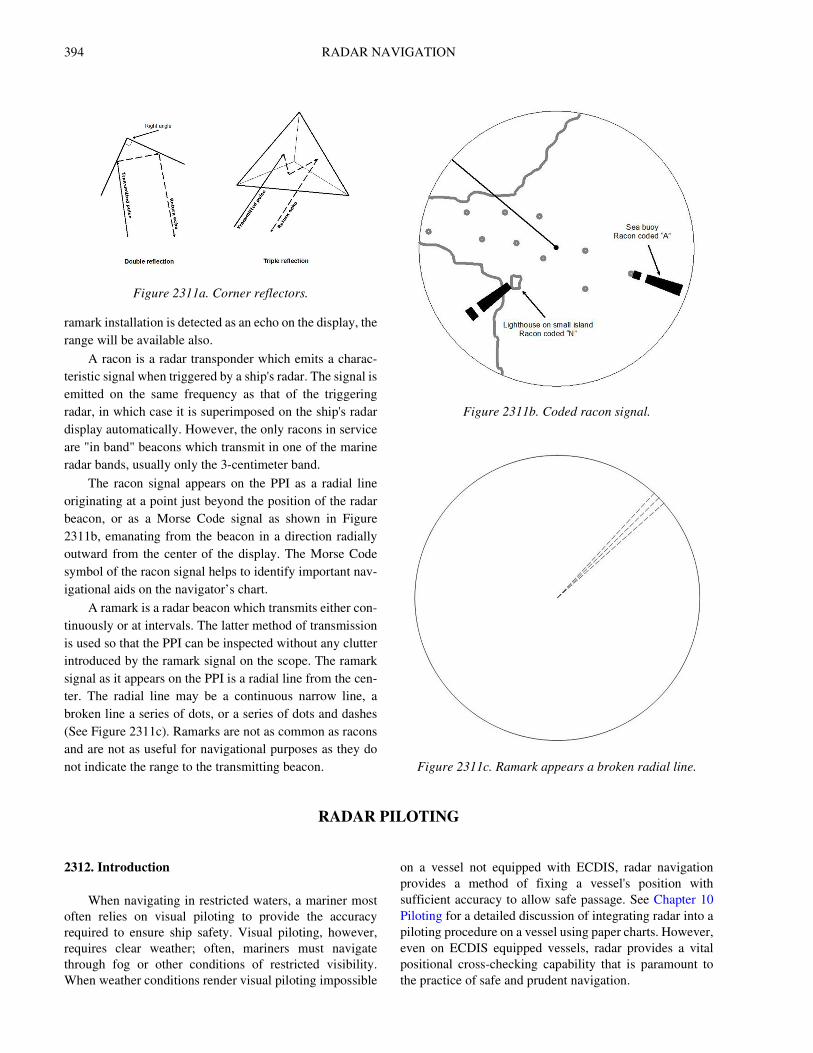
Each corner reflector, as shown in Figure 2311a,
consists of three mutually perpendicular flat metal surfaces.
A radar wave striking any of the metal surfaces or plates
Figure 2310a. Indirect echo.
Figure 2310b. Side lobe effects.

RADAR NAVIGATION 393
will be reflected back in the direction of its source.
Maximum energy will be reflected back to the antenna if
the axis of the radar beam makes equal angles with all the
metal surfaces. Frequently, corner reflectors are assembled
in clusters to maximize the reflected signal.
Although radar reflectors are used to obtain stronger
echoes from radar targets, other means are required for more
positive identification of radar targets. Radar beacons are
transmitters operating in the marine radar frequency band,
which produce distinctive indications on the radar displays of
ships within range of these beacons. There are two general
classes of these beacons: racons, which provide both
bearing and range information to the target, and ramarks
which provide bearing information only. However, if the
Figure 2310c. Multiple echoes.
Figure 2310d. Second-trace echo. Figure 2310e. Second-trace echo after altering PRR.
394 RADAR NAVIGATION
ramark installation is detected as an echo on the display, the
range will be available also.
A racon is a radar transponder which emits a charac-
teristic signal when triggered by a ship's radar. The signal is
emitted on the same frequency as that of the triggering
radar, in which case it is superimposed on the ship's radar
display automatically. However, the only racons in service
are "in band" beacons which transmit in one of the marine
radar bands, usually only the 3-centimeter band.
The racon signal appears on the PPI as a radial line
originating at a point just beyond the position of the radar
beacon, or as a Morse Code signal as shown in Figure
2311b, emanating from the beacon in a direction radially
outward from the center of the display. The Morse Code
symbol of the racon signal helps to identify important nav-
igational aids on the navigator’s chart.
A ramark is a radar beacon which transmits either con-
tinuously or at intervals. The latter method of transmission
is used so that the PPI can be inspected without any clutter
introduced by the ramark signal on the scope. The ramark
signal as it appears on the PPI is a radial line from the cen-
ter. The radial line may be a continuous narrow line, a
broken line a series of dots, or a series of dots and dashes
(See Figure 2311c). Ramarks are not as common as racons
and are not as useful for navigational purposes as they do
not indicate the range to the transmitting beacon.
RADAR PILOTING
2312. Introduction
When navigating in restricted waters, a mariner most
often relies on visual piloting to provide the accuracy
required to ensure ship safety. Visual piloting, however,
requires clear weather; often, mariners must navigate
through fog or other conditions of restricted visibility.
When weather conditions render visual piloting impossible
on a vessel not equipped with ECDIS, radar navigation
provides a method of fixing a vessel's position with
sufficient accuracy to allow safe passage. See Chapter 10
Piloting for a detailed discussion of integrating radar into a
piloting procedure on a vessel using paper charts. However,
even on ECDIS equipped vessels, radar provides a vital
positional cross-checking capability that is paramount to
the practice of safe and prudent navigation.
Figure 2311a. Corner reflectors.
Figure 2311b. Coded racon signal.
Figure 2311c. Ramark appears a broken radial line.
RADAR NAVIGATION 395
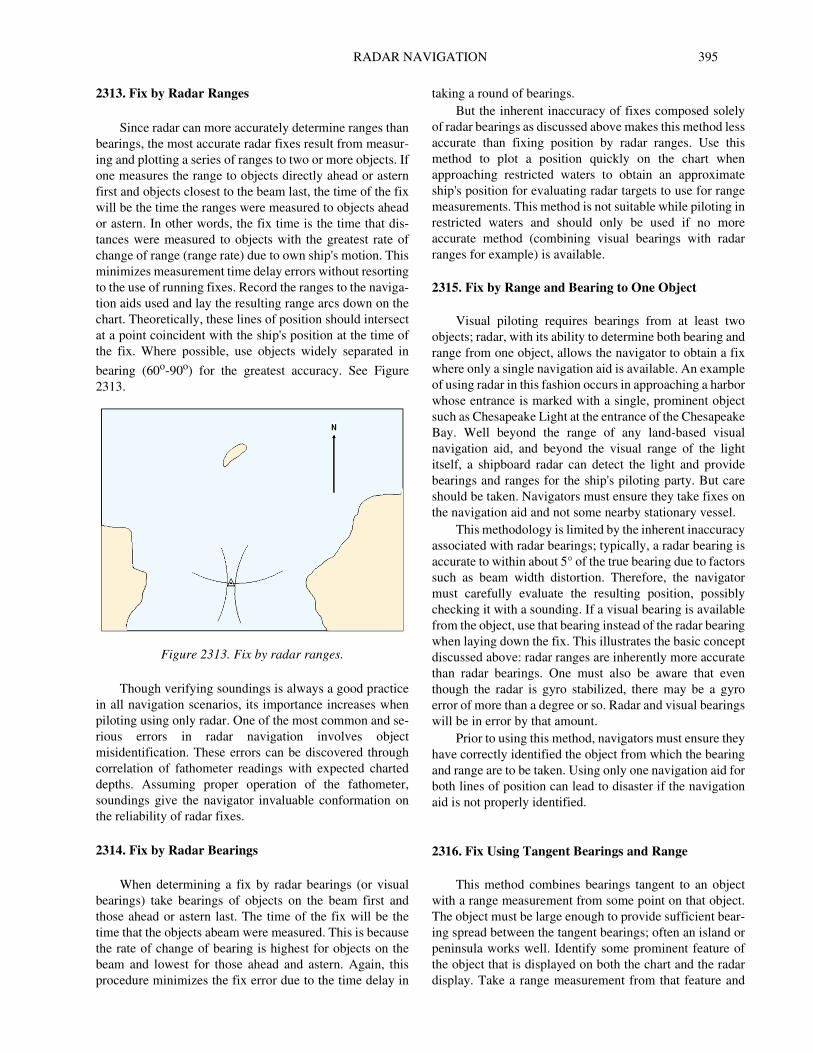
2313. Fix by Radar Ranges
Since radar can more accurately determine ranges than
bearings, the most accurate radar fixes result from measur-
ing and plotting a series of ranges to two or more objects. If
one measures the range to objects directly ahead or astern
first and objects closest to the beam last, the time of the fix
will be the time the ranges were measured to objects ahead
or astern. In other words, the fix time is the time that dis-
tances were measured to objects with the greatest rate of
change of range (range rate) due to own ship's motion. This
minimizes measurement time delay errors without resorting
to the use of running fixes. Record the ranges to the naviga-
tion aids used and lay the resulting range arcs down on the
chart. Theoretically, these lines of position should intersect
at a point coincident with the ship's position at the time of
the fix. Where possible, use objects widely separated in
bearing (60o-90o) for the greatest accuracy. See Figure
2313.
Though verifying soundings is always a good practice
in all navigation scenarios, its importance increases when
piloting using only radar. One of the most common and se-
rious errors in radar navigation involves object
misidentification. These errors can be discovered through
correlation of fathometer readings with expected charted
depths. Assuming proper operation of the fathometer,
soundings give the navigator invaluable conformation on
the reliability of radar fixes.
2314. Fix by Radar Bearings
When determining a fix by radar bearings (or visual
bearings) take bearings of objects on the beam first and
those ahead or astern last. The time of the fix will be the
time that the objects abeam were measured. This is because
the rate of change of bearing is highest for objects on the
beam and lowest for those ahead and astern. Again, this
procedure minimizes the fix error due to the time delay in
taking a round of bearings.
But the inherent inaccuracy of fixes composed solely
of radar bearings as discussed above makes this method less
accurate than fixing position by radar ranges. Use this
method to plot a position quickly on the chart when
approaching restricted waters to obtain an approximate
ship's position for evaluating radar targets to use for range
measurements. This method is not suitable while piloting in
restricted waters and should only be used if no more
accurate method (combining visual bearings with radar
ranges for example) is available.
2315. Fix by Range and Bearing to One Object
Visual piloting requires bearings from at least two
objects; radar, with its ability to determine both bearing and
range from one object, allows the navigator to obtain a fix
where only a single navigation aid is available. An example
of using radar in this fashion occurs in approaching a harbor
whose entrance is marked with a single, prominent object
such as Chesapeake Light at the entrance of the Chesapeake
Bay. Well beyond the range of any land-based visual
navigation aid, and beyond the visual range of the light
itself, a shipboard radar can detect the light and provide
bearings and ranges for the ship's piloting party. But care
should be taken. Navigators must ensure they take fixes on
the navigation aid and not some nearby stationary vessel.
This methodology is limited by the inherent inaccuracy
associated with radar bearings; typically, a radar bearing is
accurate to within about 5° of the true bearing due to factors
such as beam width distortion. Therefore, the navigator
must carefully evaluate the resulting position, possibly
checking it with a sounding. If a visual bearing is available
from the object, use that bearing instead of the radar bearing
when laying down the fix. This illustrates the basic concept
discussed above: radar ranges are inherently more accurate
than radar bearings. One must also be aware that even
though the radar is gyro stabilized, there may be a gyro
error of more than a degree or so. Radar and visual bearings
will be in error by that amount.
Prior to using this method, navigators must ensure they
have correctly identified the object from which the bearing
and range are to be taken. Using only one navigation aid for
both lines of position can lead to disaster if the navigation
aid is not properly identified.
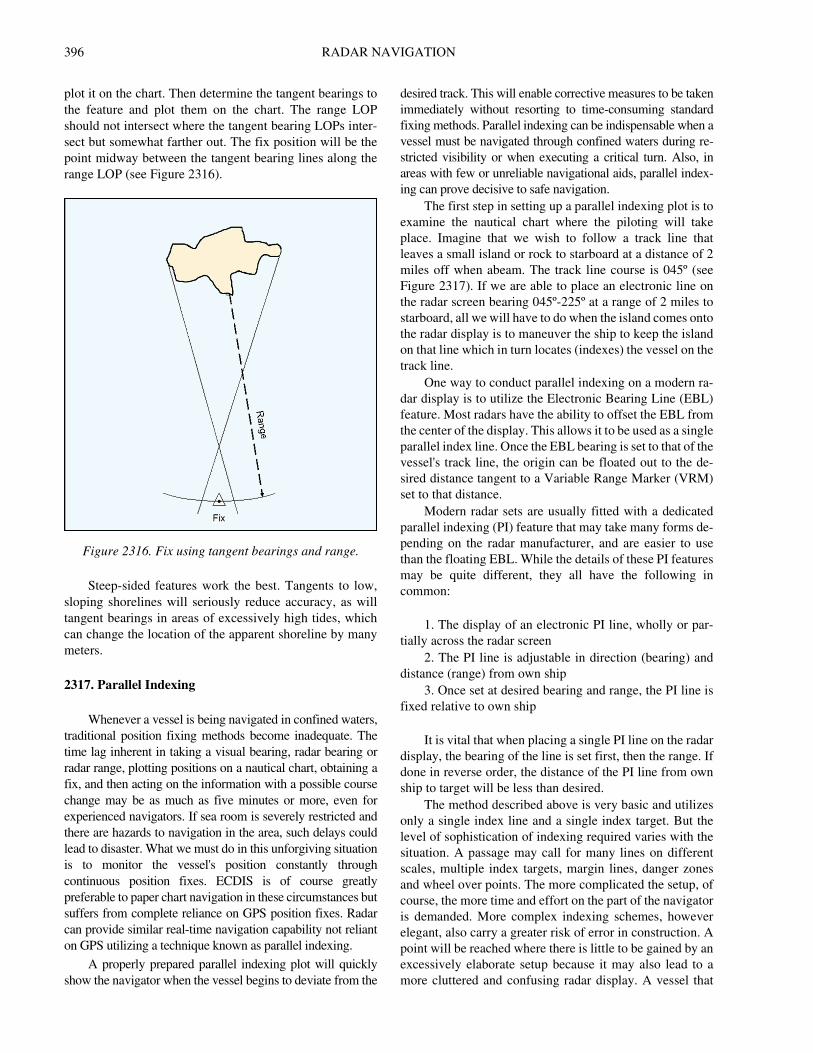
2316. Fix Using Tangent Bearings and Range
This method combines bearings tangent to an object
with a range measurement from some point on that object.
The object must be large enough to provide sufficient bear-
ing spread between the tangent bearings; often an island or
peninsula works well. Identify some prominent feature of
the object that is displayed on both the chart and the radar
display. Take a range measurement from that feature and
Figure 2313. Fix by radar ranges.
396 RADAR NAVIGATION
plot it on the chart. Then determine the tangent bearings to
the feature and plot them on the chart. The range LOP
should not intersect where the tangent bearing LOPs inter-
sect but somewhat farther out. The fix position will be the
point midway between the tangent bearing lines along the
range LOP (see Figure 2316).
Steep-sided features work the best. Tangents to low,
sloping shorelines will seriously reduce accuracy, as will
tangent bearings in areas of excessively high tides, which
can change the location of the apparent shoreline by many
meters.
2317. Parallel Indexing
Whenever a vessel is being navigated in confined waters,
traditional position fixing methods become inadequate. The
time lag inherent in taking a visual bearing, radar bearing or
radar range, plotting positions on a nautical chart, obtaining a
fix, and then acting on the information with a possible course
change may be as much as five minutes or more, even for
experienced navigators. If sea room is severely restricted and
there are hazards to navigation in the area, such delays could
lead to disaster. What we must do in this unforgiving situation
is to monitor the vessel's position constantly through
continuous position fixes. ECDIS is of course greatly
preferable to paper chart navigation in these circumstances but
suffers from complete reliance on GPS position fixes. Radar
can provide similar real-time navigation capability not reliant
on GPS utilizing a technique known as parallel indexing.
A properly prepared parallel indexing plot will quickly
show the navigator when the vessel begins to deviate from the
desired track. This will enable corrective measures to be taken
immediately without resorting to time-consuming standard
fixing methods. Parallel indexing can be indispensable when a
vessel must be navigated through confined waters during re-
stricted visibility or when executing a critical turn. Also, in
areas with few or unreliable navigational aids, parallel index-
ing can prove decisive to safe navigation.
The first step in setting up a parallel indexing plot is to
examine the nautical chart where the piloting will take
place. Imagine that we wish to follow a track line that
leaves a small island or rock to starboard at a distance of 2
miles off when abeam. The track line course is 045º (see
Figure 2317). If we are able to place an electronic line on
the radar screen bearing 045º-225º at a range of 2 miles to
starboard, all we will have to do when the island comes onto
the radar display is to maneuver the ship to keep the island
on that line which in turn locates (indexes) the vessel on the
track line.
One way to conduct parallel indexing on a modern ra-
dar display is to utilize the Electronic Bearing Line (EBL)
feature. Most radars have the ability to offset the EBL from
the center of the display. This allows it to be used as a single
parallel index line. Once the EBL bearing is set to that of the
vessel's track line, the origin can be floated out to the de-
sired distance tangent to a Variable Range Marker (VRM)
set to that distance.
Modern radar sets are usually fitted with a dedicated
parallel indexing (PI) feature that may take many forms de-
pending on the radar manufacturer, and are easier to use
than the floating EBL. While the details of these PI features
may be quite different, they all have the following in
common:
1. The display of an electronic PI line, wholly or par-
tially across the radar screen
2. The PI line is adjustable in direction (bearing) and
distance (range) from own ship
3. Once set at desired bearing and range, the PI line is
fixed relative to own ship
It is vital that when placing a single PI line on the radar
display, the bearing of the line is set first, then the range. If
done in reverse order, the distance of the PI line from own
ship to target will be less than desired.
The method described above is very basic and utilizes
only a single index line and a single index target. But the
level of sophistication of indexing required varies with the
situation. A passage may call for many lines on different
scales, multiple index targets, margin lines, danger zones
and wheel over points. The more complicated the setup, of
course, the more time and effort on the part of the navigator
is demanded. More complex indexing schemes, however
elegant, also carry a greater risk of error in construction. A
point will be reached where there is little to be gained by an
excessively elaborate setup because it may also lead to a
more cluttered and confusing radar display. A vessel that
Figure 2316. Fix using tangent bearings and range.

RADAR NAVIGATION 397
routinely makes passages through navigationally challeng-
ing waters would be better advised to rely more on the
ECDIS and use a simpler parallel indexing setup on the ra-
dar as a backup and for cross checking.
2318. References
Pecota, S., (2006). Radar Observer Manual, 6th.
Marine Education Textbooks. Section 2317 reprinted with
permission.
Figure 2317. Parallel indexing setup.