chapter 2: implementing strategy: the value chain, …
TRANSCRIPT

Chapter 02 - Implementing Strategy: The Value Chain, the Balanced Scorecard, and the Strategy Map
2-1Copyright © McGraw-Hill Education. All rights reserved. No reproduction or distribution without the prior written consent of McGraw-Hill
Education.
CHAPTER 2: IMPLEMENTING STRATEGY: THE VALUE CHAIN, THE BALANCED SCORECARD, AND THE STRATEGY MAP
QUESTIONS
2-2 Many possible examples would be correct here. Examples offered in chapter 1 include Walmart, Texas Instruments, and HP (Hewlett-Packard).
2-4 The four strategic resources are as follows. First the firm determines the critical success factors using SWOT analysis, and then uses execution to excel on these CSFs. The value chain is used to provide a more detailed understanding of the strategy and CSFs, by activity. Finally, the balanced scorecard is used to monitor and reward achievement of the CSFs and to provide a means for continual feedback to SWOT analysis, for desired changes in the overall strategy.
2-6 SWOT analysis is a systematic procedure for identifying a firm's critical success factors: its internal strengths and weaknesses, and its external opportunities and threats. It is used in the first of the three steps of identifying a competitive strategy.
2-8 Critical success factors are strategic financial and non-financial measures of success. Critical success factors are used to define and measure the means by which a firm achieves a competitive advantage. Strategic cost management involves the development, understanding, and use of critical success factors to manage business firms and other organizations. Examples of CSFs are shown in Exhibits 2.1 and 2.5.
2-10 Several potential critical success factors for a large savings and loan institution might include: 1. Spread between the cost of funds and the earnings on investments and loans 2. Amount of total deposits, number of depositors, number of new offices, number of loans 3. Decrease in loan losses, number of bad loans, losses due to theft and fraud 4. Training hours per employee and employee turnover 5. Customer satisfaction as measured by phone survey or other means
2-12 Several potential critical success factors for a large retail discount store might include: 1. Growth in sales, number of new branch stores 2. Operating costs, by category 3. Customer satisfaction as measured by phone survey or mail survey 4. Identification and introduction of new products 5. Effective promotion and advertising using a variety of media 6. Competitive service policies 7. Identification of attractive store locations

Chapter 02 - Implementing Strategy: The Value Chain, the Balanced Scorecard, and the Strategy Map
2-2Copyright © McGraw-Hill Education. All rights reserved. No reproduction or distribution without the prior written consent of McGraw-Hill
Education.
8. Effective inventory management, both to reduce employee theft and also to reduce waste, overstocking and excessive out-of-stock conditions 9. Choice of merchandise mix, to attract customers
2-14 The balanced scorecard is an accounting report that includes the firm’s critical success factors in four groups or “perspectives”: customer satisfaction, financial performance, internal processes, and learning & growth . The primary objective of the balanced scorecard is to serve as an action plan, a basis for implementing the strategy expressed in the CSFs, by aligning performance of managers and employees with the firm’s strategy.
2-16 Sustainability means the balancing of short- and long-term goals in all three dimensions of the company’s performance – economic, social, and environmental. The concept is used by firms to expand their strategy to include social and environmental as well as economic goals. Some firms that have included sustainability have found that it is also good for profits.
2-18 There are a number of possible examples here. If you have trouble getting a discussion going refer the class to chapter 1 and some of the firms that were discussed there as cost leaders. For example, Walmart, which has the strengths of size, operating efficiency through innovative supply chain, and low cost operations; weaknesses would include the recent negative publicity the firm has had for its labor practices and for the negative economic consequences to competing business in communities where a Walmart is located.
2-20 Perhaps the easiest illustration of value chain analysis is in the manufacturing industry because it is relatively easy for students to visualize the processes and steps that take place in a typical manufacturing plant, from raw materials to assembly and finishing. This is why the examples in the chapter use manufacturers. The auto industry is a good additional example. Ask the class to consider Walmart or Target (as large retailers) and consider the supply chain at Walmart as an example of a very effective value chain.
2-22 This is a potentially great application for value chain analysis. By identifying the two firms’ value chains and then comparing relative strengths and weaknesses across the two value chains, it would be possible to see how the combined firm might be more competitive than the two separate firms. For example, consider the merger of Disney and ABC; the combination brought together a great synergy - one firm (Disney) with great content and the other (ABC) with the media network to distribute it most effectively.
Chapter 02 - Implementing Strategy: The Value Chain, the Balanced Scorecard, and the Strategy Map
2-3Copyright © McGraw-Hill Education. All rights reserved. No reproduction or distribution without the prior written consent of McGraw-Hill
Education.
2-24 To be implemented effectively, the balanced scorecard should:
Have the strong support of top management
Accurately reflect the organization’s strategy
Communicate the organization’s strategy clearly to all managers and employees, who understand and accept the scorecard
Have a process that reviews and modifies the scorecard as the organization’s strategy and resources change
Be linked to reward and compensation systems; managers and employees have clear incentives linked to the scorecard
Include processes for assuring the accuracy and reliability of the information in the scorecard
Ensure that the relevant portions of the scorecard are readily accessible to those responsible for the measures, but that the information is also secure, available only to those authorized to have the information
2-26 1. Commodity producers are likely to compete as cost-leaders because the product is difficult to differentiate. 2. Professional service firms are usually differentiators, as consumers are likely to choose their doctors, lawyers, and accountants, etc., on the basis of proven expertise, licensure, and experience.
BRIEF EXERCISES
2-28 SWOT analysis is a useful tool for
a. evaluating the performance of an organization.
b. identifying the organization’s critical success factors.
c. developing the organization’s strategy map.
d. developing the organization’s value chain.
Answer: b Learning Objective: 02-01 Feedback: Answer b is correct. SWOT analysis is used to develop and implement an organization’s strategy, and the key role played by the SWOT analysis is to help identify the organization’s critical success factors that are then used in the BSC, strategy map, value chain analysis, and other cost management methods such as budgeting and performance evaluation..

Chapter 02 - Implementing Strategy: The Value Chain, the Balanced Scorecard, and the Strategy Map
2-4Copyright © McGraw-Hill Education. All rights reserved. No reproduction or distribution without the prior written consent of McGraw-Hill
Education.
2-30 The balanced scorecard is related to the strategy map in a similar way as
a. the value chain is related to product differentiation.
b. SWOT analysis is related to execution.
c. the organization’s key activities are related to the value chain.
d. sustainability can be related to financial reporting.
Answer c Learning Objective: 02-04 Feedback: Answer c is correct because both provide linkages. The strategy map links the goals in the various BSC perspectives, while the value chain links the activities in the organization
2-32 The implementation of the balanced scorecard (BSC) can involve all of the
following except
a. the strong support of top management.
b. a strategy of differentiation.
c. a link to reward and compensation systems.
d. an accurate reflection of the organization’s strategy.
Answer: b Learning Objective: 02-04 Feedback: The BSC is useful for both cost leader and differentiator companies, and is implemented for both types of companies.
2-34 Opportunities and threats in Strengths-Weaknesses-Opportunities-Threats
(SWOT) analysis can be identified most readily by
a. using value chain analysis
b. analyzing the industry and the organization’s competitors
c. analyzing the organization’s critical success factors
d. using the strategy map
Answer: b Learning Objective: 02-01 Feedback: Opportunities and threats are external to the organization, so the analysis to identify opportunities and threats is to target developments outside the company, that is, to the industry and the organization’s competitors.
Chapter 02 - Implementing Strategy: The Value Chain, the Balanced Scorecard, and the Strategy Map
2-5Copyright © McGraw-Hill Education. All rights reserved. No reproduction or distribution without the prior written consent of McGraw-Hill
Education.
2-36 As opposed to identifying opportunities and threats, identifying a company’s strengths and weaknesses requires all but which of the following:
a. Careful analysis of the company’s sustainability statement b. Analysis of the company’s code of ethics c. Evaluation of the company’s operations, strategy, and management
competence d. Review of the company’s industry and competitive environment
Answer: d Learning Objective: 02-01 Feedback: d) the review of the industry and competitive environment is part of analyzing external opportunities and threats, not internal strengths and weaknesses
2-38 The World Resources Institute (WRI) is an organization that a. provides guidance for developing and benchmarking an organization’s value
chain b. provides resources for organizations that intend to expand globally c. provides guidance for organizations that want to develop indicators (ESGs)
of the environmental component of sustainability d. assists companies in understanding the changing environment of financial
and material resources world-wide
Answer: c Learning Objective: 02-05 Feedback: c) is correct because the mission of the World Resources Institute is to provide indicators of the environmental component of ESGs, in three broad categories. a),b) and d) are incorrect because the World Resource Institute is not directly concerned with the value-chain, the balanced scorecard, or global financial/material resources

Chapter 02 - Implementing Strategy: The Value Chain, the Balanced Scorecard, and the Strategy Map
2-6Copyright © McGraw-Hill Education. All rights reserved. No reproduction or distribution without the prior written consent of McGraw-Hill
Education.
EXERCISES
2-40 Execution; Strategy (20 min)1. The critical aspect of the analysis of this special order is how it will
affect the brand image of Deaine’s clothing. Deaine appears to compete on the basis of product differentiation, that is, its clothing is perceived to be of higher quality, attractiveness, etc. DEI is thus able to sell its clothing in upscale designer clothing retail stores, probably at a premium price. Sale of the same or similar clothing to department stores could dilute the brand image and thus hurt the sales in the upscale retail stores. Customers who are willing to pay the premium to purchase the clothing in the designer stores may not be willing to do so if the same or similar clothing is available in department stores. Thus, while the special order might be very profitable in the short run, in the long run it is potentially very damaging for the company.
The main point of this case, and a pervasive theme of strategic cost management, is that cost analysis from a strategic perspective can often provide a different answer from a cost analysis which has a short-term point of view. In practice, many cost systems have a short-term focus, and the strategic emphasis of strategic cost management is used to bring the firm’s operations and decision making back to consistency with the firm’s strategic objectives.
2. A SWOT analysis would be useful to Joel to help him more thoroughly understand the key critical success factors of his strategy and to therefore help him more effectively implement the strategy. Also, a value chain analysis would help him to understand his overall strategy and the linkages of the critical success factors in a more systematic and detailed manner. A balanced scorecard would provide Joel a means to organize these critical success factors and to regularly measure progress on each of them.

Chapter 02 - Implementing Strategy: The Value Chain, the Balanced Scorecard, and the Strategy Map
2-7Copyright © McGraw-Hill Education. All rights reserved. No reproduction or distribution without the prior written consent of McGraw-Hill
Education.
2-42 Value Chain; Strategy Map; Corporate Alliances (15 min)
Because it specializes only in conducting and analyzing clinical trials for new drugs, Quintiles can perform this activity more efficiently and more effectively than Solvay. This means the two corporations both benefit from the collaboration. Quintiles provides the same service for many other pharmaceutical companies, providing the same joint benefits. The joint benefits arise because the industry value chain for pharmaceutical firms has a step, the testing of new drugs, which can be efficiently and effectively outsourced. Quintiles, founded in Chapel Hill, NC, in 1974, saw the need for testing and analysis services in pharmaceutical companies, and from a single contract in 1974, has grown to a company operating in 60 countries with 22,000 employees. The collaboration between Solvay and Quintiles was a natural fit.
To recognize the importance of this collaboration and to enhance the joint benefits, the two companies developed a joint balanced scorecard and strategy map. The scorecard and strategy map enabled the companies to set jointly-beneficial goals, set targets, and monitor progress toward these targets. The two companies were already using the balanced scorecard, so the concept of extending the scorecard approach to their alliance made sense.
Source: Robert S. Kaplan, David P. Norton, and Bjarne Rugelsjoen, “Managing Alliances with the Balanced Scorecard,” Harvard Business Review, January 2010, pp 114-120.

Chapter 02 - Implementing Strategy: The Value Chain, the Balanced Scorecard, and the Strategy Map
2-8Copyright © McGraw-Hill Education. All rights reserved. No reproduction or distribution without the prior written consent of McGraw-Hill
Education.
2-44 Strategy; Sustainability (15 min)
There are some good reasons to expect this strategy is a good one for both Walmart and for Seventh Generation (SGI). For Walmart, which initiated a “green” strategy in 2005 under CEO Lee Scott, and in 2009 published its first Sustainability Report, working with Seventh Generation will enhance its emphasis on and reputation for sustainability. Offering Seventh Generation products is consistent with the firm’s overall strategy and should help in driving positive customer attitudes as well. Walmart is also likely to be aware that its shoppers are increasingly looking for “green” products, as more consumers are concerned about climate change, so the partnership should produce increased sales and perhaps new customers for Walmart.
Seventh Generation is the big winner here, as its products are now available in the giant retailer’s stores, opening up a significant new access to shoppers for the company. Also, the growing awareness of the commitment of Walmart to sustainability should make the partnership look favorable to Seventh Generation’s customers.
Source: Ellen Byron, “Adversary’s Clean Start with Walmart,” The Wall Street Journal, July 26, 2010, p B9.
Consistent with Walmart’s sustainability strategy, the firm announced in September 2013 that it would no longer accept suppliers’ products that contained certain hazardous chemicals. Source: Wendy Koch, “Wal-Mart Announces Phase-out of Hazardous Chemicals,” USA Today, September 12, 2013.
Chapter 02 - Implementing Strategy: The Value Chain, the Balanced Scorecard, and the Strategy Map
2-9Copyright © McGraw-Hill Education. All rights reserved. No reproduction or distribution without the prior written consent of McGraw-Hill
Education.
PROBLEMS
2-46 Strategy; Health Care (25 min)
1. The Medical University of Greenbelt’s strategy, a differentiation strategy, should encompass a focus on the quality of its clinical care, education, and research. The relative size of the healthcare system is important as a way to attract third party payors, providers, and patients. A large hospital system tends to offer a greater breadth of services, which often increases the clinicians’ level of expertise. A physician at a larger institution will most likely have performed more procedures, i.e. open-heart surgeries, which tends to increase the probability of a favorable patient outcome. The healthcare system’s image to the public is very important. Thus, the University’s marketing and public relations departments are very crucial to its success. It is also essential that the healthcare system stay within its budget in order to continue operations.
2. The balanced scorecard goes beyond simply monitoring financial performance. Because the four areas, financial performance, customer satisfaction, internal processes, and learning and growth have critical success factors which are monitored, management can thus determine how well the firm is attaining its strategic goals based on the measurements of these critical success factors.
The value chain has been applied to the hospital setting by Robert Kaplan and David Norton (“How to Solve the Cost Crisis in Health Care, Harvard Business Review, September 2011, pp 47-64). The authors illustrate how the Care Delivery Value Chain (CDVC) can be used for process improvement and cost reduction at the MD Anderson Head and Neck Center of the MD Anderson Hospital in Houston, Texas. Kaplan and Norton also explain in this article how ABC costing can be used to identify opportunities for cost reduction and process improvement.
Chapter 02 - Implementing Strategy: The Value Chain, the Balanced Scorecard, and the Strategy Map
2-10Copyright © McGraw-Hill Education. All rights reserved. No reproduction or distribution without the prior written consent of McGraw-Hill
Education.
2-46 (continued -1)
3. Financial: operating margin, cost per patient-day, percentage of
overdue patient accounts, sales growth Customer: patient satisfaction, speed of service, number of
referring physicians, measures of patient health (re-admits for complications,…)
Internal Processes: patient complaints, percentage of procedures completed on time, infection rate, mortality rate
Learning & Growth: number of employee hours of training, number of employee suggestions, measures of absenteeism, employee satisfaction
Chapter 02 - Implementing Strategy: The Value Chain, the Balanced Scorecard, and the Strategy Map
2-11Copyright © McGraw-Hill Education. All rights reserved. No reproduction or distribution without the prior written consent of McGraw-Hill
Education.
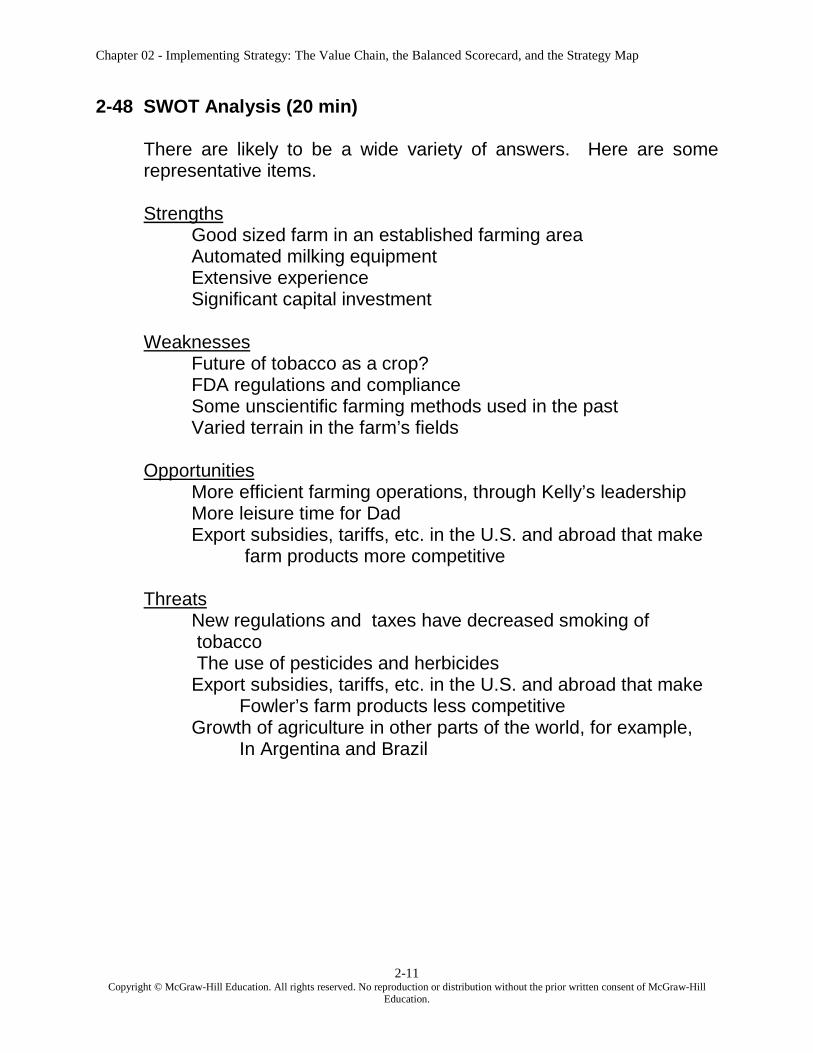
2-48 SWOT Analysis (20 min)
There are likely to be a wide variety of answers. Here are some representative items.
Strengths Good sized farm in an established farming area Automated milking equipment Extensive experience Significant capital investment
Weaknesses Future of tobacco as a crop? FDA regulations and compliance Some unscientific farming methods used in the past Varied terrain in the farm’s fields
Opportunities More efficient farming operations, through Kelly’s leadership More leisure time for Dad Export subsidies, tariffs, etc. in the U.S. and abroad that make
farm products more competitive
Threats New regulations and taxes have decreased smoking of tobacco The use of pesticides and herbicides Export subsidies, tariffs, etc. in the U.S. and abroad that make
Fowler’s farm products less competitive Growth of agriculture in other parts of the world, for example,
In Argentina and Brazil

Chapter 02 - Implementing Strategy: The Value Chain, the Balanced Scorecard, and the Strategy Map
2-12Copyright © McGraw-Hill Education. All rights reserved. No reproduction or distribution without the prior written consent of McGraw-Hill
Education.
2-50 The Balanced Scorecard (20 min)
There are a number of possibilities for determining both the number and types of perspectives for the balanced scorecard and for determining the critical success factors which belong under each perspective. The answer below is representative of a balanced scorecard that would be a good fit for Fowler Farm. This scorecard puts the operations (internal processes) and financial perspectives first, to emphasize their importance to the farm. Note that each of the factors must have a quantitative measure; a concept is appropriate for strategic analysis, but the scorecard is intended to measure progress and performance – it requires a quantitative measure.
Operations (Internal Processes) crop rotation; number of fields in rotation inventory of supplies and parts, by type of equipment, cost
and date purchased weather forecast in degrees relative to normal, days missed,
important weather changes irrigation schedule; % days on schedule fuel used, by type of equipment equipment breakdowns, by type of equipment; cost of
repair, length of time needed for repair
Financial sales; trend in sales monthly earnings trend return on investment; compared to industry average for region cost of materials; fertilizer, fuel, etc. cost of labor; by type of employee prices received for each major product interest cost
Employees turnover of employees; in both number and percent accidents; in number experience; years in farming experience efficiency; hours required for each well-defined task
Chapter 02 - Implementing Strategy: The Value Chain, the Balanced Scorecard, and the Strategy Map
2-13Copyright © McGraw-Hill Education. All rights reserved. No reproduction or distribution without the prior written consent of McGraw-Hill
Education.
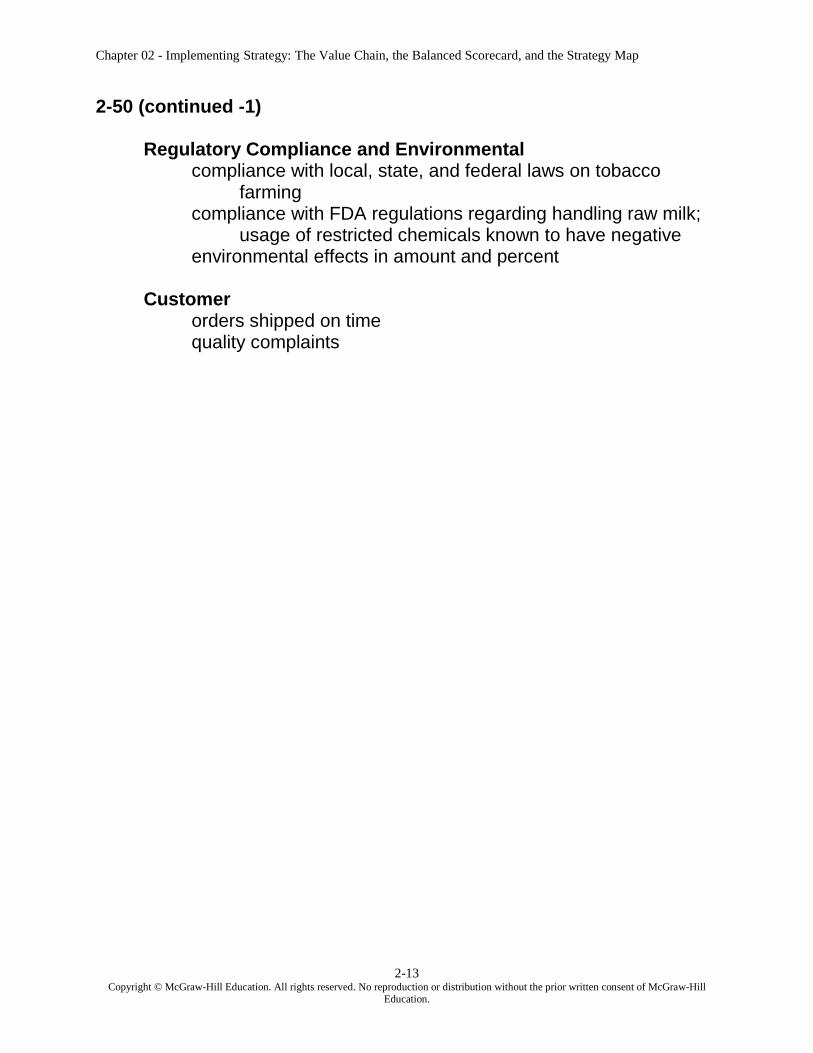
2-50 (continued -1)
Regulatory Compliance and Environmental compliance with local, state, and federal laws on tobacco
farming compliance with FDA regulations regarding handling raw milk;
usage of restricted chemicals known to have negative environmental effects in amount and percent
Customer orders shipped on time quality complaints
Chapter 02 - Implementing Strategy: The Value Chain, the Balanced Scorecard, and the Strategy Map
2-14Copyright © McGraw-Hill Education. All rights reserved. No reproduction or distribution without the prior written consent of McGraw-Hill
Education.
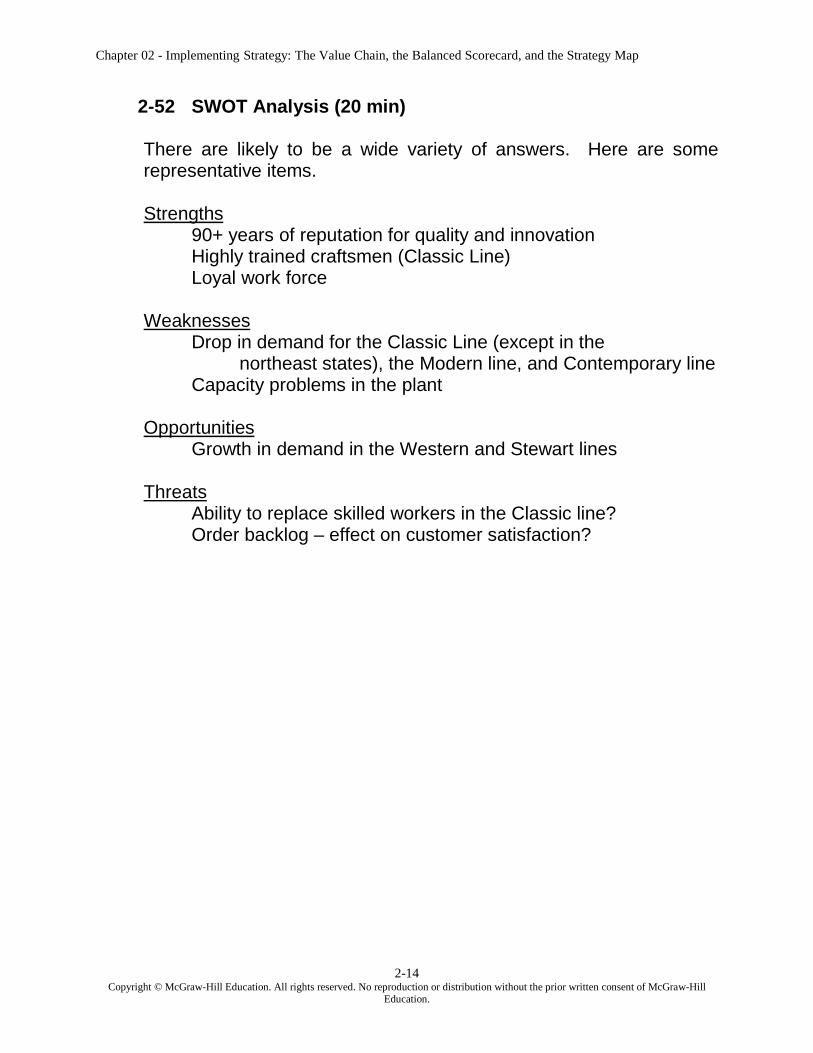
2-52 SWOT Analysis (20 min)
There are likely to be a wide variety of answers. Here are some representative items.
Strengths 90+ years of reputation for quality and innovation Highly trained craftsmen (Classic Line) Loyal work force
Weaknesses Drop in demand for the Classic Line (except in the
northeast states), the Modern line, and Contemporary line Capacity problems in the plant
Opportunities Growth in demand in the Western and Stewart lines
Threats Ability to replace skilled workers in the Classic line? Order backlog – effect on customer satisfaction?

Chapter 02 - Implementing Strategy: The Value Chain, the Balanced Scorecard, and the Strategy Map
2-15Copyright © McGraw-Hill Education. All rights reserved. No reproduction or distribution without the prior written consent of McGraw-Hill
Education.
2-54 The Balanced Scorecard (20 min)
An example of a balanced scorecard for Tartan Corp follows:
Financial Sales, sales growth, by product and region Earnings, as above Activity-based product costs Return on investment, by product line New investment, by product line
Internal Processes Cycle time Waste of materials Rework Productivity measures: hours per product, materials per product Inventory levels
Customer Lead time Retention Satisfaction in specific categories, quality Number of new customers
Employee Training hours Retention Satisfaction as measured by employee survey New product development, as measured by number of new products or enhancements to existing products

Chapter 02 - Implementing Strategy: The Value Chain, the Balanced Scorecard, and the Strategy Map
2-16Copyright © McGraw-Hill Education. All rights reserved. No reproduction or distribution without the prior written consent of McGraw-Hill
Education.
2-56 Strategy Map, Balanced Scorecard; Dell Inc. (25 min)
1. The following BSC was adapted from Peter Brewer, “Putting Strategy into the Balanced Scorecard,” Strategic Finance, January 2002, pp44-52.
Learning and Growth Training dollars per employee Number of emerging technologies evaluated Number of new manufacturing processes developed Number of new manufacturing processes under development
Internal Processes Product manufacturing time Raw materials inventory Order processing time Manufacturing defects
Customer customer perception of order taking convenience and accuracy \ customer retention customer satisfaction with speed of service
Financial Perspective revenue growth gross margin return on investment selling expense to sales ratio
2. Strategy Map for Dell Inc. This is one example of a possible strategy map, that can be inferred from the BSC in part 1 above.

Chapter 02 - Implementing Strategy: The Value Chain, the Balanced Scorecard, and the Strategy Map
2-17Copyright © McGraw-Hill Education. All rights reserved. No reproduction or distribution without the prior written consent of McGraw-Hill
Education.
2-56 (continued -1)
Financial
Customer
Internal Processes
Learning and Growth
Improve order filling time
Improve speed of service
Increase new manufacturing processes
Improve quality
Evaluate emerging technologies
Increase training hours
Revenue growth
Reduce cost for each unit and for each value stream
REturn
Return on
Reduce raw materials inventory
Increase customer retention
Shareholder Value
Sales Growth
Return on Investment
Reduce operating costs and selling expenses
Improve customer perception of order filling

Chapter 02 - Implementing Strategy: The Value Chain, the Balanced Scorecard, and the Strategy Map
2-18Copyright © McGraw-Hill Education. All rights reserved. No reproduction or distribution without the prior written consent of McGraw-Hill
Education.
2-58 Strategic Analysis; The Balanced Scorecard, and Value-Chain Analysis; The Packaging Industry (40-50 min)
1. What is the new competitive strategy for Dana Packaging Company?
a) Cost leadership because of increased competitionb) Differentiation because of niche markets c) Differentiation because of high technology and high qualityd) Cost leadership because of cost pressures in the industry
Answer: c Learning Objective: 01-04, 02-01 Feedback: The description of the company in the question points to differentiation based on innovation, features, and quality. As stated in the question: “The market for Dana’s products has become very competitive in recent years because of the entrance of two large European competitors. In response, Dana has decided to enter new markets where the competition is less severe. The new markets are principally the high end of the packaging business for products that require more technological sophistication and better materials.”
Dana previously competed on the basis of cost leadership, and it was because of increased competitiveness in that part of the business that Dana has shifted to a differentiation strategy.
2. Dana’s strategy had previously been primarily a cost-leadership strategy, but with the new focus on high-end markets, the strategy has changed to differentiation. Can Dana compete as effectively as a differentiator as it can as a cost-leader? The change has required a change in operations, to accommodate the smaller batches and greater number of features added to the product, as noted in the case. The likelihood of success for the strategy depends on the firm’s ability to make the changes effectively. Can the plant be re-oriented to small batch production quickly and efficiently, so that Dana can compete effectively on cost and quality in the new markets? Has Dana done a careful strategic analysis of the new competitors in the new markets? How is competition in these new markets likely to change over the coming months?
Chapter 02 - Implementing Strategy: The Value Chain, the Balanced Scorecard, and the Strategy Map
2-19Copyright © McGraw-Hill Education. All rights reserved. No reproduction or distribution without the prior written consent of McGraw-Hill
Education.
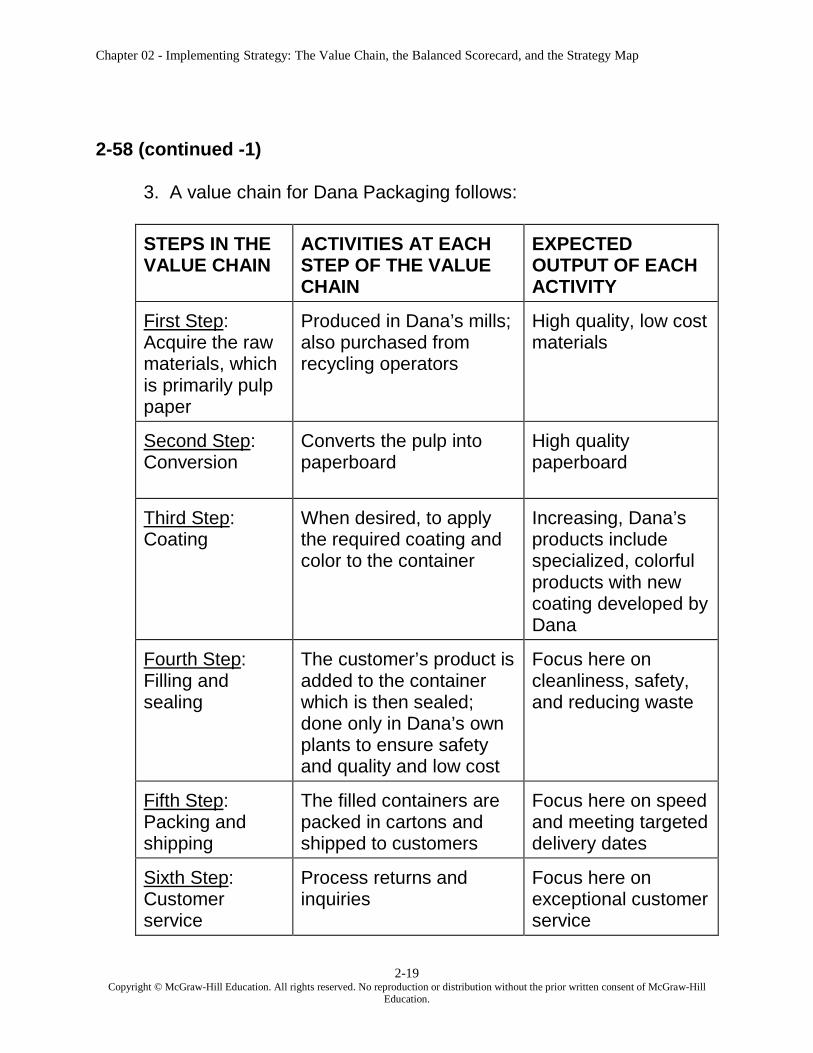
2-58 (continued -1)
3. A value chain for Dana Packaging follows:
STEPS IN THE VALUE CHAIN
ACTIVITIES AT EACH STEP OF THE VALUE CHAIN
EXPECTED OUTPUT OF EACH ACTIVITY
First Step: Acquire the raw materials, which is primarily pulp paper
Produced in Dana’s mills; also purchased from recycling operators
High quality, low cost materials
Second Step: Conversion
Converts the pulp into paperboard
High quality paperboard
Third Step: Coating
When desired, to apply the required coating and color to the container
Increasing, Dana’s products include specialized, colorful products with new coating developed by Dana
Fourth Step: Filling and sealing
The customer’s product is added to the container which is then sealed; done only in Dana’s own plants to ensure safety and quality and low cost
Focus here on cleanliness, safety, and reducing waste
Fifth Step: Packing and shipping
The filled containers are packed in cartons and shipped to customers
Focus here on speed and meeting targeted delivery dates
Sixth Step: Customer service
Process returns and inquiries
Focus here on exceptional customer service

Chapter 02 - Implementing Strategy: The Value Chain, the Balanced Scorecard, and the Strategy Map
2-20Copyright © McGraw-Hill Education. All rights reserved. No reproduction or distribution without the prior written consent of McGraw-Hill
Education.
2-58 (continued -2)
There are a number of opportunities for cost reduction/value enhancement. The value-chain analysis should motivate and facilitate make-or-buy types of analysis for each of the firm’s internal activities. Outsource activities which might be more cheaply and efficiently done outside the company; for example, the coating process (which is now occasionally outsourced) might be effectively outsourced to a greater extent or entirely. The filling process is the most critical for Dana, as it is the step where the customer’s product is handled. For strategic reasons, then, Dana should retain the filling process entirely within its direct control.
For each activity at each step of the value chain, determine the outside price for the activity, and use this as a benchmark for identifying activities which need improvement.
Develop similar value chains for all key competitors, and compare each of these to Dana’s to identify how Dana fits in the competition in the industry. This should reveal competitive weaknesses and strengths, and perhaps opportunities for improvement.
Use the value chain to evaluate vendor relationships; are any suppliers causing internal processing problems because of quality problems or late delivery, etc.?
Use the value chain to identify the key cost drivers in the business; for example, it is likely that costs in the coating activity have increased significantly because of Dana’s move into the more colorful and innovative types of packaging. Has the manufacturing process been changed to facilitate the increase in setups and product variety? It is likely that the firm will have to consider adding new production equipment, which will enable it to better handle the increased product complexity and variety. Are products being properly costed; do the more complex products bear the appropriate cost of their complexity? For example, if adding multiple colors to packaging material is very costly to manufacture, then the pricing should be higher to recapture these costs.
Chapter 02 - Implementing Strategy: The Value Chain, the Balanced Scorecard, and the Strategy Map
2-21Copyright © McGraw-Hill Education. All rights reserved. No reproduction or distribution without the prior written consent of McGraw-Hill
Education.
2-58 (continued -3)
Identify those customers for which the cost of service and delivery is unusually high due to the care with which the material must be handled or to the weight, or distance, etc. Make sure that these costs are recaptured in the pricing of the products, or alternatively, the firm might seek more profitable customers.
4. Critical Success Factors for Dana might include: Financial:
Profit by product line Cost by product and production run Cost by type; by month Standard cost variances
Customer Satisfaction: Ship dates met/ un-met Survey of customer satisfaction Log of complaints and compliments
Internal Business Processes: Quality defects per million produced Cycle time Production run time
Learning and Growth: Training hours Productivity (learning) changes Number of new features/products developed

Chapter 02 - Implementing Strategy: The Value Chain, the Balanced Scorecard, and the Strategy Map
2-22Copyright © McGraw-Hill Education. All rights reserved. No reproduction or distribution without the prior written consent of McGraw-Hill
Education.
2-60 Economic Nationalism; Strategy; Global; Value Chain (40-50 min)
1. All three of these companies are best described as differentiators because of the uniqueness of their products, and in the case of Harley-Davidson at least, the strength of its brand. It is likely that Harley-Davidson faces some cost pressure because of the strong competition in bikes from Japanese manufacturers, but on the other hand, Harley has been able to meet this competition successfully over the years by innovative products and programs (see for example problem 2-64). The companies’ decision to locate overseas or to relocate to the U.S. is explained in the text of the problem. In each of these three cases, it appears that the location decision is clearly in line with the company’s strategy. For Harley-Davidson, the goal of the Thailand project is to expand the reach of the brand, and it does not appear that the move will affect the differentiation of the brand in the U.S. or abroad. In the case of GAM Enterprises, the decision to relocate to the U.S. will not likely affect the uniqueness of its products and therefore unlikely to affect its strategy. It is the uniqueness of the company’s products that is the source of its competitive advantage. In the case of MO, it appears the firm is looking to find the best manufacturer for its product, home or abroad, and the decision to go abroad for the best manufacturer is likely only to increase the value of the brand.
2. For Harley-Davidson, the location of a plant in Thailand radically affects the downstream portion of the HD value chain as it relates to sales in Asia. This move will reduce tariffs and probably also other costs such as transportation, and therefore reduce the price of the bikes in southeast Asia, making them more competitive with local producers, such as Hero (made in India).
For GAM, the relocation to the U.S. is likely to improve the downstream portion of the value chain as it relates to customer service; GAM will now be closer to many customers. It may also help out downstream by making it easier to attract new customers in the U.S. It is not clear whether the move will improve the upstream portion of the firm’s value chain since we do not know what amount of research and development and materials sourcing is facilitated by location in Germany versus the U.S.
Chapter 02 - Implementing Strategy: The Value Chain, the Balanced Scorecard, and the Strategy Map
2-23Copyright © McGraw-Hill Education. All rights reserved. No reproduction or distribution without the prior written consent of McGraw-Hill
Education.
2-60 (continued -1)
For Mobile Outfitters, the move offshore for the product they needed will likely complicate the upstream value chain as it relates to dealing with the transportation, contracting, and foreign currency fluctuation issues related to foreign sourcing of product. This means there might be added costs for transportation, for hedging foreign exchange risk, etc.
Note: the coverage of global issues, as in this problem, is not comprehensive without the consideration of key issues in the decision to locate locally or in a foreign country. These issues include (among others) concerns about taxation in the different countries, the stability of exchange rates for the foreign country (volatility in the exchange rate would present problems in managing exchange rate risk), the political stability of the country (change for expropriation, or special fees, duties, or other regulations…), transportation availability and cost, presence (or not) of meaningful local markets, the nature of the firm’s value chain, etc. Auto manufacturers are likely to subcontract for parts and assemblies of the auto from different countries, where there is a competitive advantage to cost and perhaps also design. Manufacturers such as Nike or Apple will likely continue to outsource all manufacturing to foreign contract manufacturers because of the cost advantage. Food processors will likely rely on local supply or well-established foreign suppliers.
Source: “An Overseas Kick-Start,” Neil Gough, The New York Times, May 24, 2017, pB1; “Firms Struggle to Bring Jobs Back,” Ruth Simon and Vipal Monga, The Wall Street Journal, April 15, 2017, p B4.
Note regarding Apple: Apple’s CEO recently (May 3, 2017) indicated the firm’s interest in bringing some manufacturing back to the U.S. The firm pledged $1B to an “advanced” manufacturing initiative that would return some manufacturing back to the U.S. It is not known how many jobs this initiative might create. http://www.cnbc.com/2017/05/03/exclusive-apple-just-promised-to-give-us-manufacturing-a-1-billion-boost.html
Chapter 02 - Implementing Strategy: The Value Chain, the Balanced Scorecard, and the Strategy Map
2-24Copyright © McGraw-Hill Education. All rights reserved. No reproduction or distribution without the prior written consent of McGraw-Hill
Education.
Chapter 02 - Implementing Strategy: The Value Chain, the Balanced Scorecard, and the Strategy Map
2-25Copyright © McGraw-Hill Education. All rights reserved. No reproduction or distribution without the prior written consent of McGraw-Hill
Education.
2-62 Balanced Scorecard; Strategy: Food Ingredients Company (20 min)
Answers will vary. A key point to be made in the discussion is that a food ingredients company, of the type described (though with limited information,is likely to be a cost leader. The products are commodities for the most part. Some students will observe that certain types of food, or certain restaurants, etc., are for the gourmet and very expensive customers/markets. However, the BSC shown in this problem seems to best describe a cost leadership type of company. Note the emphasis on growth, an indication of a commodity company that must emphasize volume for profitability. Also, the financial perspective is shown first, a further indication of the importance of sales volume, cost reduction and profitability for the business
Source: Chee W. Chow, Kamal M. Haddad, and James W. Williamson, “Applying the Balanced Scorecard to Small Companies,” Management Accounting, August 1997, pp. 21–27.
Chapter 02 - Implementing Strategy: The Value Chain, the Balanced Scorecard, and the Strategy Map
2-26Copyright © McGraw-Hill Education. All rights reserved. No reproduction or distribution without the prior written consent of McGraw-Hill
Education.
2-64 Value Chain; Harley-Davidson (15 min)
The Riding Academy program fits best near the end of Harley-Davidson’s value chain, near to the customer (http://www.harley-davidson.com/content/h-d/en_US/home/learn-to-ride/new-rider-course.html). In this program the firm provides a customer service that is unique in the industry and potentially an important way to attract new customers. Moreover, the program can be an important new source of income for Harley-Davidson. As new riders, and perhaps some of the veterans, find they can improve their cycling skills, the program could become a popular and a significant source of new income for the firm.
The women’s program fits both the upstream and downstream ends of the HD value chain. The program involves both a design approach to develop a product for women and also a customer service effort involving the magazine and other programs directed to increase the interest of women in the product.
Both programs fit the HD strategy of broadening its customer base beyond the loyal but dwindling HD customer base.
Another aspect of value chain for HD is its financing unit. As for many manufacturers, including the auto companies, General Electric, and the large software firms such as Oracle, Harley-Davidson has a finance unit that finances the sale of its motorcycles for many of its customers.
Note: HD has recently simplified its downstream value chain. HD once owned a 98% share of Buell Motorcyle, a company known for its high-end and successful racing cycles. HD divested the Buell brand in 2009 to focus on its main brand after the recession of 2007-2008 caused motorcycle sales to drop by more than 50%. In the summer of 2013 Buell partnered with the Indian company, Hero MotoCorp, to design low-cost bikes for the Indian market where price and durability are key. The Buell-Hero partnership was undone by bankruptcy in 2015. Buell and Hero at one time could have been described as extensions (downstream) of HD’s value chain. Now HD is planning to expand its downstream value chain by building factories in Asia to support the growing market for bikes in those countries (see problem 2-60).

Chapter 02 - Implementing Strategy: The Value Chain, the Balanced Scorecard, and the Strategy Map
2-27Copyright © McGraw-Hill Education. All rights reserved. No reproduction or distribution without the prior written consent of McGraw-Hill
Education.
2-64 (continued -1)
Source: James R. Hagerty, “Harley, With Macho Intact, Tries to Court More Women,” The Wall Street Journal, October 31, 2011, p B1’ “Harley Shows Its Feminine Side,” Bloomberg Businessweek, October 4, 2010, p 25; James R. Hagerty, “Harley Roars On U.S. Rebound,” The Wall Street Journal, July 20, 2011, p B4; Kyle Stock, “Can Harley-Davidson Finally Woo Women?” Businessweek.com, June 2, 2014. “An Overseas Kick-Start,” Neil Gough, The New York Times, May 24, 2017, pB1.
Chapter 02 - Implementing Strategy: The Value Chain, the Balanced Scorecard, and the Strategy Map
2-28Copyright © McGraw-Hill Education. All rights reserved. No reproduction or distribution without the prior written consent of McGraw-Hill
Education.
2-66 Value Chain(10 min)
The value chain for the Asda jeans, as described, is a three step process, beginning with manufacturing in Bangladesh and then shipping from Bangladesh to the UK, and then presentation and sale in the Asda store. A manager would consider how to improve quality and reduce cost throughout the value chain, perhaps by resourcing the manufacturing to reduce shipping costs or reducing in-store selling costs. Another approach might be to add cost and add value through a redesign of the jean. For example, Levi Strauss has developed a jean that requires much less water to produce. Called the Waste-Less jean, this product has a much reduced environmental impact relative to other jeans.
Note the Real World Focus item regarding sustainability at Patagona in the text of the chapter.
The role of the value chain is to provide a basis for identifying where in the life cycle of the product it might be possible to reduce cost, increase value, or become more competitive. It is pretty clear from the example that the downstream activities of shipping and sales together generate the greatest cost. Do they also generate the greatest value?
Source: “Correlations: Perilous Arithmetic,” Bloomberg Businessweek, June 10, 2013, p 25; Susan Berfield, “Levi’s Has a New Color for Blue Jeans: Green,” Bloomberg Businessweek, October 22, 2012, pp 26-28.

Chapter 02 - Implementing Strategy: The Value Chain, the Balanced Scorecard, and the Strategy Map
2-29Copyright © McGraw-Hill Education. All rights reserved. No reproduction or distribution without the prior written consent of McGraw-Hill
Education.
2-68 Follow up to Problem 2-67; Value Chain for Financing Auto Purchases (30 min)
See below for the steps in the value chain for obtaining a loan for a car purchase. This is a short example, and other variations would be acceptable. Emphasize the importance of both speed and comprehensive analysis in this process. Speed is necessary to compete effectively for the loan with other financial institutions, and is desirable for the auto dealer, a related party in the transaction. Also, the comprehensive analysis is necessary to avoid the risk of loan default and therefore loan losses in the coming months and years; make sure the applicant is credit worthy.
Steps in the Value Chain
Description of the step
Receive application
Log in the application and file it appropriately into the loan application database
Research credit Research the credit worthiness of the applicant by using the FICO® score produced by Fair Issac Corp. or by using one of the credit reporting systems - Experian, Equifax or TransUnion -- the three national credit bureaus that maintain and sell credit reports and profiles.
Evaluate credit Determine whether the credit score determined in the above step meets the criteria for granting a loan of the type and terms (number of years, amount of down payment,…) requested by the borrower
Respond to the applicant
If credit is OK, inform the applicant and begin the process of disbursing the loan amount and creating the loan documents; If credit is not OK, inform the applicant and indicate what is lacking; encourage the applicant to reapply when conditions are changed, if appropriate. The following assumes the loan has been approved:
Prepare loan documents
Usually from the software system used to log in and maintain the applicant’s information
Prepare cashier’s check made out to auto dealer
Use careful cash controls in this step to avoid employee fraud
Deliver loan documents and cashier check to auto dealer
Make sure loan documents are properly signed, dated, and returned promptly to the finance office.
Note (re: problem 2-67), the same value chain shown above for the auto industry would also be applicable to the finance function in the boating industry.
Chapter 02 - Implementing Strategy: The Value Chain, the Balanced Scorecard, and the Strategy Map
2-30Copyright © McGraw-Hill Education. All rights reserved. No reproduction or distribution without the prior written consent of McGraw-Hill
Education.
2-70 Value Chain; Innovation (30 min)
1. Disruptive innovation changes completely the nature of the market or business. Examples include the iPhone or iPad. Sustaining innovation involves significant improvements in existing products and services. Sustaining innovation could involve added features, improved quality, lower cost, etc.
2. The five value chain activities mentioned in the article are: a. Market analysis b. Product development and design c. Sales and marketing d. Procurement, production, and distribution e. After-sale customer service
The five activities are broadly representative of many organizations, especially manufacturers. It could be readily adapted to apply more specifically to a service organization, by for example replacing “Product Development and Design” with “Assess Current and Potential New Services,” and replacing “Procurement, Production and Distribution,” with “Operations.”
3. While not mentioned in the article, strategy plays a key role in the review of the activities for opportunities for innovation. Depending on the firm’s strategy, cost leadership or differentiation, the management accountant will find that some of the activities will be more or less important in innovation. For example, a company that succeeds on differentiation will likely spend more effort on innovation in the market analysis and product development activities. In contrast, a firm that succeeds on cost leadership will likely spend more effort to innovate in the operations areas–procurement, production, and distribution.
4. Innovation in the market analysis activity can be attained by surveying customers to determine how they are using the product or service, what features or services they value or do not value, etc. A technique called Maximum Difference Scaling (MaxDiff) can be used to determine which product or service features are most important.
5. Innovation in the product development and design activity can be aided by encouraging everyone in the company to consider and provide their own ideas. Also, strategic alliances and joint ventures with other companies can help broaden the reach of the company’s own R&D efforts.
Chapter 02 - Implementing Strategy: The Value Chain, the Balanced Scorecard, and the Strategy Map
2-31Copyright © McGraw-Hill Education. All rights reserved. No reproduction or distribution without the prior written consent of McGraw-Hill
Education.
2-70 (continued -1)
6. Innovation in sales and marketing might use, for example, integrated marketing efforts in which the firm partners with media firms or the firm uses social media to help the company market its products and services. The key is to think “out of the box” about how to get the message out about the firm’s products and services. This might include such ideas as iPhone apps, web sites, and the use of predictive analytics and business analytics (see chapter 8).
7. Innovation in procurement, production, and distribution is an area wherein many firms can benefit significantly from innovation, particularly for manufacturing and retail firms for which much of the value-added activities occur in the production-distribution activity. The opportunities here are potentially very large, with lean manufacturing, use of technology, sustainability, and product and business process improvement some of the techniques commonly used.
8. Innovation in the after-sale customer service activity could also benefit from the application of web-based resources and business intelligence techniques. The idea is to extend the company’s ability to identify and react to customer needs quickly and cost effectively.

Chapter 02 - Implementing Strategy: The Value Chain, the Balanced Scorecard, and the Strategy Map
2-32Copyright © McGraw-Hill Education. All rights reserved. No reproduction or distribution without the prior written consent of McGraw-Hill
Education.
2-72 Sustainability; The Balanced Scorecard (30 min)
1. The three options are: a. Adding a fifth perspective to the BSC b. Developing a separate sustainability balanced scorecard c. Integrating the measures throughout the four perspectives:
financial, customer, internal processes, and learning and growth.
As noted in the chapter, all of these are common. Nike and Ford Motor use a combination of (b) and (c), while Shell and Exxon-Mobil use (b), and many software vendors such as SAS and Oracle offer software that provides either (a), (b), or (c). The article notes that approach (a) might not provide the amount of visibility for sustainability efforts that firms such as Ford, Shell, and Nike are looking for. So for these firms, a separate scorecard is more desirable. For other firms that wish to show a comprehensive single BSC, approach (a) works well since it puts all of the firms’ goals in a single, comprehensive system.
2. The seven BSC measurement selection considerations for a sustainability scorecard are:
a. There is an underlying objective for the measurement. That is, the measure reflects an important goal for the company.
b. Measurement terminology is defined and used consistently throughout the organization. This step provides the needed comparability, so that measures from different units within the firm can be compared usefully.
c. Information needed for the measurement is obtainable. This consideration makes it clear that the BSC requires a quantitative metric, not a qualitative statement. Moreover, the measures should be reliable and produced from a system that can be audited to insure the accuracy of the information.
d. The measurement will create behavior that is in agreement with the organizational goals and objectives. This means that the measures are chosen based upon the strategy, goals, and objectives of the firm. As for other elements of the BSC, all of the sustainability measures can be linked to strategy and goals.

Chapter 02 - Implementing Strategy: The Value Chain, the Balanced Scorecard, and the Strategy Map
2-33Copyright © McGraw-Hill Education. All rights reserved. No reproduction or distribution without the prior written consent of McGraw-Hill
Education.
2-72 (continued -1)
e. While there will likely be a combination of lagging and leading indicators, leading indicators are more appropriate to help predict how the organization will perform in the future. Likely a firm will choose to use a combination of both leading and lagging indicators.
f. The measurements should be used to track performance trends. The comparisons can be both trends, and where appropriate, comparisons across units within the firm.
g. Appropriate benchmarks and targets are set.

Chapter 02 - Implementing Strategy: The Value Chain, the Balanced Scorecard, and the Strategy Map
2-34Copyright © McGraw-Hill Education. All rights reserved. No reproduction or distribution without the prior written consent of McGraw-Hill
Education.
2-74 Sustainability (15-25 min)
This question is best used for class discussion. The issue is how the management accountant can help to make renewable energy accessible to smaller firms that cannot afford the investment in solar panels or wind turbines. If the smaller companies cannot adopt cheap renewable energy, it will slow the growth of renewable energy generally.
I would start by asking the class to identify the obstacles that smaller companies face in adopting renewable energy. If the points are slow in coming, then I would start with one or two of my own examples,. I would write them down on the board or overhead as you list them. Here are some possible items:
The cost of investment in the solar panels and turbines can be quite high, requiring energy providers to seek very long term contracts to cover the investment.
Regulations at the local or state level might hinder some smaller firms from making an investment, for example, regulations that require large buffers between the solar panels and certain buildings.
Regulations at the federal level might hinder some smaller firms from making an investment, http://www.nrel.gov/docs/fy16osti/66724.pdf
State and local governments can differ significantly on the nature of the incentive for renewable energy that they might offer, https://energy.gov/eere/solarpoweringamerica/database-state-incentives-renewables-efficiency
Then I would look at each item with the class and determine how the management accountant might work to remove these obstacles. For example:
Chapter 02 - Implementing Strategy: The Value Chain, the Balanced Scorecard, and the Strategy Map
2-35Copyright © McGraw-Hill Education. All rights reserved. No reproduction or distribution without the prior written consent of McGraw-Hill
Education.
2-74 (continued -1)
The main job of the management accountant is to develop and analyze cost and other information to assist management in achieving its strategy, so that a good starting place would be to clarify the firm’s strategy and how renewable energy fits that strategy. For many smaller firms, it is likely to be a combination of expected cost savings and the potential benefit to the firm’s reputation, as well as other factors.
Relative to the cost of investment, one piece of good news is that not only is the cost of renewable energy falling, but the required investment is also falling, as the cost of solar panels and other renewable energy sources is coming down. This means that the companies who are preparing the solar panels for wider use will be able to accept shorter term contracts, which would be more attractive to smaller firms.
Relative to the cost of investment, consider how your company might be able to partner with other organizations to invest in and share the renewable energy resources
Look for ways to partner with other firms to work with legislatures to improve regulations so that the regulations are more supportive of renewable energy for smaller companies
Join joint ventures with other firms, both large and small, to promote renewable energy in the company’s area
Source: “Why It’s Mainly Big Companies Buying Green Power,” Brian Baskin, The Wall Street Journal, May 22, 2017, p R3.

Chapter 02 - Implementing Strategy: The Value Chain, the Balanced Scorecard, and the Strategy Map
© 2019 by McGraw-Hill Education. This is proprietary material solely for authorized instructor use. Not authorized for sale or distribution in any manner. This document may not be copied, scanned, duplicated, forwarded, distributed, or posted on a website, in whole or part.
2-1
Chapter 2 Implementing Strategy: The Value Chain, the Balanced Scorecard, and the
Strategy Map
Learning Objectives
1. Explain how to implement a competitive strategy by using Strengths-Weaknesses-Opportunities-Threats (SWOT) Analysis
2. Explain how to implement a competitive strategy by focusing on the execution of goals. 3. Explain how to implement a competitive strategy using value-chain analysis. 4. Explain how to implement a competitive strategy using the balanced scorecard and strategy map. 5. Explain how to expand the balanced scorecard by integrating sustainability.
New in this Edition
Real World Focus items are revised and updated, particularly the item on the currency fluctuation; real world information throughout the chapter is revised for current information
Sustainability section updated for latest on Paris Agreement Section on Execution updated for changes in Baldrige Award program Updated Cost Management in Action item on strategy – Apple vs. Samsung Seventeen Exercises and Problems revised or updated, and three new problems.
Teaching Suggestions
This chapter is unique, and is not included in most cost and management accounting textbooks. Because of the importance of the strategic theme of the book, this entire chapter is devoted to developing the three key areas of strategy implementation. The chapter follows the introduction to strategy in chapter 1, which we view as a foundational topic, as is ethics, and is thus included in the first chapter. Chapter two develops the strategic emphasis by explaining the methods in which it is implemented in organizations.
1) strategy execution, including the development of critical success factors and SWOT (strengths, weaknesses, opportunities, threats) analysis.
2) the value chain, this chapter takes the perspective of the industry-level value chain, as explained by John Shank in a number of his publications, in contrast to the firm-level concept as developed by Michael Porter. Shank’s concept has greater generality and is more useful for cost management.
3) the balanced scorecard, a concept developed by Robert Kaplan and David Norton, which includes nonfinancial as well as financial data in providing a broad, balanced evaluation of the firm and its managers.
4) Sustainability, the adaptation of the balanced scorecard or the development of an independent scorecard to measure the organization’s effectiveness in achieving social and environmental goals as well as financial goals.
Chapter 02 - Implementing Strategy: The Value Chain, the Balanced Scorecard, and the Strategy Map
© 2019 by McGraw-Hill Education. This is proprietary material solely for authorized instructor use. Not authorized for sale or distribution in any manner. This document may not be copied, scanned, duplicated, forwarded, distributed, or posted on a website, in whole or part.
2-2
For the value chain. I pick a simple example and show it on the board or transparency. Then I ask the class to help develop a value chain for a similar type of firm. Some students will at first find the concept of the value chain too vague, and they are concerned how they will do homework problems and/or exam questions. For this reason, I try to emphasize simple and familiar examples at first, for example, student organizations or the student book store. Also, I emphasize the use of value chains more so than the development of value chains. I do not require the students to complete a value chain on an exam, though I have presented a completed value chain and asked for their interpretation of itwhat it suggests about how the firm can increase value for the customer or streamline operations and reduce cost.
The balanced scorecard is best presented by example, and is usually very quickly understood by the students. Occasionally, I have added to this discussion the use of a case, such as the Analog Devices case (Robert Kaplan, Harvard Business School). I also find useful the article by Chow, Haddad, and Williamson, “Applying the Balanced Scorecard to Small Companies” (Management Accounting, August 1997, pp 21-27). The article shows the balanced scorecards for four different firms. The article gives me a way to lead a class discussion on both (1) how the scorecard reflects the firm’s competitive strategy, and (2) how the scorecard differs among firms and industries.
An important point to convey in this chapter is that cost management must be based on a strategic competitive assessment of the firm. That is, in order to develop effective cost management methods, it is necessary to know how the firm competes, and how it is successful. The methods to be developed will depend on this. If the firm is a cost leadership competitor, the choice of cost management methods will be different than if the firm is a differentiator.
A related point is that the students must understand at this point that what they will see later in the course, whether it be the master budget, the flexible budget, or productivity analysis, etc, must be viewed within the context of how it helps the firm advance its strategy and become more successful. None of the topics are covered simply because this topic or method is used in practice. Rather, each topic is considered from the standpoint: how will this method help the firm succeed?
Chapter 02 - Implementing Strategy: The Value Chain, the Balanced Scorecard, and the Strategy Map
© 2019 by McGraw-Hill Education. This is proprietary material solely for authorized instructor use. Not authorized for sale or distribution in any manner. This document may not be copied, scanned, duplicated, forwarded, distributed, or posted on a website, in whole or part.
2-3
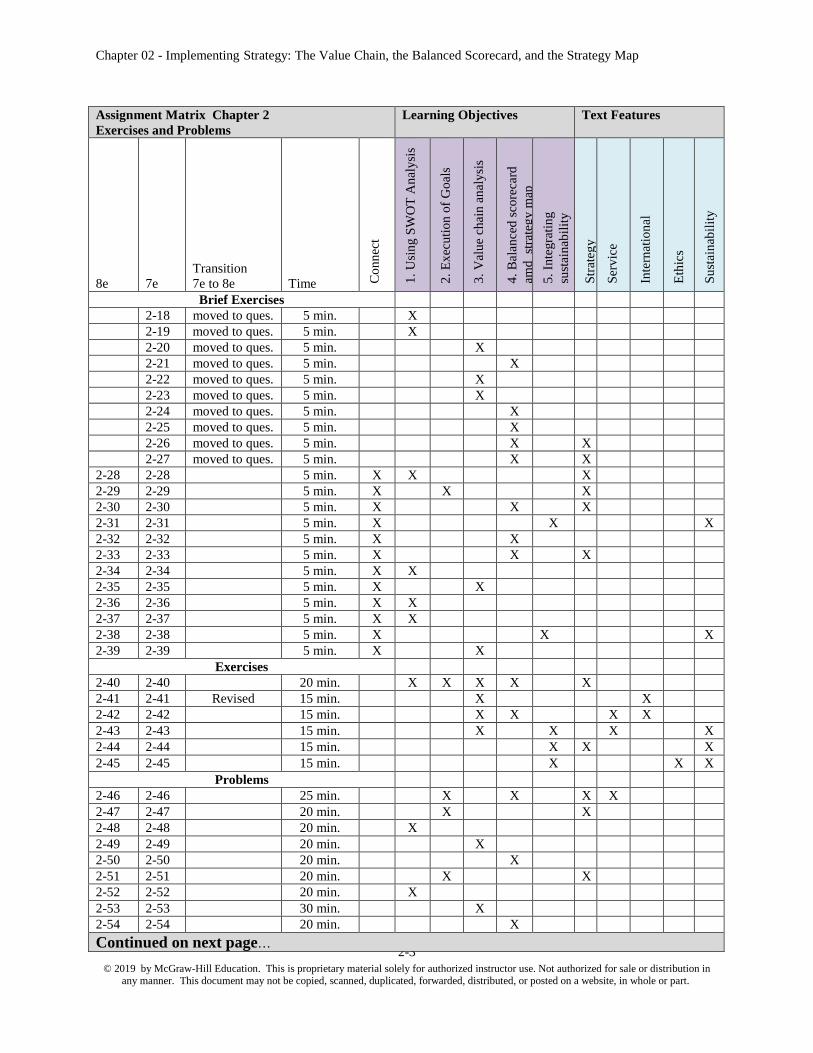
Assignment Matrix Chapter 2 Exercises and Problems
Learning Objectives Text Features
8e 7e Transition 7e to 8e Time C
on
nec
t
1.
Usi
ng
SW
OT
An
aly
sis
2.
Ex
ecu
tion
of
Go
als
3.
Val
ue
chai
n an
aly
sis
4.
Bal
ance
d s
core
card
amd
st
rate
gy
map
5.
Inte
grat
ing
su
stai
nab
ilit
y
Str
ateg
y
Ser
vic
e
Inte
rnat
ion
al
Eth
ics
Su
stai
nab
ilit
y
Brief Exercises 2-18 moved to ques. 5 min. X 2-19 moved to ques. 5 min. X 2-20 moved to ques. 5 min. X 2-21 moved to ques. 5 min. X 2-22 moved to ques. 5 min. X 2-23 moved to ques. 5 min. X 2-24 moved to ques. 5 min. X 2-25 moved to ques. 5 min. X 2-26 moved to ques. 5 min. X X2-27 moved to ques. 5 min. X X
2-28 2-28 5 min. X X X2-29 2-29 5 min. X X X2-30 2-30 5 min. X X X2-31 2-31 5 min. X X X 2-32 2-32 5 min. X X 2-33 2-33 5 min. X X X2-34 2-34 5 min. X X 2-35 2-35 5 min. X X 2-36 2-36 5 min. X X 2-37 2-37 5 min. X X 2-38 2-38 5 min. X X X 2-39 2-39 5 min. X X
Exercises 2-40 2-40 20 min. X X X X X2-41 2-41 Revised 15 min. X X 2-42 2-42 15 min. X X X X 2-43 2-43 15 min. X X X X 2-44 2-44 15 min. X X X 2-45 2-45 15 min. X X X
Problems 2-46 2-46 25 min. X X X X 2-47 2-47 20 min. X X2-48 2-48 20 min. X 2-49 2-49 20 min. X 2-50 2-50 20 min. X 2-51 2-51 20 min. X X2-52 2-52 20 min. X 2-53 2-53 30 min. X 2-54 2-54 20 min. X
Continued on next page…
Chapter 02 - Implementing Strategy: The Value Chain, the Balanced Scorecard, and the Strategy Map
© 2019 by McGraw-Hill Education. This is proprietary material solely for authorized instructor use. Not authorized for sale or distribution in any manner. This document may not be copied, scanned, duplicated, forwarded, distributed, or posted on a website, in whole or part.
2-4
Lecture Notes
A. How a Firm Succeeds: The Competitive Strategy. It is useful to reinforce in chapter two the basic concepts of strategy, using the Michael Porter framework introduced in chapter 1. A firm succeeds by finding a sustainable strategy, which is a set of policies, procedures, and approaches to business to produce long-term success. Finding a strategy begins with determining the purpose, long-range direction, and mission of the company. The mission statement is developed into specific performance objectives, which are then implemented by specific corporate actions. Firms are beginning to use cost management in a new management-facilitating role, in order to support their strategic goals. A modern cost accounting system must be more dynamic than before, to deal with the rapidly changing environment.
Strategic Measures of Success. The strategic cost management system develops both financial and non-financial strategic information. The financial measures (like earnings and cash flow) show the impact of the firm’s policies on the firm’s current financial position. Conversely, nonfinancial factors (such as market share and customer satisfaction) show the firm’s current and potential competitive position. Strategic financial and nonfinancial measures of success are commonly called critical success factors (CSFs).
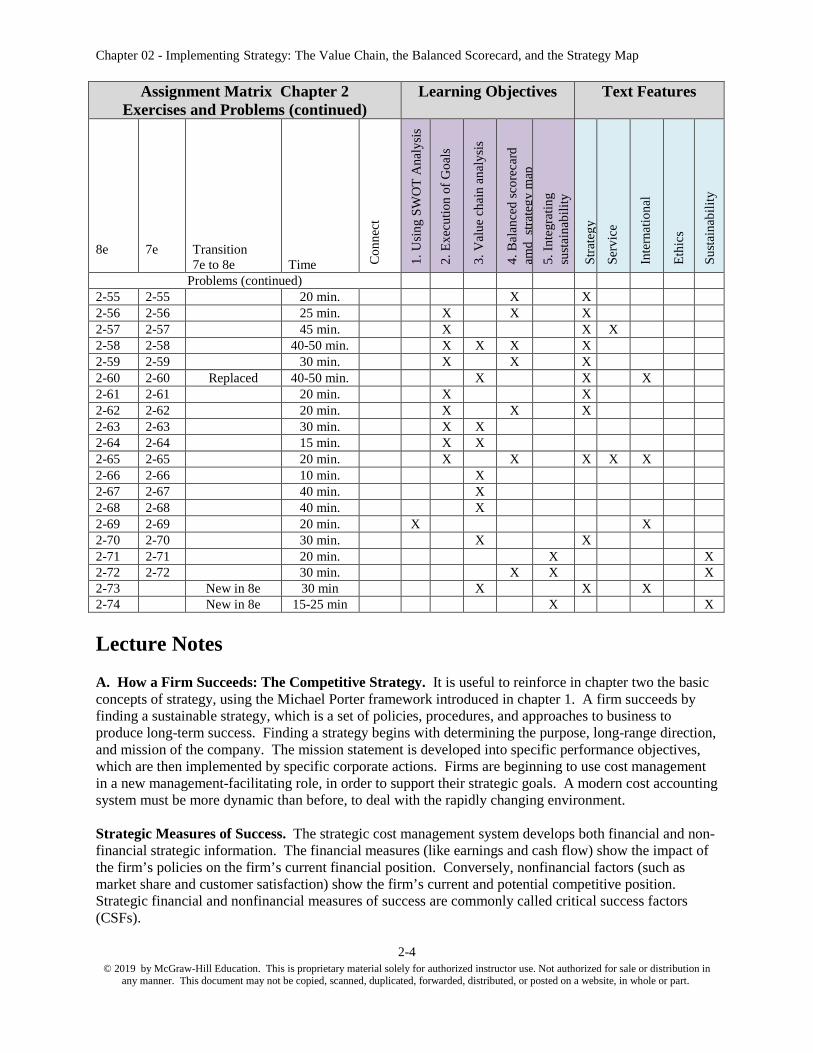
Assignment Matrix Chapter 2 Exercises and Problems (continued)
Learning Objectives Text Features
8e 7e Transition 7e to 8e Time C
on
nec
t
1.
Usi
ng
SW
OT
An
aly
sis
2.
Ex
ecu
tion
of
Go
als
3.
Val
ue
chai
n an
aly
sis
4.
Bal
ance
d s
core
card
amd
st
rate
gy
map
5.
Inte
grat
ing
su
stai
nab
ilit
y
Str
ateg
y
Ser
vic
e
Inte
rnat
ion
al
Eth
ics
Su
stai
nab
ilit
y
Problems (continued) 2-55 2-55 20 min. X X2-56 2-56 25 min. X X X2-57 2-57 45 min. X X X 2-58 2-58 40-50 min. X X X X2-59 2-59 30 min. X X X2-60 2-60 Replaced 40-50 min. X X X 2-61 2-61 20 min. X X2-62 2-62 20 min. X X X2-63 2-63 30 min. X X 2-64 2-64 15 min. X X 2-65 2-65 20 min. X X X X X 2-66 2-66 10 min. X 2-67 2-67 40 min. X 2-68 2-68 40 min. X 2-69 2-69 20 min. X X 2-70 2-70 30 min. X X2-71 2-71 20 min. X X 2-72 2-72 30 min. X X X 2-73 New in 8e 30 min X X X 2-74 New in 8e 15-25 min X X
Chapter 02 - Implementing Strategy: The Value Chain, the Balanced Scorecard, and the Strategy Map
© 2019 by McGraw-Hill Education. This is proprietary material solely for authorized instructor use. Not authorized for sale or distribution in any manner. This document may not be copied, scanned, duplicated, forwarded, distributed, or posted on a website, in whole or part.
2-5
B. Critical Success Factors and SWOT Analysis.
SWOT analysis is a systematic procedure for identifying a firm’s CSFs: its internal Strengths and Weaknesses and its external Opportunities and Threats. Strengths are skills and resources that the firm has more abundantly than other firms. Skills or competencies that the firm employs especially well are called core competencies. Core competencies are important because they point to areas of significant competitive advantage for the firm; core competencies can be used as the building blocks of the firm’s overall strategy. In contrast, weaknesses represent a lack of important skills or competencies relative to presence of those resources in competing firms. Strengths and weaknesses are most easily identified by looking inside the firm at its specific resources (product lines, marketing, management, strategy, R&D, and manufacturing).
Opportunities and threats are identified by looking outside the firm. Opportunities are important favorable situations in the firm’s environment (demographic trends, technological changes). Conversely, threats are major unfavorable situations in the firm’s environment (new competitors, government regulations). Opportunities and threats can be identified most easily by analyzing the industry and the firm’s competitors (barriers to entry, rivalry intensity, substitute products, customers’ bargaining power, and suppliers’ bargaining power). The ultimate objectives of the SWOT analysis are to identify the overall strategy and the CSFs of the firm and to begin to develop a consensus among executives and managers regarding them.
C. Execution. No matter how carefully crafted the firm’s strategy, success will not be achieved without disciplined efforts at execution. A number of CEOs indicate that a good strategy is worthless without effective execution.
Chapter 02 - Implementing Strategy: The Value Chain, the Balanced Scorecard, and the Strategy Map
© 2019 by McGraw-Hill Education. This is proprietary material solely for authorized instructor use. Not authorized for sale or distribution in any manner. This document may not be copied, scanned, duplicated, forwarded, distributed, or posted on a website, in whole or part.
2-6
D. Cost, Quality, and Time. Many firms find that a consideration of critical success factors yields a renewed focus on the three key factors: cost, quality, and speed of product development and product delivery. Increasingly, firms find that they must compete effectively on each of these three factors. Suppliers to these firms expect to meet very high standards of quality and to meet increasingly demanding delivery terms.
E. Value-Chain Analysis. Value-chain analysis is a strategic analysis tool used to better understand the firm’s competitive advantage, to identify where value to customers can be increased or costs reduced, and to better understand the firm’s linkages with suppliers, customers, and other firms. The activities of the value-chain include all steps necessary to provide a competitive product or service to the customer. Although the value-chains are sometimes difficult to describe for a service or not-for-profit organization because they might have no physical flow to visualize, the approach is applied to all types of firms. The term value-chain is used because each activity is intended to add value to the product or service. Management can better understand the firm’s competitive advantage by separating its operations according to activity. The underlying concept of the analysis is that each firm occupies a selected part or parts of the entire value chain. The determination of which part or parts of the chain to occupy is a strategic analysis based on the consideration of comparative advantage for the firm. Value-chain analysis has three steps:
a. Identify the Value-Chain Activities. The firm identifies the specific value activities that the firm in the industry must perform in the process of designing, manufacturing, and providing customer service. Some firms are involved in a single activity or a subset of the total activities. The activities should be determined at a relatively detailed level of operations, that is, at the level of business unit or process just large enough to be managed as a separate business activity.
b. Identify the Cost Driver(s) at Each Value Activity. A cost driver is any factor that changes the level of total cost. The objective of this step is to identify activities for which the firm has a current or potential cost advantage.
c. Develop a Competitive Advantage by Reducing Cost or Adding Value. In this step, the firm determines the nature of its current and potential competitive advantages by studying the value activities and cost drivers identifies earlier. In doing so, the firm must consider the following:
Identify competitive advantage (cost leadership or differentiation). The analysis of value activities can help better understand the firm’s strategic competitive advantage and its proper positioning in the overall industry value chain.
Identify opportunities for added value. The analysis of value activities can help identify activities in which the firm can add significant value for the customer.
Identify opportunities for reduced cost. A study of its value activities and cost drivers can help a firm determine those parts of the value chain for which it is not competitive.
Exploit linkages among activities in the value chain. The decision to provide an activity internally or to outsource it is sometimes influenced by the way that activity is affected by another activity in the chain.
Value-chain analysis supports the firm’s strategic competitive advantage by facilitating the discovery of opportunities for adding value for the customer and/or by reducing the cost to provide the product or service.

Chapter 02 - Implementing Strategy: The Value Chain, the Balanced Scorecard, and the Strategy Map
© 2019 by McGraw-Hill Education. This is proprietary material solely for authorized instructor use. Not authorized for sale or distribution in any manner. This document may not be copied, scanned, duplicated, forwarded, distributed, or posted on a website, in whole or part.
2-7
F. The Five Steps of Strategic Decision Making for CIC Manufacturing
The five steps of strategic decision making are illustrated in chapter two with an example of value chain analysis. The example is developed in the text, and the five steps are highlighted as follows. The context is a company (CIC) that manufactures computers and competes on a differentiation strategy.
1. Determine the Strategic Issues Surrounding the Problem. CIC competes as a differentiator based on customer service, product innovation and
reliability; customers pay more for the product as a result. 2. Identify the Alternative Actions:
CIC faces two decisions, the first of which is to make or buy certain parts, which CIC currently buys for $300 but CIC could manufacture these parts for $ 190 per unit plus an additional $55,000 monthly cost.
The second decision is choose whether to continue marketing, distributing, and serving its products, or to outsource that set of activities to JBM enterprises for $130 per unit sold and save $175,000 per month in materials and labor costs. 3. Obtain Information and Conduct Analyses of the Alternatives
First decision: CIC calculates that the monthly cost to buy is $180,000 (=600 x $300) while the monthly cost to manufacture the part is only $169,000 (=600 x $190 + $55,000), a saving of $11,000 to make.
Second decision: CIC calculates that the monthly cost of the contract with JBM enterprises would be $78,000 (=600 x $130) per month. This is a $97,000 saving over the in-house cost of $175,000 per month.
4. Based on Strategy and Analysis, Choose and Implement the Desired Alternative First decision: As a differentiator based on product quality and innovation, CIC
considers the importance of the quality of the part in question, and decides to manufacture the part. Note that while this would save CIC $11,000 per month, the key reason for the decision is to control the quality of the part and thereby improve overall quality, and support the firm’s differentiation strategy. Note however, that if CIC believes that the supplier can provide the part at a higher level of quality than can CIC, the better strategy is reversed; it is now better to continue to buy, even if the costs are higher, in order to support quality, a critical success factor.
Second decision: As a differentiator based on customer service, CIC considers the continued high level of service from in-house personnel as critical to the company’s success and continues to maintain these personnel, even if it means the loss of monthly savings of $97,000.
5. Provide an On-going Evaluation of the Effectiveness of implementation in Step 4. Management of CIC realize that the quality of the product and of customer service is
critical to the company’s success. So, CIC will continue to review the quality of product and service provided internally. If the quality of the part purchased outside, or the service provided internally is inferior to that provided by JBM, then a change to JBM would be desirable.
G. The balanced scorecard (BSC), a performance report based on a broad set of both financial and non-financial measures, is a crucial part of the firm’s efforts to better understand and to implement its strategy. It consists of four “perspectives,” or groupings of critical success factors: (1) the financial perspectivewhich includes the financial performance measures such as operating income and cash flow, (2) customer perspective, including measures of customer satisfaction, (3) internal process perspective, which includes measures of productivity, speed, among others, and (4) learning and innovation, which includes such measures as employee training hours, number of new patents or new products. The BSC provides four key benefits:
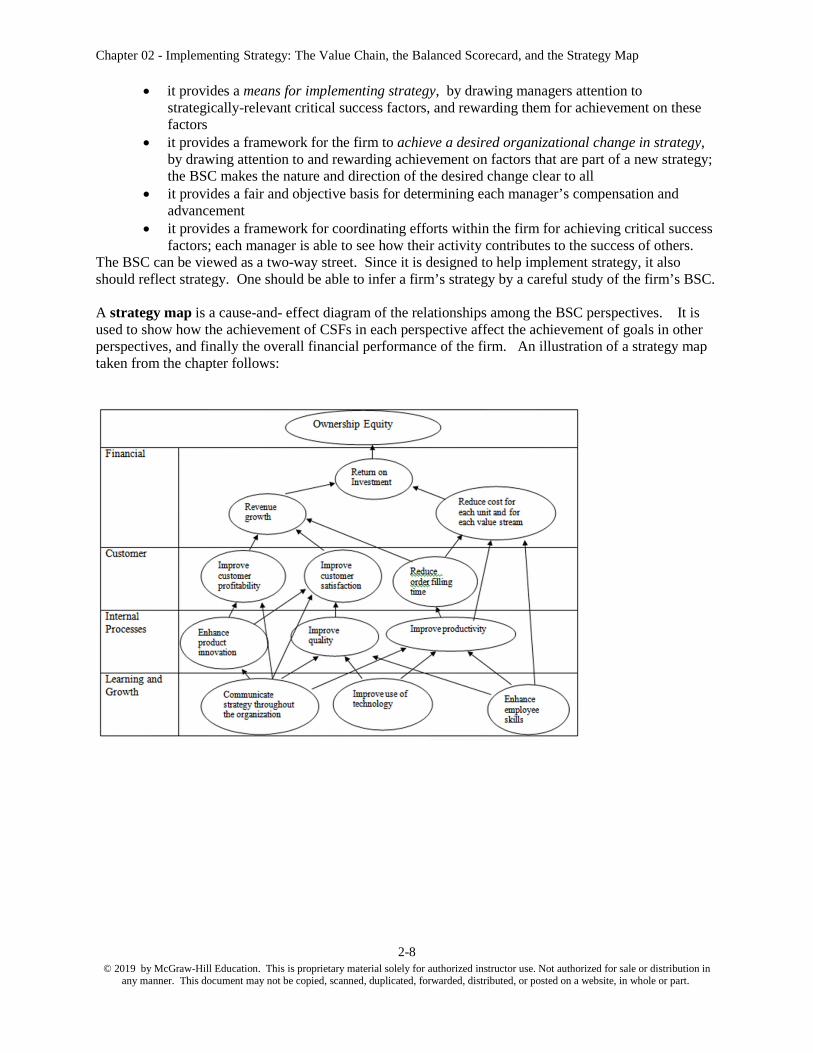
Chapter 02 - Implementing Strategy: The Value Chain, the Balanced Scorecard, and the Strategy Map
© 2019 by McGraw-Hill Education. This is proprietary material solely for authorized instructor use. Not authorized for sale or distribution in any manner. This document may not be copied, scanned, duplicated, forwarded, distributed, or posted on a website, in whole or part.
2-8
it provides a means for implementing strategy, by drawing managers attention to strategically-relevant critical success factors, and rewarding them for achievement on these factors
it provides a framework for the firm to achieve a desired organizational change in strategy, by drawing attention to and rewarding achievement on factors that are part of a new strategy; the BSC makes the nature and direction of the desired change clear to all
it provides a fair and objective basis for determining each manager’s compensation and advancement
it provides a framework for coordinating efforts within the firm for achieving critical success factors; each manager is able to see how their activity contributes to the success of others.
The BSC can be viewed as a two-way street. Since it is designed to help implement strategy, it also should reflect strategy. One should be able to infer a firm’s strategy by a careful study of the firm’s BSC.
A strategy map is a cause-and- effect diagram of the relationships among the BSC perspectives. It is used to show how the achievement of CSFs in each perspective affect the achievement of goals in other perspectives, and finally the overall financial performance of the firm. An illustration of a strategy map taken from the chapter follows:
Chapter 02 - Implementing Strategy: The Value Chain, the Balanced Scorecard, and the Strategy Map
© 2019 by McGraw-Hill Education. This is proprietary material solely for authorized instructor use. Not authorized for sale or distribution in any manner. This document may not be copied, scanned, duplicated, forwarded, distributed, or posted on a website, in whole or part.
2-9
H. Expanding The Balanced Scorecard: Sustainability
More and more large companies, especially those in the extractive industries, are concerned about the sustainability of their business, that is, the balancing of short and long term goals in all three dimensions of the company’s performance – economic, social and environmental. Economic performance is measured in traditional ways, while social performance relates to health and safety of employees and other stakeholders, while the environmental dimension refers to the impact of the firm’s operations on the environment.
The CSFs in a sustainability perspective are called environmental performance indicators (EPIs), which are defined in three categories by the World Resources Institute:
operational indicators; measure potential stresses to the environment, for example, fossil fuel use
management indicators; measure efforts to reduce environmental effects, for example, hours of environmental training,
environmental condition indicators; measure environmental quality, for example, ambient air pollution concentrations

1Copyright © 2016 McGraw-Hill Education. All rights reserved. No reproduction or distribution without the prior written consent of
McGraw-Hill Education.
Crystal Coast Ocean Resort
The Crystal Coast Ocean Resort (CCOR) is a large, family-owned resort located on one of the finest beaches in North Carolina. The Resort is locally called the “Ramada Inn: Crystal Coast Ocean Resort”, because it has a contractual relationship with Ramada Inn, Inc which requires Ramada to provide reservation services and certain marketing services. In turn CCOR pays an annual fee to Ramada and displays the Ramada Inn sign. Ramada has the right, under contract, to require CCOR to meet Ramada standards for resort services, cleanliness, etc, and regularly visits CCOR to make sure that these standards are being met. CCOR’s main building has a T-configuration, where the top of the T is road-side and the bottom of the T is at the beach. This allows all rooms to have at least a partial view of the beach. There are five types of rooms for guests, ocean front (actually facing the ocean, at the bottom of the T), ocean view (along the sides of the T), pool side (first floor, with patios having direct access to the pool), and one and two bedroom suites that are located at the top of the T. These rooms are distributed as follows.
No. of Rooms
Ocean front 50
Ocean view 250
Pool Side 18
One Bedroom Suite 16
Two Bedroom Suite 16
350
The season for CCOR is year-round because of the mild winters, though the occupancy rates vary from 100% during the summer months to less than 50% in the winter months. The average annual occupancy rate for each type of rooms is 80%, 75%, 60%, 50% and 50% for the ocean front, ocean view, pool side, one room and two room suites, respectively. Because the Resort is popular with families, the average number of persons per room is greater than for some other motels or hotels. The average number of occupants is three for the ocean front, ocean view, and pool side rooms, four for the one bedroom suite, and 6 for the two bedroom suite. The suite are also somewhat larger, 500 square feet for the one bedroom suite, and 900 square feet for the two bedroom suite, while all other room are 300 square feet.
CCOR does not have some of the amenities of competing resorts, but instead competes on value pricing and reliable service. It does not offer special services such as room service, exercise room, restaurant, or lounge but it sets high standards for room cleanliness and for the appearance and cleanliness of the pool and grounds. Also, CCOR offer a free breakfast and a free afternoon snack.
Because of high demand in summer months, CCOR sets relatively high market prices during this season, ranging from $125 to $350 per room depending on room type and day of week. Prices are lower in the fall and spring, and substantially lower in the winter. In order to have better information about price setting and profitability analysis for each of the five room types: ocean front, ocean view, pool side, one bedroom and two bedroom suites, CCOR has gathered additional information to help it determine the cost for each occupied room. Les Broom, the accounting manager, assembled the following data. The data includes information on the four annual resource costs taken directly from CCOR’s accounting reports, as well as activity and cost driver information developed by Les.
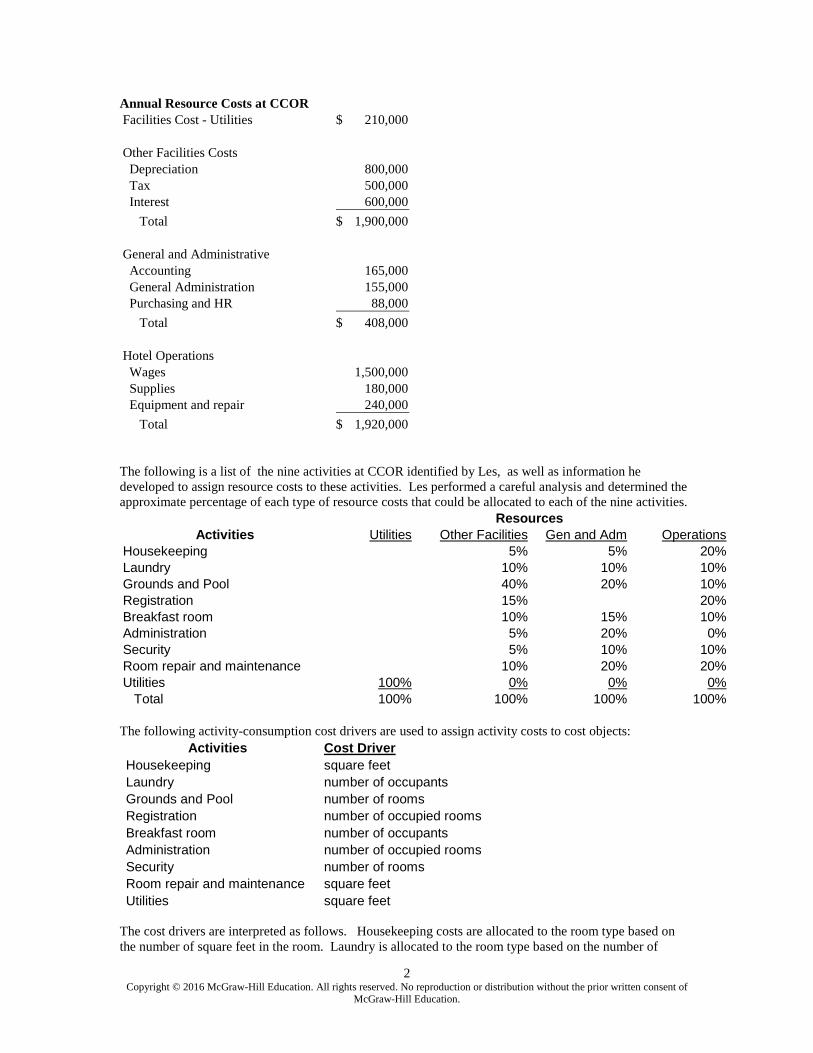
2Copyright © 2016 McGraw-Hill Education. All rights reserved. No reproduction or distribution without the prior written consent of
McGraw-Hill Education.
Annual Resource Costs at CCOR Facilities Cost - Utilities 210,000$
Other Facilities Costs Depreciation 800,000 Tax 500,000 Interest 600,000
Total 1,900,000$
General and Administrative Accounting 165,000 General Administration 155,000 Purchasing and HR 88,000
Total 408,000$
Hotel Operations Wages 1,500,000 Supplies 180,000 Equipment and repair 240,000
Total 1,920,000$
The following is a list of the nine activities at CCOR identified by Les, as well as information he developed to assign resource costs to these activities. Les performed a careful analysis and determined the approximate percentage of each type of resource costs that could be allocated to each of the nine activities.
Activities Utilities Other Facilities Gen and Adm OperationsHousekeeping 5% 5% 20%Laundry 10% 10% 10%Grounds and Pool 40% 20% 10%Registration 15% 20%Breakfast room 10% 15% 10%Administration 5% 20% 0%Security 5% 10% 10%Room repair and maintenance 10% 20% 20%Utilities 100% 0% 0% 0% Total 100% 100% 100% 100%
Resources
The following activity-consumption cost drivers are used to assign activity costs to cost objects:
Activities Cost Driver
Housekeeping square feet
Laundry number of occupants
Grounds and Pool number of rooms
Registration number of occupied rooms
Breakfast room number of occupants
Administration number of occupied rooms
Security number of rooms
Room repair and maintenance square feet
Utilities square feet
The cost drivers are interpreted as follows. Housekeeping costs are allocated to the room type based on the number of square feet in the room. Laundry is allocated to the room type based on the number of

3Copyright © 2016 McGraw-Hill Education. All rights reserved. No reproduction or distribution without the prior written consent of
McGraw-Hill Education.
occupants in that room type for the year. Grounds and pool expenses are allocated an equal amount to each room. Registration is allocated on the basis of the number of occupied rooms, that is, the number of nights a room type is occupied). The other activities are allocated using the cost drivers in a similar way..
In addition to the cost of the nine activities, CCOR has direct costs for each type of room, as shown below. These direct costs are incurred each night a room is occupied. These costs are called “external units” in the Oros software. External Units (Direct Costs) Oceanfront Oceanview Pool Side 1 Room Suite 2 Room SuiteKitchenware replacement/repair 2.00$ 3.00$ Complimentary toiletries 2.00$ 2.00$ 2.00$ 3.00$ 4.00$ Complimentary coffee and tea 3.00$ 3.00$ 3.00$ 5.00$ 8.00$
Required
1. Download and install the Oros Quick ABC program (WinZip file). The Oros Quick software is in self-extracting zipped file. Create a directory on your computer and download the file to that directory. Double-click on the file and it will load in that directly. Then double click on the Setup executable file to install the software (you can safely uninstall it later).
2. Download the Short Oros tutorial. 3. Work through the Short Oros tutorial (you can skip the sections on attributes and on the balanced
scorecard; these are explained in the full tutorial). 4. Create a folder labeled “Ocean Resort.” You will save to this folder the several files of the Oros
ABC model you create when developing the Oros model. 5. Use the information in the case above and in the tutorial to complete an ABC costing application
using Oros; determine the ABC-based unit costs for each occupied room for each room type. An occupied room is defined as a room that is occupied for that night. .
6. Comment briefly on what management insights are created with the ABC analysis of profitability by room type.
Blocher,Stout,Juras,Cokins Cost Management 7e ©The McGraw-Hill Companies 2016
Implementing Strategy: The Value Chain, the Balanced Scorecard,
and the Strategy Map
Chapter Two

2-2
• Explain how to implement a competitive strategy by using Strengths-Weaknesses-Opportunities-Threats (SWOT) Analysis
• Explain how to implement a competitive strategy by focusing on the execution of goals
• Explain how to implement a competitive strategy using value-chain analysis
Learning Objectives
2-3
Learning Objectives (continued)
• Explain how to implement a competitive strategy using the Balanced Scorecard (BSC) and strategy map
• Explain how to expand the Balanced Scorecard (BSC) by integrating sustainability

2-4
• There are two main competitive strategies:
– cost leadership
– differentiation
• Once a firm chooses which strategy to follow, there are various means of implementation:
– SWOT analysis
– Focus on execution
– Value-chain analysis
– Balanced scorecard (BSC)
Implementing a Strategy

2-5
SWOT Analysis
• Identification of critical success factors (CSFs) tied to strategy—for example:
– Product innovation
– Quality
– Skill development
• Core competencies
– Areas of significant competitive advantage
– Building blocks for the organization’s overall strategy
• Quantitative measures
– Are required for each critical success factor
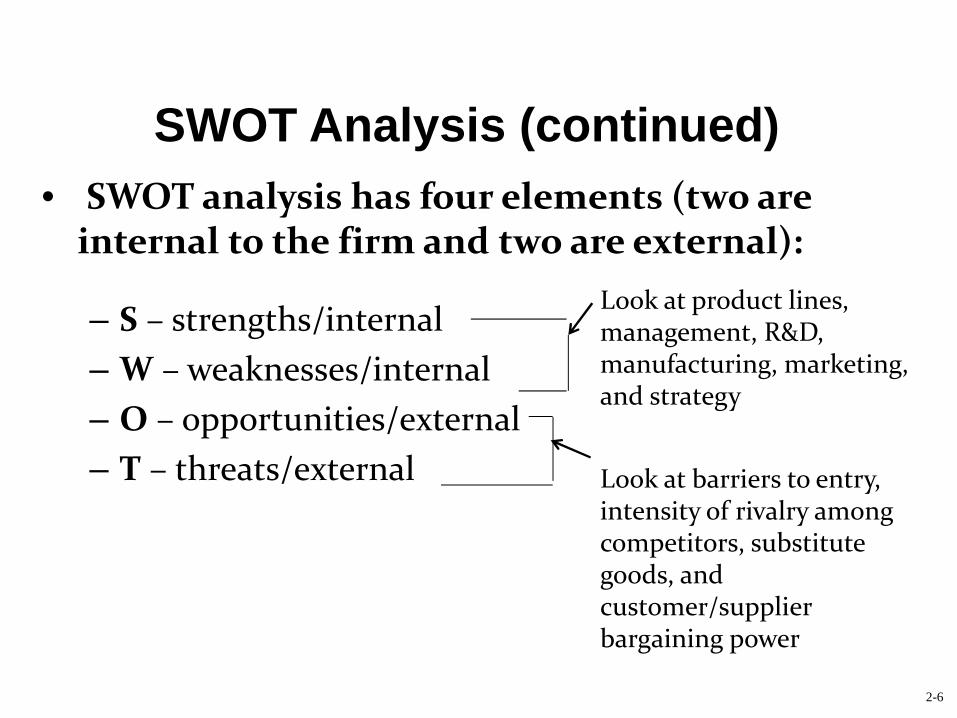
2-6
SWOT Analysis (continued)
• SWOT analysis has four elements (two are internal to the firm and two are external):
– S – strengths/internal
– W – weaknesses/internal
– O – opportunities/external
– T – threats/external
Look at product lines, management, R&D, manufacturing, marketing, and strategy
Look at barriers to entry, intensity of rivalry among competitors, substitute goods, and customer/supplier bargaining power
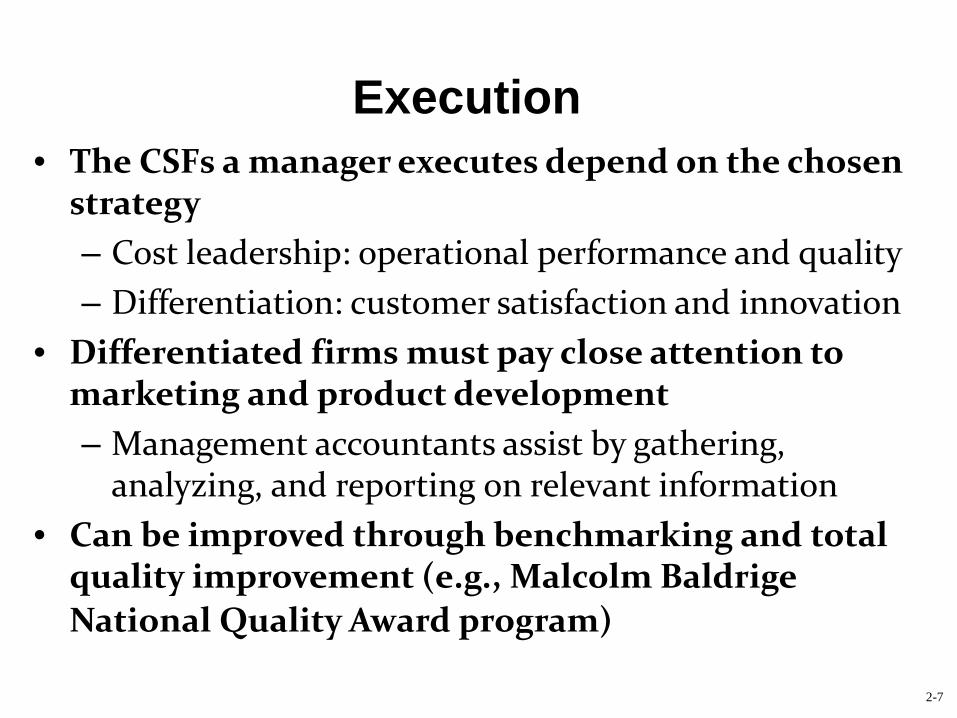
2-7
• The CSFs a manager executes depend on the chosen strategy
– Cost leadership: operational performance and quality
– Differentiation: customer satisfaction and innovation
• Differentiated firms must pay close attention to marketing and product development
– Management accountants assist by gathering, analyzing, and reporting on relevant information
• Can be improved through benchmarking and total quality improvement (e.g., Malcolm Baldrige
National Quality Award program)
Execution

2-8
Value-Chain Analysis• An analysis for better understanding the details of
the organization’s competitive strategy– CSFs must be implemented in each and every phase
of operations
• Helps a firm better understand its competitive advantage by analyzing what processes add value
• Three Phases:– Upstream: product development, links with
suppliers– Operations: manufacturing or service done– Downstream: links with customers, delivery, service
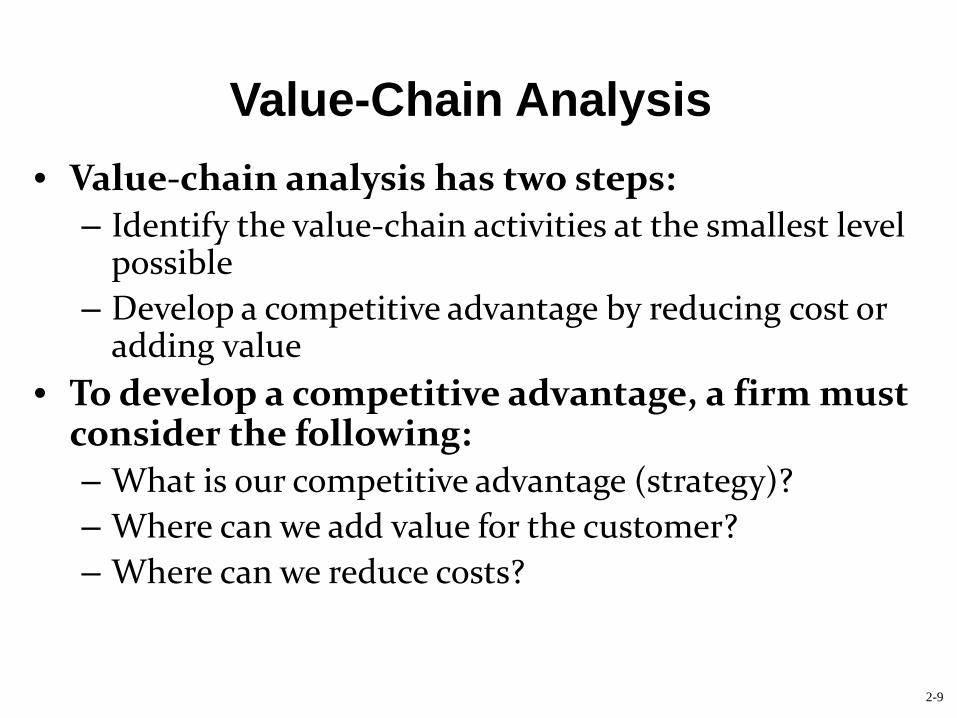
2-9
Value-Chain Analysis
• Value-chain analysis has two steps:– Identify the value-chain activities at the smallest level
possible
– Develop a competitive advantage by reducing cost or adding value
• To develop a competitive advantage, a firm must consider the following:– What is our competitive advantage (strategy)?
– Where can we add value for the customer?
– Where can we reduce costs?

2-10
Example: Value-Chain Analysis in Computer Manufacturing
• Computer Intelligence Company (CIC) manufactures high quality computers for small businesses
• The company has an excellent reputation for service, innovation and reliability as well as a growing customer list: competes on differentiation
• Is there any way to add value for the customer while reducing costs?
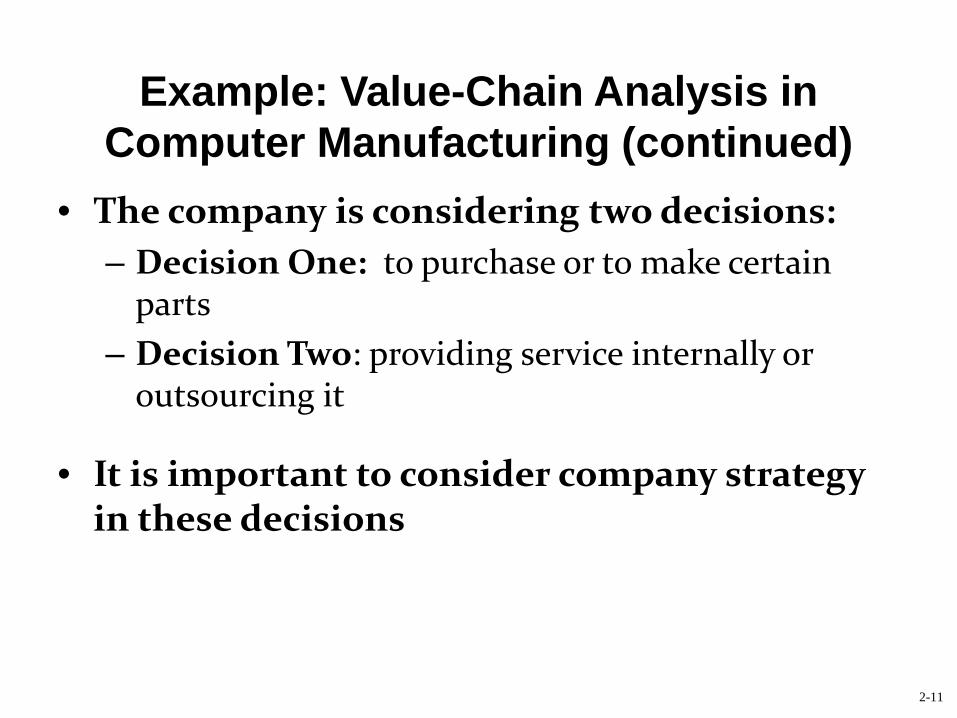
2-11
Example: Value-Chain Analysis in Computer Manufacturing (continued)
• The company is considering two decisions:
– Decision One: to purchase or to make certain parts
– Decision Two: providing service internally or outsourcing it
• It is important to consider company strategy in these decisions

Value-Chain Analysis in Computer Manufacturing (continued)
Value Activity Current Operations Effects of Decisions
Acquiring raw materials CIC is not involved at this step
CIC is not involved at this step
Manufacturing computer chips and other parts
CIC is not involved at this step; purchase cost to CIC is $200
CIC is not involved at this step; purchase cost to CIC is $200
Decision 1: Manufacturing components, some of which CIC can make
CIC purchases $300 of parts for each unit
CIC manufactures these parts for $190 per unit plus $55,000 monthly labor and equipment
Assembling CIC’s costs are $250 CIC’s costs are $250
Decision 2: Marketing, distributing, and servicing
CIC’s costs are $175,000 per month
CIC contracts out these services for $130 per unit sold 2-12
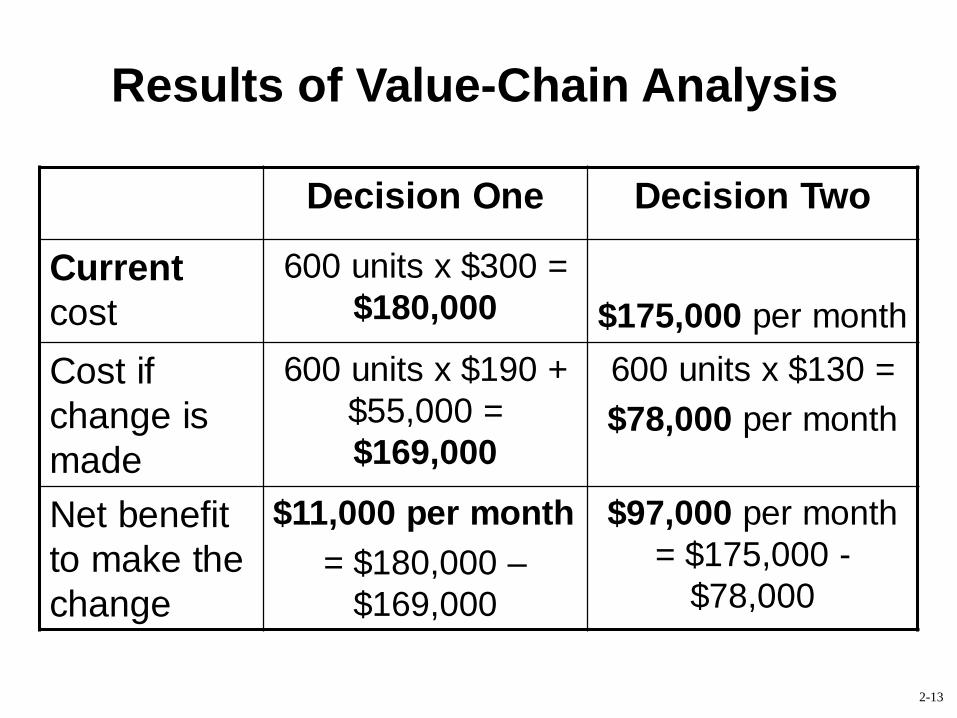
Results of Value-Chain Analysis
Decision One Decision Two
Currentcost
600 units x $300 = $180,000 $175,000 per month
Cost if change is made
600 units x $190 + $55,000 = $169,000
600 units x $130 =
$78,000 per month
Net benefit to make the change
$11,000 per month
= $180,000 –$169,000
$97,000 per month = $175,000 -
$78,000
2-13

Results of Value-Chain Analysis (continued)
• CIC can save $108,000 ($11,000 + $97,000) per month by manufacturing the parts and contracting out marketing, distributing, and servicing
• The main factor driving the decision is company strategy, which in this case is quality and service– For a firm pursuing a differentiation strategy, the best
decision is not always based on lowest cost
– From a strategic viewpoint, since CIC succeeds on the basis of quality and customer service, the best decisions are to continue to make the parts (to ensure quality) and to continue the marketing function internally (to ensure the highest level of customer service)
2-14

2-15
The Five Steps of Strategic Decision Making for CIC
1. Determine the strategic issues surrounding the decisions: CIC competes on differentiation
2. Identify the alternative actions for the two decisions
3. Obtain information and conduct analyses of the alternatives: calculate the relevant costs
4. Based on strategy and analysis, choose and implement the desired alternative – support CIC’s strategy, this is the key to the analysis
5. Provide an on-going evaluation of the effectiveness of implementation in Step 4.
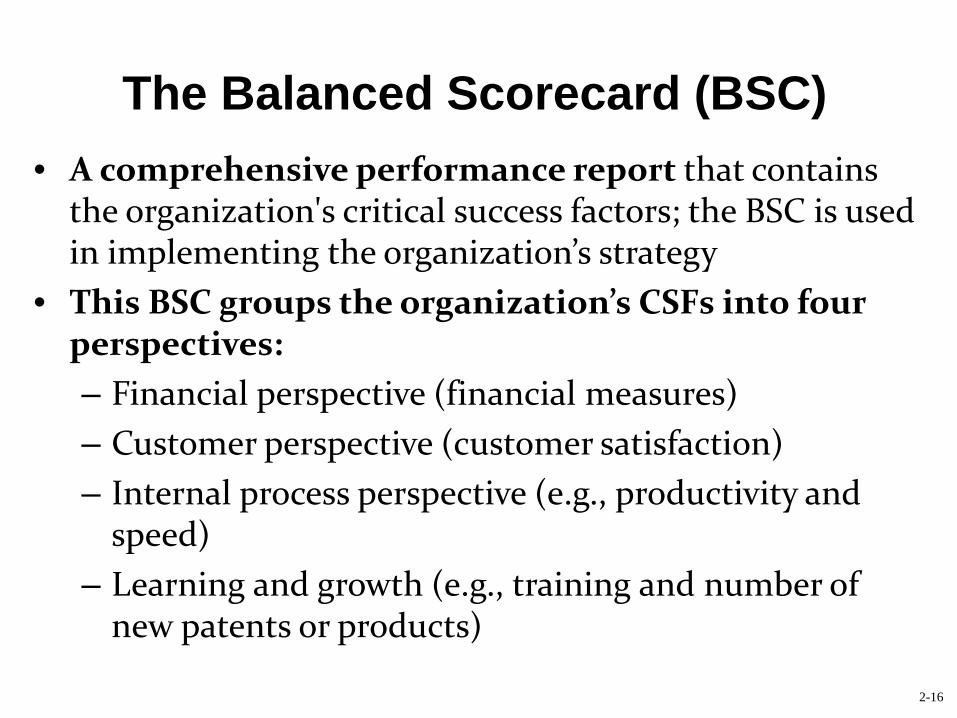
2-16
The Balanced Scorecard (BSC)
• A comprehensive performance report that contains the organization's critical success factors; the BSC is used in implementing the organization’s strategy
• This BSC groups the organization’s CSFs into four perspectives:
– Financial perspective (financial measures)
– Customer perspective (customer satisfaction)
– Internal process perspective (e.g., productivity and speed)
– Learning and growth (e.g., training and number of new patents or products)
2-17
The Balanced Scorecard (continued)
• Benefits
– Provides a means for tracking progress on implementing strategy
– Aligns managers’ efforts with strategy
– When an organization changes strategy, the BSC provides a means to achieve the desired change
– Can be used to determine management’s compensation and rewards
– Coordinates efforts within the firm to achieve CSFs
2-18
The Balanced Scorecard (continued)
• A properly constructed BSC reflects a company’s strategy
-- One should be able to infer a company’s strategy from its balanced scorecard
• The emphasis placed on each performance perspective reflects the strategy of the firm
– For a cost leader, the operations perspective might be the most important; for a differentiator, the customer perspective…

2-19
Strategy Map
A strategy map is a cause-and-effect diagram of the relationships among the critical success factors in a BSC. The strategy map:
• Shows how the achievement of CSFs in one perspective should affect the achievement of goals in another perspective
• Focuses on the financial perspective because financial performance is the ultimate goal for most profit-seeking organizations
• Illustrates how success in the customer, internal processes, and learning & growth perspectives leads directly to improved financial performance

An Example Strategy Map
2-20

2-21
Expanding the Balanced Scorecard: Sustainability
• Sustainability involves the balancing of the three dimensions of the company’s performance–financial, social, and environmental
• Sustainability is often managed by an additional perspective of the balanced scorecard
• Sustainability measures for the scorecard (ESGs) are recognized by the Sustainability Accounting Standards Board (SASB) in three categories: environmental, social and governance indicators

2-22
Sustainability (continued)
The environmental and social measures of ESGs are further categorized by the World Resources Institute (WRI) as follows:
• Environmental Indicators include:
- Operational measures (e.g., regulatory compliance issues)
- Management measures
- Environmental measures
• Social performance indicators include:
- Working conditions (worker safety and training)
- Community involvement
- Philanthropy (direct contributions)
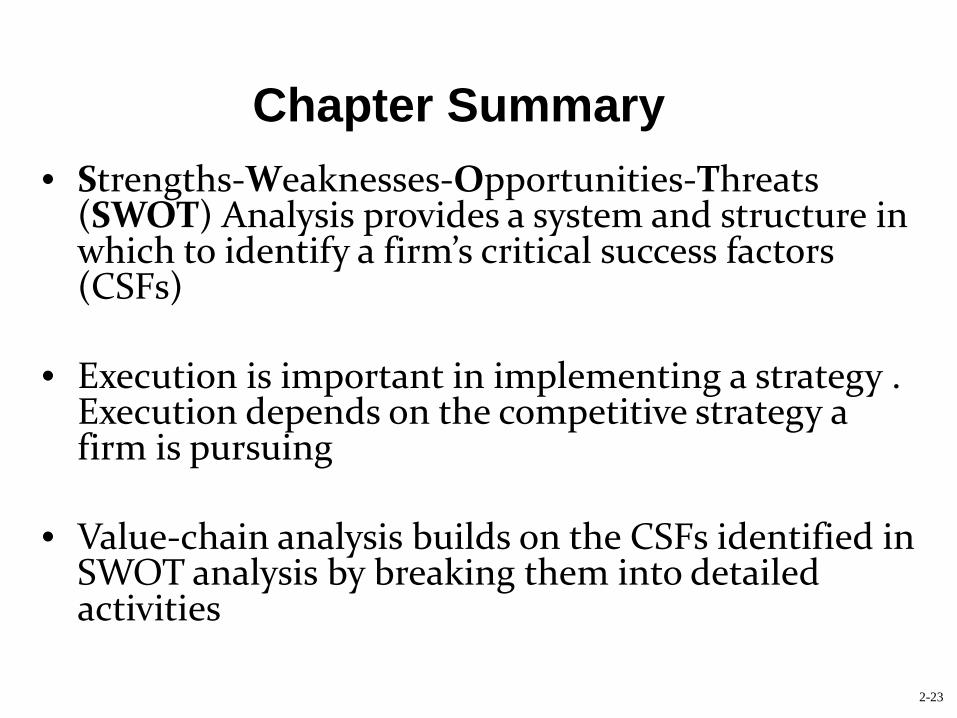
2-23
• Strengths-Weaknesses-Opportunities-Threats (SWOT) Analysis provides a system and structure in which to identify a firm’s critical success factors (CSFs)
• Execution is important in implementing a strategy . Execution depends on the competitive strategy a firm is pursuing
• Value-chain analysis builds on the CSFs identified in SWOT analysis by breaking them into detailed activities
Chapter Summary

Chapter Summary (continued)
• The balanced scorecard (BSC) is a comprehensive performance report that contains the organization's critical success factors
• The strategy map is a cause-and-effect diagram of the relationships among the critical success factors in a BSC
• Sustainability, often included as a perspective of the BSC, builds on the BSC by balancing financial, social, and environmental issues
2-24