chapter 2 aviation activity forecast · aviation activity forecast salt lake city international...
TRANSCRIPT

CHAPTER 2
AVIATION ACTIVITY FORECAST

This Page Intentionally Left Blank

A V I A T I O N A C T I V I T Y F O R C A S T
Salt Lake City International Airport Master Plan i
TABLE OF CONTENTS Chapter 2 Aviation Activity Forecast
2.1 Introduction................................................................................................................................................................... 2-1
2.1.1 Executive Summary of Forecasts for FAA Approval ................................................................................. 2-3 2.1.2 SLC Service Area ..................................................................................................................................................... 2-5
2.2 Review of Forecasts .................................................................................................................................................. 2-12
2.2.1 FAA Aerospace Forecast Fiscal Years 2018-2038 .................................................................................... 2-12 2.2.2 Terminal Area Forecast 2017 (Published January, 2018) and Forecast Report ............................ 2-13 2.2.3 2019-2023 National Plan of Integrated Airport Systems (NPIAS) .................................................... 2-14 2.2.4 2006 Salt Lake City International Airport Layout Plan Update .......................................................... 2-15 2.2.5 Utah Continuous Airport System Plan ......................................................................................................... 2-16 2.2.6 Expert Panel ............................................................................................................................................................ 2-17 2.2.7 Passenger Aircraft Fleet Mix-Baseline 2017 .............................................................................................. 2-18
2.3 Historical Operations ............................................................................................................................................... 2-19 2.4 Passenger Enplanements ....................................................................................................................................... 2-24
2.4.1 Historical Enplanements .................................................................................................................................... 2-24 2.4.2 Market Trends and Activity .............................................................................................................................. 2-35 2.4.3 Passenger Enplanement Forecasts ................................................................................................................ 2-44
2.5 Planning Day Model................................................................................................................................................. 2-60
2.5.1 Planning Day Model Methodology .............................................................................................................. 2-60 2.5.2 Baseline Flight Schedule 2018 ........................................................................................................................ 2-60 2.5.3 Planning Day Model Base Case Forecast .................................................................................................... 2-63 2.5.4 Planning Day Model Low Case Scenario Forecast .................................................................................. 2-77 2.5.5 Planning Day Model High Case Scenario Forecast ................................................................................. 2-82 2.5.6 Peak Day and Total Passenger Air Carrier Operations .......................................................................... 2-87 2.5.7 Electric Vertical Takeoff and Landing Operations ................................................................................... 2-90
2.6 Air Cargo....................................................................................................................................................................... 2-92
2.6.1 Historical Air Cargo ............................................................................................................................................. 2-92 2.6.2 Air Cargo Fleet Mix-Baseline 2017 ................................................................................................................ 2-99 2.6.3 Local Cargo Forecasts ..................................................................................................................................... 2-100 2.6.4 Total Air Cargo Forecast ................................................................................................................................. 2-102 2.6.5 Air Cargo Operations Forecast (Integrated Carriers) .......................................................................... 2-105
2.7 General Aviation and Military ............................................................................................................................ 2-108
2.7.1 General Aviation Forecast .............................................................................................................................. 2-108 2.7.2 Military Forecast ................................................................................................................................................ 2-112
2.8 Summary of Aircraft Operations ...................................................................................................................... 2-113
2.8.2 IFR and VFR Operations ................................................................................................................................. 2-116

A V I A T I O N A C T I V I T Y F O R C A S T
Salt Lake City International Airport Master Plan ii
2.9 Critical Aircraft ......................................................................................................................................................... 2-117 2.10 Aviation Activity Forecasts Summary ............................................................................................................. 2-119
2.10.1 Comparison with FAA TAF ........................................................................................................................ 2-119 2.10.2 Forecast Usage within the Master Plan ............................................................................................... 2-121
APPENDIX C. Baseline Operations by Fleet Mix ..................................................................................................... 2-122
LIST OF FIGURES FIGURE 2-1 SLC Service Area ...................................................................................................................................................... 2-6 FIGURE 2-2 Comparison of Historical Socioeconomic Variables (1993-2017)........................................................ 2-8 FIGURE 2-3 Comparison of Socioeconomic Variable Projections (2018-2037) ...................................................... 2-9 FIGURE 2-4 Comparison of Gross Domestic Product Forecasts by Various Sources ......................................... 2-11 FIGURE 2-5 Projected Revenue Passenger Enplanements for U.S. Commercial Air Carriers (2017-2038). 2-12 FIGURE 2-6 Recent TAF Forecast Growth Rates for SLC ................................................................................................ 2-13 FIGURE 2-7 Comparison of NPIAS Large Hub Airports .................................................................................................. 2-14 FIGURE 2-8 Optimistic and Conservative Scenarios (2006 SLC Airport Layout Plan Update) ........................ 2-15 FIGURE 2-9 2007 UCASP Forecast for Commerical Operations and Enplanements in Utah ........................... 2-16 FIGURE 2-10 Historical Total Operations (2003-2017) ................................................................................................... 2-20 FIGURE 2-11 Historical Passenger Operations (2003-2017) ......................................................................................... 2-21 FIGURE 2-12 Historical General Aviation Operations (2003-2017) ............................................................................ 2-22 FIGURE 2-13 Historical Military Operations (2003-2017) .............................................................................................. 2-23 FIGURE 2-14 Historical Enplanement Breakdown (1993-2017) .................................................................................. 2-25 FIGURE 2-15 Historical O&D and Connecting Enplanements (2013-2017) ........................................................... 2-27 FIGURE 2-16 Top 25 International Destinations by Region (2017)............................................................................ 2-32 FIGURE 2-17 Peak Month Enplanements (FY 2013-2017) ............................................................................................. 2-33 FIGURE 2-18 SLC Air Carrier Market Share of Enplanements (2013 & 2017) ........................................................ 2-35 FIGURE 2-19 Nonstop Destinations (August, 2018) ........................................................................................................ 2-36 FIGURE 2-20 Historic Load Factors ......................................................................................................................................... 2-37 FIGURE 2-21 Comparison of Regional Large Hub Airport Enplanements (2013-2017) .................................... 2-38 FIGURE 2-22 Annual Average Domestic Airfare Comparison among similarly sized Regional Airports .... 2-39 FIGURE 2-23 Historical and Projected Average Domestic Airfare (1993-2037) .................................................... 2-40 FIGURE 2-24 Historical and Projected Airline Yield (1993-2037) ............................................................................... 2-41 FIGURE 2-25 Historical and Projected Jet Fuel Prices (1993-2037) ........................................................................... 2-42 FIGURE 2-26 Base Case Forecast Regression Model and Monte Carlo Simulation Limits ............................... 2-48 FIGURE 2-27 International Enplanements – Historical (2003-2017) and Forecast (2018-2037) .................... 2-57 FIGURE 2-28 Domestic Enplanements – Historical (2003-2017) and Forecast (2018-2037) ........................... 2-58 FIGURE 2-29 Total Enplanements- Historical (1993-2017) and Forecast (2018-2038) ...................................... 2-59 FIGURE 2-30 Total Operations ADPM Baseline Schedule (2017) ............................................................................... 2-62 FIGURE 2-31 Domestic Operations ADPM Base Case Forecast (2022) .................................................................... 2-65 FIGURE 2-32 Domestic Operations ADPM Base Case Forecast (2027) .................................................................... 2-66 FIGURE 2-33 Domestic Operations ADPM Base Case Forecast (2032) .................................................................... 2-67 FIGURE 2-34 Domestic Operations ADPM Base Case Forecast (2037) .................................................................... 2-68

A V I A T I O N A C T I V I T Y F O R C A S T
Salt Lake City International Airport Master Plan iii
FIGURE 2-35 International Operations ADPM Base Case Forecast (2022) ............................................................. 2-69 FIGURE 2-36 International Operatoins ADPM Base Case Forecast (2027) ............................................................. 2-70 FIGURE 2-37 International Operations ADPM Base Case Forecast (2032) ............................................................. 2-71 FIGURE 2-38 International Operations ADPM Base Case Forecast (2037) ............................................................. 2-72 FIGURE 2-39 Total Operations ADPM Base Case Forecast (2022) ............................................................................. 2-73 FIGURE 2-40 Total Operations ADPM Base Case Forecast (2027) ............................................................................. 2-74 FIGURE 2-41 Total Operations ADPM Base Case Forecast (2032) ............................................................................. 2-75 FIGURE 2-42 Total Operations ADPM Base Case Forecast (2037) ............................................................................. 2-76 FIGURE 2-43 Total Operations ADPM Low Case Scenario Forecast (2022) ............................................................ 2-78 FIGURE 2-44 Total Operations ADPM Low Case Scenario Forecast (2027) ............................................................ 2-79 FIGURE 2-45 Total Operations ADPM Low Case Scenario Forecast (2032) ............................................................ 2-80 FIGURE 2-46 Total Operations ADPM Low Case Scenario Forecast (2037) ............................................................ 2-81 FIGURE 2-47 Total Operations ADPM High Case Scenario Forecast (2022) .......................................................... 2-83 FIGURE 2-48 Total Operations ADPM High Case Scenario Forecast (2027) .......................................................... 2-84 FIGURE 2-49 Total Operations ADPM High Case Scenario Forecast (2032) .......................................................... 2-85 FIGURE 2-50 Total Operations ADPM High Case Scenario Forecast (2037) .......................................................... 2-86 FIGURE 2-51 Passenger Operations Forecasts (1993-2037) ......................................................................................... 2-89 FIGURE 2-52 Comparison of Total Air Cargo Shares by Carrier (2008 & 2017) ................................................... 2-94 FIGURE 2-53 Historical Total Air Cargo (2008-2017)....................................................................................................... 2-94 FIGURE 2-54 Comparison of Freight Cargo Shares by Carrier (2008 & 2017) ...................................................... 2-95 FIGURE 2-55 Historical Freight (2008-2017) ....................................................................................................................... 2-95 FIGURE 2-56 Comparison of Belly Cargo Shares by Carrier (2008 & 2017) ........................................................... 2-96 FIGURE 2-57 Historical Belly Cargo (2008-2017) .............................................................................................................. 2-96 FIGURE 2-58 Historical Air Mail (2008-2017) ..................................................................................................................... 2-97 FIGURE 2-59 Peak Month Total Cargo (2013-2017) ........................................................................................................ 2-99 FIGURE 2-60 Base Case Forecast of Air Cargo by Type (2013-2037) ..................................................................... 2-103 FIGURE 2-61 Total Air Cargo (lbs.) Forecast Comparison (2013-2037) ................................................................. 2-104 FIGURE 2-62 Total Operations Forecasts (2018-2037) ................................................................................................ 2-114 FIGURE 2-63 Existing Critical Aircraft Dimensions ........................................................................................................ 2-118 FIGURE 2-64 Planning Activity Level (PAL) Development Path ................................................................................ 2-121
LIST OF TABLES TABLE 2-1 Base Case Forecast Comparison with FAA TAF 2017 .................................................................................. 2-4 TABLE 2-2 Key Socioeconomic Variables Projected (2017-2037) ................................................................................ 2-7 TABLE 2-3 Historical Enplanements by Type (1993-2017) ............................................................................................ 2-24 TABLE 2-4 Historical Enplanement Distribution (1993-2017) ...................................................................................... 2-26 TABLE 2-5 Top 25 Domestic Destinations by O&D Passengers (2013-2017) ....................................................... 2-29 TABLE 2-6 Top 25 International Destinations by O&D Passengers (2013-2017) ................................................. 2-30 TABLE 2-7 Top 25 International Destinations by Total O&D Passengers with Connecting Passengers Included (2013-2017) ................................................................................................................................................................... 2-31 TABLE 2-8 Monthly Enplanements Share by Fiscal Year (2013-2017) ...................................................................... 2-34 TABLE 2-9 International/Domestic Enplanement Forecast Distribution (2017-2037) ........................................ 2-52 TABLE 2-10 O&D Enplanement Forecasts (2017-2037) ................................................................................................. 2-53

A V I A T I O N A C T I V I T Y F O R C A S T
Salt Lake City International Airport Master Plan iv
TABLE 2-11 Connecting Enplanements Forecasts (2017-2037) .................................................................................. 2-54 TABLE 2-12 International and Domestic Enplanements Forecasts (2017-2037) .................................................. 2-55 TABLE 2-13 Total Enplanements Forecasts (2017-2037) ............................................................................................... 2-56 TABLE 2-14 Baseline Schedule 2018 Airline Summary ................................................................................................... 2-63 TABLE 2-15 Summary of ADPM Passenger Carrier Operations Forecasts (2018-2037) .................................... 2-87 TABLE 2-16 Summary of Air Carrier Operations forecasts by Aircraft Type (2022-2037)................................. 2-88 TABLE 2-17 eVTOL Operations Forecast (2022-2037) .................................................................................................... 2-91 TABLE 2-18 Historical Cargo Activity (2008-2017) ........................................................................................................... 2-93 TABLE 2-19 Historical Air Cargo by Carrier ......................................................................................................................... 2-93 TABLE 2-20 Air Cargo Processed by Month (2013-2017) .............................................................................................. 2-98 TABLE 2-21 Belly Cargo Forecast-Total Pounds (2017-2037) ................................................................................... 2-101 TABLE 2-22 Freight Forecast-Total Pounds (2017-2037) ............................................................................................ 2-102 TABLE 2-23 Air Cargo Operations by Aircraft-Base Case Forecast (2017-2037) ............................................... 2-106 TABLE 2-24 Air Cargo Operations by Aircraft-Low Case Scenario Forecast (2017-2037) ............................. 2-106 TABLE 2-25 Air Cargo Operations by Aircraft-High Case Scenario Forecast (2017-2037) ............................ 2-107 TABLE 2-26 General Aviation Based Aircraft Historical and Forecast (2008-2037) .......................................... 2-108 TABLE 2-27 Itinerant and Local GA Operations Historical (2008-2017) and Forecast (2018-2037) .......... 2-110 TABLE 2-28 GA Operations by Aircraft Type Forecast Summary (2017-2037) ................................................... 2-111 TABLE 2-29 Military Operations Forecast (2017-2037) ............................................................................................... 2-112 TABLE 2-30 Comparison of Total Annual Operations Forecasts (2017-2037) .................................................... 2-113 Table 2-31 Base Case Forecast Summary of Total Operations by Category (2018-2037)............................. 2-115 Table 2-32 Base Case Forecast Summary of ADPM Operations by Category (2018-2037) .......................... 2-115 TABLE 2-33 IFR and VFR Forecasts (2018-2037) ............................................................................................................ 2-116 TABLE 2-34 Annual Instrument Approaches Forecasts (2018-2037) ..................................................................... 2-116 TABLE 2-35 Base Case Forecast comparison with FAA TAF 2017 ........................................................................... 2-120

This Page Intentionally Left Blank

A V I A T I O N A C T I V I T Y F O R E C A S T
Salt Lake City International Airport Master Plan 2-1
2.1 INTRODUCTION Chapter 2 presents a forecast of the aviation activity for the Salt Lake City International Airport (SLC or the Airport). The forecast uses 2017 as the baseline year, and makes projections beginning in 2018, extending over the 20-year planning horizon to 2037.
The aviation activity forecast chapter: » Reviews and compares relevant forecasts for projected growth at SLC
» Identifies the service area for SLC that represents the primary geographic area from whichcustomers are drawn and evaluates socioeconomic data. Valid and relevant data from a variety ofsources which include but are not limited to
o Airlines operating out of SLCo Bureau of Transportation Statisticso T-100 market segment datao Official Airline Guide schedules (OAG)o Federal Aviation Administration (FAA)
Terminal Area Forecast (TAF) 2017, published in January 2018 FAA Aerospace Forecasts The Operations Network (OPSNET)
o Historical Airport Data from the Salt Lake City Department of Airportso General Aviation Strategy Plan, 2019o Key stakeholder input identified in the Forecast Expert Panel Session (See Section 1.2.6)o 2006 SLC Airport Layout Plan Updateo The University of Utah Kem C. Gardner Policy Instituteo 2007 Utah Continuous Airport Systems Plan (UCASP)o Woods & Poole, Inc., 2018 socioeconomic data for United States (U.S.) metropolitan
statistical areas (MSAs), and Micropolitan Statistical Areas (MICROs)
» Uses a variety of methods for generating forecasts which include, but are not limited to:o Trend line analysiso Econometric regression modelingo Monte Carlo Simulation
» Forecasts projections for the Airport in the areas of:o Passenger Activity
Enplanements (total, origin & destination (O&D), and connecting) Operations (itinerant, local, annual instrument approaches, instrument flight rules
(IFR), visual flight rules (VFR), and fleet mix) Design Day Schedule Peak Hour
o Air Cargo (total, freight, and belly cargo)o General Aviation (GA) Based Aircraft and Operationso Military Operationso Critical aircraft identified by runway

A V I A T I O N A C T I V I T Y F O R E C A S T
Salt Lake City International Airport Master Plan 2-2
Three forecasts were generated for passenger, cargo, and GA activity – they are identified as the Base Case, Low Case, and High Case Scenario Forecasts. The prevailing practice relative to military activity is to maintain the base year data (in this case 2017) constant over the forecast period, therefore the military activity for the Base Case, Low Case Scenario, and High Case Scenario Forecasts are all the same.
The preferred forecast is referred to as the Base Case Forecast, and it has the highest probability for achievement. In addition, several specialized forecasts, or derivatives, were developed by considering different assumptions regarding passenger enplanements which identify both a lower and higher level of enplanements than the Base Case Forecast.
The Base Case Forecast of passenger enplanements can be used as a barometer to measure for growth and the need for facilities in future years. If activity grows faster than anticipated by this Base Case Forecast, i.e., toward the level of enplanements identified by the High Case Scenario Forecast, then the Salt Lake City Department of Airports (SLCDA) should reassess their implementation schedule and accelerate plans as necessary. Similarly, slower than projected growth (Low Case Scenario Forecast) may warrant SLCDA deferring planned improvements until higher activity is reached. Actual activity growth should be frequently compared to anticipated design and construction schedules so that modifications can be identified, as necessary.
This document provides an aviation demand forecast and develops support forecasts, or derivative forecasts such as peak period passenger or aircraft operations forecasts by type, for use in preparing Facility Requirements within the next chapter.
Given the recent period of fast enplanement growth and the uncertainty about the ability to sustain this level of growth much longer, the Base Case and two scenario forecasts provide flexibility to predict future facility requirements that might be needed within a range of reasonableness. These forecasts serve as benchmarks for understanding the pace of growth at SLC should the Base Case Forecast be exceeded, or conversely, not achieved.
Reflecting positive trends in the United States and the region for future growth in air travel, the Base Case Forecast assumes;
» Continuation of strong growth between SLC and its city pairs at least in the short term
» Continuation of seasonal flights
» Continuation of flights to small cities in the western mountain region and the use of aircraft with60 seats and less
» Limited increases in non-stop destinations as SLC already serves 98 cities non-stop (August 2018)
» Continued increases in international enplanements with a growth in new international city pairs
» Continued upgauging of aircraft on routes from SLC, particularly to the West Coast
» Additional overnight flights to the east coast to connect with international flights
» Accommodation of expanding growth in tourism and business.

A V I A T I O N A C T I V I T Y F O R E C A S T
Salt Lake City International Airport Master Plan 2-3
The High Case Scenario Forecast is based upon a slightly higher long-term growth rate in population and employment as indicated in forecasts by the University of Utah’s Kem C. Gardener Policy Institute as opposed to using Woods & Poole. In addition, the FAA’s slightly higher long-term Gross Domestic Product (GDP) for the U.S. is used as opposed to the Woods & Poole Gross Regional Product (GRP) for the counties in the SLC Service Area (defined in Section 2.1.2). All these variables for this region are approximately equal to or greater than those of the United States. This is in addition to the possible effect from sustained competitive airfares and airline profitability. The Low Case Scenario assumes a slight decline in long-term GDP growth relative to Woods & Poole’s estimate of regional GRP as well as higher airfares and airline yields that suppresses air passenger growth.
2.1.1 Executive Summary of Forecasts for FAA Approval This section provides a quick summation of forecasts for the reader and for the FAA. Detail explanation about forecast methodology and results may be found is subsequent portions of the forecasts.
A key consideration in the development of aviation forecasts is how they compare with the Federal Aviation Administration (FAA) Terminal Area Forecasts (TAF).1 The TAF is an important planning tool used by the FAA to review and compare forecasts prepared by Airport Sponsors. In accordance with FAA Order 5050.4B, National Environmental Policy Act (NEPA) Implementing Instructions for Airport Actions, paragraph 706.b(3), “The sponsor’s forecast must be consistent with the Terminal Area Forecast (TAF). To be consistent with the TAF, the sponsor’s 5-year forecast should be within 10% of the TAF and a 10-year forecast should be within 15% of the TAF.”2 The FAA must approve sponsor forecasts before they can be used to prepare facility requirements in a master plan or before going forward with an environmental document that requires a forecast. If these stated thresholds are exceeded, the FAA Region office in which the airport is located will forward the forecasts to FAA headquarters for approval.
The basis for comparison of forecasts is the FAA TAF 2017 published in January 2018. The FAA TAF compares data on a fiscal year basis, i.e., October 1 of a year through September 30 of the next year. Wherever possible, the Master Plan Update forecasts use the same fiscal year methodology as the FAA TAF for purposes of direct comparison. Data cited identifies whether it is fiscal year data or calendar year.
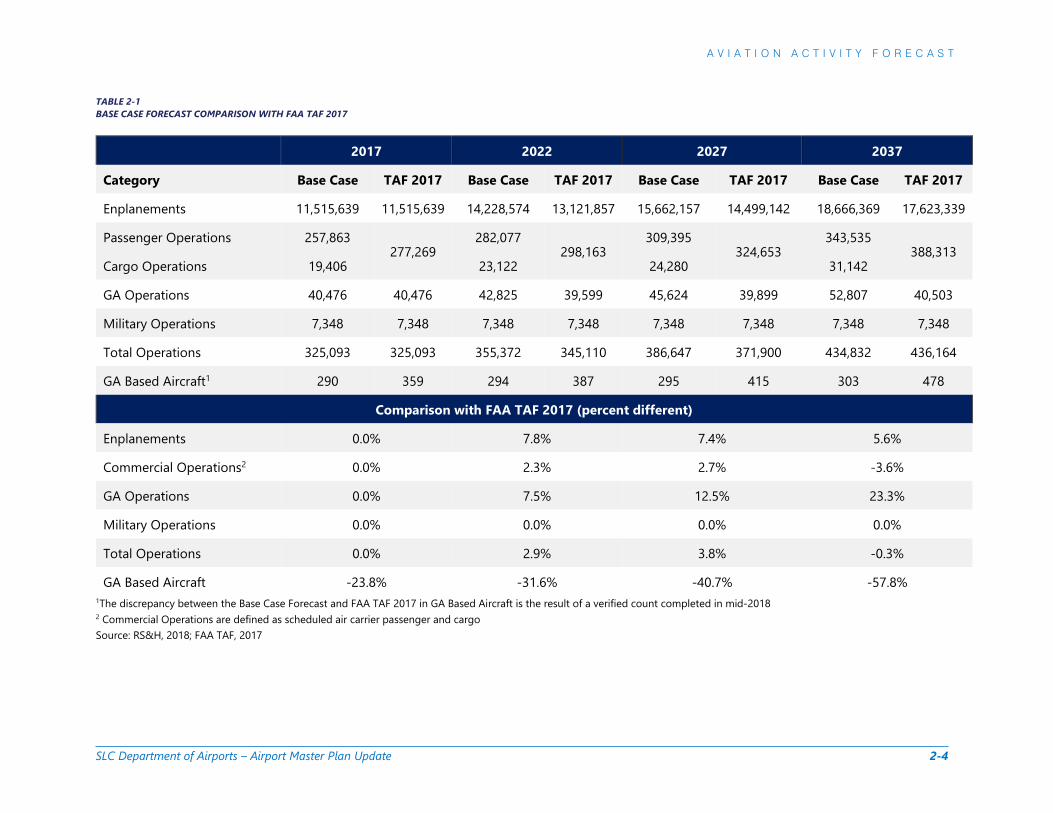
It should be noted that the preferred Base Case Forecast for SLC tracks closely with the current FAA, TAF 2017 published January 2018.) TABLE 2-1 provides a comparison of the SLC Forecast with the FAA TAF 2017. Commercial operations refer to all scheduled and non-scheduled passenger and air cargo operations. As described in the paragraphs below, the long-term number of commercial operations indicated by TAF 2017 is slightly higher than forecast by the Base Case. This is due to assumptions regarding increasing gauge that results in fewer total operations having greater seating configurations and carrying more passengers. In addition, long-term GA operations are projected to slightly increase over TAF 2017 levels, as a result of anticipated increases in the number of turbojet operations, although, piston operations are forecast to decline.
1 The Terminal Area Forecast is the official FAA forecast of aviation activity for United States airports. 2 December 23, 2004, memorandum from the FAA Director, Airport Planning and Programming, entitled Revision to Guidance on Review and Approval of Aviation Forecasts.
A V I A T I O N A C T I V I T Y F O R E C A S T
SLC Department of Airports – Airport Master Plan Update 2-4
TABLE 2-1 BASE CASE FORECAST COMPARISON WITH FAA TAF 2017
2017 2022 2027 2037
Category Base Case TAF 2017 Base Case TAF 2017 Base Case TAF 2017 Base Case TAF 2017
Enplanements 11,515,639 11,515,639 14,228,574 13,121,857 15,662,157 14,499,142 18,666,369 17,623,339
Passenger Operations 257,863 277,269
282,077 298,163
309,395 324,653
343,535 388,313
Cargo Operations 19,406 23,122 24,280 31,142
GA Operations 40,476 40,476 42,825 39,599 45,624 39,899 52,807 40,503
Military Operations 7,348 7,348 7,348 7,348 7,348 7,348 7,348 7,348
Total Operations 325,093 325,093 355,372 345,110 386,647 371,900 434,832 436,164
GA Based Aircraft1 290 359 294 387 295 415 303 478
Comparison with FAA TAF 2017 (percent different)
Enplanements 0.0% 7.8% 7.4% 5.6%
Commercial Operations2 0.0% 2.3% 2.7% -3.6%
GA Operations 0.0% 7.5% 12.5% 23.3%
Military Operations 0.0% 0.0% 0.0% 0.0%
Total Operations 0.0% 2.9% 3.8% -0.3%
GA Based Aircraft -23.8% -31.6% -40.7% -57.8%1The discrepancy between the Base Case Forecast and FAA TAF 2017 in GA Based Aircraft is the result of a verified count completed in mid-2018 2 Commercial Operations are defined as scheduled air carrier passenger and cargo Source: RS&H, 2018; FAA TAF, 2017

A V I A T I O N A C T I V I T Y F O R E C A S T
SLC Department of Airports – Airport Master Plan Update 2-5
2.1.2 SLC Service Area The SLC service area is defined as the maximum boundary from which Airport customers are anticipated to travel, giving consideration for drive time, cost, and the types of services that are unique to SLC over other airports. Defining the service area plays a major role in the forecast, because it determines the values of the socioeconomic variables that will be used in projecting the Airport’s growth. The drive-time analysis assumes people would drive a maximum distance of approximately 120 minutes to reach SLC, based on the size of SLC and the variety of airport services offered there. As a result, the main population center of Salt Lake City3 is included in the Salt Lake Metropolitan Statistical Area4 (MSA) along with three other MSAs that include: Provo-Orem, UT MSA; Ogden-Clearfield, UT MSA; and Logan, UT MSA. It also includes three Micropolitan Statistical Areas5 (MICRO)s: Heber, UT MICRO; Summit Park, UT MICRO; and Evanston, WY MICRO. The counties that are within these statistical areas are identified as the SLC Service Area and used as some of the socioeconomic data for this forecast. FIGURE 2-1 shows the SLC Service Area. A consensus regarding the composition of the SLC Service Area was gained during the Master Plan Update Forecast Expert Panel Session held on August 28, 2018. While additional counties in Utah, Idaho, and Wyoming were discussed as potentially being part of the service area, the decision to exclude them from the analysis centered on including only MSAs and MICROs for which there was more complete data and due to the small additional population those other counties would add, which would not significantly affect the forecast. TABLE 2-2 shows a comparison of key socioeconomic variables for the SLC service area, state of Utah, and the U.S. as a whole. .
3 SLC is located approximately five miles due west and slightly north of downtown Salt Lake City, Utah. 4 Metropolitan Statistical Areas, or MSAs are defined by having at least one urbanized area of 50,000 or more population, plus adjacent territory that has a high degree of social and economic integration with the core as measured by commuting ties 5 Micropolitan Statistical Areas, or MICROs are defined by having at least one urban cluster of at least 10,000 but less than 50,000 population, plus adjacent territory that has a high degree of social and economic integration with the core as measured by commuting ties.

A V I A T I O N A C T I V I T Y F O R E C A S T
SLC Department of Airports – Airport Master Plan Update 2-6
FIGURE 2-1 SLC SERVICE AREA
Source: RS&H, 2018; Esri, 2018

A V I A T I O N A C T I V I T Y F O R E C A S T
SLC Department of Airports – Airport Master Plan Update 2-7
TABLE 2-2 KEY SOCIOECONOMIC VARIABLES PROJECTED (2017-2037)
2017 2022 2027 2037 2018-2037 AAGR
SLC Service Area Total Population 2,707,367 2,903,182 3,110,811 3,539,175 1.4%
Total Employment 1,773,518 1,944,582 2,103,410 2,406,825 1.5% Personal Income Per Capita $46,209 $49,135 $51,532 $55,094 0.9%
Gross Regional Product (millions) $158,355 $177,503 $195,862 $233,343 2.0% State of Utah
Total Population 3,093,435 3,325,603 3,573,578 4,092,861 1.4% Total Employment 1,984,346 2,179,169 2,361,331 2,714,541 1.6%
Personal Income Per Capita $44,506 $47,366 $49,735 $53,269 0.8% Gross Regional Product (millions) $173,547 $194,551 $214,808 $256,479 2.0%
United States
Total Population 325,888,129 341,327,746 357,430,460 389,046,190 0.9% Total Employment 198,989,688 214,599,006 229,158,435 256,758,953 1.3%
Personal Income Per Capita $53,201 $56,915 $60,250 $65,558 1.1% Gross Regional Product (millions) $20,189,355 $22,237,573 $24,257,497 $28,406,746 1.7%
Note AAGRs are rounded to the nearest 0.1% Source: RS&H, 2018; Woods and Poole Inc., 2018
A V I A T I O N A C T I V I T Y F O R E C A S T
SLC Department of Airports – Airport Master Plan Update 2-8
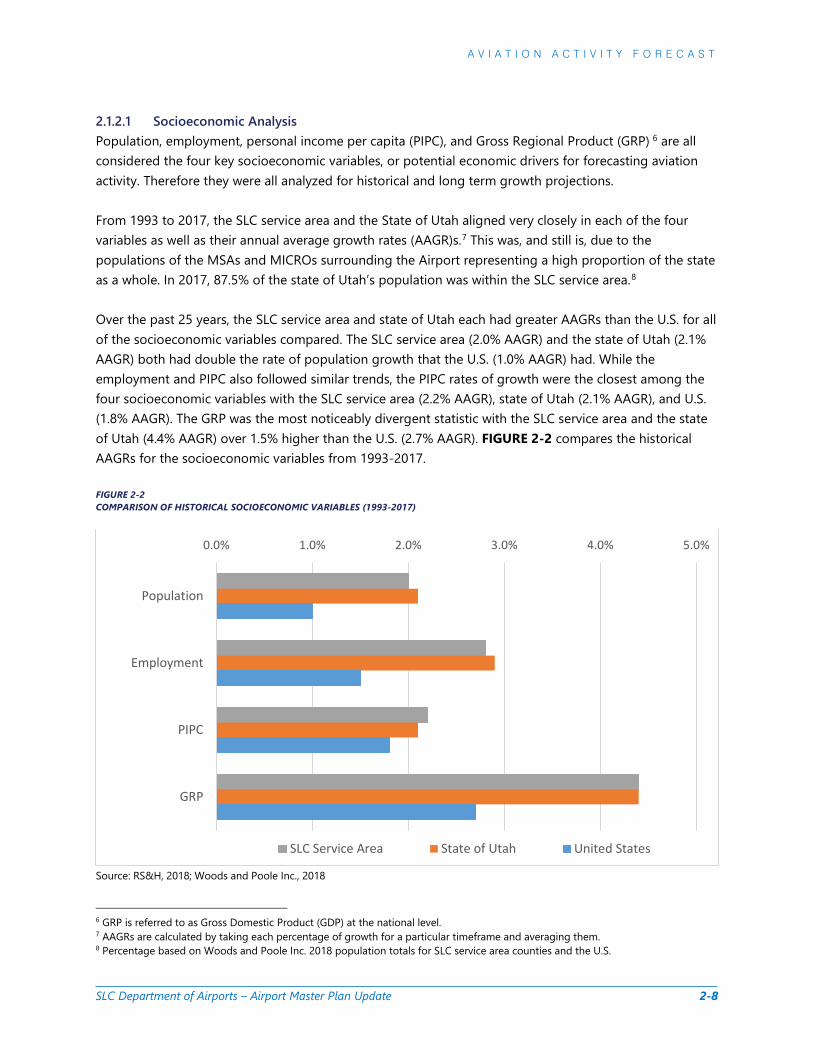
2.1.2.1 Socioeconomic Analysis Population, employment, personal income per capita (PIPC), and Gross Regional Product (GRP) 6 are all considered the four key socioeconomic variables, or potential economic drivers for forecasting aviation activity. Therefore they were all analyzed for historical and long term growth projections.
From 1993 to 2017, the SLC service area and the State of Utah aligned very closely in each of the four variables as well as their annual average growth rates (AAGR)s.7 This was, and still is, due to the populations of the MSAs and MICROs surrounding the Airport representing a high proportion of the state as a whole. In 2017, 87.5% of the state of Utah’s population was within the SLC service area.8
Over the past 25 years, the SLC service area and state of Utah each had greater AAGRs than the U.S. for all of the socioeconomic variables compared. The SLC service area (2.0% AAGR) and the state of Utah (2.1% AAGR) both had double the rate of population growth that the U.S. (1.0% AAGR) had. While the employment and PIPC also followed similar trends, the PIPC rates of growth were the closest among the four socioeconomic variables with the SLC service area (2.2% AAGR), state of Utah (2.1% AAGR), and U.S. (1.8% AAGR). The GRP was the most noticeably divergent statistic with the SLC service area and the state of Utah (4.4% AAGR) over 1.5% higher than the U.S. (2.7% AAGR). FIGURE 2-2 compares the historical AAGRs for the socioeconomic variables from 1993-2017.
FIGURE 2-2 COMPARISON OF HISTORICAL SOCIOECONOMIC VARIABLES (1993-2017)
Source: RS&H, 2018; Woods and Poole Inc., 2018
6 GRP is referred to as Gross Domestic Product (GDP) at the national level. 7 AAGRs are calculated by taking each percentage of growth for a particular timeframe and averaging them. 8 Percentage based on Woods and Poole Inc. 2018 population totals for SLC service area counties and the U.S.
0.0% 1.0% 2.0% 3.0% 4.0% 5.0%
Population
Employment
PIPC
GRP
SLC Service Area State of Utah United States

A V I A T I O N A C T I V I T Y F O R E C A S T
SLC Department of Airports – Airport Master Plan Update 2-9
The projected AAGRs of the SLC service area and state of Utah remained similar over the planning horizon indicating the region is an economic core to the state of Utah and surrounding areas. Like the historical growth rates, the SLC service area projections showed AAGR increases in all of the socioeconomic variables over the planning horizon, with GRP being the greatest. The only variable that shows a projected U.S. AAGR surpassing the SLC service area and the state of Utah is PIPC. FIGURE 2-3 compares the projected socioeconomic variables from 2018-2037. FIGURE 2-3 COMPARISON OF SOCIOECONOMIC VARIABLE PROJECTIONS (2018-2037)
Source: RS&H, 2018; Woods and Poole Inc., 2018
0.0% 1.0% 2.0% 3.0% 4.0% 5.0%
Population
Employment
PIPC
GRP
SLC Service Area State of Utah United States

A V I A T I O N A C T I V I T Y F O R E C A S T
SLC Department of Airports – Airport Master Plan Update 2-10
2.1.2.2 Gross Domestic Product U.S. GDP is one of the variables that correlates very well with long-term growth and is a factor that is often associated with passenger and cargo forecasts. Additional research was preformed regarding other historical estimates and future projections of GDP. Data was available from 1980 with projections beyond 2037 from two sources -- Woods & Poole and Global Insight. Woods & Poole was used as the primary indicator of U.S. GDP and SLC GRP forecasts. Global Insight is used by the FAA in its annual Aerospace Forecasts. Another source consulted was GDP forecasts published by the Congressional Budget Office. Their data was available for the period 2013-2028. An international GDP projection of U.S. GDP published by the Organization for Economic Cooperation and Development (OECD) was also consulted. The OECD is a more than 50-year old organization originally established to plan the most efficient way to use U.S. money from the Marshall Plan to rebuild Europe after World War II. That organization publishes U.S. GDP forecasts from 2014 to beyond 2037. Finally, the U.S. Bureau of Economic Analysis was considered, which provides historical GDP data, going back to 1980. Other sources, including Barclays and the International Monetary Fund, were also investigated but excluded as a result of limited available data. FIGURE 2-4 provides a graph of these GDP forecasts. All annual projections show U.S. GDP growth is expected to peak in 2018 and decrease quickly over the next 5 years to 1.8%-1.4%. In particular, the next 5 years appear to be especially slow growth years with only modest increasing forecasts thereafter; nothing approaching the recent period.
» Woods & Poole’s projections of GDP are highest in 2018 (2.97%) and decline to 1.8% in five years and continues to decline thereafter to less than 1.5% after 2038.
» Global Insight’s peak forecast of GDP over the next 20 years is in 2018 at 2.6% and then declines to 2.0% where it remains constant over to beyond 2037. This forecast is highest over the long term.
» OECD’s estimates of GDP growth indicate the next five years as a trough with a low projection of 1.4% in 2021 followed by a slow growth rebound through 2038 at 1.9%.
» The Congressional Budget Office predicts a 3.3% GDP growth rate for 2018 declining in the next five years to 1.6% and leveling off at approximately 1.9% after ten years.

A V I A T I O N A C T I V I T Y F O R E C A S T
SLC Department of Airports – Airport Master Plan Update 2-11
FIGURE 2-4 COMPARISON OF GROSS DOMESTIC PRODUCT FORECASTS BY VARIOUS SOURCES
Source: Woods & Poole, Inc., 2018; U.S. Bureau of Economic Analysis; Organization for Economic Cooperation and Development, 2018; FAA Aerospace Forecast: FY 2018-2038; U.S. Office of Management and Budget, Congressional Budget Office, 2018
-4.0%
-2.0%
0.0%
2.0%
4.0%
6.0%
8.0%19
8019
8219
8419
8619
8819
9019
9219
9419
9619
9820
0020
0220
0420
0620
0820
1020
1220
1420
1620
1820
2020
2220
2420
2620
2820
3020
3220
3420
36
AGR
Year
Woods & Poole (2018)U.S. Bureau of Economic Analysis (Historical Only)Organization for Economic Cooperations and Development (OECD)(2018)FAA Aerospace Forecasts: Fiscal Years 2018-2038 (Global Insight Forecasts)Office of Management and Budget (OMB) Congressional Budget Office (2018)

A V I A T I O N A C T I V I T Y F O R E C A S T
SLC Department of Airports – Airport Master Plan Update 2-12
2.2 REVIEW OF FORECASTS This section provides an assessment of key reports and documentation used in preparing SLC aviation activity forecasts.
2.2.1 FAA Aerospace Forecast Fiscal Years 2018-2038 The FAA Aerospace Forecast for Fiscal Years 2018-2038 projects steady long term growth for revenue passenger enplanements of U.S. commercial air carriers.9 Revenue passenger enplanements are projected to increase rapidly from FY 2017-2018 for all passenger types with domestic enplanements increasing with an AAGR of 4.7%, international enplanements at an AAGR of 5.0%, and the combined system enplanements at an AAGR of 4.7%. Post-2018 through the end of the planning horizon growth is predicted to level out to an AAGR of 1.7% for domestic, 3.3% AAGR for international, and 1.9% for the system. FIGURE 2-5 shows the projected growth for U.S. domestic, international, and system revenue passenger enplanements over the next 20 years. FIGURE 2-5 PROJECTED REVENUE PASSENGER ENPLANEMENTS FOR U.S. COMMERCIAL AIR CARRIERS (2017-2038)
Note: Totals represent the sum of U.S. Mainline and Regional Air Carriers; Totals are interpolated and rounded using the AAGRs from 2017-2018 and 2018-2038 U.S. Mainline Air Carriers Scheduled Passenger Traffic Table (Table 5) Source: FAA Aerospace Forecasts Fiscal Years 2018-2038; RS&H, 2018
9 Includes both mainline and regional air carriers.
0
200
400
600
800
1,000
1,200
1,400
2017
2018
2019
2020
2021
2022
2023
2024
2025
2026
2027
2028
2029
2030
2031
2032
2033
2034
2035
2036
2037
2038
Enpl
anem
ents
(mill
ions
)
Fiscal Year
Domestic International System

A V I A T I O N A C T I V I T Y F O R E C A S T
SLC Department of Airports – Airport Master Plan Update 2-13
2.2.2 Terminal Area Forecast 2017 (Published January, 2018) and Forecast Report The FAA TAF is the official forecast produced annually by the FAA for U.S. airports. TAF forecasts are prepared to assist in planning efforts and needs of the FAA. Because the TAF is updated annually, a specific forecast may differ from previous years. The TAF is based on the federal fiscal year (FY) which goes from October 1 through September 30, as opposed to calendar year (CY) which begins January 1 and ends December 31. FIGURE 2-6 shows the growth rates per actual year of a selection of TAF forecasts including: preliminary TAF 2018, as well as the current TAF 2017 (which was published in January, 2018), TAF 2016, TAF 2015, TAF 2014, TAF 2010, and TAF 2006. FIGURE 2-6 RECENT TAF FORECAST GROWTH RATES FOR SLC
Note: Growth rates are per actual year of forecast Source: FAA TAF 2006; FAA TAF 2010: FAA TAF 2014; FAA TAF 2015; FAA TAF 2016; FAA TAF 2017; Preliminary FAA TAF 2018
0.00%
1.00%
2.00%
3.00%
4.00%
5.00%
6.00%
7.00%
2000
2001
2002
2003
2004
2005
2006
2007
2008
2009
2010
2011
2012
2013
2014
2015
2016
2017
2018
2019
2020
2021
2022
2023
2024
2025
2026
2027
2028
2029
2030
2031
2032
2033
2034
2035
2036
Annu
al G
row
th R
ates
(AGR
)
Fiscal Year
2006 TAF 2010 TAF 2014 TAF 2015 TAF 2016 TAF 2017 TAF Prelim 2018 TAF
A V I A T I O N A C T I V I T Y F O R E C A S T
SLC Department of Airports – Airport Master Plan Update 2-14
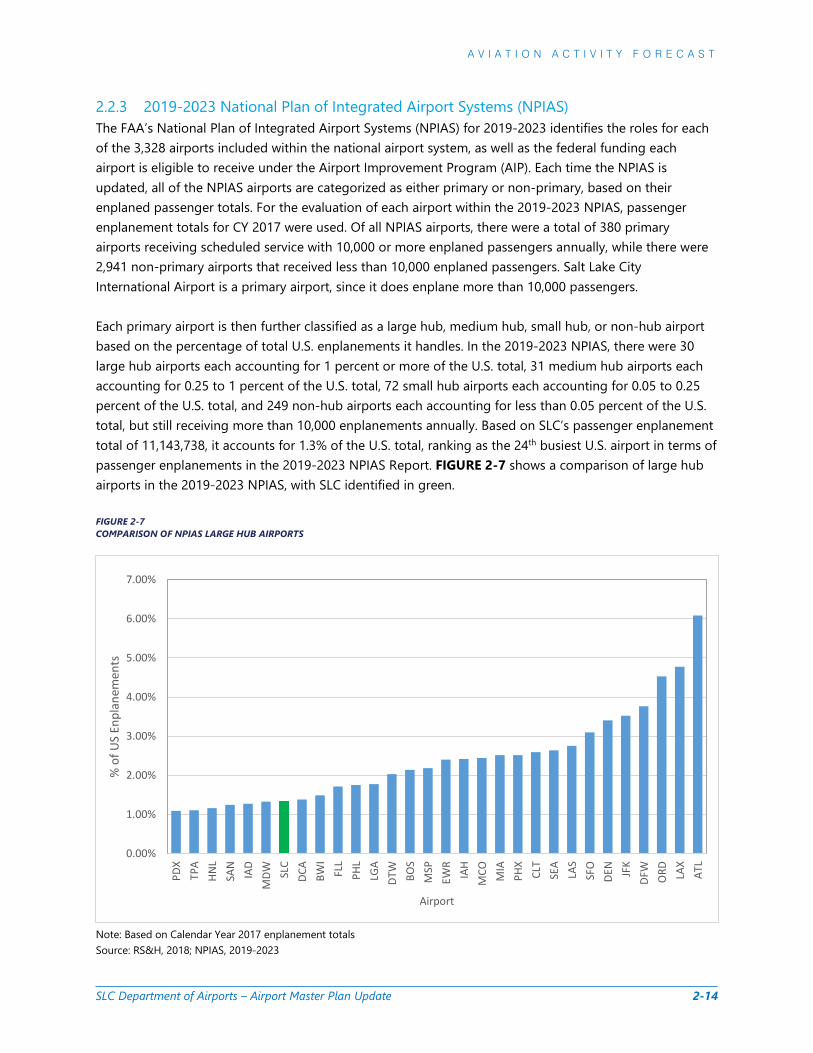
2.2.3 2019-2023 National Plan of Integrated Airport Systems (NPIAS) The FAA’s National Plan of Integrated Airport Systems (NPIAS) for 2019-2023 identifies the roles for each of the 3,328 airports included within the national airport system, as well as the federal funding each airport is eligible to receive under the Airport Improvement Program (AIP). Each time the NPIAS is updated, all of the NPIAS airports are categorized as either primary or non-primary, based on their enplaned passenger totals. For the evaluation of each airport within the 2019-2023 NPIAS, passenger enplanement totals for CY 2017 were used. Of all NPIAS airports, there were a total of 380 primary airports receiving scheduled service with 10,000 or more enplaned passengers annually, while there were 2,941 non-primary airports that received less than 10,000 enplaned passengers. Salt Lake City International Airport is a primary airport, since it does enplane more than 10,000 passengers. Each primary airport is then further classified as a large hub, medium hub, small hub, or non-hub airport based on the percentage of total U.S. enplanements it handles. In the 2019-2023 NPIAS, there were 30 large hub airports each accounting for 1 percent or more of the U.S. total, 31 medium hub airports each accounting for 0.25 to 1 percent of the U.S. total, 72 small hub airports each accounting for 0.05 to 0.25 percent of the U.S. total, and 249 non-hub airports each accounting for less than 0.05 percent of the U.S. total, but still receiving more than 10,000 enplanements annually. Based on SLC’s passenger enplanement total of 11,143,738, it accounts for 1.3% of the U.S. total, ranking as the 24th busiest U.S. airport in terms of passenger enplanements in the 2019-2023 NPIAS Report. FIGURE 2-7 shows a comparison of large hub airports in the 2019-2023 NPIAS, with SLC identified in green. FIGURE 2-7 COMPARISON OF NPIAS LARGE HUB AIRPORTS
Note: Based on Calendar Year 2017 enplanement totals Source: RS&H, 2018; NPIAS, 2019-2023
0.00%
1.00%
2.00%
3.00%
4.00%
5.00%
6.00%
7.00%
PDX
TPA
HNL
SAN
IAD
MDW SL
CDC
ABW
IFL
LPH
LLG
ADT
WBO
SM
SPEW
RIA
HM
CO MIA
PHX
CLT
SEA
LAS
SFO
DEN
JFK
DFW
ORD LA
XAT
L
% o
f US
Enpl
anem
ents
Airport

A V I A T I O N A C T I V I T Y F O R E C A S T
SLC Department of Airports – Airport Master Plan Update 2-15
2.2.4 2006 Salt Lake City International Airport Layout Plan Update The 2006 Salt Lake City International Airport Layout Plan Update produced optimistic and conservative scenario forecasts for enplanement growth through 2025. FIGURE 2-8 shows the two scenarios and compares them to the actual enplanement growth of the Airport through 2017. The conservative scenario forecast aligned closely with the actual enplanement growth through 2010. It should be noted that decline in actual activity was significantly influenced by the 2008 national economic crisis which affected the entire aviation industry. FIGURE 2-8 OPTIMISTIC AND CONSERVATIVE SCENARIOS (2006 SLC AIRPORT LAYOUT PLAN UPDATE)
Source: SLC Master Plan Update, 2006
8,000,000
10,000,000
12,000,000
14,000,000
16,000,000
18,000,000
20,000,000
22,000,000
2005
2006
2007
2008
2009
2010
2011
2012
2013
2014
2015
2016
2017
2018
2019
2020
2021
2022
2023
2024
2025
Enpl
anem
ents
Calendar Year
Optimistic Scenario Conservative Scenario Actual

A V I A T I O N A C T I V I T Y F O R E C A S T
SLC Department of Airports – Airport Master Plan Update 2-16
2.2.5 Utah Continuous Airport System Plan The 2007 Utah Continuous Airport System Plan (UCASP) identifies SLC as the sole international airport in the state of Utah, providing essential national and international commercial airline service. The last UCASP update in 2007 forecast an AAGR of 0.9% for commercial operations, and 1.2% for total passenger enplanements through 2026. FIGURE 2-9 shows the projected enplanements and commercial operations for SLC through 2026, as well as the actual totals during that timeframe. As with the forecast of enplanements, actual activity was negatively impacted by the 2008 national economic crisis. FIGURE 2-9 2007 UCASP FORECAST FOR COMMERICAL OPERATIONS AND ENPLANEMENTS IN UTAH
Note: Values are interpolated and rounded using the UCASP AAGR for commercial operations (0.89%) and enplanements (1.23%) Source: RS&H, 2018; UCASP Executive Summary, 2007; FAA TAF, 2017 (State of Utah Summary)
The 2007 UCASP also recognized multiple factors that could influence aviation demand in Utah including:
» Transportation improvements
» Tourism
» Oil/Gas
» Retirements/Second homes
» Population growth
» Employment growth
0
50,000
100,000
150,000
200,000
250,000
300,000
350,000
400,000
450,000
2006
2007
2008
2009
2010
2011
2012
2013
2014
2015
2016
2017
2018
2019
2020
2021
2022
2023
2024
2025
2026
0
2,000,000
4,000,000
6,000,000
8,000,000
10,000,000
12,000,000
14,000,000
16,000,000
18,000,000
20,000,000
Com
mer
cial
Ope
ratio
ns
Year
Enpl
anem
ents
UCASP Projected Enplanements Actual EnplanementsUCASP Projected Commercial Operations Actual Commercial Operations

A V I A T I O N A C T I V I T Y F O R E C A S T
SLC Department of Airports – Airport Master Plan Update 2-17
2.2.6 Expert Panel The SLCDA established a committee composed of technical persons knowledgeable of aviation industry trends to critique the draft forecast prepared for the Airport. This committee, or Expert Panel, included individuals representing the FAA, Utah Division of Aeronautics, airlines interests including Delta, Economic Development Corporation of Utah, Utah Governor’s Office of Economic Development, and executive SLCDA Staff.
An Expert Panel meeting was held on August 28, 2018. The consultant provided a presentation of historical Airport, airline, passenger, cargo, general aviation, and military trends as well as the input that would be used in developing a base case passenger enplanement forecast and derivative forecasts of lower and higher scenarios.
Numerous comments were provided by the Expert Panel members to help guide forecast development. Comments received from the panel included:
» SkyWest enplanement shares should be broken down by affiliated mainline carriers (American, Alaska, Delta, and United) and separate from SkyWest only operations
» Discussion of future growth in domestic and international markets and the aircraft that would serve them was provided
» Consensus was reached that SLC anticipated growth of four percent would be achieved over the next four-to-five years
» The general forecast methodology is sound and the macro/micro areas considered to be representative of the SLC Market Service Area is appropriate
» Utah population growth is quite different than much of the US total population
» Commenting about the uniqueness of SLC traffic patterns showing upgauging to support west coast airports and the paradigm shifts effects on near term growth
» General trends that will likely result in only having 20 to 30 Regional Jet operations per day by 2030 having seats of 60 or fewer passengers
» Acknowledging the benefits of the new airport terminal, its favorable cost model, and the competitive advantage it gives SLC over competitive airports like Denver International Airport (DEN), Phoenix Sky Harbor International Airport (PHX), and Dallas-Fort Worth International Airport (DFW).

A V I A T I O N A C T I V I T Y F O R E C A S T
SLC Department of Airports – Airport Master Plan Update 2-18
2.2.7 Passenger Aircraft Fleet Mix-Baseline 2017 The passenger aircraft10 fleet mix baseline list identifies the most commonly used passenger aircraft11 at SLC for 2017. Further details on the number of operations of each aircraft compared to the passenger aircraft operations as a whole can be found in Appendix C.
Airbus
» Airbus 319-100
» Airbus 320-200
» Airbus 321-200
» Airbus 300-600
» Airbus 330-200, -300
Boeing
» Boeing 717-200
» Boeing 737-700, -800, -900
» Boeing 757-200
» Boeing 767-300
» Boeing 787-900
Bombardier
» Bombardier CRJ 200
» Bombardier CRJ 700
» Bombardier CRJ 900
» Bombardier Dash 8 (Q400)
Embraer
» Embraer 170
» Embraer 175-L, -S
McDonnell-Douglas (Boeing)
» McDonnell Douglas MD-90
» McDonnell Douglas DC-10
» McDonnell Douglas MD-11
10 For this forecast, the term “passenger aircraft” or “passenger operations” refers to the sum of total of air carrier and air taxi & commuter aircraft types operating out of SLC. 11 “Most commonly used passenger aircraft” refers to those aircraft with at least 1,000 operations in FY 2017, however this list it is not meant to limit or omit any the other passenger aircraft fleet used out of SLC.

A V I A T I O N A C T I V I T Y F O R E C A S T
SLC Department of Airports – Airport Master Plan Update 2-19
2.3 HISTORICAL OPERATIONS
2.3.1.1 Historical Total Operations Over the past 15 years, the total operations from SLC have decreased by over 75,000. During that time the largest contributors to the decline were decreases in air taxi & commuter (-5.1% AAGR)12; this categories includes commuter jets having fewer than 60 seats, e.g., CRJ-200. General Aviation (GA) operations (-4.1% AAGR) reflects declining of piston engine operations. In contrast, air carrier13 operations (2.4% AAGR) increased from 146,598 to 209,203 during those 15 years to offset some of the decline. FIGURE 2-10 shows the historical distribution of total airport operations from 2003-2017.
2.3.1.2 Historical Passenger Operations In 2003, the distribution of passenger operations14 by type as indicated in the FAA TAF was nearly an even split, with air taxi & commuter representing 52.5%, and air carrier representing 47.5% of the total. Since that time, air carrier activity increased from 146,598 to 209,203 flights, representing 75.5% of total passenger share; and air taxi & commuter decreased from 164,914 to 68,066, representing a 24.5% share of passenger operations. This shift in operations is largely due to evolving airline business strategies in which high frequency routes currently served by small aircraft are being served by larger aircraft flying less often. FIGURE 2-11 shows the historical distribution of passenger operations from 2003-2017.
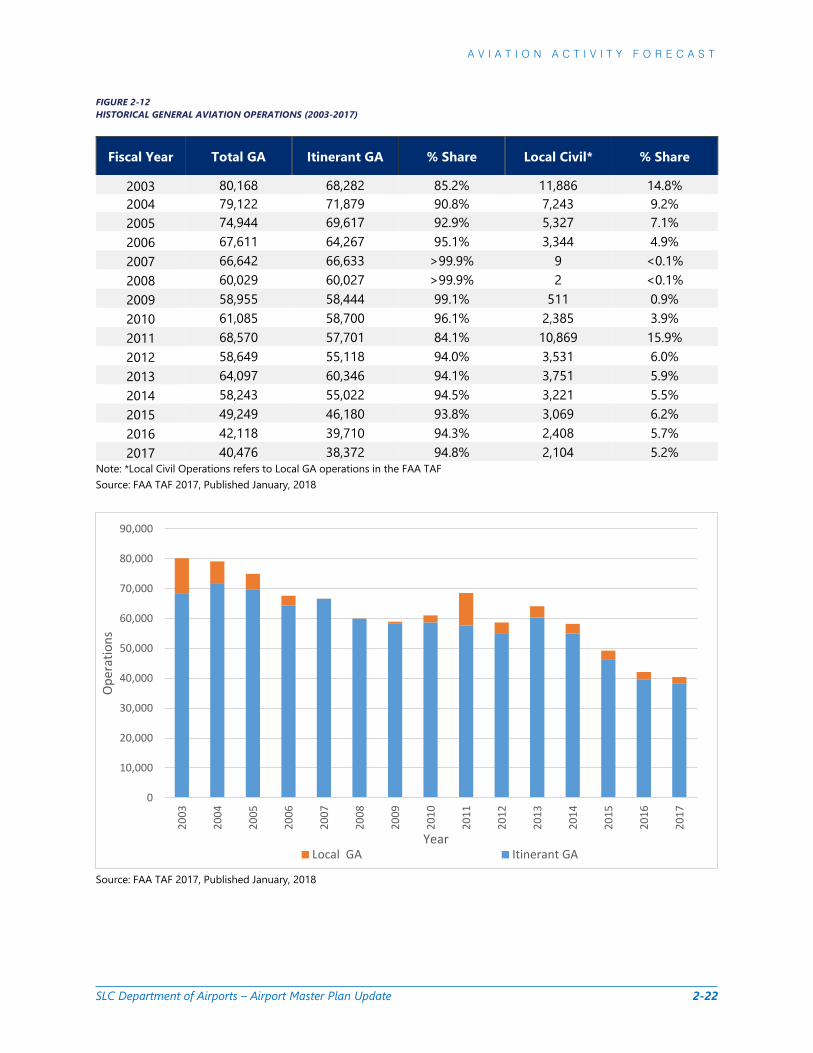
2.3.1.3 Historical General Aviation Operations Itinerant GA operations predominate over local operations at SLC. Historically from 2003-2017, the itinerant GA operations have averaged 93% of all GA operations annually. FIGURE 2-12 shows the historical distribution of operations from 2003-2017.
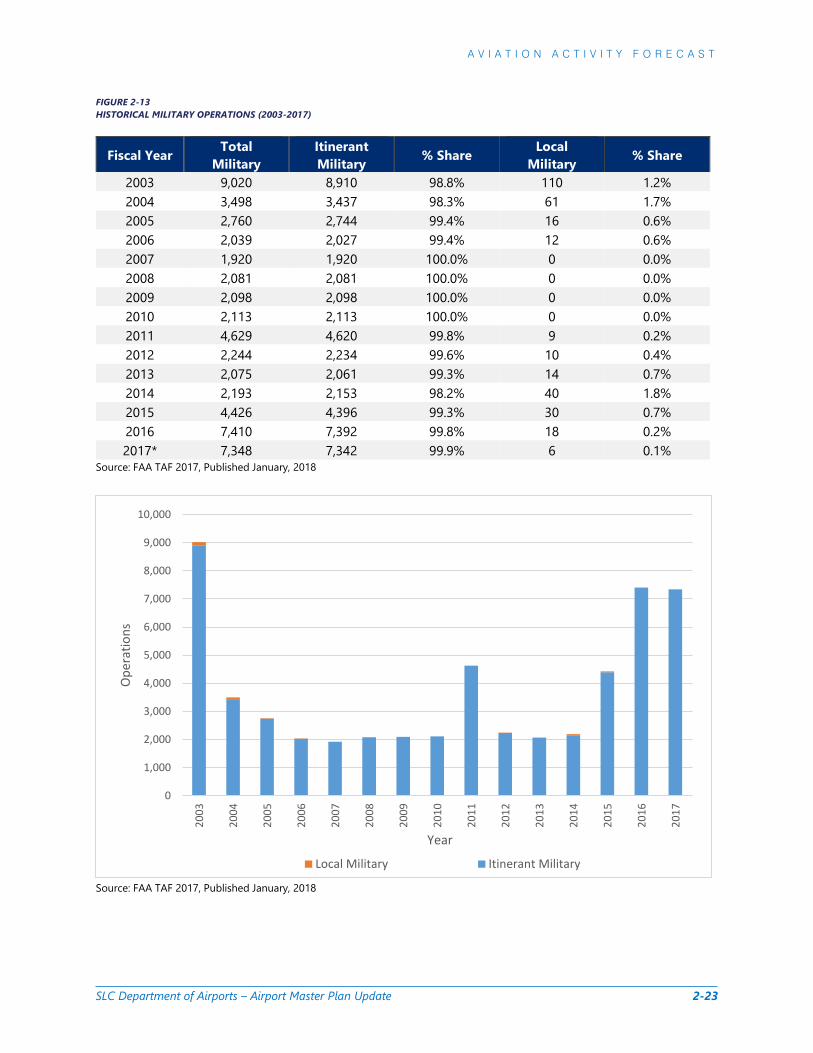
2.3.1.4 Historical Military Operations Historical military operations provide a view of how active military aircraft operate out of SLC. Much like GA, the historical military operations are very much one sided with the majority of operations being itinerant. Over the past 15 years, itinerant military operations have never represented less than 98.2% of military operations. The total military operations have decreased from 9,020 in 2003, to 7,348 in 2017. FIGURE 2-13 shows the historical distribution of total military operations from 2003-2017.
2.3.1.5 Detail 2017 Fleet Mix Appendix C provides a detail listing of the aircraft model types that operated at SLC in 2017. This data was derived from the FAA’s National Offload Program (NOP) for aircraft activity and comprises 91% of all operations. It, however, does not include military or helicopter operations. Appendix C included military and helicopter operations as a result of coordinating with the FAA Airport Traffic Control Tower (ATCT) and Fixed Base Operators (FBOs). The 325,093 operations represented in this table is the same as the FAA TAF 2017 number of operations for SLC.
12 Air taxi and commuter operations are those with less than 60 passenger seats or a cargo payload of less than 18,000 pounds. These can include aircraft such as the Embraer 120 or Cessna 208. 13 Includes air cargo operations. 14 For this forecast, passenger operations refer to the combined total of air carrier and air taxi & commuter operations.

A V I A T I O N A C T I V I T Y F O R E C A S T
SLC Department of Airports – Airport Master Plan Update 2-20
FIGURE 2-10 HISTORICAL TOTAL OPERATIONS (2003-2017)
FY Total Operations
Air Carrier
Air Taxi & Commuter
Total GA
Total Military
2003 400,700 146,598 164,914 80,168 9,020 2004 411,785 132,072 197,093 79,122 3,498 2005 446,926 158,880 210,342 74,944 2,760 2006 426,350 165,632 191,068 67,611 2,039 2007 422,297 165,306 188,429 66,642 1,920 2008 402,424 172,208 168,106 60,029 2,081 2009 374,004 172,481 140,470 58,955 2,098 2010 366,785 178,513 125,074 61,085 2,113 2011 364,839 178,563 113,077 68,570 4,629 2012 330,023 175,449 93,681 58,649 2,244 2013 331,008 175,921 88,915 64,097 2,075 2014 325,115 178,093 86,586 58,243 2,193 2015 315,338 184,011 77,652 49,249 4,426 2016 318,285 194,767 73,990 42,118 7,410 2017 325,093 209,203 68,066 40,476 7,348
Average Annual Growth Rate (AAGR) 2003-2017 -1.3% 2.4% -5.1% -4.1% 7.7%
Source: FAA TAF 2017, Published January, 2018
Source: FAA TAF 2017, Published January, 2018
0
50,000
100,000
150,000
200,000
250,000
300,000
350,000
400,000
450,000
500,000
2003
2004
2005
2006
2007
2008
2009
2010
2011
2012
2013
2014
2015
2016
2017
Ope
ratio
ns
YearAir Carrier Air Taxi & Commuter Total GA Total Military

A V I A T I O N A C T I V I T Y F O R E C A S T
SLC Department of Airports – Airport Master Plan Update 2-21
FIGURE 2-11 HISTORICAL PASSENGER OPERATIONS (2003-2017)
FY Total Air Carrier % Share Air Taxi & Commuter % Share
2003 311,512 146,598 47.1% 164,914 52.9% 2004 329,165 132,072 40.1% 197,093 59.9% 2005 369,222 158,880 43.0% 210,342 57.0% 2006 356,700 165,632 46.4% 191,068 53.6% 2007 353,735 165,306 46.7% 188,429 53.3% 2008 340,314 172,208 50.6% 168,106 49.4% 2009 312,951 172,481 55.1% 140,470 44.9% 2010 303,587 178,513 58.8% 125,074 41.2% 2011 291,640 178,563 61.2% 113,077 38.8% 2012 269,130 175,449 65.2% 93,681 34.8% 2013 264,836 175,921 66.4% 88,915 33.6% 2014 264,679 178,093 67.3% 86,586 32.7% 2015 261,663 184,011 70.3% 77,652 29.7% 2016 268,757 194,767 72.5% 73,990 27.5% 2017 277,269 209,203 75.5% 68,066 24.5%
Source: FAA TAF 2017, Published January, 2018
Source: FAA TAF 2017, Published January, 2018
0
50,000
100,000
150,000
200,000
250,000
300,000
350,000
400,000
2003
2004
2005
2006
2007
2008
2009
2010
2011
2012
2013
2014
2015
2016
2017
Ope
ratio
ns
YearAir Taxi & Commuter Air Carrier
A V I A T I O N A C T I V I T Y F O R E C A S T
SLC Department of Airports – Airport Master Plan Update 2-22
FIGURE 2-12 HISTORICAL GENERAL AVIATION OPERATIONS (2003-2017)
Fiscal Year Total GA Itinerant GA % Share Local Civil* % Share
2003 80,168 68,282 85.2% 11,886 14.8% 2004 79,122 71,879 90.8% 7,243 9.2% 2005 74,944 69,617 92.9% 5,327 7.1% 2006 67,611 64,267 95.1% 3,344 4.9% 2007 66,642 66,633 >99.9% 9 <0.1% 2008 60,029 60,027 >99.9% 2 <0.1% 2009 58,955 58,444 99.1% 511 0.9% 2010 61,085 58,700 96.1% 2,385 3.9% 2011 68,570 57,701 84.1% 10,869 15.9% 2012 58,649 55,118 94.0% 3,531 6.0% 2013 64,097 60,346 94.1% 3,751 5.9% 2014 58,243 55,022 94.5% 3,221 5.5% 2015 49,249 46,180 93.8% 3,069 6.2% 2016 42,118 39,710 94.3% 2,408 5.7% 2017 40,476 38,372 94.8% 2,104 5.2%
Note: *Local Civil Operations refers to Local GA operations in the FAA TAF Source: FAA TAF 2017, Published January, 2018
Source: FAA TAF 2017, Published January, 2018
0
10,000
20,000
30,000
40,000
50,000
60,000
70,000
80,000
90,000
2003
2004
2005
2006
2007
2008
2009
2010
2011
2012
2013
2014
2015
2016
2017
Ope
ratio
ns
YearLocal GA Itinerant GA
A V I A T I O N A C T I V I T Y F O R E C A S T
SLC Department of Airports – Airport Master Plan Update 2-23
FIGURE 2-13 HISTORICAL MILITARY OPERATIONS (2003-2017)
Fiscal Year Total Military
Itinerant Military % Share Local
Military % Share
2003 9,020 8,910 98.8% 110 1.2% 2004 3,498 3,437 98.3% 61 1.7% 2005 2,760 2,744 99.4% 16 0.6% 2006 2,039 2,027 99.4% 12 0.6% 2007 1,920 1,920 100.0% 0 0.0% 2008 2,081 2,081 100.0% 0 0.0% 2009 2,098 2,098 100.0% 0 0.0% 2010 2,113 2,113 100.0% 0 0.0% 2011 4,629 4,620 99.8% 9 0.2% 2012 2,244 2,234 99.6% 10 0.4% 2013 2,075 2,061 99.3% 14 0.7% 2014 2,193 2,153 98.2% 40 1.8% 2015 4,426 4,396 99.3% 30 0.7% 2016 7,410 7,392 99.8% 18 0.2% 2017* 7,348 7,342 99.9% 6 0.1%
Source: FAA TAF 2017, Published January, 2018
Source: FAA TAF 2017, Published January, 2018
0
1,000
2,000
3,000
4,000
5,000
6,000
7,000
8,000
9,000
10,000
2003
2004
2005
2006
2007
2008
2009
2010
2011
2012
2013
2014
2015
2016
2017
Ope
ratio
ns
Year
Local Military Itinerant Military
A V I A T I O N A C T I V I T Y F O R E C A S T
SLC Department of Airports – Airport Master Plan Update 2-24
2.4 PASSENGER ENPLANEMENTS
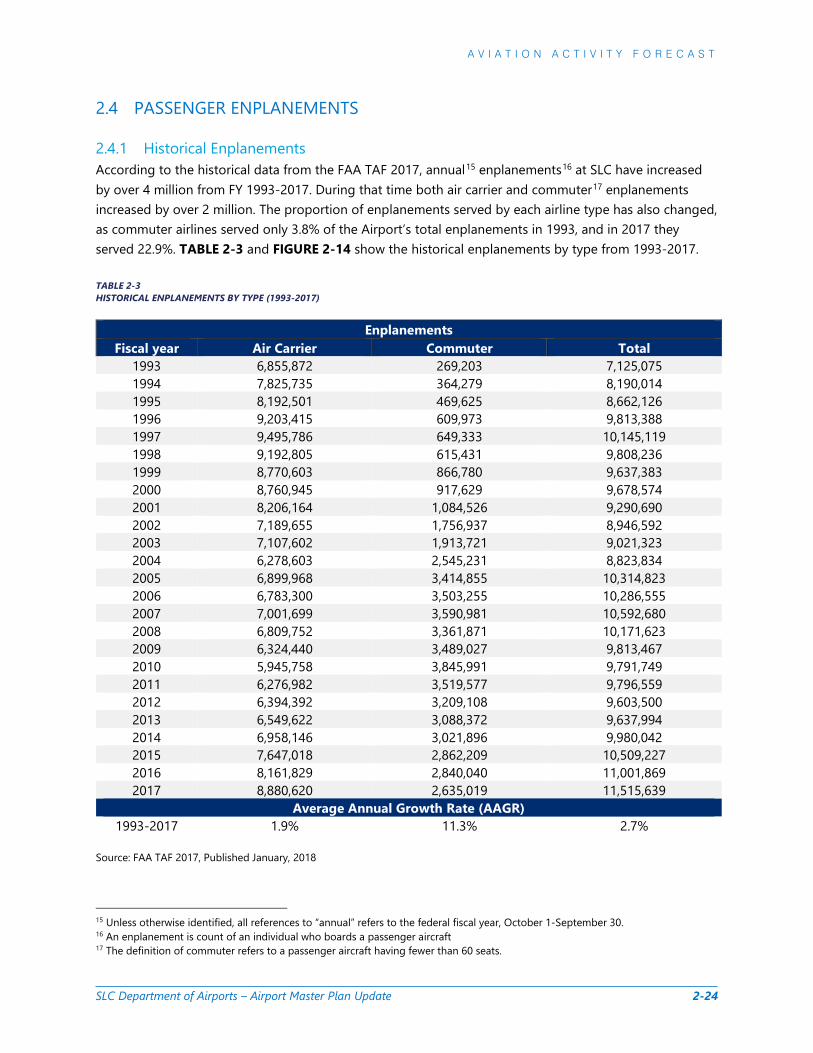
2.4.1 Historical Enplanements According to the historical data from the FAA TAF 2017, annual15 enplanements16 at SLC have increased by over 4 million from FY 1993-2017. During that time both air carrier and commuter17 enplanements increased by over 2 million. The proportion of enplanements served by each airline type has also changed, as commuter airlines served only 3.8% of the Airport’s total enplanements in 1993, and in 2017 they served 22.9%. TABLE 2-3 and FIGURE 2-14 show the historical enplanements by type from 1993-2017. TABLE 2-3 HISTORICAL ENPLANEMENTS BY TYPE (1993-2017)
Enplanements Fiscal year Air Carrier Commuter Total
1993 6,855,872 269,203 7,125,075 1994 7,825,735 364,279 8,190,014 1995 8,192,501 469,625 8,662,126 1996 9,203,415 609,973 9,813,388 1997 9,495,786 649,333 10,145,119 1998 9,192,805 615,431 9,808,236 1999 8,770,603 866,780 9,637,383 2000 8,760,945 917,629 9,678,574 2001 8,206,164 1,084,526 9,290,690 2002 7,189,655 1,756,937 8,946,592 2003 7,107,602 1,913,721 9,021,323 2004 6,278,603 2,545,231 8,823,834 2005 6,899,968 3,414,855 10,314,823 2006 6,783,300 3,503,255 10,286,555 2007 7,001,699 3,590,981 10,592,680 2008 6,809,752 3,361,871 10,171,623 2009 6,324,440 3,489,027 9,813,467 2010 5,945,758 3,845,991 9,791,749 2011 6,276,982 3,519,577 9,796,559 2012 6,394,392 3,209,108 9,603,500 2013 6,549,622 3,088,372 9,637,994 2014 6,958,146 3,021,896 9,980,042 2015 7,647,018 2,862,209 10,509,227 2016 8,161,829 2,840,040 11,001,869 2017 8,880,620 2,635,019 11,515,639
Average Annual Growth Rate (AAGR) 1993-2017 1.9% 11.3% 2.7%
Source: FAA TAF 2017, Published January, 2018
15 Unless otherwise identified, all references to “annual” refers to the federal fiscal year, October 1-September 30. 16 An enplanement is count of an individual who boards a passenger aircraft 17 The definition of commuter refers to a passenger aircraft having fewer than 60 seats.

A V I A T I O N A C T I V I T Y F O R E C A S T
SLC Department of Airports – Airport Master Plan Update 2-25
FIGURE 2-14 HISTORICAL ENPLANEMENT BREAKDOWN (1993-2017)
Source: FAA TAF 2017, Published January, 2018
2.4.1.1 Origination & Destination and Connecting Enplanements Enplanements can be classified by passenger types, in reference to the Airport’s role within their itinerary. These passenger types include origin & destination (O&D) and connecting enplanements. O&D enplanements represent the passengers that enplane/deplane a commercial aircraft beginning or ending their itinerary at SLC. These passengers may travel nonstop, or connect at other airports domestically and internationally before reaching their final destination. Meanwhile, connecting passengers begin their itinerary at a different airport, and connect in SLC and possibly other airports before reaching their final destination. As a connecting airport, SLC acts as a middle segment to a passenger’s trip. Enplanement type distribution ratios are essential, because they provide valuable information to determine the facilities that will be necessary to accommodate the needs of each enplanement type. TABLE 2-4 shows a historical summary of the total enplanements, and ratios of O&D and connecting enplanements from 1993-2017. Historically, the Airport has fluctuated around the 50% mark for both O&D and connecting enplanements. More recently, the trend has seen O&D enplanements increasing at a higher rate (AAGR of 3.6%) than connecting enplanements which increased at an AAGR of 0.8% from 1993-2017. From 2013-2017, the Airport proportion of O&D and connecting enplanements changed by 7.3% resulting in base year 2017 in which SLC had its highest percentage of O&D enplanements (61.4%), and lowest percentage of connecting enplanements (38.6%) over the past 25 years.
0
2,000,000
4,000,000
6,000,000
8,000,000
10,000,000
12,000,000
14,000,000
1993
1994
1995
1996
1997
1998
1999
2000
2001
2002
2003
2004
2005
2006
2007
2008
2009
2010
2011
2012
2013
2014
2015
2016
2017
Enpl
anem
ents
Fiscal Year
Total Air Carrier Commuter

A V I A T I O N A C T I V I T Y F O R E C A S T
SLC Department of Airports – Airport Master Plan Update 2-26
Delta Air Lines (DL) has been the largest operating commercial airline out of SLC for the past 25+ years. As the most prominent air carrier at SLC, its own O&D and connecting activities greatly affect the Airport’s passenger type distribution. During the past five years, DL has decreased its connections and become more even in its distribution of O&D and connecting enplanements. At the same time, other airlines operating out of SLC have shown an increase in O&D enplanements resulting in lower connecting proportions. FIGURE 2-15 compares DL’s contribution to the total enplanements at SLC with the rest of the commercial passenger airlines as a whole from 2013-2017.18 TABLE 2-4 HISTORICAL ENPLANEMENT DISTRIBUTION (1993-2017)
FY Origin & Destination (O&D) Connecting
% Enplanements % Enplanements 1993 44.3% 3,156,408 55.7% 3,968,667 1998 48.5% 4,756,994 51.5% 5,051,242 2003 50.8% 4,582,832 49.2% 4,438,491 2008 55.3% 5,620,821 44.7% 4,550,802 2009 52.2% 5,119,439 47.8% 4,694,028 2010 51.3% 5,019,406 48.7% 4,772,343 2011 52.3% 5,121,099 47.7% 4,675,460 2012 53.6% 5,143,580 46.4% 4,459,920 2013 54.1% 5,214,155 45.9% 4,423,839 2014 54.2% 5,406,189 45.8% 4,573,853 2015 56.1% 5,896,727 43.9% 4,612,500 2016 57.4% 6,312,872 42.6% 4,688,997 2017 61.4% 7,065,996 38.6% 4,449,643
Enplanement Average Annual Growth Rate (AAGR) 1993-1997 11.9% 7.4% 1998-2002 -1.7% -3.1% 2003-2007 4.5% 3.1% 2008-2017 2.5% -1.1% 1993-2017 3.60% 0.77%
Note: O&D and Connecting Enplanements were interpolated using connecting percentages from the 2006 Salt Lake City Master Plan Update and T-100 Airline Market Data from 2005-2012 and the FAA TAF 2018 Source: Bureau of Transportation Statistics T-100 segment data, 2005-2017; 2005-2012; Salt Lake City Master Plan Update, 2006 (data for years 1993-2004)
18 Analysis of O&D and connecting passengers includes connecting passengers among interline carriers as a part of the mainline carrier statistic.

A V I A T I O N A C T I V I T Y F O R E C A S T
SLC Department of Airports – Airport Master Plan Update 2-27
FIGURE 2-15 HISTORICAL O&D AND CONNECTING ENPLANEMENTS (2013-2017)
Source: Bureau of Transportation Statistics T-100 segment data, 2013-2017
Delta Air Lines Other Airlines All Airlines Fiscal Year O&D Connecting Total O&D Connecting Total O&D Connecting Total
2013 1,989,061 3,536,473 5,525,534 3,195,702 862,525 4,058,227 5,184,763 4,398,998 9,583,761 2014 2,005,015 3,768,784 5,773,799 3,391,844 796,810 4,188,654 5,396,859 4,565,594 9,962,453 2015 2,242,318 4,001,808 6,244,126 3,670,263 623,732 4,293,995 5,912,581 4,625,540 10,538,121 2016 2,449,728 4,103,010 6,552,738 3,850,978 576,397 4,427,375 6,300,706 4,679,407 10,980,113 2017 3,007,367 4,024,807 7,032,174 4,057,990 424,847 4,482,837 7,065,357 4,449,654 11,515,011
Source: Bureau of Transportation Statistics T-100 segment data, 2013-2017
O&D54.1%
Connect45.9% O&D
54.2%
Connect45.8% O&D
56.1%
Connect 43.9% O&D
57.4%
Connect42.6% O&D
61.4%
Connect 38.6%
O&D36.0%
Connect64.0%
O&D78.7%
Connect21.3% O&D
34.7%
Connect65.3%
O&D81.0%
Connect19.0% O&D
35.9%Connect64.1%
O&D85.5%
Connect14.5% O&D
37.4%
Connect62.6%
O&D87.0%
Connect13.0%
O&D42.8%Connect
57.2% O&D90.5%
Connect9.5%
2013 Passenger Breakdown
2014 Passenger Breakdown
2015 Passenger Breakdown
2016 Passenger Breakdown
2017 Passenger Breakdown
Delta Air Lines
Delta Air Lines
Delta Air Lines
Delta Air Lines
Delta Air Lines
Other Airlines
Other Airlines
Other Airlines
Other Airlines
Other Airlines

A V I A T I O N A C T I V I T Y F O R E C A S T
SLC Department of Airports – Airport Master Plan Update 2-28
2.4.1.2 Domestic and International Enplanements Domestic O&D passengers begin or end their itinerary at SLC, and travel to or from a domestic destination. These passengers fly nonstop or connect through various locations. The connecting domestic passengers are those that originate their travel at an airport other than SLC, connect at SLC, and continue to another domestic airport upon departing from SLC. In either case, SLC acts as a middle segment of a domestic itinerary. TABLE 2-5 ranks the top 25 domestic O&D destinations by total enplaned and deplaned O&D passengers for FY 2017. Three types of international travelers were defined based on the Bureau of Transportation Statistics (BTS) T-100 segment market data.19 The first group was identified as nonstop international O&D enplanements. The nonstop international O&D enplanements include those individuals that were on nonstop flights out of SLC, to any of the destinations at which the Airport provides nonstop international service. The second group is also identified as international O&D enplanements, but is different from the first because they included various connecting segments. These enplanements include passengers that began their trip in SLC, before connecting to other airports (both domestic and international), upon reaching their final international destination. TABLE 2-6 ranks the top 25 international destinations by the total enplaned and deplaned O&D passenger counts for FY 2017. The last group is identified as connecting international passengers. These passengers all connect at SLC for one of their middle segments on their international trip. TABLE 2-7 provides an alternative way to view the top 25 international O&D destinations as compared to the previous table, by adding in total connecting passengers to establish a final total of international passengers to each market. FIGURE 2-16 provides a map of these top international markets from 2017. An analysis of these three types of international enplanements out of SLC for FY 2013-2017 found that the domestic percentage of O&D versus connecting enplanements were very similar. As a result, for planning purposes, it was determined to use the same O&D/connecting percentages for both domestic and international enplanements in this forecast. This does not have any impact upon the Facility Requirements that would be generated from these forecasts.
19 T-100 segment market data, also known as the Air Carrier Statistics database, contains certificated monthly reports of domestic and international airline market and segment data.

A V I A T I O N A C T I V I T Y F O R E C A S T
SLC Department of Airports – Airport Master Plan Update 2-29
TABLE 2-5 TOP 25 DOMESTIC DESTINATIONS BY O&D PASSENGERS (2013-2017)
2017 Top 25 Domestic Departures and Arrivals Locations
IATA Code
Total Enplaned and Deplaned Passengers 2013 2014 2015 2016 2017
1 Los Angeles, California LAX 495,880 377,700 630,080 700,790 717,260 2 Denver, Colorado DEN 538,180 407,420 503,110 499,290 605,370 3 Phoenix, Arizona PHX 470,130 330,420 518,150 522,070 562,810 4 Seattle, Washington SEA 370,930 304,130 398,770 427,310 441,150 5 Las Vegas, Nevada LAS 350,380 262,920 391,550 424,780 423,070 6 Long Beach, California LGB 295,460 223,530 299,670 339,990 419,570 7 San Diego, California SAN 250,170 210,970 371,520 363,040 409,870 8 New York, New York (JFK International) JFK 318,670 211,310 310,730 330,930 360,740 9 Dallas-Fort Worth, Texas DFW 240,560 184,970 254,300 291,740 348,270 10 Chicago, Illinois (O'Hare International) ORD 187,220 132,990 292,540 325,040 338,410 11 Orlando, Florida (Orlando International) MCO 176,830 142,740 277,490 327,710 329,010 12 Portland, Oregon PDX 251,900 215,160 280,660 310,990 324,410 13 Oakland, California OAK 293,770 216,690 332,130 318,870 307,660 14 San Francisco, California SFO 166,150 153,110 299,970 308,360 307,650 15 San Jose, California SJC 92,770 93,530 150,610 180,660 287,100 16 Atlanta, Georgia ATL 213,700 158,830 244,130 253,720 284,720 17 Boston, Massachusetts BOS 153,700 124,420 176,980 224,500 275,480 18 Minneapolis, Minnesota MSP 141,230 116,000 168,030 174,200 187,530 19 Houston, Texas (Bush Intercontinental) IAH 153,900 126,600 197,140 187,150 186,520 20 Santa Ana, California SNA 194,350 124,270 158,750 170,870 186,380 21 Baltimore, Maryland BWI 146,610 124,600 195,270 194,120 182,500 22 Washington D.C. (Reagan National) DCA 139,280 109,280 160,980 179,970 174,340 23 Sacramento, California SMF 103,330 83,870 110,450 126,960 168,120 24 Newark, New Jersey EWR 112,300 70,320 104,950 117,600 157,950 25 Philadelphia, Pennsylvania PHL 112,370 86,290 124,190 134,870 149,210
Source: Bureau of Transportation Statistics T-100 segment data, 2013-2017 1 2 3 4 5 6

A V I A T I O N A C T I V I T Y F O R E C A S T
SLC Department of Airports – Airport Master Plan Update 2-30
TABLE 2-6 TOP 25 INTERNATIONAL DESTINATIONS BY O&D PASSENGERS (2013-2017)
2017 Top 25 International Destinations based on O&D Passengers
IATA Code
Total Enplaned and Deplaned Passengers 2013 2014 2015 2016 2017
1 London, England LHR 36,478 49,211 34,328 46,006 60,490 2 Cancun, México CUN 48,311 61,451 60,690 59,987 54,129 3 Cabo San Lucas, México SJD 22,483 30,458 19,920 29,111 39,865 4 Toronto, Canada YYZ 30,184 41,001 38,172 40,855 39,532 5 Vancouver, Canada YVR 25,936 37,351 31,649 36,402 38,664 6 Puerto Vallarta, México PVR 15,102 17,690 21,360 28,060 36,775 7 Mexico City, México MEX 35,158 45,751 33,038 32,700 27,549 8 Paris, France CDG 14,770 20,973 16,141 18,017 24,767 9 Guadalajara, México GDL 18,002 28,493 22,583 22,271 21,750 10 Montreal, Canada YUL 15,660 20,615 18,034 19,386 18,974 11 Amsterdam, Netherlands AMS 10,471 13,851 10,375 12,214 18,811 12 Calgary, Canada YYC 15,817 20,544 20,036 20,145 16,829 13 Tokyo, Japan NRT 18,824 29,693 19,292 21,152 16,679 14 Seoul, South Korea ICN 13,388 17,691 13,957 16,402 15,750 15 Shanghai, China PVG 9,129 14,178 12,397 15,339 15,430 16 Frankfurt, Germany FRA 13,787 17,659 13,977 13,470 14,356 17 Beijing, China PEK 9,917 14,287 11,032 13,242 13,982 18 Lima, Peru LIM 11,591 18,343 11,709 14,377 12,835 19 Rome, Italy FCO 9,132 11,468 10,145 10,426 12,241 20 Hong Kong, China HKG 7,744 11,363 10,466 11,558 12,044 21 Sydney, Australia SYD 7,507 7,606 8,379 9,863 10,977 22 San José, Costa Rica SJO 7,499 7,939 9,597 10,964 10,681 23 Dublin, Ireland DUB 6,845 6,808 7,163 8,468 10,110 24 Manila, Philippines MNL 6,367 6,789 7,441 7,494 9,787 25 Edmonton, Canada YEG 8,438 11,382 13,423 13,217 9,753
Note: Ranking based on FY 2017 O&D Passengers only Source: Bureau of Transportation Statistics T-100 segment data, 2013-2017
1 2 3 4 5 6 Service in 2017 Service in 2017 but not served in 2013

A V I A T I O N A C T I V I T Y F O R E C A S T
SLC Department of Airports – Airport Master Plan Update 2-31
TABLE 2-7 TOP 25 INTERNATIONAL DESTINATIONS BY TOTAL O&D PASSENGERS WITH CONNECTING PASSENGERS INCLUDED (2013-2017)
2017 Top 25 International Destinations by O&D Passengers with Connecting Passengers Included
IATA Code
Total Enplaned and Deplaned Passengers
2013 2014 2015 2016 2017
1 Cancun, México CUN 52,023 56,373 82,918 89,203 85,978 2 London, England LHR 36,757 39,535 36,764 57,263 83,859 3 Toronto, Canada YYZ 31,580 42,401 39,622 52,256 64,357 4 Vancouver, Canada YVR 56,506 65,288 59,313 59,586 61,390 5 Cabo San Lucas, México SJD 31,296 43,937 32,025 39,165 49,012 6 Puerto Vallarta, México PVR 18,421 23,439 31,616 39,090 45,018 7 Mexico City, México MEX 35,945 46,703 48,127 48,056 41,366 8 Paris, France CDG 27,846 36,586 29,687 31,481 37,150 9 Guadalajara, México GDL 20,408 32,229 32,513 34,558 35,047 10 Calgary, Canada YYC 43,915 50,628 42,381 41,503 33,583 11 Amsterdam, Netherlands AMS 11,488 14,663 14,436 20,986 30,965 12 Shanghai, China PVG 10,478 16,329 15,104 21,569 20,807 13 Montreal, Canada YUL 16,509 21,304 18,779 20,195 19,940 14 Tokyo, Japan NRT 23,567 36,857 25,182 27,724 19,380 15 Seoul, South Korea ICN 18,716 20,253 15,662 17,659 16,617 16 Frankfurt, Germany FRA 14,881 19,286 15,482 15,031 15,677 17 Beijing, China PEK 12,738 16,128 15,249 15,092 15,270 18 Rome, Italy FCO 10,627 13,675 13,068 12,326 14,520 19 Lima, Peru LIM 12,521 19,283 12,614 15,397 13,817 20 Hong Kong HKG 8,239 12,108 11,482 12,077 12,668 21 Sydney, Australia SYD 9,274 9,242 9,809 11,322 12,321 22 San José, Costa Rica SJO 8,220 9,126 10,644 12,410 12,237 23 Dublin, Ireland DUB 8,115 8,224 8,193 10,132 11,551 24 Edmonton, Canada YEG 8,849 11,684 13,670 14,207 10,635 25 Manila, Philippines MNL 7,010 7,925 8,162 8,290 10,148
Note: Ranking based on addition of connecting passengers to O&D passengers Source: Bureau of Transportation Statistics T-100 segment data, 2013-2017
1 2 3 4 5 6
Service in 2017 but not served in 2013 Service in 2017

A V I A T I O N A C T I V I T Y F O R E C A S T
SLC Department of Airports – Airport Master Plan Update 2-32
FIGURE 2-16 TOP 25 INTERNATIONAL DESTINATIONS BY REGION (2017)
Source: RS&H, 2018; Esri, 2018

A V I A T I O N A C T I V I T Y F O R E C A S T
SLC Department of Airports – Airport Master Plan Update 2-33
2.4.1.3 Peak Month Over the past five fiscal years, the peak months identified by total enplanements at SLC have occurred in either July or August, with July being the peak month during the most recent four years. Both July 2016 and 2017 had over one million enplanements. Over the past five fiscal years July has represented an average of 9.5% of the Airport’s annual enplanements. Given these totals, July is identified as the Peak Month of Enplanements for this Master Plan Update. FIGURE 2-17 and TABLE 2-8 compare the enplanements out of SLC by month from 2013-2017. FIGURE 2-17 PEAK MONTH ENPLANEMENTS (FY 2013-2017)
Source: Bureau of Transportation Statistics T-100 segment data, 2013-2017
650,000
700,000
750,000
800,000
850,000
900,000
950,000
1,000,000
1,050,000
1,100,000
1,150,000
Oct
ober
Nov
embe
r
Dece
mbe
r
Janu
ary
Febr
uary
Mar
ch
April
May
June July
Augu
st
Sept
embe
r
Enpl
anem
ents
Month
FY 2017 FY 2016 FY 2015 FY 2014 FY 2013Peak Month

A V I A T I O N A C T I V I T Y F O R E C A S T
SLC Department of Airports – Airport Master Plan Update 2-34
TABLE 2-8 MONTHLY ENPLANEMENTS SHARE BY FISCAL YEAR (2013-2017)
FY Oct Nov Dec Jan Feb Mar Apr May Jun Jul Aug Sept Total
2013 789,975 721,723 739,355 737,070 686,624 868,718 788,514 805,649 872,124 904,385 919,677 793,877 9,627,691
8.2% 7.5% 7.7% 7.7% 7.1% 9.0% 8.2% 8.4% 9.1% 9.4% 9.6% 8.3% 100.00%
2014 807,637 706,650 764,706 762,258 721,642 903,538 822,656 840,416 908,652 953,006 946,713 833,644 9,971,518
8.1% 7.1% 7.7% 7.7% 7.2% 9.1% 8.3% 8.4% 9.1% 9.6% 9.5% 8.4% 100.00%
2015 863,227 759,426 813,222 812,664 775,006 953,733 850,502 873,283 946,509 994,554 991,313 865,158 10,498,597
8.2% 7.2% 7.8% 7.7% 7.4% 9.1% 8.1% 8.3% 9.0% 9.5% 9.4% 8.2% 100.00%
2016 907,714 810,778 842,708 837,854 814,052 963,447 866,482 938,148 1,019,460 1,054,169 1,015,294 922,929 10,993,035
8.3% 7.4% 7.7% 7.6% 7.4% 8.8% 7.9% 8.5% 9.3% 9.6% 9.2% 8.4% 100.00%
2017 942,172 865,832 893,331 893,921 833,491 1,037,170 914,332 968,768 1,030,585 1,094,789 1,091,511 950,605 11,516,507
8.2% 7.5% 7.8% 7.8% 7.2% 9.0% 8.0% 8.4% 9.0% 9.5% 9.5% 8.3% 100.00% Note: For each year the first row of values shows the total enplanements during that fiscal year; the second row of values for that year is equal to the percentage of the fiscal year that the enplanements represent for that month. Percentages are rounded to the nearest 0.1 percent. Source: Bureau of Transportation Statistics T-100 segment data, 2013-2017

A V I A T I O N A C T I V I T Y F O R E C A S T
SLC Department of Airports – Airport Master Plan Update 2-35
2.4.2 Market Trends and Activity
2.4.2.1 SLC Operating Air Carriers The air carriers which operate at SLC include;
» Aeroméxico (AM)
» Alaska Airlines (AS)
» American Airlines (AA)
» Delta Air Lines (DL)
» Frontier Airlines (F9)
» JetBlue Airways (B6)
» KLM Royal Dutch Airlines (KL)
» SkyWest Airlines (OO)
» Southwest Airlines (WN)
» United Airlines (UA)
2.4.2.2 Air Carrier Market Share Of all mainline and regional carriers operating out of SLC, DL has consistently maintained the largest share of enplanements over the past 25+ years. More recently DL has increased its share with a 3.9% increase from 2013 to 2017. As a regional carrier, SkyWest Airlines20 (OO) code shares with Alaska Airlines, American Airlines, Delta Air Lines, as well as United Airlines and operates as an individual airline. The air carrier shares indicated in FIGURE 2-18 includes the portion of SkyWest code shares, and are identified as part of the mainline carrier’s market share of enplanements. As an individual airline, the airline with the second greatest share is SkyWest Airlines. Southwest Airlines is third in air carrier shares. FIGURE 2-18 SLC AIR CARRIER MARKET SHARE OF ENPLANEMENTS (2013 & 2017)
Note: Other Airlines* indicates the sum of all enplanements by those airlines with less than 100,000 enplanements annually Source: Bureau of Transportation Statistics T-100 segment data, 2018
20 SkyWest Airlines is not included in the list of air carriers because it is a regional carrier.
57.2%
16.9%
12.2%
4.3%
2.5%2.4% 2.0% 1.5% 1.1%
2013 Air Carrier Shares
Delta Air Lines SkyWest AirlinesSouthwest Airlines Other Airlines*US Airways Frontier AirlinesAmerican Airlines JetBlue AirwaysUnited Airlines
61.1%12.1%
10.6%
5.0%
2.6%2.4%
2.4% 2.0% 1.9%
2017 Air Carrier Shares
Delta Air Lines SkyWest AirlinesSouthwest Airlines American AirlinesAlaska Airlines United AirlinesJetBlue Airways Other Airlines*Frontier Airlines

A V I A T I O N A C T I V I T Y F O R E C A S T
SLC Department of Airports – Airport Master Plan Update 2-36
2.4.2.3 Airline Markets Served As of August, 2018 the Airport’s route network had 373 daily departures to 98 nonstop destinations. The international destinations include three European, three Canadian, and five Mexican nonstop destinations. Domestically, SLC provides service across the country, with nonstop service from coast to coast, as well as the Hawaiian Islands, and Alaska. FIGURE 2-19 shows a map of the nonstop destinations in August, 2018. FIGURE 2-19 NONSTOP DESTINATIONS (AUGUST, 2018)
Source: SLCDA, 2018
2.4.2.4 Load Factors Load factors represent the percentage number of paying passengers on a commercial flight, compared to total seats available. Over the past 10 fiscal years, air carriers at SLC have sustained a load factor of 80%21 or greater annually, as well as continuing to be above the U.S. average each year. In FY 2015, SLC reached its highest average loads during that time with an annual load factor of 85.77%; the highest U.S. average was 82.72% in 2014. FIGURE 2-20 compares changes in the FY origin load factors22 for all airlines out of SLC and the U.S. from 2008-2017.
21 Load factors were taken from BTS T-100 market segment data, and rounded in some cases for comparative purposes. 22 Average FY load factors were calculated by taking the average load factor for the FY analyzed.

A V I A T I O N A C T I V I T Y F O R E C A S T
SLC Department of Airports – Airport Master Plan Update 2-37
Load factors are also unique to markets, airlines, and routes. An analysis of the T-100 load factors by air carriers at SLC showed that many of the top SLC markets for all passengers had outbound load factors near the Airport’s average of 84.8%.
» LAX = 83.3%
» DEN = 83.2%
» PHX = 75.3%
» ATL = 92.2%
» SEA = 79.9%
» LAS = 77.9% FIGURE 2-20 HISTORIC LOAD FACTORS
Source: Bureau of Transportation Statistics T-100 segment data, 2018
2.4.2.5 Comparative Airport Analysis
2.4.2.5.1 Regional Large Hub Market Share Comparison FIGURE 2-21 compares the total enplanements for four of the other large hub airports in the general region over the past five fiscal years. These airports include Denver International Airport (Denver, Colorado-DEN), McCarran International Airport (Las Vegas, Nevada-LAS), Phoenix Sky Harbor International Airport (Phoenix, Arizona-PHX), and Dallas-Fort Worth International Airport (Dallas/Fort Worth, Texas-DFW).
74.0%
76.0%
78.0%
80.0%
82.0%
84.0%
86.0%
88.0%
2008
2009
2010
2011
2012
2013
2014
2015
2016
2017
Load
Fac
tor
Fiscal Year
SLC US

A V I A T I O N A C T I V I T Y F O R E C A S T
SLC Department of Airports – Airport Master Plan Update 2-38
The average air fares of these airports were also compared in FIGURE 2-22. From 2008-2017 SLC had a greater average airfare than three of the four large hub airports compared with the exception of DFW. It also had higher annual average airfares than the United States’ average as a whole, except for the years of 2008 and 2009. FIGURE 2-21 COMPARISON OF REGIONAL LARGE HUB AIRPORT ENPLANEMENTS (2013-2017)
Source: FAA TAF, 2017, Published January, 2018
0
5,000,000
10,000,000
15,000,000
20,000,000
25,000,000
30,000,000
35,000,000
2013 2014 2015 2016 2017
Enpl
anem
ents
Fiscal Year
SLC PHX LAS DEN DFW

A V I A T I O N A C T I V I T Y F O R E C A S T
SLC Department of Airports – Airport Master Plan Update 2-39
FIGURE 2-22 ANNUAL AVERAGE DOMESTIC AIRFARE COMPARISON AMONG SIMILARLY SIZED REGIONAL AIRPORTS
Note: Average air fare shown in dollar value current to each year Source: Bureau of Transportation Statistics, 2018
2.4.2.6 SLC Market Analysis
2.4.2.6.1 Average Airfares Average airfare data for each airport is provided by the Bureau of Transportation Statistics. The averages provided for each airport are based on a 10% sample of all airline tickets for U.S. carriers at that airport. The airfares23 are “itinerary in type”, meaning they include round trip costs, unless a one way ticket is purchased. Each average airfare is in current US dollars for the year that it is listed. Since 1993, SLC has been below the U.S. average for airfare until 2007. However, airfares for the U.S. as a whole and SLC have both increased very similarly over the past 25 years. The historical AAGR for SLC’s average airfare and the U.S. is 0.5%. FIGURE 2-23 shows the historical and projected airfares for SLC and the U.S. The projected growth rates of airlines for this Forecast were derived using the same historical AAGRs.
23 Average air fares do not include charter air travel or baggage and optional services that an airline may provide at additional costs.
$200.00
$250.00
$300.00
$350.00
$400.00
$450.00
$500.00
2008
2009
2010
2011
2012
2013
2014
2015
2016
2017
Annu
al A
vera
ge D
omes
tic A
irfar
e (c
urre
nt$)
YearSLC PHX LAS DEN DFW U.S.

A V I A T I O N A C T I V I T Y F O R E C A S T
SLC Department of Airports – Airport Master Plan Update 2-40
FIGURE 2-23 HISTORICAL AND PROJECTED AVERAGE DOMESTIC AIRFARE (1993-2037)
Note: Average Annual Air Fares shown in current U.S. dollars to the year listed Source: Bureau of Transportation Statistics, 2018
$150
$200
$250
$300
$350
$400
$450
$50019
93
1995
1997
1999
2001
2003
2005
2007
2009
2011
2013
2015
2017
2019
2021
2023
2025
2027
2029
2031
2033
2035
2037
Aver
age
Airf
are
YearHistorical SLC Airfare Projected SLC AirfareHistorical US Airfare Projected US Airfare
Historical Forecast

A V I A T I O N A C T I V I T Y F O R E C A S T
SLC Department of Airports – Airport Master Plan Update 2-41
2.4.2.6.2 Airline Yield Airline yield like airfare, is also a good indicator for projecting airport enplanement growth. Airline yield is the average airfare per passenger per mile. Often times, airline yield can be used as a surrogate for airfares, if the airfare variable is not usable or unavailable. Airline yield is determined by taking the revenue seat miles and dividing them by total revenue. Airline yield is reported in cents (¢) and the assumption can be made that when yield is higher the number of enplanements is usually lower. For this Forecast, the historical (1.5%) AAGR for SLC airline yields from 1993-2017 was used, although the U.S. used the (1.9%) AAGR projected in the FAA Aerospace Forecast for FY 2018-2038. The U.S. airline yield is shown for comparison purposes only. FIGURE 2-24 shows the historical airline yields for SLC and the U.S. from 1993-2017, and the yields forecast over the planning horizon. FIGURE 2-24 HISTORICAL AND PROJECTED AIRLINE YIELD (1993-2037)
*Airline yields are shown in US cents for the year that they are referenced Note: Projected airline yields were interpolated using the historical AAGR (1.5%) from 1993-2017 for SLC, and the projected (1.9%) AAGR given in the FAA Aerospace Forecast FY 2018-2038 for the US. Source: RS&H, 2018; Bureau of Transportation Statistics T-100 segment data, 2018, Salt Lake City Master Plan Update, 2006; FAA Aerospace Forecast FY 2018-2038
9.00
11.00
13.00
15.00
17.00
19.00
21.00
23.00
1993
1995
1997
1999
2001
2003
2005
2007
2009
2011
2013
2015
2017
2019
2021
2023
2025
2027
2029
2031
2033
2035
2037
Airli
ne Y
ield
in U
S ce
nts (
¢)*
YearProjected SLC Airline Yield Historical SLC Airline Yield
Projected US Airline Yield Historical US Airline Yield
Historical Forecast

A V I A T I O N A C T I V I T Y F O R E C A S T
SLC Department of Airports – Airport Master Plan Update 2-42
2.4.2.6.3 Jet Fuel Prices Analysis Jet fuel prices are a highly important variable to consider when analyzing enplanements. Fuel prices may impact the cost of a passenger’s ticket; higher fuel prices often result in higher airfares which translates into decreases in discretionary travel. This Forecast uses the U.S. Energy Information Administration for historical jet fuel prices and the projected 4.3% AAGR for Jet Fuel Prices over the planning horizon from the FAA Aerospace Forecast FY 2018-2038. FIGURE 2-25 shows the historical and projected jet fuel prices. FIGURE 2-25 HISTORICAL AND PROJECTED JET FUEL PRICES (1993-2037)
*Jet fuel prices are shown in US dollars for the year that they are referenced Note: Projected Jet Fuel Prices are interpolated using the FAA Aerospace Forecast FY 2018-2038 AAGR of 4.3% from 2018-2037 Source: U.S. Energy Information Administration, 2018; FAA Aerospace Forecast FY 2018-2038; RS&H, 2018
$-
$0.50
$1.00
$1.50
$2.00
$2.50
$3.00
$3.50
$4.00
1993
1995
1997
1999
2001
2003
2005
2007
2009
2011
2013
2015
2017
2019
2021
2023
2025
2027
2029
2031
2033
2035
2037
US
Dolla
rs p
er g
allo
n (a
vera
ge*)
Fiscal YearProjected Jet Fuel Prices Historical Jet Fuel Prices
Forecast Historical

A V I A T I O N A C T I V I T Y F O R E C A S T
SLC Department of Airports – Airport Master Plan Update 2-43
2.4.2.6.4 Passenger Aircraft Fleet Mix Trend Analysis Anticipated trends for the Airport’s passenger aircraft fleet mix over the planning horizon are identified in this section. Some of these changes are anticipated due to the age of existing aircraft or potential requirements, while others are based on trends in upgauging, or increased performance and efficiency. The following changes are intended to only reflect each listed airline’s SLC fleet mix, and is not necessarily intended to be representative for the airline as a whole.
» Delta Air Lines o Airbus 220-100, -300 o Airbus 320-Airbus 321 Airbus320neo/Airbus321neo o Boeing 737-700, -800, -900 Boeing 737 MAX 7, MAX 8, MAX 9 o Boeing 747-400 Airbus 350-900 o Boeing 777-200
» Frontier Airlines o Airbus 319-Airbus 321 Airbus 321neo
» JetBlue Airways o Airbus 320-Airbus 321 Airbus 320neo/321neo
» KLM Royal Dutch Airlines o Boeing 777-200/Boeing 787-900
» United Airlines o Airbus 319-320 Airbus 320neo/Airbus 321neo
2.4.2.6.5 Short, Medium, and Long Range Global Potential It is anticipated that SLC will slowly add new nonstop domestic city pairs in the future. In terms of international routes, the largest number of non-stop markets unserved are those in Asia. There may be incremental new city pairs to North American markets such as to Canada or Mexico and potentially Latin America or the Caribbean. Another possibility is a South American city pair. At this time, there are no additional non-stop routes anticipated to Europe.

A V I A T I O N A C T I V I T Y F O R E C A S T
SLC Department of Airports – Airport Master Plan Update 2-44
2.4.3 Passenger Enplanement Forecasts
2.4.3.1 Methodology This section provides the methodology for developing passenger enplanement forecasts. This involves the formulation and use of three multiple regression models with different growth assumptions to develop the most likely forecast, referred to as the Base Case Forecast, and the alternate forecasts presenting High Case and Low Case Scenarios. Each model incorporates various combinations of independent variables with statistical significance based on the standard alpha P-value24 of 0.05. The output of these models (or dependent variable) is a projected number of O&D enplanements for each of the 20 years over the planning horizon. The independent variables that were tested and selected ranged from:
» Socioeconomic characteristics unique to the SLC service area
» Economic indicators such as national jet fuel prices, average airfare, and airline yield
» Qualitative variables25 , which are unique events that have a noticeable impact on aviation activity locally at SLC or nationally.
The general practice in forecasting enplanements is the use of a multiple variable regression analysis that ultimately provides the “best fit” model26 for the data. The best fit regression model identified as the Base Case Forecast makes projections for enplanements based on the projected growth rates that have been derived from the data sources used, FAA projections, or historical AAGRs when applicable. Often times, the Base Case model’s variables adjust their projected growth rates to generate derivative scenario forecasts to reflect Low and High ranges. For example, if the Base Case variables that produces the most statistically relevant equation with the highest correlations includes population, GRP, and airline yield, then the Low Case could decrease the rate of GRP growth and increase airline yield, whereas the rate of GRP growth could be increased and airline yield would be decreased to generate the High Case. For Salt Lake City, the same approach was applied but in greater detail. For the Base Case and derivative Low and High Cases, the same 11 predictor variables were analyzed for use. The Low and High Case Scenario variables selected for each model, include adjustments to some of the projections so that they could better reflect the nature of the scenario. For instance, the Low Case Scenario included projections that were decreased by ten percent, and the High Case Scenario includes projections that were increased by ten percent. There was also one instance where a different source for projecting population and employment over the planning horizon was used27.
24 A standard alpha P-value of 0.05 is the value commonly used in social sciences for accepting or rejecting null hypotheses regarding multivariate regression models. When a P-value is less than the alpha 0.05, the null hypothesis (that states the regression model is not impacted by the selected independent variables) can be rejected. This conclusion, enables the model with a P-value less than 0.05 to be accepted at the 95% confidence level. 25 For this Forecast qualitative variables are also known as “binomial” or “dummy’ variables. 26 Designation of a “Best Fit” regression model is supported by the model or models that have the greatest R Square value, along with other supporting statistics that are statistically significant for the tests performed. 27 In the High Case Scenario, the University of Utah Kem C. Gardner Policy Institute data were used in lieu of increasing Woods & Poole population and employment growth rates for regional area.
A V I A T I O N A C T I V I T Y F O R E C A S T
SLC Department of Airports – Airport Master Plan Update 2-45
To further validate the forecasts and take into consideration random error, Monte Carlo Simulation was used to test results (see discussion of Monte Carlo below). The simulation results prove with a 95% probability that the models all have the potential to predict future enplanements. In summary, the results of this process identifies a unique set of variables for each scenario while using the same overall data set for each scenarios. The results is a best fit equation for each scenario derived from the variables that correlate best with that scenario’s enplanement projections.
2.4.3.1.1 Regression Models and Statistics The following three regression models were selected as the Base Case, Low Case Scenario, and High Case Scenario Forecasts. The equation and statistics of each forecast are provided below.
» Base Case Forecast o R Square28= 0.989 o Adjusted R Square29= 0.972 o Equation30= 3052880.55391373 + (-7358.77682732965*AIRFARE) +
(141401.285712933*FUEL)+(41.8884116094778*GRP)+( -228537.429647365*RECESS) + (-523832.531871583*9/11)
o Degrees of Freedom31=5 o Significance (F)32= <0.01 o Durbin-Watson33=2.002 o Variables34=
AIRFARE= Average airfare of SLC (P-value=< 0.01) FUEL= National Jet Fuel Prices (P-value=0.037) GRP= Gross Regional Product of SLC Service Area (P-Value= <0.01) value RECESS= Recession qualitative variable (“1” given for those years affected by the
2009 Recession) (P-value= 0.020) 9/11= Terrorists attacks of 9/11 qualitative variable (“1” given for the year of 9/11
and all years thereafter) The forecast variables, or predictors35 that generated the “best fit” equation to estimate the future level of O&D enplanements for the Base Case Forecast, are projections of average airfares, jet fuel prices, SLC Service Area GRP, and variables that account for unanticipated local, national, or world events.
28 The R Square value is a percentage that indicates how well the data points fit the regression model. If R Square values are closer to 1.0, then the regression model can be regarded as a good model for fitting the data. 29 The Adjusted R Square value is also a percentage indicating goodness of fit in the regression model, but unlike the R Square value it is based on the importance of each of the independent variables that are used in the model, therefore if it differs greatly from the R Square value, there are a greater number of insignificant variables in the model. 30 The multivariate regression model uses the equation Y=b0 + b1*X1 + b2*X2… 31 Degrees of Freedom represent the number of coefficients which are free to vary, or (n-1) where n=the number of independent variables. 32 The Significance F of the regression, tells what the probability of the regression output is by chance. If it is below the alpha P-value of 0.05, then there is a greater than 95% probability the model’s output is not by chance. 33 The Durbin-Watson statistic tests for autocorrelations in a data sample, or correlations between data over time. It produces a value between 0 and 4, and a value of 2 indicates that there is no autocorrelation in the sample. 34 Variables listed in each of the models are the coefficients used in the regression model, each with significant P-values. 35 Also known as independent variables.

A V I A T I O N A C T I V I T Y F O R E C A S T
SLC Department of Airports – Airport Master Plan Update 2-46
» Low Case Scenario Forecast o R Square= 0.976 o Adjusted R Square= 0.971 o Equation=1964317.012+( -7240.154096*AIRFARE) +( 6.90256294*EMPLOY)+(-
2.404449617*POP)+ ( 90651.2393*YIELD) o Degrees of Freedom=4 o Significance (F)= <0.01 o Durbin-Watson=1.723 o Variables=
AIRFARE= Average airfare of SLC (P-value=< 0.01) EMPLOY= Employment of SLC Service Area (P-Value= <0.01) POP= Population of SLC Service Area (P-Value= <0.01) YIELD= SLC Airline Yield (P-value=<0.01)
The forecast variables that best represent a forecast of slower growth in O&D enplanements in the SLC market for the Low Case are an increase in airfares and airline yield and a slowing of growth in population and employment over the Base Case.
» High Case Scenario Forecast o R Square= 0.869 o Adjusted R Square= 0.843 o Equation= -4214297.74147306 + ( -871241.946536854*MERGE) +
(5.84509052639647*POP) + (-185318.820602199*YIELD) + ( -1037476.00386821*9/11) o Degrees of Freedom=4 o Significance (F)= <0.01 o Durbin-Watson=1.495 o Variables=
MERGE= Delta Air Lines-Northwest Airlines Merger of 2008 (“1” given for the year of the merge in 2008, and every year thereafter) (P-Value= <0.01)
POP= Population of SLC Service Area (with University of Utah Population Growth Rate) (P-Value= <0.01)
YIELD= SLC Airline Yield (decreased by 10%) (P-value=<0.01) 9/11= Terrorists attacks of 9/11 qualitative variable (“1” given for the year of 9/11
and all years thereafter)
The forecast variables that best represent an increase in O&D enplanements for the High Case Scenario Forecast is assumed increases in the rate of population growth over the Base Case, a decline in airline yield, the ongoing effect of airline mergers, and variables that account for unanticipated local, national, or world events. After the three regression models were selected, the O&D projections were given a proportion of all enplanements relevant to specific historical trends of O&D and connecting enplanement distributions out of SLC. Because SLC is a hub, the existing 61.4% of enplanements being O&D, is not anticipated to

A V I A T I O N A C T I V I T Y F O R E C A S T
SLC Department of Airports – Airport Master Plan Update 2-47
continue, instead each forecast anticipates a transition back to more even distribution between O&D and connecting enplanements. Therefore, the three scenario distributions reflect more of a hub-type distribution36.
2.4.3.1.2 Monte Carlo Simulations Monte Carlo simulation was used to evaluate each of the three scenarios. The software developer37 of Monte Carlo simulation refers to the software as a probability simulation. It is a technique used to understand the impact of risk and uncertainty in forecasting models. In developing a forecast, certain assumptions are made in order to identify that a future value, for example, enplanements, will occur in a particular year. Since this is a forecast, the best one can do is to estimate an expected value based upon historical data, future trends information, or experience. The greater the number of variables that are used to generate a forecast, the greater the number of potential ranges of outcomes. Typically, several variables produce the best overall statistical correlations. Using a range of possible values can generate a more realistic future. Monte Carlo simulation provides an estimate of the probability of the likelihood of a resulting outcome based upon the range of variables. Because it is a simulation technique, each set of variables can be tested against each other to identify ranges of probability. For this Forecast, the simulation compared the projections of the regression model within the Monte Carlo simulation’s 95% probability range. Each Monte Carlo simulation run completed a total of 10,000 iterations of all input variables. The results which include random error, verify that each of the three forecast models are generated within a 95% confidence level. FIGURE 2-26 shows the Base Case Forecast regression model and identifies the upper and lower limits with a 95% probability confidence level. After inserting the Monte Carlo simulation predicted O&D enplanements, and establishing the AAGRs over the planning horizon, some of the annual growth rates were adjusted to provide a smooth transition from the previous distribution to the new hub type distributions. Results for the Low and High Scenario regressions within a 95% probability confidence level look almost exactly like the one depicted in FIGURE 2-26.
36 In this Forecast, a “hub-type” distribution refers to a more balanced breakdown of O&D and connecting enplanements. 37 Internet, www.riskamp.com, November 13, 2018.

A V I A T I O N A C T I V I T Y F O R E C A S T
SLC Department of Airports – Airport Master Plan Update 2-48
FIGURE 2-26 BASE CASE FORECAST REGRESSION MODEL AND MONTE CARLO SIMULATION LIMITS
Source: RS&H, 2018
2.4.3.2 O&D Enplanements Forecasts The Base Case Forecast for O&D has an AAGR of 1.7% over the planning horizon. The model was built using the SLC service area’s GRP, average airfare for the Airport, national jet fuel prices, and two qualitative variables that reflect the impacts of the Terrorist Attacks of 9/11 and the Recession of 2009. Using this model, the number of annual O&D enplanements will increase from approximately 7.1 million in 2017, to 9.9 million in 2037. The Low Case Scenario Forecast model is built using the SLC service area’s population and employment, as well as the airline yield and average airfare for the Airport; please see Section 2.4.3.1 Methodology. The Low Case Scenario model projects an AAGR of 1.4% over the planning horizon, increasing the annual O&D enplanements from approximately 7.1 million in 2017, to 9.2 million in 2037. Lastly, the High Case Scenario Forecast model was based on population growth for the SLC service area, but instead of using the Woods & Poole projections, it used the slightly higher University of Utah’s AAGR (1.5%). The other variables include the projected airline yield for SLC, but in this scenario it is decreased by 10%, and finally the two qualitative variables which include the Terrorist Attacks of 9/11 and the Northwest Airlines and Delta Air Lines Merge of 2008. The High Case Scenario model projects an AAGR of 2.4% over the planning horizon, increasing the annual O&D enplanements from approximately 7.1 million in 2017, to 11.3 million in 2037.
3,000,000
4,000,000
5,000,000
6,000,000
7,000,000
8,000,000
9,000,000
10,000,000
11,000,000
1993
1995
1997
1999
2001
2003
2005
2007
2009
2011
2013
2015
2017
2019
2021
2023
2025
2027
2029
2031
2033
2035
2037
O&
D En
plan
emen
ts
Fiscal Year
Actual Enplanements Low Limit ProjectionRegression Model Output High Limit Projection
Historical Forecast
A V I A T I O N A C T I V I T Y F O R E C A S T
SLC Department of Airports – Airport Master Plan Update 2-49
TABLE 2-10 shows the projected O&D enplanements for each forecast, and the distribution or share of O&D enplanements versus connecting enplanements as a percentage from 2018-2037.
2.4.3.3 Connecting Enplanements Forecasts As of 2017, the connecting enplanements represented 38.6% of all passengers departing from SLC. During its time as a hub airport, the distribution of connecting versus O&D passengers has fluctuated over the past 25 years, but it has always been in the vicinity of a 50-50 split. A major factor influencing the annual connecting enplanements, and ultimately total annual enplanements, is the distribution percentages of O&D and connecting passengers. The SLC city pair for each airline will have its own connecting ratio based upon the number of O&D passengers available on that route and that airline’s policy. There are two typical ways that connecting passengers are estimated. One is to hold the number of enplanements constant over the course of the forecast period or, based on more in depth analysis, forecast the existing O&D/connecting mix per route. Essentially holding the current level constant is a weighted average for that point in time. At this point in SLC’s history, the connecting ratio is near its historical low point. It is unknown whether this is a long-term phenomenon, a trend that could be reversed with the additional capacity afforded by the new terminal along with the potential for upgauging that this building brings, or is reflective of this point in SLC’s history. The number of connecting passengers is generally dictated by the operational policies of the major hub carrier at an airport, in this case Delta. For 2017, the O&D to connecting ratio of approximately 61/39 percent is an outlier and the connecting share of 39% is much lower than historical trends. In conversations with Delta, it has been their general policy to maintain a higher overall level of connecting passengers at SLC than exists at the present time. In addition, Delta has been using SLC as a connect point to west coast markets and there are opportunities for this trend to expand in the future. At the same time, there is not expected to be much change in the way the other airlines operate at SLC which indicates those airlines’ average O&D to connecting ratios will not change appreciably. It is also anticipated that once the new airline terminal opens in 2020, there will be more space available for upgauging aircraft and thereby providing more seating capacity to accommodate connecting passengers. These factors all point to the potential for increasing numbers of connecting passengers, although there is no expectation that the O&D to connecting ratio will return to a 50/50 split. The three forecast scenarios for O&D to connecting passenger ratios are patterned after historical time frames at SLC and their O&D to connecting ratios. The Base Case reflects the dynamic period since 2000 that includes periods both of fast-paced and declining economic growth. The Low Case reflects a lower connecting ratio and fewer enplanements whereas the High Case reflects a slightly higher connecting ratio than the Base Case with greater enplanement levels:
» Base Case Forecast- 53.2% O&D and 46.8% Connecting Passengers reflect the average percentages of SLC Passengers from FY 2000-2017. This is a higher level of connections than currently but does reflect the ongoing effects of airline mergers (anticipated to be completed) as well as upheaval in events such as an unforeseen global event and a recession. As a mid-
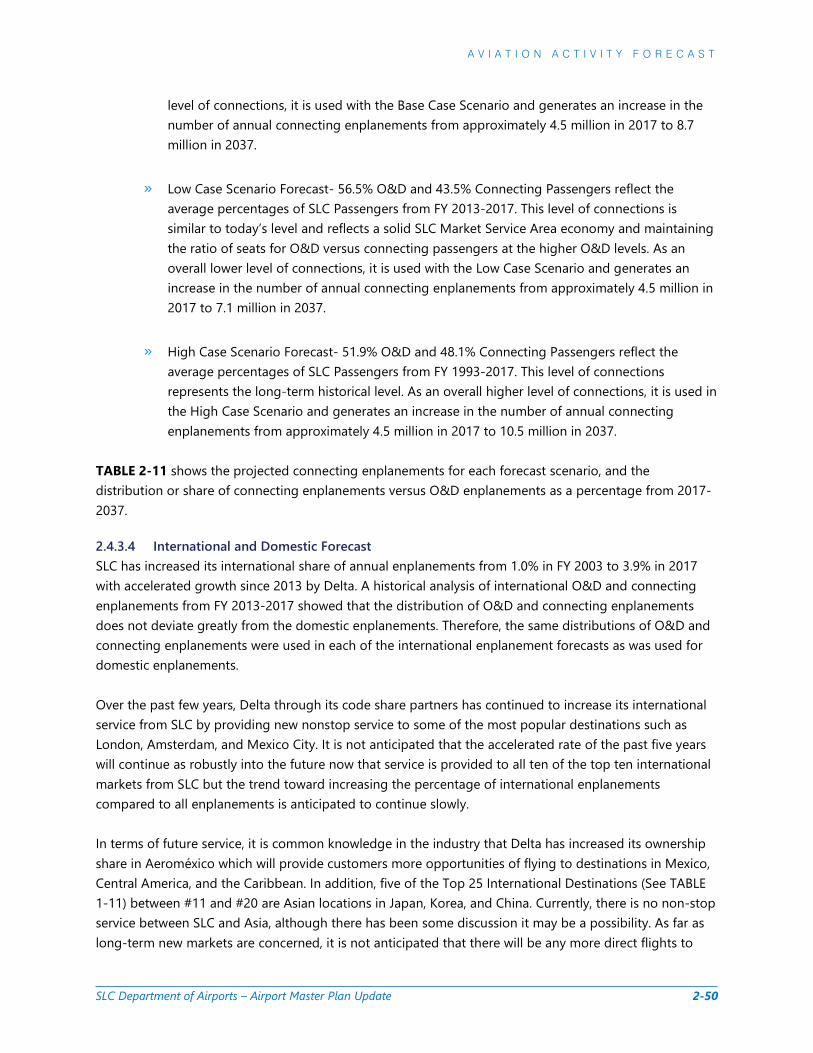
A V I A T I O N A C T I V I T Y F O R E C A S T
SLC Department of Airports – Airport Master Plan Update 2-50
level of connections, it is used with the Base Case Scenario and generates an increase in the number of annual connecting enplanements from approximately 4.5 million in 2017 to 8.7 million in 2037.
» Low Case Scenario Forecast- 56.5% O&D and 43.5% Connecting Passengers reflect the average percentages of SLC Passengers from FY 2013-2017. This level of connections is similar to today’s level and reflects a solid SLC Market Service Area economy and maintaining the ratio of seats for O&D versus connecting passengers at the higher O&D levels. As an overall lower level of connections, it is used with the Low Case Scenario and generates an increase in the number of annual connecting enplanements from approximately 4.5 million in 2017 to 7.1 million in 2037.
» High Case Scenario Forecast- 51.9% O&D and 48.1% Connecting Passengers reflect the average percentages of SLC Passengers from FY 1993-2017. This level of connections represents the long-term historical level. As an overall higher level of connections, it is used in the High Case Scenario and generates an increase in the number of annual connecting enplanements from approximately 4.5 million in 2017 to 10.5 million in 2037.
TABLE 2-11 shows the projected connecting enplanements for each forecast scenario, and the distribution or share of connecting enplanements versus O&D enplanements as a percentage from 2017-2037.
2.4.3.4 International and Domestic Forecast SLC has increased its international share of annual enplanements from 1.0% in FY 2003 to 3.9% in 2017 with accelerated growth since 2013 by Delta. A historical analysis of international O&D and connecting enplanements from FY 2013-2017 showed that the distribution of O&D and connecting enplanements does not deviate greatly from the domestic enplanements. Therefore, the same distributions of O&D and connecting enplanements were used in each of the international enplanement forecasts as was used for domestic enplanements. Over the past few years, Delta through its code share partners has continued to increase its international service from SLC by providing new nonstop service to some of the most popular destinations such as London, Amsterdam, and Mexico City. It is not anticipated that the accelerated rate of the past five years will continue as robustly into the future now that service is provided to all ten of the top ten international markets from SLC but the trend toward increasing the percentage of international enplanements compared to all enplanements is anticipated to continue slowly. In terms of future service, it is common knowledge in the industry that Delta has increased its ownership share in Aeroméxico which will provide customers more opportunities of flying to destinations in Mexico, Central America, and the Caribbean. In addition, five of the Top 25 International Destinations (See TABLE 1-11) between #11 and #20 are Asian locations in Japan, Korea, and China. Currently, there is no non-stop service between SLC and Asia, although there has been some discussion it may be a possibility. As far as long-term new markets are concerned, it is not anticipated that there will be any more direct flights to

A V I A T I O N A C T I V I T Y F O R E C A S T
SLC Department of Airports – Airport Master Plan Update 2-51
European destinations but it is not out of the realm of feasibility to think that a destination such as Lima, Peru could materialize. Given these trends, there are expectations for continued growth on existing international routes as well as the potential for SLC to serve new international markets. The Base Case assumes continued growth on existing routes and the incremental addition of new routes. This would have the impact of increasing the percentage number of international enplanements to total enplanements. Over the past five years, the number of international enplanements to total enplanements has doubled, i.e., from 1.9% to approximately 3.8%. The Low Case assumes a lower rate of growth that would accompany a slowdown in domestic and international economic activity. In addition to growth in current markets, the High Case assume initiation of new international routes at a faster rate with more time for growth in those markets over the forecast period. As a result the percent of international enplanements to total enplanements would be greater than the Base Case. TABLE 2-9 shows the distributions of international and domestic enplanements for each forecast scenario over the planning horizon. While each distribution differs slightly, each scenario forecast shows growth in the number of international enplanements over the planning horizon, although the percentage of international enplanements to total enplanements differ. TABLE 2-12 shows the projected international and domestic enplanements out of SLC over the planning horizon. FIGURE 2-27 compares the international enplanement forecast scenarios, and FIGURE 2-28 compares the domestic enplanement forecast scenarios over the planning horizon.

A V I A T I O N A C T I V I T Y F O R E C A S T
SLC Department of Airports – Airport Master Plan Update 2-52
TABLE 2-9 INTERNATIONAL/DOMESTIC ENPLANEMENT FORECAST DISTRIBUTION (2017-2037)
FY
Low Case Scenario Forecast
Base Case Forecast
High Case Scenario Forecast
% International
% Domestic
% International
% Domestic
% International
% Domestic
2017 3.9% 96.1% 3.9% 96.1% 3.9% 96.1%
2022 3.6% 96.4% 4.1% 95.9% 4.1% 95.9%
2027 3.5% 96.5% 4.3% 95.8% 4.5% 95.5%
2032 3.5% 96.5% 4.3% 95.8% 4.6% 95.4%
2037 3.5% 96.5% 4.3% 95.8% 4.6% 95.4% Source: RS&H, 2018
2.4.3.5 Total Enplanements Forecast The total enplanements projected in each forecast scenario are a combination of the output of the O&D enplanement forecasts and historical hub-type distributions. Therefore, not only does each model inform the rate of growth for O&D enplanements and total enplanements, but as the O&D and connecting distribution becomes more even, the greater the total enplanements will be also. In the Base Case Forecast, it is assumed that the Airport would maintain a 53.2% O&D to 46.8% connecting hub-type distribution over the planning horizon. This yields a 2.77% AAGR over the planning horizon, increasing the total annual enplanements by over 5.5 million in 2037. The Low Case Scenario Forecast assumes a 56.5% O&D to 43.5% connecting hub-type distribution over the planning horizon. This yields a 1.78% AAGR over the planning horizon, which would increase the total annual enplanements by over 4.8 million in 2037. Lastly, the High Case Scenario Forecast assumes a 51.9% O&D to 48.1% connecting hub-type distribution over the planning horizon. This yields a 3.71% AAGR over the planning horizon, which would increase the total annual enplanements by over 10.2 million in 2037. TABLE 2-13 shows the year-by-year total enplanements for each of the three forecast scenarios, as well as the FAA TAF 2017. FIGURE 2-29 compares each forecast with the FAA TAF 2017 from 2018-2037.

A V I A T I O N A C T I V I T Y F O R E C A S T
SLC Department of Airports – Airport Master Plan Update 2-53
TABLE 2-10 O&D ENPLANEMENT FORECASTS (2017-2037)
Fiscal Year Low Case Scenario Forecast % O&D Base Case
Forecast % O&D High Case Scenario Forecast % O&D
2017 7,065,996 61.4% 7,065,996 61.4% 7,065,996 61.4% 2018 6,843,216 57.5% 6,976,958 53.9% 7,201,366 53.3% 2019 7,002,191 57.2% 7,142,807 53.7% 7,336,736 53.0% 2020 7,136,649 57.0% 7,292,447 53.6% 7,472,105 52.7% 2021 7,268,551 56.9% 7,430,107 53.5% 7,607,475 52.4% 2022 7,403,102 56.7% 7,571,925 53.3% 7,742,845 52.2% 2023 7,532,369 56.5% 7,721,692 53.2% 7,878,215 51.9% 2024 7,662,685 56.5% 7,872,937 53.2% 8,099,023 51.9% 2025 7,794,392 56.5% 8,025,538 53.2% 8,323,277 51.9% 2026 7,926,922 56.5% 8,179,033 53.2% 8,551,062 51.9% 2027 8,057,849 56.5% 8,334,593 53.2% 8,782,420 51.9% 2028 8,187,290 56.5% 8,492,480 53.2% 9,017,426 51.9% 2029 8,315,456 56.5% 8,651,201 53.2% 9,256,101 51.9% 2030 8,442,061 56.5% 8,810,727 53.2% 9,498,528 51.9% 2031 8,566,628 56.5% 8,970,546 53.2% 9,744,750 51.9% 2032 8,688,609 56.5% 9,130,470 53.2% 9,994,864 51.9% 2033 8,807,732 56.5% 9,290,414 53.2% 10,248,866 51.9% 2034 8,924,402 56.5% 9,450,469 53.2% 10,506,870 51.9% 2035 9,039,025 56.5% 9,610,840 53.2% 10,768,911 51.9% 2036 9,151,398 56.5% 9,771,610 53.2% 11,035,077 51.9% 2037 9,261,464 56.5% 9,932,837 53.2% 11,305,420 51.9%
Average Annual Growth Rates (AAGR) 2018-2022 1.0% 1.4% 1.9% 2023-2027 1.7% 1.9% 2.6% 2028-2037 1.4% 1.8% 2.6% 2018-2037 1.4% 1.7% 2.4%
Source: RS&H, 2018; FAA TAF, 2017; BTS T-100 Segment Data, 2013-2017
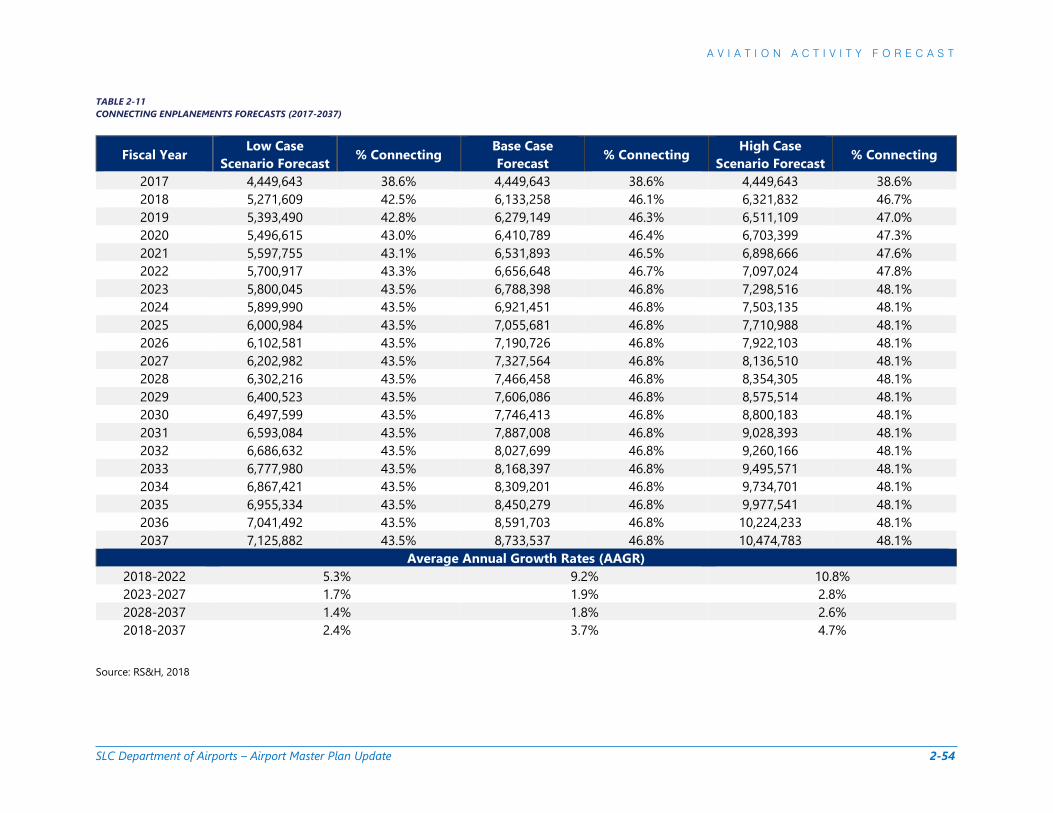
A V I A T I O N A C T I V I T Y F O R E C A S T
SLC Department of Airports – Airport Master Plan Update 2-54
TABLE 2-11 CONNECTING ENPLANEMENTS FORECASTS (2017-2037)
Fiscal Year Low Case Scenario Forecast % Connecting Base Case
Forecast % Connecting High Case Scenario Forecast % Connecting
2017 4,449,643 38.6% 4,449,643 38.6% 4,449,643 38.6% 2018 5,271,609 42.5% 6,133,258 46.1% 6,321,832 46.7% 2019 5,393,490 42.8% 6,279,149 46.3% 6,511,109 47.0% 2020 5,496,615 43.0% 6,410,789 46.4% 6,703,399 47.3% 2021 5,597,755 43.1% 6,531,893 46.5% 6,898,666 47.6% 2022 5,700,917 43.3% 6,656,648 46.7% 7,097,024 47.8% 2023 5,800,045 43.5% 6,788,398 46.8% 7,298,516 48.1% 2024 5,899,990 43.5% 6,921,451 46.8% 7,503,135 48.1% 2025 6,000,984 43.5% 7,055,681 46.8% 7,710,988 48.1% 2026 6,102,581 43.5% 7,190,726 46.8% 7,922,103 48.1% 2027 6,202,982 43.5% 7,327,564 46.8% 8,136,510 48.1% 2028 6,302,216 43.5% 7,466,458 46.8% 8,354,305 48.1% 2029 6,400,523 43.5% 7,606,086 46.8% 8,575,514 48.1% 2030 6,497,599 43.5% 7,746,413 46.8% 8,800,183 48.1% 2031 6,593,084 43.5% 7,887,008 46.8% 9,028,393 48.1% 2032 6,686,632 43.5% 8,027,699 46.8% 9,260,166 48.1% 2033 6,777,980 43.5% 8,168,397 46.8% 9,495,571 48.1% 2034 6,867,421 43.5% 8,309,201 46.8% 9,734,701 48.1% 2035 6,955,334 43.5% 8,450,279 46.8% 9,977,541 48.1% 2036 7,041,492 43.5% 8,591,703 46.8% 10,224,233 48.1% 2037 7,125,882 43.5% 8,733,537 46.8% 10,474,783 48.1%
Average Annual Growth Rates (AAGR) 2018-2022 5.3% 9.2% 10.8% 2023-2027 1.7% 1.9% 2.8% 2028-2037 1.4% 1.8% 2.6% 2018-2037 2.4% 3.7% 4.7%
Source: RS&H, 2018

A V I A T I O N A C T I V I T Y F O R E C A S T
SLC Department of Airports – Airport Master Plan Update 2-55
TABLE 2-12 INTERNATIONAL AND DOMESTIC ENPLANEMENTS FORECASTS (2017-2037)
Low Case Scenario Forecast Base Case Forecast High Case Scenario Forecast
Year International Enplanements
Domestic Enplanements
International Enplanements
Domestic Enplanements
International Enplanements
Domestic Enplanements
2017 448,031 11,067,608 448,031 11,067,608 448,031 11,067,608 2018 484,198 11,931,138 519,033 12,789,504 527,405 12,995,793 2019 483,153 12,131,796 537,123 13,026,588 548,375 13,299,470 2020 482,402 12,313,403 554,946 13,249,688 569,855 13,605,649 2021 480,063 12,494,614 572,629 13,462,392 591,851 13,914,290 2022 477,547 12,678,023 589,312 13,679,748 612,887 14,226,982 2023 475,968 12,856,461 607,973 13,902,120 635,905 14,540,826 2024 474,694 13,088,000 628,762 14,165,629 663,092 14,939,069 2025 482,838 13,312,537 640,951 14,440,255 692,680 15,341,590 2026 491,032 13,538,466 653,215 14,716,543 723,172 15,749,990 2027 499,128 13,761,679 665,642 14,996,514 754,585 16,164,358 2028 507,133 13,982,386 678,255 15,280,681 786,939 16,584,781 2029 515,059 14,200,905 690,935 15,566,353 820,254 17,011,350 2030 522,889 14,416,784 703,678 15,853,463 841,740 17,456,965 2031 530,590 14,629,134 716,446 16,141,111 863,564 17,909,572 2032 538,132 14,837,082 729,222 16,428,945 885,731 18,369,281 2033 545,500 15,040,204 741,999 16,716,812 908,245 18,836,204 2034 552,714 15,239,105 754,786 17,004,877 931,112 19,310,453 2035 559,803 15,434,561 767,598 17,293,525 954,338 19,792,142 2036 566,750 15,626,109 780,441 17,582,878 977,929 20,281,388 2037 573,558 15,813,804 793,321 17,873,047 1,001,889 20,778,309
Average Annual Growth Rates (AAGR) 2018-2022 1.3% 2.8% 5.8% 4.5% 6.6% 5.3% 2023-2027 0.9% 1.7% 2.5% 1.9% 4.3% 2.6% 2028-2037 1.4% 1.4% 1.8% 1.8% 2.9% 2.5% 2018-2037 1.3% 1.8% 2.9% 2.5% 4.2% 3.3%
Source: RS&H, 2018

A V I A T I O N A C T I V I T Y F O R E C A S T
SLC Department of Airports – Airport Master Plan Update 2-56
TABLE 2-13 TOTAL ENPLANEMENTS FORECASTS (2017-2037)
Fiscal Year FAA TAF 2017 Low Case Scenario Forecast
Base Case Forecast
High Case Scenario Forecast
2017 11,515,639 11,515,639 11,515,639 11,515,639 2018 11,960,071 12,114,825 13,110,216 13,523,198 2019 12,284,399 12,395,681 13,421,956 13,847,845 2020 12,575,476 12,633,264 13,703,235 14,175,504 2021 12,847,704 12,866,306 13,962,000 14,506,141 2022 13,121,857 13,104,019 14,228,573 14,839,869 2023 13,391,866 13,332,415 14,510,090 15,176,732 2024 13,662,276 13,562,675 14,794,388 15,602,158 2025 13,931,873 13,795,376 15,081,219 16,034,266 2026 14,212,655 14,029,503 15,369,759 16,473,165 2027 14,499,142 14,260,831 15,662,157 16,918,931 2028 14,796,623 14,489,506 15,958,938 17,371,731 2029 15,100,690 14,715,979 16,257,287 17,831,614 2030 15,405,642 14,939,660 16,557,139 18,298,711 2031 15,715,354 15,159,712 16,857,553 18,773,142 2032 16,022,593 15,375,242 17,158,168 19,255,030 2033 16,326,068 15,585,712 17,458,811 19,744,437 2034 16,638,974 15,791,823 17,759,671 20,241,571 2035 16,963,658 15,994,359 18,061,119 20,746,451 2036 17,293,073 16,192,889 18,363,313 21,259,310 2037 17,623,339 16,387,346 18,666,374 21,780,203
Average Annual Growth Rates (AAGR) 2018-2022 2.7% 2.6% 4.4% 5.4% 2023-2027 2.0% 1.7% 3.1% 4.4% 2028-2037 2.0% 1.4% 1.8% 2.6% 2018-2037 2.2% 1.8% 2.8% 3.7%
Source: RS&H, 2018

A V I A T I O N A C T I V I T Y F O R E C A S T
SLC Department of Airports – Airport Master Plan Update 2-57
FIGURE 2-27 INTERNATIONAL ENPLANEMENTS – HISTORICAL (2003-2017) AND FORECAST (2018-2037)
Source: RS&H, 2018
0
200,000
400,000
600,000
800,000
1,000,000
1,200,000
2003
2004
2005
2006
2007
2008
2009
2010
2011
2012
2013
2014
2015
2016
2017
2018
2019
2020
2021
2022
2023
2024
2025
2026
2027
2028
2029
2030
2031
2032
2033
2034
2035
2036
2037
Inte
rnat
iona
l Enp
lane
men
ts
Fiscal Year
Historical Low Case Scenario Forecast Base Case Forecast High Case Scenario Forecast
Historical Forecast

A V I A T I O N A C T I V I T Y F O R E C A S T
SLC Department of Airports – Airport Master Plan Update 2-58
FIGURE 2-28 DOMESTIC ENPLANEMENTS – HISTORICAL (2003-2017) AND FORECAST (2018-2037)
Source: RS&H, 2018
5,000,000
9,000,000
13,000,000
17,000,000
21,000,000
25,000,000
2003
2004
2005
2006
2007
2008
2009
2010
2011
2012
2013
2014
2015
2016
2017
2018
2019
2020
2021
2022
2023
2024
2025
2026
2027
2028
2029
2030
2031
2032
2033
2034
2035
2036
2037
Dom
estic
Enp
lane
men
ts
Fiscal Year
Historical Low Case Scenario Forecast Base Case Forecast High Case Scenario Forecast
Historical Forecast

A V I A T I O N A C T I V I T Y F O R E C A S T
SLC Department of Airports – Airport Master Plan Update 2-59
FIGURE 2-29 TOTAL ENPLANEMENTS- HISTORICAL (1993-2017) AND FORECAST (2018-2038)
Source: RS&H, 2018
0
2,000,000
4,000,000
6,000,000
8,000,000
10,000,000
12,000,000
14,000,000
16,000,000
18,000,000
20,000,000
22,000,000
24,000,000
1993
1994
1995
1996
1997
1998
1999
2000
2001
2002
2003
2004
2005
2006
2007
2008
2009
2010
2011
2012
2013
2014
2015
2016
2017
2018
2019
2020
2021
2022
2023
2024
2025
2026
2027
2028
2029
2030
2031
2032
2033
2034
2035
2036
2037
Tota
l Enp
lane
men
ts
Fiscal YearHistorical TAF 2017Low Case Scenario Forecast Base Case ForecastHigh Case Scenario Forecast
Historical Forecast

A V I A T I O N A C T I V I T Y F O R E C A S T
SLC Department of Airports – Airport Master Plan Update 2-60
2.5 PLANNING DAY MODEL
2.5.1 Planning Day Model Methodology The demand for an airport is identified by incorporating all of the characteristics that express how a total number of enplanements can be achieved. In order to recognize each of them, a daily planning model is often created. Planning models, are very useful tools in establishing facility requirements, as they represent the frequency of arriving and departing aircraft for an Average Day of the Peak Month (ADPM). In addition, they also recognize the equipment used, and how full the planes are. Four planning model schedules (2022, 2027, 2032, and 2037) were produced for each planning scenario, Base, Low, and High Cases. Each planning model schedule was based upon the assumed average day of the peak month for 2018 which was July 19, 201838 that had 377 arrivals and departures. Each schedule scenario for the Base, Low, and High Cases used initial load factors that were provided by Delta for June 1-June 12, 2018 and applied to all Delta flights by market. Initial load factors for all other airlines were obtained from BTS T-100 Segment Data, 2013-2017. Forecast assumptions included:
» Addition of new markets, as reflected from conversations with Airport staff, airline representatives, research about future industry trends, comments made during the Expert Panel session, and other related research conducted, in an effort to make each planning day model more robust.
» Addition of incremental frequencies were added to existing markets where the base schedule load factor exceeded 85%, and to new markets with an initial 80% load factor. All incremental frequencies were added at times of the day that complemented existing schedules.
» Flights were added at times respecting the current structure of Delta’s banks of arrivals and departures.
» Equipment changes were upgauged based upon existing airline fleets, orders, and options with highest load factor flights by market being upgraded first. Load factors for equipment upgrades largely remained the same as on the prior equipment, assuming high load factors existing prior to the upgrade would fill the larger aircraft over the five-year interval between forecasts.
2.5.2 Baseline Flight Schedule 2018 The flight schedule for an ADPM in 2018, identified a total of 377 arriving and 377 departing commercial service operations, with 12 of the arrivals and 12 of the departures being international flights. The peak hour for arrivals was 7:00 pm with 49 operations, and the peak hour for departures was 11:00 am with 51 operations. For international operations, 12:00 pm, 1:00 pm, and 6:00 pm each had two arrivals; and 9:00 am and 11:00 am each had three departures. The peak hour for combined departures and arrivals was at 1:00 pm with 64 total operations. 38 An analysis of the enplanements by month over the past five fiscal years identified July as the Airport’s peak month.

A V I A T I O N A C T I V I T Y F O R E C A S T
SLC Department of Airports – Airport Master Plan Update 2-61
FIGURE 2-30 shows the ADPM for the Baseline Flight Schedule of July 19, 2018. TABLE 2-14 shows a summary of the mainline carrier’s operations for the planning day model with a list of each type of equipment used.

A V I A T I O N A C T I V I T Y F O R E C A S T
SLC Department of Airports – Airport Master Plan Update 2-62
FIGURE 2-30 TOTAL OPERATIONS ADPM BASELINE SCHEDULE (2017)
Source: Mary A. Lynch, 2018
0
10
20
30
40
50
600:
00
1:00
2:00
3:00
4:00
5:00
6:00
7:00
8:00
9:00
10:0
0
11:0
0
12:0
0
13:0
0
14:0
0
15:0
0
16:0
0
17:0
0
18:0
0
19:0
0
20:0
0
21:0
0
22:0
0
23:0
0
Arrivals Departures

A V I A T I O N A C T I V I T Y F O R E C A S T
SLC Department of Airports – Airport Master Plan Update 2-63
TABLE 2-14 BASELINE SCHEDULE 2018 AIRLINE SUMMARY
Airline Arrivals Departures Equipment (IATA Code)
Aeroméxico 1 1 E90
Alaska Airlines 12 12 739, 73H, 73J, E75
American Airlines
20 20 319, 321, 738, CR7, E75
Delta Air Lines 277 277 319, 320, 321, 717, 738, 739, 757, 76W, CRJ, CR7, CR9, E75, E7W,
M90 Frontier Airlines 4 4 320, 321
JetBlue Airways
7 7 320
Southwest Airlines 33 33 73H, 73W
United Airlines
23 23 319, 320, 739, 73G, CRJ, CR7, E70, E7W, 73H, 73W
Total 377 377 Source: Mary A. Lynch, 2018
2.5.3 Planning Day Model Base Case Forecast The Base Case Forecast Planning Day Model summarizes the operational counts and times for the four forecast years listed below:
» FY 2022 projects a total of 413 arriving and 413 departing commercial service operations, with 14 of the arrivals, and 14 of the departures being international flights. The peak hour for total arrivals is 10:00 am with 50 operations, and total departures is 11:00 am with 56 operations. For international operations, 10:00 am, 12:00 pm, 1:00 pm, 4:00 pm, and 6:00 pm each have two arrivals, and 11:00 am has four departures. The peak hour for combined departures and arrivals is at 1:00 pm with 76 total operations. Average day peak month FY 2022 domestic operations are shown in FIGURE 2-31, international operations are shown in FIGURE 2-35, and total operations are shown in FIGURE 2-39.
» FY 2027 projects a total of 453 arriving and 453 departing commercial service operations, with 19 of the arrivals, and 19 of the departures being international flights. The peak hour for total arrivals is 10:00 am with 55 operations, and total departures is 11:00 am with 60 operations. For international operations, 10:00 am, 12:00 pm, and 6:00 pm each have three arrivals, and 11:00 am has four departures. The peak hour for combined departures and arrivals is at 1:00 pm with 82 total operations. Average day peak month FY 2027 domestic operations are shown in FIGURE

A V I A T I O N A C T I V I T Y F O R E C A S T
SLC Department of Airports – Airport Master Plan Update 2-64
2-32, international operations are shown in FIGURE 2-36, and total operations are shown in FIGURE 2-40.
» FY 2032 projects a total of 475 arriving and 475 departing commercial service operations, with 24 of the arrivals, and 24 of the departures being international flights. The peak hour for total arrivals is 10:00 am with 57 operations, and total departures is 11:00 am with 62 operations. For international operations, 6:00 pm has four arrivals, and 11:00 am and 8:00 pm each have four departures. The peak hour for combined departures and arrivals is at 1:00 pm with 84 total operations. Average day peak month FY 2032 domestic operations are shown in FIGURE 2-33, international operations are shown in FIGURE 2-37, and total operations are shown in FIGURE 2-41.
» FY 2037 projects a total of 503 arriving and 503 departing commercial service operations, with 27 of the arrivals, and 27 of the departures being international flights. The peak hour for total arrivals is 10:00 am with 58 operations, and total departures is 11:00 am with 63 operations. For international operations, 1:00 pm and 6:00 pm each have four arrivals, and 11:00 am and 8:00 pm each have four departures. The peak hour for combined departures and arrivals is at 1:00 pm with 94 total operations. Average day peak month FY 2037 domestic operations are shown in FIGURE 2-34, international operations are shown in FIGURE 2-38, and total operations are shown in FIGURE 2-42.

A V I A T I O N A C T I V I T Y F O R E C A S T
SLC Department of Airports – Airport Master Plan Update 2-65
FIGURE 2-31 DOMESTIC OPERATIONS ADPM BASE CASE FORECAST (2022)
Source: Mary A. Lynch, 2018
0
10
20
30
40
50
600:
00
1:00
2:00
3:00
4:00
5:00
6:00
7:00
8:00
9:00
10:0
0
11:0
0
12:0
0
13:0
0
14:0
0
15:0
0
16:0
0
17:0
0
18:0
0
19:0
0
20:0
0
21:0
0
22:0
0
23:0
0
Arrivals Departures

A V I A T I O N A C T I V I T Y F O R E C A S T
SLC Department of Airports – Airport Master Plan Update 2-66
FIGURE 2-32 DOMESTIC OPERATIONS ADPM BASE CASE FORECAST (2027)
Source: Mary A. Lynch, 2018
0
10
20
30
40
50
600:
00
1:00
2:00
3:00
4:00
5:00
6:00
7:00
8:00
9:00
10:0
0
11:0
0
12:0
0
13:0
0
14:0
0
15:0
0
16:0
0
17:0
0
18:0
0
19:0
0
20:0
0
21:0
0
22:0
0
23:0
0
Arrivals Departures

A V I A T I O N A C T I V I T Y F O R E C A S T
SLC Department of Airports – Airport Master Plan Update 2-67
FIGURE 2-33 DOMESTIC OPERATIONS ADPM BASE CASE FORECAST (2032)
Source: Mary A. Lynch, 2018
0
10
20
30
40
50
60
700:
00
1:00
2:00
3:00
4:00
5:00
6:00
7:00
8:00
9:00
10:0
0
11:0
0
12:0
0
13:0
0
14:0
0
15:0
0
16:0
0
17:0
0
18:0
0
19:0
0
20:0
0
21:0
0
22:0
0
23:0
0
Arrivals Departures

A V I A T I O N A C T I V I T Y F O R E C A S T
SLC Department of Airports – Airport Master Plan Update 2-68
FIGURE 2-34 DOMESTIC OPERATIONS ADPM BASE CASE FORECAST (2037)
Source: Mary A. Lynch, 2018
0
10
20
30
40
50
60
700:
00
1:00
2:00
3:00
4:00
5:00
6:00
7:00
8:00
9:00
10:0
0
11:0
0
12:0
0
13:0
0
14:0
0
15:0
0
16:0
0
17:0
0
18:0
0
19:0
0
20:0
0
21:0
0
22:0
0
23:0
0
Arrivals Departures

A V I A T I O N A C T I V I T Y F O R E C A S T
SLC Department of Airports – Airport Master Plan Update 2-69
FIGURE 2-35 INTERNATIONAL OPERATIONS ADPM BASE CASE FORECAST (2022)
Source: Mary A. Lynch, 2018
0
1
2
3
4
5
6
7
8
9
100:
00
1:00
2:00
3:00
4:00
5:00
6:00
7:00
8:00
9:00
10:0
0
11:0
0
12:0
0
13:0
0
14:0
0
15:0
0
16:0
0
17:0
0
18:0
0
19:0
0
20:0
0
21:0
0
22:0
0
23:0
0
Arrivals Departures

A V I A T I O N A C T I V I T Y F O R E C A S T
SLC Department of Airports – Airport Master Plan Update 2-70
FIGURE 2-36 INTERNATIONAL OPERATOINS ADPM BASE CASE FORECAST (2027)
Source: Mary A. Lynch, 2018
0
1
2
3
4
5
6
7
8
9
100:
00
1:00
2:00
3:00
4:00
5:00
6:00
7:00
8:00
9:00
10:0
0
11:0
0
12:0
0
13:0
0
14:0
0
15:0
0
16:0
0
17:0
0
18:0
0
19:0
0
20:0
0
21:0
0
22:0
0
23:0
0
Arrivals Departures
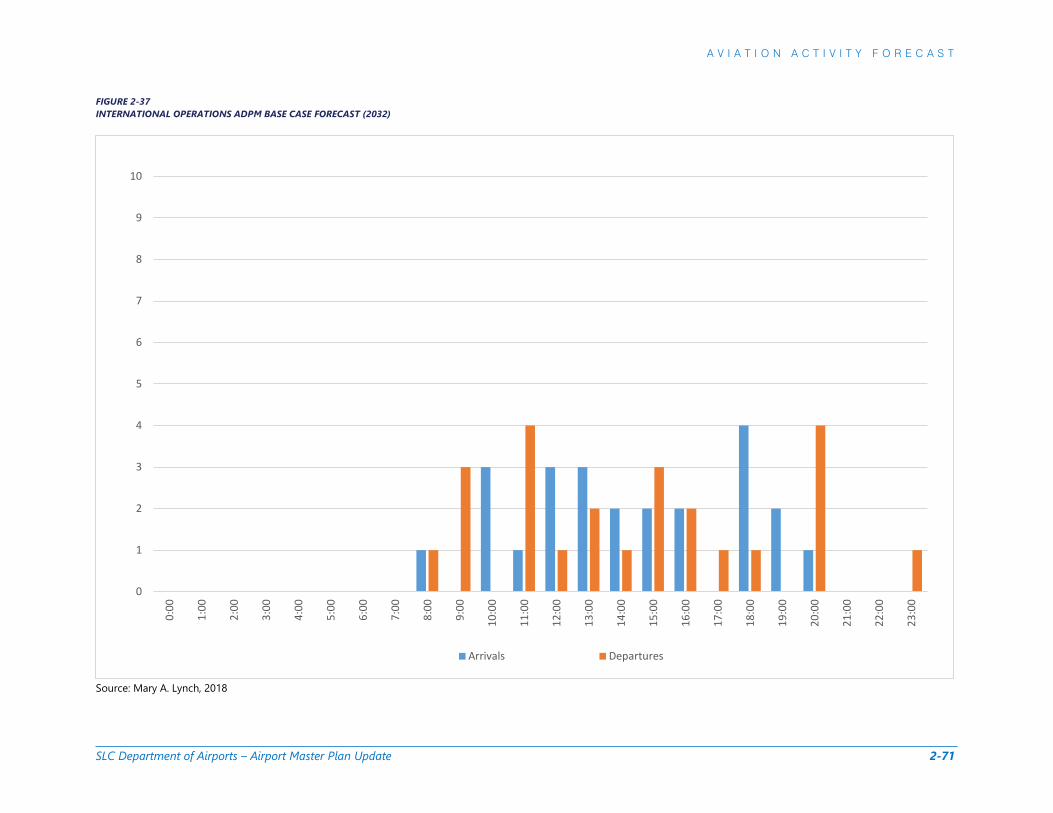
A V I A T I O N A C T I V I T Y F O R E C A S T
SLC Department of Airports – Airport Master Plan Update 2-71
FIGURE 2-37 INTERNATIONAL OPERATIONS ADPM BASE CASE FORECAST (2032)
Source: Mary A. Lynch, 2018
0
1
2
3
4
5
6
7
8
9
100:
00
1:00
2:00
3:00
4:00
5:00
6:00
7:00
8:00
9:00
10:0
0
11:0
0
12:0
0
13:0
0
14:0
0
15:0
0
16:0
0
17:0
0
18:0
0
19:0
0
20:0
0
21:0
0
22:0
0
23:0
0
Arrivals Departures

A V I A T I O N A C T I V I T Y F O R E C A S T
SLC Department of Airports – Airport Master Plan Update 2-72
FIGURE 2-38 INTERNATIONAL OPERATIONS ADPM BASE CASE FORECAST (2037)
Source: Mary A. Lynch, 2018
0
1
2
3
4
5
6
7
8
9
100:
00
1:00
2:00
3:00
4:00
5:00
6:00
7:00
8:00
9:00
10:0
0
11:0
0
12:0
0
13:0
0
14:0
0
15:0
0
16:0
0
17:0
0
18:0
0
19:0
0
20:0
0
21:0
0
22:0
0
23:0
0
Arrivals Departures

A V I A T I O N A C T I V I T Y F O R E C A S T
SLC Department of Airports – Airport Master Plan Update 2-73
FIGURE 2-39 TOTAL OPERATIONS ADPM BASE CASE FORECAST (2022)
Source: Mary A. Lynch, 2018
0
10
20
30
40
50
60
0:00
1:00
2:00
3:00
4:00
5:00
6:00
7:00
8:00
9:00
10:0
0
11:0
0
12:0
0
13:0
0
14:0
0
15:0
0
16:0
0
17:0
0
18:0
0
19:0
0
20:0
0
21:0
0
22:0
0
23:0
0
Arrivals Departures

A V I A T I O N A C T I V I T Y F O R E C A S T
SLC Department of Airports – Airport Master Plan Update 2-74
FIGURE 2-40 TOTAL OPERATIONS ADPM BASE CASE FORECAST (2027)
Source: Mary A. Lynch, 2018
0
10
20
30
40
50
60
700:
00
1:00
2:00
3:00
4:00
5:00
6:00
7:00
8:00
9:00
10:0
0
11:0
0
12:0
0
13:0
0
14:0
0
15:0
0
16:0
0
17:0
0
18:0
0
19:0
0
20:0
0
21:0
0
22:0
0
23:0
0
Arrivals Departures

A V I A T I O N A C T I V I T Y F O R E C A S T
SLC Department of Airports – Airport Master Plan Update 2-75
FIGURE 2-41 TOTAL OPERATIONS ADPM BASE CASE FORECAST (2032)
Source: Mary A. Lynch, 2018
0
10
20
30
40
50
60
700:
00
1:00
2:00
3:00
4:00
5:00
6:00
7:00
8:00
9:00
10:0
0
11:0
0
12:0
0
13:0
0
14:0
0
15:0
0
16:0
0
17:0
0
18:0
0
19:0
0
20:0
0
21:0
0
22:0
0
23:0
0
Arrivals Departures

A V I A T I O N A C T I V I T Y F O R E C A S T
SLC Department of Airports – Airport Master Plan Update 2-76
FIGURE 2-42 TOTAL OPERATIONS ADPM BASE CASE FORECAST (2037)
Source: Mary A. Lynch, 2018
0
10
20
30
40
50
60
700:
00
1:00
2:00
3:00
4:00
5:00
6:00
7:00
8:00
9:00
10:0
0
11:0
0
12:0
0
13:0
0
14:0
0
15:0
0
16:0
0
17:0
0
18:0
0
19:0
0
20:0
0
21:0
0
22:0
0
23:0
0
Arrivals Departures

A V I A T I O N A C T I V I T Y F O R E C A S T
SLC Department of Airports – Airport Master Plan Update 2-77
2.5.4 Planning Day Model Low Case Scenario Forecast The Low Case Scenario Forecast Planning Day Model projects the following operational counts and times for the forecast years listed below:
» FY 2022 projects a total of 400 arriving and 400 departing commercial service operations, with 13 of the arrivals, and 13 of the departures being international flights. The peak hour for total arrivals is 10:00 am and 7:00 pm, with each having 49 operations, and total departures is 11:00 am with 55 operations. For international operations, 10:00 am, 12:00 pm, 1:00 pm, 4:00 pm, and 6:00 pm each have two arrivals, and 11:00 am has four departures. The peak hour for combined departures and arrivals is at 1:00 pm with 70 total operations. Total operations for the average day of peak month in FY 2022 are shown in FIGURE 2-43.
» FY 2027 projects a total of 422 arriving and 422 departing commercial service operations, with 16 of the arrivals, and 16 of the departures being international flights. The peak hour for total arrivals is 10:00 am with 52 operations, and total departures is 11:00 am with 57 operations. For international operations, 10:00 am and 6:00 pm each have three arrivals, and 11:00 am has four departures. The peak hour for combined departures and arrivals is at 1:00 pm with 77 total operations. Total operations for the average day of peak month in FY 2027 are shown in FIGURE 2-44.
» FY 2032 projects a total of 438 arriving and 438 departing commercial service operations, with 18 of the arrivals, and 18 of the departures being international flights. The peak hour for total arrivals is 10:00 am with 54 operations, and total departures is 11:00 am with 60 operations. For international operations, 10:00 am and 6:00 pm each have three arrivals, and 11:00 am has four departures. The peak hour for combined departures and arrivals is at 1:00 pm with 79 total operations. Total operations for the average day of peak month in FY 2032 are shown in FIGURE 2-45.
» FY 2037 projects a total of 450 arriving and 450 departing commercial service operations, with 20 of the arrivals, and 20 of the departures being international flights. The peak hour for total arrivals is 10:00 am with 54 operations, and total departures is 11:00 am with 60 operations. For international operations, 10:00 am, 12:00 pm, and 6:00 pm each have three arrivals, and 11:00 am has four departures. The peak hour for combined departures and arrivals is at 1:00 pm with 83 total operations. Total operations for the average day of peak month in FY 2037 are shown in FIGURE 2-46.
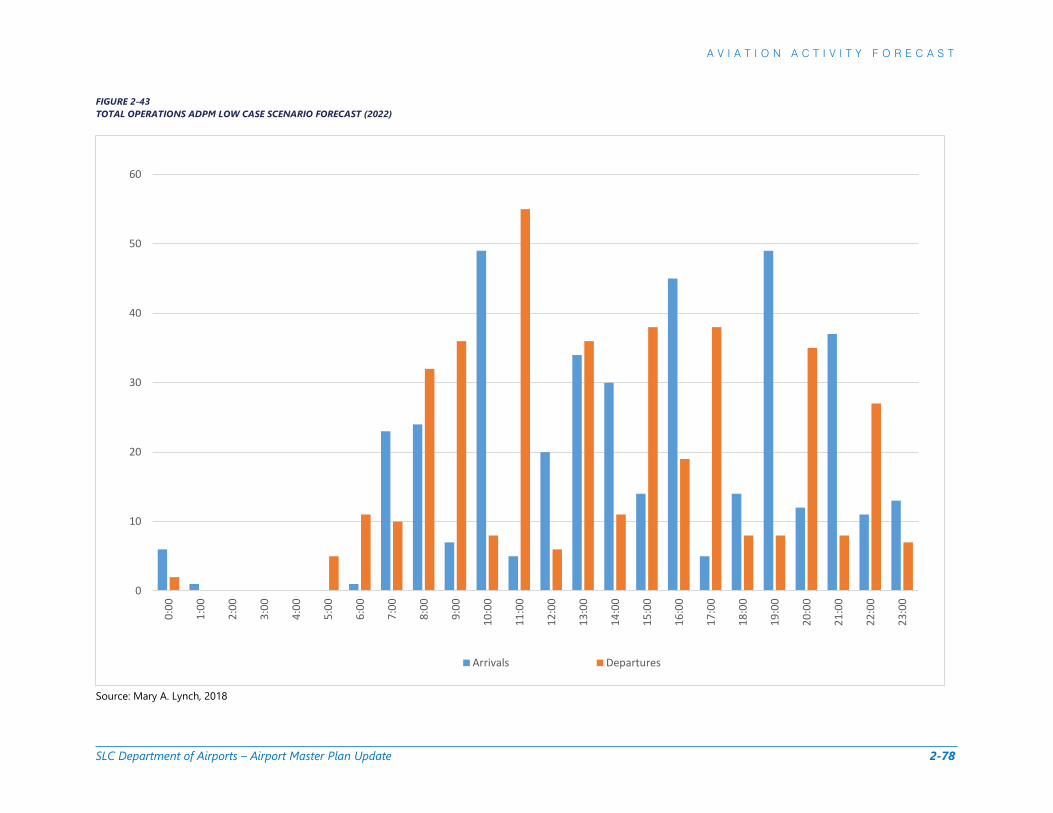
A V I A T I O N A C T I V I T Y F O R E C A S T
SLC Department of Airports – Airport Master Plan Update 2-78
FIGURE 2-43 TOTAL OPERATIONS ADPM LOW CASE SCENARIO FORECAST (2022)
Source: Mary A. Lynch, 2018
0
10
20
30
40
50
600:
00
1:00
2:00
3:00
4:00
5:00
6:00
7:00
8:00
9:00
10:0
0
11:0
0
12:0
0
13:0
0
14:0
0
15:0
0
16:0
0
17:0
0
18:0
0
19:0
0
20:0
0
21:0
0
22:0
0
23:0
0
Arrivals Departures

A V I A T I O N A C T I V I T Y F O R E C A S T
SLC Department of Airports – Airport Master Plan Update 2-79
FIGURE 2-44 TOTAL OPERATIONS ADPM LOW CASE SCENARIO FORECAST (2027)
Source: Mary A. Lynch, 2018
0
10
20
30
40
50
600:
00
1:00
2:00
3:00
4:00
5:00
6:00
7:00
8:00
9:00
10:0
0
11:0
0
12:0
0
13:0
0
14:0
0
15:0
0
16:0
0
17:0
0
18:0
0
19:0
0
20:0
0
21:0
0
22:0
0
23:0
0
Arrivals Departures

A V I A T I O N A C T I V I T Y F O R E C A S T
SLC Department of Airports – Airport Master Plan Update 2-80
FIGURE 2-45 TOTAL OPERATIONS ADPM LOW CASE SCENARIO FORECAST (2032)
Source: Mary A. Lynch, 2018
0
10
20
30
40
50
60
700:
00
1:00
2:00
3:00
4:00
5:00
6:00
7:00
8:00
9:00
10:0
0
11:0
0
12:0
0
13:0
0
14:0
0
15:0
0
16:0
0
17:0
0
18:0
0
19:0
0
20:0
0
21:0
0
22:0
0
23:0
0
Arrivals Departures

A V I A T I O N A C T I V I T Y F O R E C A S T
SLC Department of Airports – Airport Master Plan Update 2-81
FIGURE 2-46 TOTAL OPERATIONS ADPM LOW CASE SCENARIO FORECAST (2037)
Source: Mary A. Lynch, 2018
0
10
20
30
40
50
60
700:
00
1:00
2:00
3:00
4:00
5:00
6:00
7:00
8:00
9:00
10:0
0
11:0
0
12:0
0
13:0
0
14:0
0
15:0
0
16:0
0
17:0
0
18:0
0
19:0
0
20:0
0
21:0
0
22:0
0
23:0
0
Arrivals Departures

A V I A T I O N A C T I V I T Y F O R E C A S T
SLC Department of Airports – Airport Master Plan Update 2-82
2.5.5 Planning Day Model High Case Scenario Forecast The High Case Scenario Forecast Planning Day Model projects the following operational counts and times for the forecast years listed below:
» FY 2022 projects a total of 413 arriving and departing commercial service operations, with 14 of the arrivals, and 14 of the departures being international flights. The peak hour for total arrivals is 10:00 am with 50 operations, and total departures is 11:00 am with 56 operations. For international operations, 10:00 am, 12:00 pm, 1:00 pm, 4:00 pm, and 6:00 pm each have two arrivals, and 11:00 am has four departures. The peak hour for combined departures and arrivals is at 1:00 pm with 76 total operations. FIGURE 2-47 shows the total operations of average day and peak month for FY 2022.
» FY 2027 projects a total of 480 arriving and departing commercial service operations, with 24 of the arrivals, and 24 of the departures being international flights. The peak hour for total arrivals is 10:00 am with 57 operations, and total departures is 11:00 am with 62 operations. For international operations, 1:00 pm and 6:00 pm each have four arrivals, and 11:00 am has four departures. The peak hour for combined departures and arrivals is at 1:00 pm with 91 total operations. FIGURE 2-48 shows the total operations of average day and peak month for FY 2027.
» FY 2032 projects a total of 517 arriving and departing commercial service operations, with 29 of the arrivals, and 29 of the departures being international flights. The peak hour for total arrivals is 10:00 am with 58 operations, and total departures is 11:00 am with 63 operations. For international operations, 1:00 pm has five arrivals, and 11:00 am and 4:00 pm each have four departures. The peak hour for combined departures and arrivals is at 1:00 pm with 103 total operations. FIGURE 2-49 shows the total operations of average day and peak month for FY 2032.
» FY 2037 projects a total of 561 arriving and departing commercial service operations, with 32 of the arrivals, and 32 of the departures being international flights. The peak hour for total arrivals is 10:00 am with 62 operations, and total departures is 11:00 am with 66 operations. For international operations, 1:00 pm has five arrivals, and 11:00 am, 1:00 pm, 3:00 pm, and 4:00 pm each have four departures. The peak hour for combined departures and arrivals is at 1:00 pm with 111 total operations. FIGURE 2-50 shows the total operations of average day and peak month for FY 2037.

A V I A T I O N A C T I V I T Y F O R E C A S T
SLC Department of Airports – Airport Master Plan Update 2-83
FIGURE 2-47 TOTAL OPERATIONS ADPM HIGH CASE SCENARIO FORECAST (2022)
Source: Mary A. Lynch, 2018
0
10
20
30
40
50
600:
00
1:00
2:00
3:00
4:00
5:00
6:00
7:00
8:00
9:00
10:0
0
11:0
0
12:0
0
13:0
0
14:0
0
15:0
0
16:0
0
17:0
0
18:0
0
19:0
0
20:0
0
21:0
0
22:0
0
23:0
0
Arrivals Departures

A V I A T I O N A C T I V I T Y F O R E C A S T
SLC Department of Airports – Airport Master Plan Update 2-84
FIGURE 2-48 TOTAL OPERATIONS ADPM HIGH CASE SCENARIO FORECAST (2027)
Source: Mary A. Lynch, 2018
0
10
20
30
40
50
60
700:
00
1:00
2:00
3:00
4:00
5:00
6:00
7:00
8:00
9:00
10:0
0
11:0
0
12:0
0
13:0
0
14:0
0
15:0
0
16:0
0
17:0
0
18:0
0
19:0
0
20:0
0
21:0
0
22:0
0
23:0
0
Arrivals Departures

A V I A T I O N A C T I V I T Y F O R E C A S T
SLC Department of Airports – Airport Master Plan Update 2-85
FIGURE 2-49 TOTAL OPERATIONS ADPM HIGH CASE SCENARIO FORECAST (2032)
Source: Mary A. Lynch, 2018
0
10
20
30
40
50
60
700:
00
1:00
2:00
3:00
4:00
5:00
6:00
7:00
8:00
9:00
10:0
0
11:0
0
12:0
0
13:0
0
14:0
0
15:0
0
16:0
0
17:0
0
18:0
0
19:0
0
20:0
0
21:0
0
22:0
0
23:0
0
Arrivals Departures

A V I A T I O N A C T I V I T Y F O R E C A S T
SLC Department of Airports – Airport Master Plan Update 2-86
FIGURE 2-50 TOTAL OPERATIONS ADPM HIGH CASE SCENARIO FORECAST (2037)
Source: Mary A. Lynch, 2018
0
10
20
30
40
50
60
70
0:00
1:00
2:00
3:00
4:00
5:00
6:00
7:00
8:00
9:00
10:0
0
11:0
0
12:0
0
13:0
0
14:0
0
15:0
0
16:0
0
17:0
0
18:0
0
19:0
0
20:0
0
21:0
0
22:0
0
23:0
0
Arrivals Departures

A V I A T I O N A C T I V I T Y F O R E C A S T
SLC Department of Airports – Airport Master Plan Update 2-87
2.5.6 Peak Day and Total Passenger Air Carrier Operations Peak day passenger carrier operations forecasts were built off of the planning design day models of each forecast scenario. Total passenger air carrier operations were derived from the planning design day models by using the most recent five year average of peak month enplanements to annual enplanements or 9.5% peak month to annual.
There are two primary reasons for the dip in air carrier passenger operations between 2017 and 2018. The 2018 peak day operations were built off of actual schedules and there was a noticeable upgauge from one year to the next. In addition, 2017 operational figures were based upon the National Offload Program that included a number of on-demand operations that were classified as air passenger that are not reflected in the schedule.
TABLE 2-15 shows a comparison of the ADPM passenger operations by forecast from 2018-2037. TABLE 2-16 shows a comparison of the operations by passenger aircraft type operations from 2022-2037, andFIGURE 2-51 compares the total passenger operations from 2018-2037.
TABLE 2-15 SUMMARY OF ADPM PASSENGER CARRIER OPERATIONS FORECASTS (2018-2037)
Low Case Scenario Forecast
Base Case Forecast
High Case Scenario Forecast
FY Arrivals Departures Arrivals Departures Arrivals Departures
2018 377 377 377 377 377 377 2022 400 400 413 413 413 413 2027 422 422 453 453 480 480 2032 438 438 475 475 517 517 2037 450 450 503 503 561 560
Source: Mary A. Lynch, 2018

A V I A T I O N A C T I V I T Y F O R E C A S T
SLC Department of Airports – Airport Master Plan Update 2-88
TABLE 2-16 SUMMARY OF AIR CARRIER OPERATIONS FORECASTS BY AIRCRAFT TYPE (2022-2037)
Low Case Scenario Forecast Base Case Forecast High Case Scenario Forecast Passenger Aircraft 2022 2027 2032 2037 2022 2027 2032 2037 2022 2027 2032 2037
A220 - 4,781 6,830 6,830 3,415 7,513 13,660 19,124 3,415 14,343 23,222 30,052 A319 10,928 10,928 10,245 683 11,611 11,611 683 683 11,611 11,611 683 683 A320 21,856 2,049 - - 16,392 2,049 1,366 1,366 16,392 2,049 - -
A320neo - 21,856 33,467 46,443 6,147 30,052 43,711 51,907 6,147 32,101 49,858 51,907 A321 18,441 16,392 14,343 15,709 16,392 18,441 16,392 16,392 16,392 18,441 16,392 17,758
A321neo 4,098 4,781 8,196 8,196 4,781 8,196 12,977 14,343 4,781 10,928 17,075 24,588 A330 - 683 683 683 683 683 683 683 683 683 683 683 A339 - 3,415 4,098 4,781 3,415 4,098 4,781 4,781 3,415 4,781 4,781 5,464 A359 - - - - - - - - - - 683 683 712 12,294 12,294 12,294 - 12,294 12,294 12,294 12,294 12,294 12,294 - 737 22,539 22,539 16,392 16,392 22,539 16,392 14,343 14,343 22,539 16,392 14,343 10,928 738 40,297 41,663 28,686 14,343 41,663 44,394 15,026 14,343 41,663 44,394 15,026 15,026 739 20,490 5,464 5,464 2,732 21,173 5,464 6,147 3,415 21,173 6,147 6,147 3,415
MAX7 - - - 12,294 - - - 12,977 - - - 12,977 MAX8 683 19,807 41,663 59,420 2,732 31,418 64,201 70,348 2,732 34,833 73,080 86,740 763 2,732 - - - - - - - - - - -CRJ 3,415 3,073 3,073 3,073 2,732 2,732 2,732 2,732 2,732 2,732 2,732 3,415 CR7 45,760 46,102 33,808 33,808 46,443 47,809 47,809 47,809 46,443 10,586 10,245 10,928 CR9 17,075 17,075 32,101 32,784 17,075 19,124 19,124 19,124 17,075 56,347 56,688 56,688 E170 683 683 683 683 683 683 683 683 683 683 683 683 E175 43,029 45,760 45,760 47,126 43,029 45,077 45,077 45,760 43,029 45,760 45,760 47,809 E90 1,366 1,366 1,366 1,366 1,366 1,366 2,732 2,732 1,366 2,732 2,732 2,732 M90 7,513 7,513 - - 7,513 - - - 7,513 - - -Total 273,197 288,223 299,151 307,346 282,076 309,395 324,421 343,545 282,076 327,836 353,107 383,159
Source: Mary A. Lynch, 2018; RS&H, 2018

A V I A T I O N A C T I V I T Y F O R E C A S T
SLC Department of Airports – Airport Master Plan Update 2-89
FIGURE 2-51 PASSENGER OPERATIONS FORECASTS (1993-2037)
Source: Mary A. Lynch, 2018; RS&H, 2018
200000
220000
240000
260000
280000
300000
320000
340000
360000
380000
400000
1993
1994
1995
1996
1997
1998
1999
2000
2001
2002
2003
2004
2005
2006
2007
2008
2009
2010
2011
2012
2013
2014
2015
2016
2017
2018
2019
2020
2021
2022
2023
2024
2025
2026
2027
2028
2029
2030
2031
2032
2033
2034
2035
2036
2037
Pass
enge
r Ope
ratio
ns
Fiscal Year
Base Case Forecast Low Case Scenario Forecast High Case Scenario ForecastTAF 2017 Historical

A V I A T I O N A C T I V I T Y F O R E C A S T
SLC Department of Airports – Airport Master Plan Update 2-90
2.5.7 Electric Vertical Takeoff and Landing Operations The concept of autonomous and on-demand ridesharing air taxis or, Electric Vertical Takeoff and Landing (eVTOL) aircraft, is continuing to progress as one potential solution to urban congestion and increased mobility. In Uber Elevate’s white paper, titled Fast-Forwarding to a Future of On-Demand Urban Air Transportation39, some of the details for how an eVTOL system could function and what resources might be needed are described. In the paper, the use of the terms “vertiports” and “vertistops” are used to provide the means for connecting passengers from one destination to another. The vertiports and vertistops40, could potentially use the flat rooftops of existing buildings and facilities within already-built up urban and suburban areas or adjacent flat areas to these facilities. Overall, the concept aims to provide efficient service within urban and suburban environments using the eVTOL equipment. Uber Elevate assumes the maximum VTOL distance would be 120 miles, and the en route speed would be approximately 170 mph.
2.5.7.1 eVTOL Operations Forecast It is important that this Forecast recognize the eVTOL technology so that thought can be given to potential locations for facilities to serve these operations. However, it is felt the technology is so new that it is premature to provide an enplanements forecast.
In addition, the timing for the technology is also speculative. This Forecast assumes operations will not begin at airports like SLC until a few years after the technology becomes available. Given some of the Uber concepts and assumptions, this Forecast assumes that SLC would integrate regular eVTOL service to at least two or three destinations within 50 miles of the Airport and near the end of the planning horizon (2032-2037).
Even though certification and approval of eVTOL operations are anticipated to be sometime after 2022, the first active year with steady demand and ridership of eVTOL operations out of SLC is grossly estimated to be sometime after 2027 and will be part of the operations forecast by 2032. While the cost of the service is expected to be highest in its initial phases, increased ridership and success will likely lower fares over the long-term, adding to the overall number of passengers and operations.
TABLE 2-17 provides an initial estimate of potential activity based upon what would need to be a profitable venture. At this point, these forecasts are conjecture and are not included in the summary of total operations for SLC. Operations forecasts are based upon 10 percent of arrival air passenger operations generating commuter eVTOL operations with a fast-paced growth to 20 percent by 2037.
39 Uber Elevate (October 27, 2016) Retrieved online November 11, 2018 at: https://www.uber.com/elevate.pdf/ 40 Uber Elevate identifies vertiports as sites for eVTOLs with multiple takeoff and landing pads, and vertistops as a single takeoff and landing pad.

A V I A T I O N A C T I V I T Y F O R E C A S T
SLC Department of Airports – Airport Master Plan Update 2-91
TABLE 2-17 EVTOL OPERATIONS FORECAST (2022-2037)
Low Scenario Forecast Base Case Forecast High Scenario Forecast Year eVTOL Operations Total eVTOL Operations Total eVTOL Operations 2022 0 0 0 2027 0 0 0 2032 15,998 17,349 18,883 2037 32,873 36,744 40,981
Source: RS&H, 2018

A V I A T I O N A C T I V I T Y F O R E C A S T
SLC Department of Airports – Airport Master Plan Update 2-92
2.6 AIR CARGO
2.6.1 Historical Air Cargo Over the past decade, SLC has shown continual growth in its air cargo activity. The following historical41 analysis and forecasts define the Airport’s air cargo activity, which is made up of freight and belly cargo, with air mail being a subcategory of the total belly cargo poundage. TABLE 2-18 provides the annual totals of air cargo by type, with TABLE 2-19 showing the total air cargo processed by the largest air cargo carriers and all others combined. FIGURE 2-52 compares the shares of total air cargo by the largest air cargo carriers, and FIGURE 2-53 compares the total enplaned and deplaned cargo from 2008 to 2017.
2.6.1.1 Historical Freight Since 2008, Federal Express (FedEx) and the United Parcel Service (UPS) have maintained their roles as the most active integrated cargo carrier operators out of SLC. FIGURE 2-54 compares the largest shares of air cargo freight at SLC in 2008 and 2017. During the past ten years UPS has increased its total freight share at the Airport by 12% going from 66,340,875 lbs to 117,415,471 lbs Meanwhile, FedEx the largest cargo operator at the Airport, has decreased its total freight share by over 5%, however, it still maintains the greatest quantity of total freight processed by any integrated cargo carrier. The annual enplaned and deplaned freight totals out of SLC has remained somewhat consistent in quantity over the past 10 years, with the totals never differing by more than 10.7%. TABLE 2-18 and FIGURE 2-55 provides the enplaned, deplaned, and total freight annually from 2008-2017. Finally, TABLE 2-19 shows the annual freight poundage processed by the largest cargo carriers at SLC from 2008-2017.
2.6.1.2 Historical Belly Cargo The two mainline carriers (Delta Air Lines and Southwest Airlines) with the greatest number of enplanements at SLC, have also maintained the greatest amount of belly cargo poundage processed from 2008-2017. The belly cargo poundage deplaned has consistently been greater than the poundage enplaned, although both annual quantities are similar in size. In base year 2017, DL increased its share of belly cargo at SLC from 2008 by over 9%, and WN decreased its share by over 4% during the same time. FIGURE 2-56 compares the largest shares of belly cargo out of SLC. TABLE 2-18 and FIGURE 2-57 show the historical enplaned and deplaned belly cargo from 2008 to 2017.
2.6.1.3 Historical Air Mail The air mail processed into/out of SLC is carried by both combination and integrated cargo carriers. While statistics track the number of pounds (lbs) of mail, there are no totals differentiating specific amount of mail carried by particular airlines, whether a combination of passenger and belly cargo by passengers airlines or freight by the all-cargo airlines. Therefore, these forecasts do not identify a separate forecast of airmail and assume forecasts of belly cargo and all-cargo include air mail. Air mail has changed in type over the past ten years. In 2008, the enplaned air mail was 22.5% greater than deplaned air mail. Today, the enplaned air mail is 72.3% greater than the deplaned air mail. TABLE 2-18 provides annual air mail and belly cargo totals, and FIGURE 2-58 shows the historical enplaned and deplaned air mail from 2008-2017.
41 Historical air cargo data is in calendar year (CY)

A V I A T I O N A C T I V I T Y F O R E C A S T
SLC Department of Airports – Airport Master Plan Update 2-93
TABLE 2-18 HISTORICAL CARGO ACTIVITY (2008-2017)
Calendar Year 2008 2009 2010 2011 2012 2013 2014 2015 2016 2017 Freight
Enplaned 151,358,775 125,888,128 130,459,300 146,249,045 153,946,751 154,977,560 152,917,822 153,099,983 151,307,031 160,318,645 Deplaned 149,477,489 121,447,154 130,955,226 140,983,568 145,182,640 140,001,183 140,295,248 150,331,450 167,428,531 179,459,334
Total 300,836,264 247,335,282 261,414,526 287,232,613 299,129,391 294,978,743 293,213,070 303,431,433 318,735,562 339,777,979 Belly Cargo
Enplaned 19,352,125 18,830,160 20,708,863 19,249,059 20,279,288 17,548,078 15,886,630 15,553,022 14,499,148 18,138,413 Deplaned 24,436,588 23,233,411 27,936,108 24,481,006 24,794,930 24,133,275 19,524,528 20,523,272 20,513,034 24,286,719
Total 43,788,713 42,063,571 48,644,971 43,730,065 45,074,218 41,681,353 35,411,158 36,076,294 35,012,182 42,425,132 Air Mail*
Enplaned 5,184,840 5,030,709 7,101,860 11,822,427 16,220,471 20,302,479 18,786,949 24,111,040 20,338,710 23,476,276 Deplaned 4,230,725 4,522,865 3,481,273 5,849,551 8,509,006 9,693,709 9,444,067 12,739,257 10,079,570 13,618,441
Total 9,415,565 9,553,574 10,583,133 17,671,978 24,729,477 29,996,188 28,231,016 36,850,297 30,418,280 37,094,717 Total Air Cargo*
Enplaned 170,710,900 144,718,288 151,168,163 165,498,104 174,226,039 172,525,638 168,804,452 168,653,005 165,806,179 178,457,058 Deplaned 173,914,077 144,680,565 158,891,334 165,464,574 169,977,570 164,134,458 159,819,776 170,854,722 187,941,565 203,746,053
Total 344,624,977 289,398,853 310,059,497 330,962,678 344,203,609 336,660,096 328,624,228 339,507,727 353,747,744 382,203,111 *Air Mail at SLC is included in both belly cargo freight poundage and excluded from forecast Total Air Cargo totals Source: SLCDA, 2018 TABLE 2-19 HISTORICAL AIR CARGO BY CARRIER
Calendar Year 2008 2009 2010 2011 2012 2013 2014 2015 2016 2017 Integrated Carriers
FedEx 186,846,219 164,621,549 176,198,518 182,587,926 182,793,312 170,870,817 165,032,042 171,737,401 186,826,728 192,239,391 UPS 66,340,875 63,716,259 63,671,501 81,101,715 94,029,660 101,287,129 104,334,465 105,648,851 107,749,530 117,415,471
Other Carriers 47,649,170 18,997,474 21,544,507 23,542,972 22,306,419 22,820,797 23,846,563 26,045,181 24,159,304 30,123,117 Combination Carriers
Delta Air Lines 27,983,228 29,576,421 38,276,631 33,386,676 34,098,357 30,608,258 25,017,569 24,911,023 23,489,368 31,159,354 Southwest Airlines 10,577,817 8,575,911 8,125,865 8,395,082 9,656,258 9,772,120 9,134,636 9,561,364 8,969,857 8,378,975
Other Carriers 5,227,668 3,911,239 2,242,475 1,948,307 1,319,603 1,300,975 1,258,953 1,603,907 2,552,957 2,886,803 Source: SLCDA, 2018

A V I A T I O N A C T I V I T Y F O R E C A S T
SLC Department of Airports – Airport Master Plan Update 2-94
FIGURE 2-52 COMPARISON OF TOTAL AIR CARGO SHARES BY CARRIER (2008 & 2017)
Source: SLCDA, 2018
FIGURE 2-53 HISTORICAL TOTAL AIR CARGO (2008-2017)
Source: SLCDA, 2018
54%
19%
8%
19%
2008
FedEx FreightUPS FreightDelta Air Lines Belly CargoOther Freight and Passenger Airlines
50%
31%
8%11%
2017
FedEx FreightUPS FreightDelta Air Lines Belly CargoOther Freight and Passenger Airlines
0
30,000,000
60,000,000
90,000,000
120,000,000
150,000,000
180,000,000
210,000,000
2008 2009 2010 2011 2012 2013 2014 2015 2016 2017
Tota
l Car
go (l
bs.)*
YearEnplaned Air Cargo Deplaned Air Cargo

A V I A T I O N A C T I V I T Y F O R E C A S T
SLC Department of Airports – Airport Master Plan Update 2-95
FIGURE 2-54 COMPARISON OF FREIGHT CARGO SHARES BY CARRIER (2008 & 2017)
Source: SLCDA, 2018 FIGURE 2-55 HISTORICAL FREIGHT (2008-2017)
Source: SLCDA, 2018
62%22%
16%
2008
FedExUPSOther Integrated Cargo Carriers
57%34%
9%
2017
FedExUPSOther Integrated Cargo Carriers
0
30,000,000
60,000,000
90,000,000
120,000,000
150,000,000
180,000,000
210,000,000
2008 2009 2010 2011 2012 2013 2014 2015 2016 2017
Frei
ght (
lbs.
)
YearEnplaned Freight Deplaned Freight

A V I A T I O N A C T I V I T Y F O R E C A S T
SLC Department of Airports – Airport Master Plan Update 2-96
FIGURE 2-56 COMPARISON OF BELLY CARGO SHARES BY CARRIER (2008 & 2017)
Source: SLCDA, 2018
FIGURE 2-57 HISTORICAL BELLY CARGO (2008-2017)
Source: SLCDA, 2018
64%24%
12%
2008
Delta Air LinesSouthwest AirlinesOther Belly Cargo Carriers
73%
20%
7%
2017
Delta Air LinesSouthwest AirlinesOther Belly Cargo Carriers
0
3,000,000
6,000,000
9,000,000
12,000,000
15,000,000
18,000,000
21,000,000
24,000,000
27,000,000
30,000,000
2008 2009 2010 2011 2012 2013 2014 2015 2016 2017
Belly
Car
go (l
bs.)
YearEnplaned Belly Cargo Deplaned Belly Cargo

A V I A T I O N A C T I V I T Y F O R E C A S T
SLC Department of Airports – Airport Master Plan Update 2-97
FIGURE 2-58 HISTORICAL AIR MAIL (2008-2017)
Source: SLCDA, 2018
2.6.1.4 Historical Air Cargo Peak Month The total historical air cargo was compared on a monthly basis from 2013-2017. During those years, the Airport showed consistent balance as no month ever dropped below 7% of the yearly total. The highest month of any year during that period was 10.57% in December, 2015. The analysis confirmed that December, is the peak air cargo month at SLC, likely due to fulfillment orders for the holidays. It is interesting to note that in 2017, June had 37,077,806 lbs of total cargo, or 9.70%, and December had 37,097,455 lbs or 9.71% making it the closest alternative month to December over the past five years. TABLE 2-20 and FIGURE 2-59 show the total monthly air cargo by month out of SLC from 2013-2017.
0
5,000,000
10,000,000
15,000,000
20,000,000
25,000,000
30,000,000
2008 2009 2010 2011 2012 2013 2014 2015 2016 2017
Air M
ail (
lbs.
)
YearEnplaned Air Mail Deplaned Air Mail
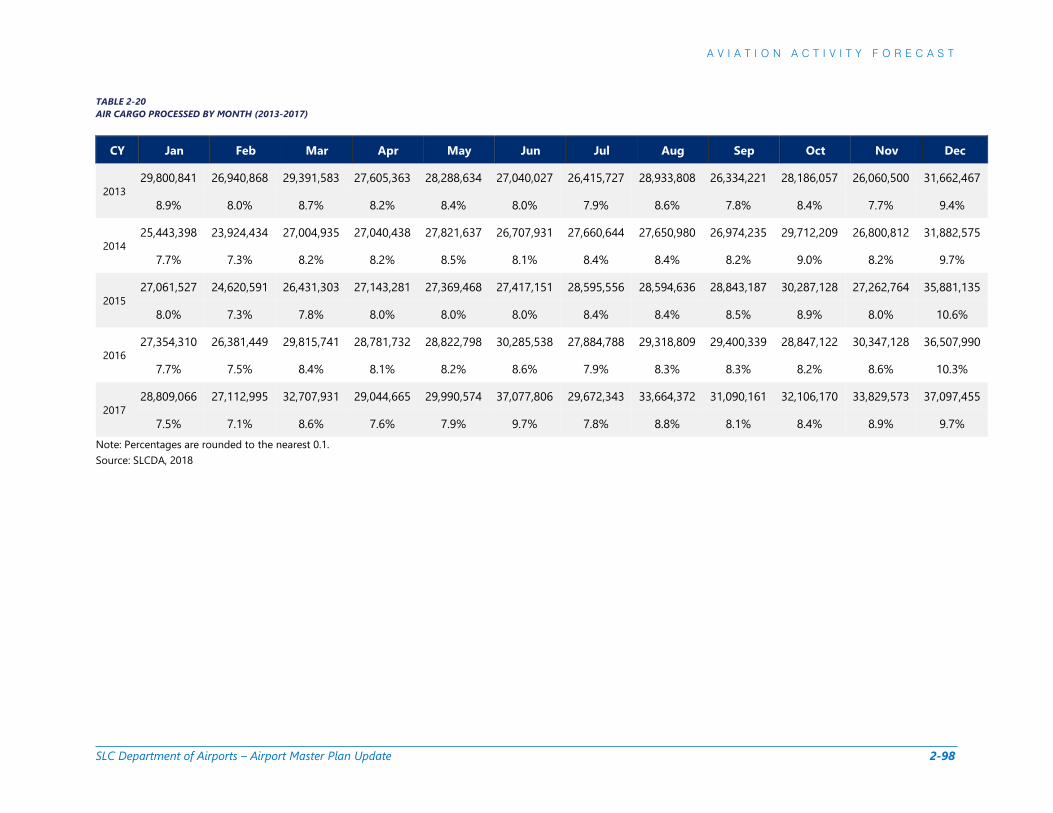
A V I A T I O N A C T I V I T Y F O R E C A S T
SLC Department of Airports – Airport Master Plan Update 2-98
TABLE 2-20 AIR CARGO PROCESSED BY MONTH (2013-2017)
CY Jan Feb Mar Apr May Jun Jul Aug Sep Oct Nov Dec
2013 29,800,841 26,940,868 29,391,583 27,605,363 28,288,634 27,040,027 26,415,727 28,933,808 26,334,221 28,186,057 26,060,500 31,662,467
8.9% 8.0% 8.7% 8.2% 8.4% 8.0% 7.9% 8.6% 7.8% 8.4% 7.7% 9.4%
2014 25,443,398 23,924,434 27,004,935 27,040,438 27,821,637 26,707,931 27,660,644 27,650,980 26,974,235 29,712,209 26,800,812 31,882,575
7.7% 7.3% 8.2% 8.2% 8.5% 8.1% 8.4% 8.4% 8.2% 9.0% 8.2% 9.7%
2015 27,061,527 24,620,591 26,431,303 27,143,281 27,369,468 27,417,151 28,595,556 28,594,636 28,843,187 30,287,128 27,262,764 35,881,135
8.0% 7.3% 7.8% 8.0% 8.0% 8.0% 8.4% 8.4% 8.5% 8.9% 8.0% 10.6%
2016 27,354,310 26,381,449 29,815,741 28,781,732 28,822,798 30,285,538 27,884,788 29,318,809 29,400,339 28,847,122 30,347,128 36,507,990
7.7% 7.5% 8.4% 8.1% 8.2% 8.6% 7.9% 8.3% 8.3% 8.2% 8.6% 10.3%
2017 28,809,066 27,112,995 32,707,931 29,044,665 29,990,574 37,077,806 29,672,343 33,664,372 31,090,161 32,106,170 33,829,573 37,097,455
7.5% 7.1% 8.6% 7.6% 7.9% 9.7% 7.8% 8.8% 8.1% 8.4% 8.9% 9.7% Note: Percentages are rounded to the nearest 0.1. Source: SLCDA, 2018

A V I A T I O N A C T I V I T Y F O R E C A S T
SLC Department of Airports – Airport Master Plan Update 2-99
FIGURE 2-59 PEAK MONTH TOTAL CARGO (2013-2017)
Source: SLCDA, 2018
2.6.2 Air Cargo Fleet Mix-Baseline 2017 The air cargo fleet mix baseline, identifies the most commonly used fleet of aircraft by the Airport’s integrated carriers in 2017. These aircraft include:
Airbus
» Airbus 300-600 ATR
» ATR-43 Cargo
» ATR-72 Cargo Beech
» Beech King Air 1900
» Beech 99 Airliner Boeing
» Boeing 737-400F
» Boeing 757-200F
» Boeing 767-300F
Cessna
» Cessna 208 Caravan
» Cessna 402 Embraer
» Embraer 120 Fairchild Swearingen
» Fairchild Swearingen 4 Metro McDonnell Douglas (Boeing)
» McDonnell Douglas DC-10
» McDonnell Douglas MD-11
20,000,000
22,000,000
24,000,000
26,000,000
28,000,000
30,000,000
32,000,000
34,000,000
36,000,000
38,000,000
40,000,000
Jan
Feb
Mar Ap
r
May Jun Jul
Aug
Sep
Oct
Nov De
c
Tota
l Enp
lane
d &
Dep
lane
d Ca
rgo
(lbs.
)
Month
2013 2014 2015 2016 2017Peak

A V I A T I O N A C T I V I T Y F O R E C A S T
SLC Department of Airports – Airport Master Plan Update 2-100
2.6.3 Local Cargo Forecasts The local belly cargo forecasts project the combined enplaned and deplaned belly cargo, whereas the local freight forecasts project the combined enplaned and deplaned freight.
2.6.3.1 Belly Cargo Forecast There are no FAA forecasts for growth in air cargo pounds. Instead, the forecast will use revenue ton miles (RTM) as a surrogate. The AAGR for domestic airlines belly cargo forecast RTM ranges from 1.0 percent to 1.2 percent over the course of the 20-year planning period42. Forecasts of belly cargo RTM carried on international routes is more robust and is anticipated to average about 3.4 percent over the same period43. Due to the larger cargo capacities of international airlines’ aircraft that use a greater percentage of wide body equipment, it is common that the average cargo capacity of international passenger aircraft is significantly greater than U.S. domestic aircraft. While percentages vary widely, studies have indicated that U.S. airport belly cargo represents from 10-15 percent of all cargo whereas the percentage at international airports is almost evenly split44.
Over the past ten years, belly cargo growth at SLC has been approximately 1.25 percent AAGR which is very similar to the FAA forecast for domestic RTMs. Over the past five years, as the percent of international enplanements has doubled at SLC, belly cargo growth has been 3.5 percent AAGR which is very similar to the long-term forecast of international belly cargo RTMs for the U.S.
In conversations with both passenger and air cargo carriers, including Delta, Federal Express, and UPS, these airlines have equated general growth for the next few years to be in line with the growth in U.S. GDP.
For the belly cargo forecasts, the rate of GDP growth is used for the Base Case Forecast (1.7 percent). This rate of growth is a hybrid between the previous five and ten year growth rates in belly cargo at SLC and is in line with the potential for increased belly cargo capacity from upgauging.
The Low Case belly cargo forecast assumes a rate of GDP growth associated with belly cargo to be 20 percent lower than the Base Case which rate is slightly larger than the growth FAA forecast for long-term domestic belly cargo RTMs (approximately 1.4 percent).
The High Case belly cargo forecast assumes a rate of 40 percenter higher GDP rate of growth than the Base Case. Two primary reasons are assumed for the High Case growth rate: (1) anticipation that new international flights on larger aircraft will provide more belly cargo capacity, as a result of carrying a growing number of passengers relative to all enplanements on larger aircraft, and (2) an outgrowth of the first, an anticipated initiation of international service from SLC to Asia, the fastest air cargo growth market in the world, that would provide more opportunity for belly air cargo growth.
42 FAA Aerospace Forecast: Fiscal Years 2018-2038, Federal Aviation Administration, Table 19 – U.S. Commercial Air Carriers Air Cargo Revenue Ton Miles, p. 84. 43 FAA Aerospace Forecast: Fiscal Years 2018-2038, Federal Aviation Administration, Table 19 – U.S. Commercial Air Carriers Air Cargo Revenue Ton Miles, p. 84. 44 Airport Cooperative Research Program, Air Cargo Facility Planning and Development Final Report, 2015.

A V I A T I O N A C T I V I T Y F O R E C A S T
SLC Department of Airports – Airport Master Plan Update 2-101
TABLE 2-21 shows the belly cargo forecasts from 2017-2037. TABLE 2-21 BELLY CARGO FORECAST-TOTAL POUNDS (2017-2037)
Year Low Case Scenario Forecast
Base Case Forecast
High Case Scenario Forecast
2017 42,425,132 42,425,132 42,425,132 2018 43,006,356 43,154,844 43,439,093 2019 43,595,543 43,897,108 44,477,287 2020 44,192,802 44,652,138 45,540,294 2021 44,798,244 45,420,155 46,628,707 2022 45,411,980 46,201,381 47,743,133 2023 46,034,124 46,996,045 48,884,194 2024 46,664,791 47,804,377 50,052,526 2025 47,304,099 48,626,612 51,248,782 2026 47,952,165 49,462,990 52,473,628 2027 48,609,110 50,313,753 53,727,747 2028 49,275,055 51,179,150 55,011,841 2029 49,950,123 52,059,431 56,326,623 2030 50,634,439 52,954,854 57,672,830 2031 51,328,131 53,865,677 59,051,210 2032 52,031,327 54,792,167 60,462,534 2033 52,744,156 55,734,592 61,907,589 2034 53,466,751 56,693,227 63,387,180 2035 54,199,245 57,668,350 64,902,134 2036 54,941,775 58,660,246 66,453,295 2037 55,694,477 59,669,202 68,041,529
Average Annual Growth Rate (AAGR) 2018-2037 1.37% 1.72% 2.39%
Source: RS&H, 2018
2.6.3.2 Freight Forecast The annual local freight forecasts were based on historical and anticipated changes for FedEx and UPS individually as well as the remainder of the integrated cargo carriers combined into the “Others” group. Rates of growth were mainly determined from interviews with the individual carriers for the short term. FedEx and UPS indicated that they expected to grow in line with U.S. GDP AAGRs over the short-term and into the future. In addition, the forecasts also include consideration for a potential expansion in the SLC market based upon serving Amazon whether through expansion of service with integrated carriers or initiation of individual service that primarily serves Amazon. The Base Case air cargo forecast assumes continuation of growth for the next five years based upon rates over the past five years plus the potential growth that might be associated with Amazon. While, there are no specific indicators regarding the potential for Amazon growth, it is accounted through assumptions of

A V I A T I O N A C T I V I T Y F O R E C A S T
SLC Department of Airports – Airport Master Plan Update 2-102
experiencing growth rates greater than GDP. The Low Case scenario assumes growth that is based upon a decrease in the U.S. GDP by ten percent. The High Case Scenario Forecast builds on the Base Case Forecast by assuming a growth rate 20 percent over the Base Case. This assumes the potential for greatly expanded service that would be due to, in part a sustained economy, but also the possibility of a new airline operated for or by Amazon. TABLE 2-22 shows the total freight forecasts from 2017-2037. TABLE 2-22 FREIGHT FORECAST-TOTAL POUNDS (2017-2037)
Year Low Case Scenario Forecast
Base Case Forecast
High Case Scenario Forecast
2017 339,777,979 339,777,979 339,777,979 2018 345,005,312 347,593,221 350,008,670 2019 350,313,065 355,610,674 360,558,000 2020 355,702,475 363,836,141 371,436,252 2021 361,174,799 372,275,605 382,654,054 2022 366,731,312 380,935,231 394,222,390 2023 372,373,310 389,821,380 406,152,609 2024 378,102,107 398,940,605 418,456,447 2025 383,919,040 408,299,667 431,146,028 2026 389,825,463 417,905,536 444,233,888 2027 395,822,754 427,765,398 457,732,983 2028 401,912,310 437,886,666 471,656,708 2029 408,095,552 448,276,982 486,018,908 2030 414,373,920 458,944,230 500,833,897 2031 420,748,878 469,896,537 516,116,472 2032 427,221,912 481,142,290 531,881,932 2033 433,794,531 492,690,135 548,146,096 2034 440,468,266 504,548,992 564,925,317 2035 447,244,674 516,728,062 582,236,506 2036 454,125,334 529,236,836 600,097,148 2037 461,111,850 542,085,104 618,525,325
Average Annual Growth Rate (AAGR) 2018-2037 1.54% 2.36% 3.04%
Source: RS&H, 2018
2.6.4 Total Air Cargo Forecast The total air cargo forecasts take a bottom up approach, in which the total enplaned and deplaned air cargo in pounds (lb.) is projected based on the growth of both enplaned and deplaned belly cargo and enplaned and deplaned freight. FIGURE 2-60 provides a breakdown of belly cargo versus freight cargo forecasts for the Base Case Forecast. FIGURE 2-61 compares the projected total air cargo poundage of the three forecast scenarios through 2037.

A V I A T I O N A C T I V I T Y F O R E C A S T
SLC Department of Airports – Airport Master Plan Update 2-103
FIGURE 2-60 BASE CASE FORECAST OF AIR CARGO BY TYPE (2013-2037)
Source: RS&H, 2018
0
100,000,000
200,000,000
300,000,000
400,000,000
500,000,000
600,000,000
700,000,000
2013
2014
2015
2016
2017
2018
2019
2020
2021
2022
2023
2024
2025
2026
2027
2028
2029
2030
2031
2032
2033
2034
2035
2036
2037
Air C
argo
(lbs
.)
YearHistorical Belly Cargo Belly Cargo ForecastHistorical Freight Freight ForecastHistorical Total Cargo Total Cargo Forecast
Historical Forecast

A V I A T I O N A C T I V I T Y F O R E C A S T
SLC Department of Airports – Airport Master Plan Update 2-104
FIGURE 2-61 TOTAL AIR CARGO (LBS.) FORECAST COMPARISON (2013-2037)
Source: RS&H, 2018
300,000,000
350,000,000
400,000,000
450,000,000
500,000,000
550,000,000
600,000,000
650,000,000
700,000,000
750,000,000
2013
2014
2015
2016
2017
2018
2019
2020
2021
2022
2023
2024
2025
2026
2027
2028
2029
2030
2031
2032
2033
2034
2035
2036
2037
Tota
l Car
go (l
bs.)
Year
Historical Low Case Scenario Forecast Base Case Forecast High Case Scenario Forecast
Historical Forecast

A V I A T I O N A C T I V I T Y F O R E C A S T
SLC Department of Airports – Airport Master Plan Update 2-105
2.6.5 Air Cargo Operations Forecast (Integrated Carriers) To accurately reflect operations by aircraft type, interviews were conducted with the largest passenger and integrated cargo carriers. Trends and market factors that may affect cargo operations out of SLC are:
» Surveyed responses from major cargo providers including FedEx, UPS, Delta Air Lines, Southwest Airlines, and American Airlines
o Examination of changes in fleet mix (e.g. anticipated retirements of passenger aircraft, usage of small vs. large aircraft)
o Belly cargo versus dedicated freighter cargo demand and anticipated changes in air cargo fleets by integrated carriers
» Economic political and demographic trends that will have potential impacts on the Airport’s market share growth in the short, medium, and long-term
A detailed analysis was performed of cargo load factors by air cargo aircraft type by integrated carrier for September and December 2017 to calibrate load factors to be used in forecasting future operations forecasts for integrated carriers. Increased potential for belly cargo uplift is assumed by the air passenger forecasts. Each integrated carrier indicated that it would be upgauging aircraft in the future, with plans for additional parking positions for both their air carrier fleet and feeder fleets and could be constrained if more space is not available. In general, there would be a move away from older aircraft such as the B-757, MD-11, and DC-10s to more frequencies by B767-300. In terms of feeder aircraft, wherever possible the use of existing aircraft in the fleet would grow over time with upgauging where possible to handle additional load. A separate sub-forecast of integrated carriers was developed for feeder aircraft and which derived operational forecasts for those aircraft. This is included within the identified forecasts. For example, instead of adding an additional ATR-43 to a route, the aircraft would be upgauged to an ATR-72 when the air cargo load factor increased to the 2017 level. Existing air cargo airline load factors were maintained over the forecast period based upon 2017 load factors.
In terms of the future fleet beyond upgauging to B-767s or increasing B-767 frequencies, the long-term forecasts consider larger aircraft that are not currently being anticipated to handle increasing volumes of air cargo. For that reason, aircraft such as the B-777 and A330 could be introduced to increase capacity per flight as opposed to increasing frequencies. There are no other apparent new generation aircraft that would increase capacity for feeder aircraft to a point that could offset the need for an increased frequencies of operations45. Should this happen, the number of feeder aircraft frequencies would be less than forecast.
TABLE 2-23, TABLE 2-24, and TABLE 2-25 provide air cargo operations forecast for the Base, Low, and High Cases.
45 All-cargo versions of CRJ-200 exist but have approximately the same air cargo capacity as the ATR-72.

A V I A T I O N A C T I V I T Y F O R E C A S T
SLC Department of Airports – Airport Master Plan Update 2-106
TABLE 2-23 AIR CARGO OPERATIONS BY AIRCRAFT-BASE CASE FORECAST (2017-2037)
Base Case Forecast - Air Cargo Operations by Aircraft Aircraft 2017 2018 2022 2027 2032 2037 Airbus 300-600 2,177 2,392 2,496 3,068 2,148 1,344 Airbus 330-300 0 0 0 0 440 1,360 Boeing 777F 0 0 254 384 522 1,018 Boeing 767-300F 489 538 1,720 3,532 6,374 7,836 Boeing 757-200SF 1,370 2,300 2,206 742 0 0 Boeing 737-400F 986 1,002 1,096 1,168 1,272 1,384 McDonnell Douglas MD-11 1,846 1,944 1,358 1,122 328 0 McDonnell Douglas DC-10 331 436 312 116 0 0 ATR-72 Cargo 28 276 356 652 1,182 1,460 ATR-43 Cargo 377 450 540 548 906 996 Embraer 120 620 452 338 220 214 0 Fairchild Swearingen 4 Metro 1,391 1,420 1,574 750 300 0 Beech 99 Airliner 3,392 3,458 3,796 4,310 4,894 5,556 Beech King Air 1900 3,168 3,236 3,544 4,024 4,570 5,188 Cessna 402 495 608 716 758 1,328 1,620 Cessna 208 Caravan 2,736 2,776 2,816 2,886 2,956 3,380 Total 19,406 21,288 23,122 24,280 27,434 31,142
Source: RS&H, 2018
TABLE 2-24 AIR CARGO OPERATIONS BY AIRCRAFT-LOW CASE SCENARIO FORECAST (2017-2037)
Low Case Scenario Forecast - Air Cargo Operations by Aircraft Aircraft 2017 2018 2022 2027 2032 2037 Airbus 300-600 2,177 2,440 2,496 3,068 1,700 1,218 Airbus 330-300 0 0 0 0 104 408 Boeing 777F 0 0 268 422 528 942 Boeing 767-300F 489 1,228 2,094 3,612 6,424 7,170 Boeing 757-200SF 1,370 1,574 1,690 474 0 0 Boeing 737-400F 986 1,000 1,062 1,166 1,240 1,360 McDonnell Douglas MD-11 1,846 1,768 1,042 606 0 0 McDonnell Douglas DC-10 331 322 312 104 0 0 ATR-72 Cargo 28 320 338 448 1,034 1,154 ATR-43 Cargo 377 486 518 564 616 670 Embraer 120 620 504 350 202 104 0 Fairchild Swearingen 4 Metro 1,391 1,408 1,494 504 0 0 Beech 99 Airliner 3,392 3,432 3,794 3,808 4,308 4,694 Beech King Air 1900 3,168 3,222 3,498 3,510 4,026 4,384 Cessna 402 495 710 1,014 1,114 1,264 1,356 Cessna 208 Caravan 2,736 2,750 2,852 3,098 3,444 3,942 Total 19,406 21,164 22,822 22,700 24,792 27,298

A V I A T I O N A C T I V I T Y F O R E C A S T
SLC Department of Airports – Airport Master Plan Update 2-107
Source: RS&H, 2018 TABLE 2-25 AIR CARGO OPERATIONS BY AIRCRAFT-HIGH CASE SCENARIO FORECAST (2017-2037)
High Case Scenario Forecast - Air Cargo Operations by Aircraft Aircraft 2017 2018 2022 2027 2032 2037 Airbus 300-600 2,177 2,236 3,512 3,150 2,498 0 Airbus 330-300 0 0 0 208 416 1,288 Boeing 777F 0 0 358 388 416 832 Boeing 767-300F 489 1,332 3,802 6,028 7,870 10,012 Boeing 757-200SF 1,370 1,186 240 0 0 0 Boeing 737-400F 986 1,026 1,104 1,128 1,270 1,476 McDonnell Douglas MD-11 1,846 1,660 194 0 0 0 McDonnell Douglas DC-10 331 312 312 0 0 0 ATR-72 Cargo 28 150 576 954 1,328 1,570 ATR-43 Cargo 377 390 566 670 792 938 Embraer 120 620 532 466 0 0 0 Fairchild Swearingen 4 Metro 1,391 1,174 898 598 0 0 Beech 99 Airliner 3,392 3,508 3,958 4,680 5,538 6,552 Beech King Air 1900 3,168 3,276 3,694 4,372 5,176 6,114 Cessna 402 495 512 746 1,746 2,144 2,688 Cessna 208 Caravan 2,736 2,830 3,218 3,658 4,226 4,788 Total 19,406 20,124 23,644 27,580 31,674 36,258
Source: RS&H, 2018

A V I A T I O N A C T I V I T Y F O R E C A S T
SLC Department of Airports – Airport Master Plan Update 2-108
2.7 GENERAL AVIATION AND MILITARY
2.7.1 General Aviation Forecast
2.7.1.1 Based Aircraft The Salt Lake City Department of Airports General Aviation Strategy Plan (SLCDA GASP) was prepared to examine the Salt Lake City Department of Airports General Aviation (SLCDA GA) System of Airports. The report determined a total of 290 based aircraft at SLC, including 178 single-engine, 42 multi-engine, 51 jets, and 19 helicopters. This reflects a decrease in total based aircraft by 109 since 2008, mainly in single engine aircraft (-92), jet (-18), and multi-engine (-7). Helicopter is the only category of aircraft that has increased during that time (+8). During this time nationally, jet, turboprop, and helicopters are increasing as a part of the fleet whereas single/multi-engine piston are decreasing. The forecast prepared in the General Aviation Strategy Plan report for based aircraft at SLC was built off of the actual 2017 totals, and used the AAGRs derived from the FAA Aerospace Forecast for FY 2018-2038 as its means for change. Using the trends of the FAA Aerospace Forecast, the single-engine aircraft category is the only type of based aircraft anticipated to decrease with a -1.0% AAGR, while jets are projected to increase the fastest with a 2.2% AAGR from 2018-2037. TABLE 2-26 shows the historical based aircraft fleet at SLC by type from 2008-2017, as well as the forecast for the Base Case projections over the planning horizon. TABLE 2-26 GENERAL AVIATION BASED AIRCRAFT HISTORICAL AND FORECAST (2008-2037)
Salt Lake City International Airport
Year Single- Engine
Multi- Engine Jet Helicopter Total
2008 270 49 69 11 399 2009 250 46 55 15 366 2010 250 46 55 15 366 2011 204 36 46 15 301 2012 204 36 46 15 301 2013 186 41 70 31 328 2014 186 41 70 31 328 2015 186 41 70 31 328 2016 203 46 62 31 342 2017 178 42 51 19 290 2022 171 47 56 20 294 2027 163 48 62 22 295 2032 155 50 69 24 298 2037 147 52 77 27 303
Average Annual Growth Rate (AAGR) 2008-2017 -4.3% -0.9% -3.7% 5.3% -3.2% 2018-2037 -1.0% 0.8% 2.2% 1.8% 0.2%

A V I A T I O N A C T I V I T Y F O R E C A S T
SLC Department of Airports – Airport Master Plan Update 2-109
Source: Salt City Department of Airports, General Aviation Strategic Vision and Immediate Action Plan, 2019
2.7.1.2 General Aviation Operations The SLCDA GA Forecast for GA operations over the planning horizon used a methodology of combining operations per based aircraft (OPBA) and the FAA Aerospace Forecast for FY 2018-2038: Active General Aviation and Air Taxi Hours Flown AAGRs. Each of the GA designated aircraft categories and their operations were classified by based aircraft type using the categories supplied by the FAA Aerospace Forecast which included: single-engine piston, multi-engine piston, single-engine turboprop, multi-engine turboprop, jet, and helicopter. Data from the FAA’s National Offload Program was then gathered to identify the operations of the fleet mix for SLC in FY 2017. FAA Aerospace Forecast AAGRs were used to project the aircraft category’s growth through 2037. TABLE 2-28 shows the forecast of operations by GA aircraft type, in which some of the Airport’s specific aircraft types were identified. Local GA operations increased at the rate of single engine piston aircraft hours flown, while still maintaining the same number of OPBA for single engine pistons in 2017. This results in the local GA operations decreasing from 2,104 in 2017 to 1,686 in 2037 with a -1.1% AAGR. However, the itinerant GA operations are projected to increase from 38,372 annual operations in 2017 to 51,121 operations in 2037 with a 1.5% AAGR largely attributed to an increase in jet operations at the Airport. TABLE 2-27 shows the itinerant and local GA operations forecast for 2018-2037.
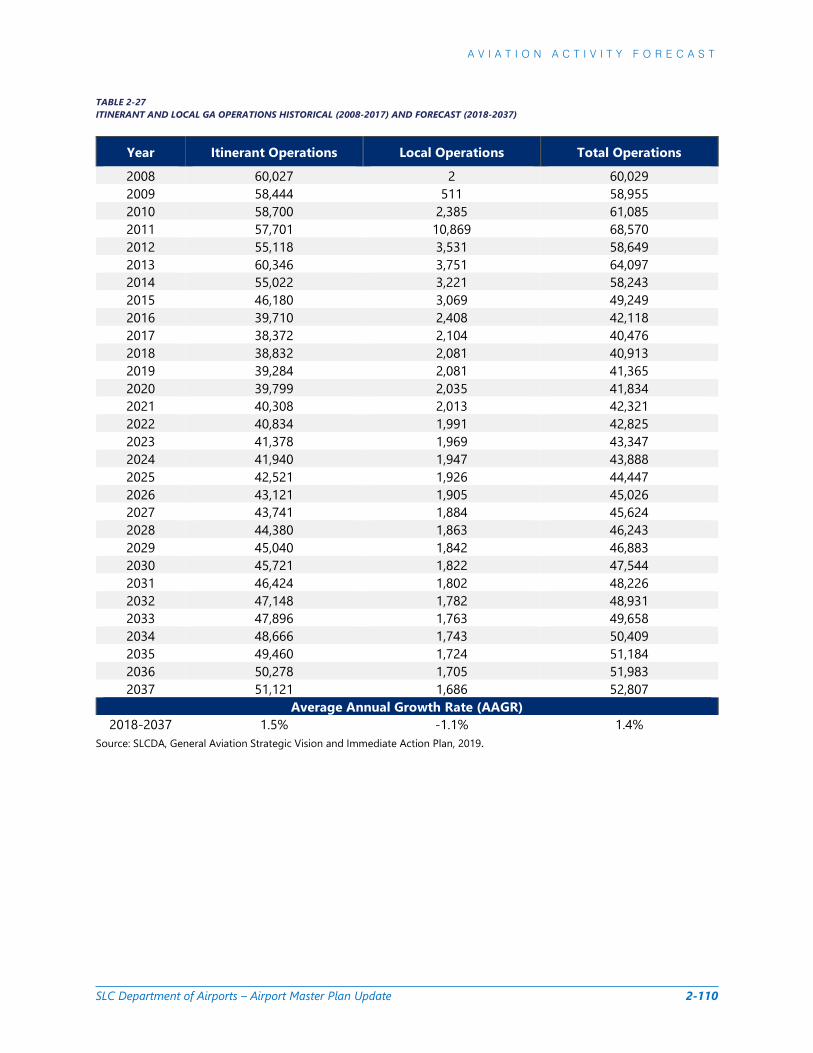
A V I A T I O N A C T I V I T Y F O R E C A S T
SLC Department of Airports – Airport Master Plan Update 2-110
TABLE 2-27 ITINERANT AND LOCAL GA OPERATIONS HISTORICAL (2008-2017) AND FORECAST (2018-2037)
Year Itinerant Operations Local Operations Total Operations
2008 60,027 2 60,029 2009 58,444 511 58,955 2010 58,700 2,385 61,085 2011 57,701 10,869 68,570 2012 55,118 3,531 58,649 2013 60,346 3,751 64,097 2014 55,022 3,221 58,243 2015 46,180 3,069 49,249 2016 39,710 2,408 42,118 2017 38,372 2,104 40,476 2018 38,832 2,081 40,913 2019 39,284 2,081 41,365 2020 39,799 2,035 41,834 2021 40,308 2,013 42,321 2022 40,834 1,991 42,825 2023 41,378 1,969 43,347 2024 41,940 1,947 43,888 2025 42,521 1,926 44,447 2026 43,121 1,905 45,026 2027 43,741 1,884 45,624 2028 44,380 1,863 46,243 2029 45,040 1,842 46,883 2030 45,721 1,822 47,544 2031 46,424 1,802 48,226 2032 47,148 1,782 48,931 2033 47,896 1,763 49,658 2034 48,666 1,743 50,409 2035 49,460 1,724 51,184 2036 50,278 1,705 51,983 2037 51,121 1,686 52,807
Average Annual Growth Rate (AAGR) 2018-2037 1.5% -1.1% 1.4%
Source: SLCDA, General Aviation Strategic Vision and Immediate Action Plan, 2019.

A V I A T I O N A C T I V I T Y F O R E C A S T
SLC Department of Airports – Airport Master Plan Update 2-111
TABLE 2-28 GA OPERATIONS BY AIRCRAFT TYPE FORECAST SUMMARY (2017-2037)
Aircraft 2017 2018 2022 2027 2032 2037 Pistons 11,166 12,747 10,657 10,173 9,714 9,279
Cessna 172 4,816 5,498 4,557 4,312 4,080 3,860 Cirrus SR22 989 1,129 936 885 838 793 Cessna 182 751 857 711 672 636 602 Cessna 206 343 392 325 307 291 275 Cessna 185 334 381 316 299 283 268 Piper 28A 330 377 312 295 280 265 Diamond DA-40 287 328 272 257 243 230 Cessna 340 333 380 328 323 318 314 Piper-44 287 328 283 278 274 270 Other Pistons 2,696 3,078 2,618 2,543 2,472 2,403
Turboprops 9,341 10,663 9,426 9,549 9,714 9,923
Pilatus PC-12 5,225 5,965 4,871 4,679 4,495 4,318 Piper 46T 273 312 320 307 295 283 Beechcraft Super King Air 2,996 3,420 3,266 3,571 3,904 4,268 Other Turboprops 847 967 969 992 1,020 1,053
Jet 17,324 19,778 19,794 22,614 25,836 29,518
Cessna Citation 6,990 7,980 7,464 8,528 9,743 11,131 Gulfstream IV 1,734 1,979 1,852 2,115 2,417 2,761 Hawker 800 966 1,103 1,032 1,179 1,346 1,538 Hawker 400 334 381 413 472 539 616 Challenger 300 1,354 1,547 1,676 1,915 2,188 2,500 Challenger 350 345 394 427 488 557 637 Challenger 650 760 868 940 1,074 1,227 1,402 Falcon 900 359 410 444 507 580 662 Falcon 2000 455 519 563 643 735 839 LearJet 35 475 542 588 671 767 876 LearJet 45 253 289 313 358 409 467 LearJet 60 416 475 515 588 672 768 Other Jets 2,883 3,291 3,567 4,075 4,656 5,319
Helicopter 2,645 2,949 2,949 3,288 3,666 4,087
Agusta A109SP 994 1,108 1,108 1,236 1,378 1,536 Bell 206 577 643 643 717 800 892 Robinson R22 440 491 491 547 610 680 Robinson R44 302 337 337 375 419 467 Other Helicopters 332 370 370 413 460 513
Total 40,476 46,137 42,826 45,624 48,930 52,807
Source: SLCDA, General Aviation Strategic Vision and Immediate Action Plan, 2019

A V I A T I O N A C T I V I T Y F O R E C A S T
SLC Department of Airports – Airport Master Plan Update 2-112
2.7.2 Military Forecast
2.7.2.1 Military Operations The itinerant and local military aircraft that operate out of SLC represented only 2.2% of all 325,093 operations as identified within TAF 2017. This Forecast does not make any changes to the number of local or itinerant military operations. Instead, as is a customary practice, it holds the existing count of 7,348 operations for local and itinerant military operations constant from 2017-2037. TABLE 2-29 shows the military operations and represents military operations forecasts for the Base, Low, and High Cases. TABLE 2-29 MILITARY OPERATIONS FORECAST (2017-2037)
Operations by Military Aircraft Aircraft 2017 2022 2027 2032 2037 A-7D Corsair 2 4 4 4 4 4 F-18S Super Hornet 2 2 2 2 2 T-38 Talon 4 4 4 4 4 C-23 Sherpa 2 2 2 2 2 F-18 Hornet 100 100 100 100 100 C-17 Globemaster III 10 10 10 10 10 C-130 Hercules 10 10 10 10 10 C-12 Huron 200 200 200 200 200 C-20 Gulfstream 200 200 200 200 200 Pilatus PC-12 200 200 200 200 200 KC-135 Stratotanker 6,580 6,580 6,580 6,580 6,580 V-22 Osprey 32 32 32 32 32 AH-64 Apache 4 4 4 4 4 Total 7,348 7,348 7,348 7,348 7,348
Source: FAA, TAF 2018; SLC ATC, 2018 and TAC Air, 2018

A V I A T I O N A C T I V I T Y F O R E C A S T
SLC Department of Airports – Airport Master Plan Update 2-113
2.8 SUMMARY OF AIRCRAFT OPERATIONS The forecast of total operations for the Airport are a summation of the passenger, air cargo, GA, and military operation forecasts presented in previous sections. Also mentioned above, the forecast of eVTOL operations is not included at this time. TABLE 2-30 and FIGURE 2-62 show the projected totals from 2017-2037 for each scenario. TABLE 2-30 COMPARISON OF TOTAL ANNUAL OPERATIONS FORECASTS (2017-2037)
FY TAF 2017 Base Case Forecast
Low Case Scenario Forecast
High Case Scenario Forecast
2017 325,093 325,093 325,093 325,093 2018 329,087 332,261 332,137 331,097 2019 334,320 338,039 335,651 337,296 2020 338,635 343,917 339,203 343,612 2021 341,941 349,897 342,792 350,045 2022 345,110 355,372 346,194 355,894 2023 349,378 361,627 349,734 366,393 2024 354,722 367,992 353,310 377,201 2025 360,257 374,469 356,923 388,329 2026 366,020 381,060 360,573 399,784 2027 371,900 386,647 363,894 408,388 2028 378,003 390,944 367,159 414,922 2029 384,244 395,289 370,454 421,561 2030 390,514 399,682 373,778 428,306 2031 396,873 404,124 377,132 435,159 2032 403,191 408,133 380,220 441,059 2033 409,446 413,473 383,136 448,761 2034 415,899 418,882 386,074 456,598 2035 422,591 424,363 389,035 464,572 2036 429,371 429,915 392,018 472,685 2037 436,164 434,832 394,799 479,571
Source: RS&H, 2018; SLCDA General Aviation Strategy Plan, 2018; Mary A. Lynch, 2018

A V I A T I O N A C T I V I T Y F O R E C A S T
SLC Department of Airports – Airport Master Plan Update 2-114
FIGURE 2-62 TOTAL OPERATIONS FORECASTS (2018-2037)
Source: RS&H, 2018
300,000.0
320,000.0
340,000.0
360,000.0
380,000.0
400,000.0
420,000.0
440,000.0
460,000.0
480,000.0
500,000.0
2008
2009
2010
2011
2012
2013
2014
2015
2016
2017
2018
2019
2020
2021
2022
2023
2024
2025
2026
2027
2028
2029
2030
2031
2032
2033
2034
2035
2036
2037
Ope
ratio
ns
Fiscal Year
TAF 2017 Low Case Scenario Forecast Base Case Forecast High Case Scenario Forecast Historical

A V I A T I O N A C T I V I T Y F O R E C A S T
SLC Department of Airports – Airport Master Plan Update 2-115
2.8.1.1 Base Case Forecast Summary of Total Operations by Category Table 2-31 provides projections of the number of Air Carrier/Air Taxi, Cargo, GA, and Military operations for each forecast year. Each category of operation forecast was developed in the sections above. TABLE 2-31 BASE CASE FORECAST SUMMARY OF TOTAL OPERATIONS BY CATEGORY (2018-2037)
Year Air Carrier/ Air Taxi1 Cargo GA2 Military Total
2018 257,488 21,288 46,137 7,348 332,261 2022 282,076 23,122 42,827 7,348 355,372 2027 309,395 24,280 45,624 7,348 386,647 2032 324,421 27,434 48,930 7,348 408,133 2037 343,545 31,142 52,807 7,348 434,842
1 Air carrier/Air taxi operations include on-demand and miscellaneous commercial operations in addition to air carrier passenger operations. See table 2-15 for the total number of passenger operations in the ADPM. 2 GA includes helicopter operations. Source: RS&H, 2018
2.8.1.2 Base Case Forecast Summary of ADPM Operations by Category Table 2-32 provides projections of the number of Air Carrier/Air Taxi, Cargo, GA, and Military operations for an average day of the peak month (ADPM) for each forecast year. The total SLC fleet mix and operations were obtained from the 2017 FAA National Offload Program and annualized to reflect the FAA TAF 2018, published in January, 2017. Afterwards, the 2018 ADPM totals were developed using the SLC aviation activity forecast, while maintaining the 2017 ADPM proportion. The Cargo and GA operations maintained their proportionate share of 2017, and align with total operations for each forecast year. Military operations remained constant over the planning horizon. However, the passenger46 operations were obtained using the design day forecast flight schedule for commercial passenger air carriers. They were then adjusted to include the on-demand and miscellaneous commercial operations identified in 2017. TABLE 2-32 BASE CASE FORECAST SUMMARY OF ADPM OPERATIONS BY CATEGORY (2018-2037)
FY Air Carrier/ Air Taxi1 Cargo GA2 Military Total
2018 822 68 147 23 1,060 2022 907 71 146 23 1,147 2027 988 77 145 23 1,233 2032 1,042 88 157 23 1,310 2037 1,097 99 168 23 1,387
1 Air carrier/Air taxi operations include on-demand and miscellaneous commercial operations in addition to air carrier passenger operations. See table 2-15 for the total number of passenger operations in the ADPM. 2 GA includes helicopter operations. Source: RS&H, 2018
46 Passenger operations were identified as “Air Carrier/Air Taxi” in this analysis.

A V I A T I O N A C T I V I T Y F O R E C A S T
SLC Department of Airports – Airport Master Plan Update 2-116
2.8.2 IFR and VFR Operations The SLC Terminal Radar Approach Control (TRACON) provided a distribution of the existing IFR and VFR itinerant operations for SLC. For Base Year 2017, the Airport had 78.5%, of its operations identified as instrument flight rules (IFR) itinerant, and 21.5% of operations identified as visual flight rules (VFR) itinerant. Holding the 2017 distribution constant, the IFR and VFR operations projected for each of the forecast years are compared in TABLE 2-33. TABLE 2-33 IFR AND VFR FORECASTS (2018-2037)
Base Case Forecast
Low Case Scenario Forecast
High Case Scenario Forecast
FY IFR VFR IFR VFR IFR VFR 2018 260,966 71,295 260,869 71,268 260,052 71,045 2022 279,118 76,254 271,909 74,285 279,528 76,366 2027 303,682 82,965 285,811 78,083 320,758 87,630 2032 320,558 87,575 298,634 81,586 346,419 94,640 2037 341,528 93,304 310,085 84,714 376,667 102,904
Source: RS&H, 2018; FAA Opsnet, 2018; SLC TRACON, 2018
2.8.2.1 Annual Instrument Approaches Annual instrument approaches represent the number of approaches that use IFR procedures annually. The number of annual instrument approaches can be identified as 50% of the IFR operations projected for the Airport in each forecast. TABLE 2-34 shows the forecasts for annual instrument approaches for the forecast years of 2022, 2027, 2032, and 2037. TABLE 2-34 ANNUAL INSTRUMENT APPROACHES FORECASTS (2018-2037)
FY Base Case Forecast
Low Case Scenario Forecast
High Case Scenario Forecast
2018 130,483 130,434 130,026 2022 139,559 135,955 139,764 2027 151,841 142,906 160,379 2032 160,279 149,317 173,209 2037 170,764 155,042 188,333
Source: RS&H, 2018; FAA Opsnet, 2018; SLC TRACON, 2018

A V I A T I O N A C T I V I T Y F O R E C A S T
SLC Department of Airports – Airport Master Plan Update 2-117
2.9 CRITICAL AIRCRAFT The existing critical aircraft are determined by the usage of each of the Airport’s four runways. It is defined as the most demanding aircraft with 500 or more operations annually. A representative group type can be used in some cases if no single aircraft model has sufficient operations to achieve the threshold. The dimensions of existing critical aircraft are depicted in FIGURE 2-63.
2.9.1.1 Runway 14-32 Critical Aircraft
» Existing: Beechcraft 1900Do Aircraft Approach Group - Bo Aircraft Design Group - IIo Taxiway Design Group - 2
2.9.1.2 Runway 16L-34R Critical Aircraft
» Existing: Airbus A330/Boeing 737-9o Aircraft Approach Group - Do Aircraft Design Group - Vo Taxiway Design Group - 5
2.9.1.3 Runway 16R-34L Critical Aircraft
» Existing: Airbus A330/Boeing 737-9o Aircraft Approach Group - Do Aircraft Design Group - Vo Taxiway Design Group - 5
2.9.1.4 Runway 17-35 Critical Aircraft
» Existing: Boeing 757/767o Aircraft Approach Group - Do Aircraft Design Group - IVo Taxiway Design Group - 5
» Future: Beechcraft 1900Do Aircraft Approach Group - Bo Aircraft Design Group - IIo Taxiway Design Group – 2
» Future: Airbus A350/Boeing 777-3o Aircraft Approach Group - Do Aircraft Design Group - Vo Taxiway Design Group - 6
» Future: Airbus A350/Boeing 777-3o Aircraft Approach Group - Do Aircraft Design Group - Vo Taxiway Design Group - 6
» Future: Boeing 767o Aircraft Approach Group - Do Aircraft Design Group - IVo Taxiway Design Group - 5
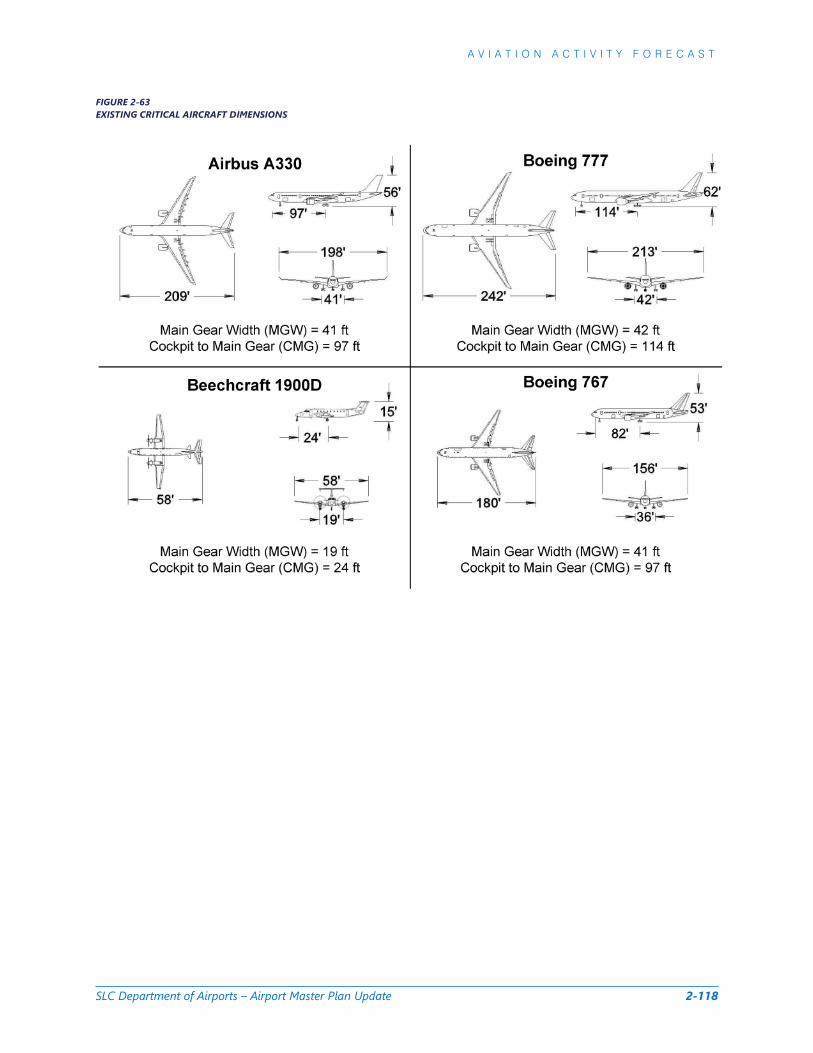
A V I A T I O N A C T I V I T Y F O R E C A S T
SLC Department of Airports – Airport Master Plan Update 2-118
FIGURE 2-63 EXISTING CRITICAL AIRCRAFT DIMENSIONS

A V I A T I O N A C T I V I T Y F O R E C A S T
SLC Department of Airports – Airport Master Plan Update 2-119
2.10 AVIATION ACTIVITY FORECASTS SUMMARY
2.10.1 Comparison with FAA TAF This section compares the FAA TAF 2017 published January 2018 with the Base Case Forecast. In accordance with FAA Order 5050.4B, National Environmental Policy Act (NEPA) Implementing Instructions for Airport Actions, paragraph 706.b(3), the FAA uses the following parameters to assess aviation forecasts, including those prepared for airport master plans. To be consistent with the FAA TAF:
» The 5-year forecast should be within 10 percent of the TAF; and,
» The 10-year forecast should be within 15 percent of the TAF.47
Each of the forecasts used fiscal years for enplanements and operations to be directly comparable with the FAA TAF.
The Base Case Forecast of enplanements was generated through an extensive analysis of regional socioeconomic statistics, trends, and sources as well as in-depth interviews with key stakeholders within the Salt Lake City regional area. Based on these inputs, a best-fit model was produced using a multiple variable regression analysis and then evaluated using Monte Carlo simulation. In addition to the Base Case Forecast, alternative Low and High Case Scenario Forecasts were also produced in a similar manner for comparison.
Operation forecasts and derivatives were created using planning design day models for an ADPM passenger schedule from July, 2018. The projected passenger and air cargo operation projections align with the enplanement projections of the forecast scenarios. Existing and anticipated load factors, equipment, and markets were all considered, as well as industry-wide trends, and interviews with representatives of several of the larger passenger airlines as well as integrated carriers at SLC. The Base Case Forecast also adopts the Base Case SLCDA General Aviation Strategy Plan GA based aircraft and operations forecasts. Like the enplanement forecasts, alternative based aircraft and operations forecasts were identified and detailed in these forecasts. The existing military operations from TAF 2017 are projected to remain constant over the 20-year planning horizon.
A comparison of the FAA TAF 2017 is shown in TABLE 2-35 and was also presented in TABLE 2-1 at the beginning of this document. In all cases the preferred Base Case Forecast meets the 5 year and 10 year percent parameters established by the FAA for assessing forecast differences.
47 December 23, 2004, memorandum from the FAA Director, Airport Planning and Programming, entitled Revision to Guidance on Review and Approval of Aviation Forecasts.

A V I A T I O N A C T I V I T Y F O R E C A S T
SLC Department of Airports – Airport Master Plan Update 2-120
TABLE 2-35 BASE CASE FORECAST COMPARISON WITH FAA TAF 2017
2017 2022 2027 2037
Category Base Case TAF 2017 Base Case TAF 2017 Base Case TAF 2017 Base Case TAF 2017
Enplanements 11,515,639 11,515,639 14,228,574 13,121,857 15,662,157 14,499,142 18,666,369 17,623,339
Passenger Operations 257,863 277,269
282,077 298,163
309,395 324,653
343,535 388,313
Cargo Operations 19,406 23,122 24,280 31,142
GA Operations 40,476 40,476 42,825 39,599 45,624 39,899 52,807 40,503
Military Operations 7,348 7,348 7,348 7,348 7,348 7,348 7,348 7,348
Total Operations 325,093 325,093 355,372 345,110 386,647 371,900 434,832 436,164
GA Based Aircraft1 290 359 294 387 295 415 303 478
Comparison with FAA TAF 2017 (percent different)
Enplanements 0.0% 7.8% 7.4% 5.6%
Commercial Operations2 0.0% 2.3% 2.7% -3.6%
GA Operations 0.0% 7.5% 12.5% 23.3%
Military Operations 0.0% 0.0% 0.0% 0.0%
Total Operations 0.0% 2.9% 3.8% -0.3%
GA Based Aircraft -23.8% -31.6% -40.7% -57.8% 1The discrepancy between the Base Case Forecast and FAA TAF 2017 in GA Based Aircraft is the result of a verified count completed in mid-2018 2 Commercial Operations are defined as scheduled air carrier passenger and cargo Source: RS&H, 2018; FAA TAF, 2017

A V I A T I O N A C T I V I T Y F O R E C A S T
SLC Department of Airports – Airport Master Plan Update 2-121
2.10.2 Forecast Usage within the Master Plan This forecast studied historical SLC aviation data, as well as Airport trends, while analyzing current and anticipated economic impacts within the industry. Since airport activity levels are heavily influenced by economic events and changes in the industry, planning recommended facility expansions or required upgrades on specific years can be challenging. It is generally accepted that new facility constructed should be initiated only when specific activity levels have been reached that necessitate the improvement, rather than being initiated based on reaching a calendar date. Therefore, three planning activity levels (PALs) will be used in the Facility Requirements chapter to identify the threshold for required changes to the Airport’s facilities, instead of defining a particular year. These PALs represent a trigger level of activity that could occur sooner or later than the year associated with that level of activity in this forecast document. For planning purposes, the subsequent three PALs (PAL 1, PAL 2, and PAL 3) correspond to the forecast years (2022, 2027, and 2037). As shown in FIGURE 2-64, the distance between one PAL and another is an unspecified length of time. In theory, the time difference between each PAL is five years but it can be much longer; in times of fast economic growth or new airline service the next PAL level could be achieved in less than five years. During this unspecified length of time, an expected Level of Service (LOS) begins to erode with increasing demand. In general terms, planning for the next level of improvements begins at approximately 60 percent of the difference between one PAL and another. Design would occur at the 80 percent level and the facility would be fully operational prior to achieving the next PAL level. At that time of facility improvement, the capacity of the facility increases and the LOS is enhanced to design parameters. Facility improvements are designed to meet the threshold of efficiency and cost effectiveness for that facility. Meaning facilities are constructed at an acceptable cost and LOS but not developed until they are needed. FIGURE 2-64 PLANNING ACTIVITY LEVEL (PAL) DEVELOPMENT PATH

This Page Intentionally Left Blank
APPENDIX C
BASELINE OPERATIONS BY FLEET MIX

A P P E N D I X C
Salt Lake City International Airport Master Plan 1
Operations by Type
Aircraft Code Passenger Air Cargo GA Military Total Operations
A124 2 0 0 0 2
A300 0 1,083 0 0 1,083
A306 0 1,083 0 0 1,083
A319 15,654 0 0 0 15,654
A320 30,378 0 0 0 30,378
A321 3,205 0 0 0 3,205
A330 161 0 0 0 161
A332 489 0 0 0 489
A333 339 0 0 0 339
ASTR 0 0 47 0 47
B38M 12 0 0 0 12
B712 15,766 0 0 0 15,766
B722 6 0 0 0 6
B732 10 0 0 0 10
B733 532 0 0 0 532
B734 290 986 0 0 1,276
B735 8 0 0 0 8
B737 20,434 0 0 0 20,434
B738 31,105 0 0 0 31,105
B739 16,405 0 0 0 16,405
B744 3 0 0 0 3
B752 5,674 1,381 0 0 7,055
B753 256 0 0 0 256
B762 72 0 0 0 72
B763 2,326 1,293 0 0 3,619
B764 4 0 0 0 4
B767 2 0 0 0 2
B772 4 0 0 0 4
B788 3 0 0 0 3
B789 188 0 0 0 188
BE40 0 0 334 0 334
C25A 0 0 290 0 290
C25B 0 0 497 0 497
C25C 0 0 352 0 352
C25M 0 0 39 0 39
C500 0 0 14 0 14
C501 0 0 30 0 30
C510 0 0 470 0 470
C525 0 0 968 0 968
C550 344 0 0 0 344
Continued on next page

A P P E N D I X C
Salt Lake City International Airport Master Plan 2
Aircraft Code Passenger Air Cargo GA Military Total Operations
C560 0 0 989 0 989
C56X 0 0 1,503 0 1,503
C650 0 0 173 0 173
C680 0 0 849 0 849
C68A 0 0 146 0 146
C700 0 0 2 0 2
C750 0 0 668 0 668
CL30 0 0 1,405 0 1,405
CL35 132 0 345 0 477
CL60 150 0 760 0 910
CRJ2 39,044 0 0 0 39,044
CRJ7 21,772 0 0 0 25,689
CRJ7 3,917 0 0 0
CRJ9 18,442 0 0 0 18,442
DC10 0 178 0 0 178
DC91 6 0 0 0 6
DC93 2 0 0 0 2
E135 168 0 0 0 168
E145 31 0 0 0 31
E170 1,268 0 0 0 1,268
E175 246 0 0 0 246
E190 270 0 0 0 270
E35L 35 0 0 0 35
E45X 495 0 0 0 495
E50P 571 0 0 0 571
E545 105 0 0 0 105
E550 438 0 0 0 438
E55P 423 0 0 0 423
E75L 13,041 0 0 0 13,041
E75S 3,298 0 0 0 3,298
EA50 0 0 198 0 198
F18S 0 0 0 2 2
F2TH 0 0 455 0 455
F900 0 0 359 0 359
FA10 0 0 30 0 30
FA20 0 0 22 0 22
FA50 0 0 236 0 236
FA7X 0 0 66 0 66
G150 294 0 100 0 394
G280 104 0 60 0 164
G5 0 0 4 0 4
Continued on next page

A P P E N D I X C
Salt Lake City International Airport Master Plan 3
Aircraft Code Passenger Air Cargo GA Military Total Operations
GALX 264 0 100 0 364
GL5T 143 0 0 0 143
GLEX 177 0 0 0 177
GLF2 0 0 3 0 3
GLF3 60 0 53 0 113
GLF4 0 0 1,734 0 1,734
GLF5 314 0 115 0 429
GLF6 0 0 85 0 85
H25A 0 0 6 0 6
H25B 0 0 966 0 966
H25C 0 0 19 0 19
HA4T 0 0 129 0 129
HDJT 0 0 190 0 190
J328 0 0 19 0 19
L39 0 0 0 4 4
LJ24 0 0 2 0 2
LJ25 0 0 2 0 2
LJ31 0 0 131 0 131
LJ35 0 0 475 0 475
LJ40 0 0 56 0 56
LJ45 0 0 253 0 253
LJ55 0 0 61 0 61
LJ60 0 0 416 0 416
LJ75 0 0 55 0 55
LR35 0 0 2 0 2
MD11 0 1,195 0 0 1,195
MD82 231 0 0 0 231
MD83 725 0 0 0 725
MD90 2,957 0 0 0 2,957
MU30 0 0 4 0 4
PRM1 0 0 138 0 138
SBR1 0 0 16 0 16
SF50 0 0 54 0 54
SJ30 0 0 6 0 6
T38 0 0 0 4 4
WW24 0 0 6 0 6
AA5 0 0 20 0 20
AT43 0 375 0 0 375
AT45 0 0 1 0 1
AT72 2 38 0 0 40
AT8T 0 0 1 0 1
Continued on next page
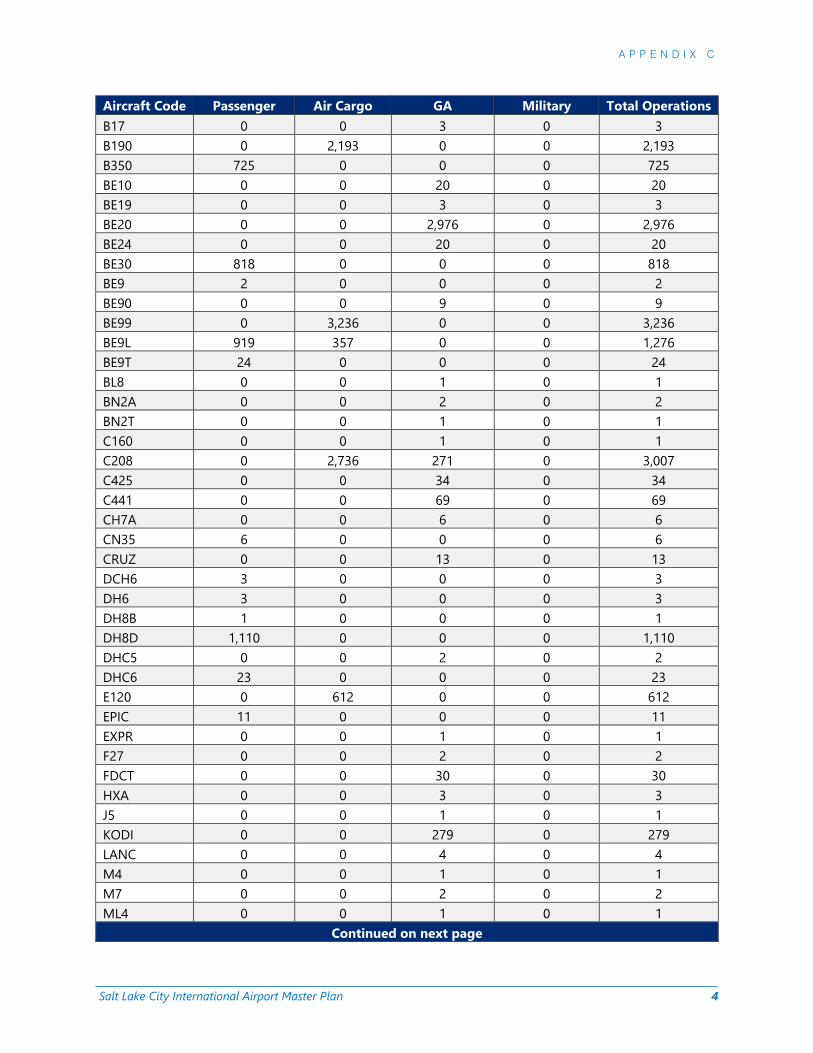
A P P E N D I X C
Salt Lake City International Airport Master Plan 4
Aircraft Code Passenger Air Cargo GA Military Total Operations
B17 0 0 3 0 3
B190 0 2,193 0 0 2,193
B350 725 0 0 0 725
BE10 0 0 20 0 20
BE19 0 0 3 0 3
BE20 0 0 2,976 0 2,976
BE24 0 0 20 0 20
BE30 818 0 0 0 818
BE9 2 0 0 0 2
BE90 0 0 9 0 9
BE99 0 3,236 0 0 3,236
BE9L 919 357 0 0 1,276
BE9T 24 0 0 0 24
BL8 0 0 1 0 1
BN2A 0 0 2 0 2
BN2T 0 0 1 0 1
C160 0 0 1 0 1
C208 0 2,736 271 0 3,007
C425 0 0 34 0 34
C441 0 0 69 0 69
CH7A 0 0 6 0 6
CN35 6 0 0 0 6
CRUZ 0 0 13 0 13
DCH6 3 0 0 0 3
DH6 3 0 0 0 3
DH8B 1 0 0 0 1
DH8D 1,110 0 0 0 1,110
DHC5 0 0 2 0 2
DHC6 23 0 0 0 23
E120 0 612 0 0 612
EPIC 11 0 0 0 11
EXPR 0 0 1 0 1
F27 0 0 2 0 2
FDCT 0 0 30 0 30
HXA 0 0 3 0 3
J5 0 0 1 0 1
KODI 0 0 279 0 279
LANC 0 0 4 0 4
M4 0 0 1 0 1
M7 0 0 2 0 2
ML4 0 0 1 0 1
Continued on next page

A P P E N D I X C
Salt Lake City International Airport Master Plan 5
Aircraft Code Passenger Air Cargo GA Military Total Operations
MU2 0 0 74 0 74
MU20 0 0 3 0 3
P180 180 0 0 0 180
P28 0 0 1 0 1
P46T 121 0 152 0 273
PA18 0 0 3 0 3
PA20 0 0 5 0 5
PA22 0 0 6 0 6
PAY1 0 0 3 0 3
PAY2 149 0 0 0 149
PAY3 0 0 9 0 9
PAY4 0 0 4 0 4
PC12 595 0 5,225 0 5,820
RV12 0 0 44 0 44
S108 0 0 2 0 2
SB20 0 0 42 0 42
SH36 0 0 2 0 2
STAR 2 0 0 0 2
SW3 259 0 0 0 259
SW4 0 2,165 0 0 2,165
TBM7 0 0 156 0 156
TBM8 0 0 197 0 197
TBM9 115 0 0 0 115
AS350 0 0 166 0 166
B06 0 0 577 0 577
R44 0 0 302 0 302
R22 0 0 440 0 440
PA22 0 0 166 0 166
A109SP 0 0 994 0 994
AC11 0 0 6 0 6
AC50 0 0 13 0 13
AC60 0 0 4 0 4
AC68 0 0 5 0 5
AC80 0 0 71 0 71
AC90 0 0 76 0 76
AC95 0 0 11 0 11
AERO 0 0 3 0 3
AEST 0 0 106 0 106
B26 0 0 2 0 2
B36T 0 0 6 0 6
BE33 0 0 86 0 86
Continued on next page

A P P E N D I X C
Salt Lake City International Airport Master Plan 6
Aircraft Code Passenger Air Cargo GA Military Total Operations
BE35 0 0 144 0 144
BE36 0 0 62 0 62
BE50 0 0 11 0 11
BE55 0 0 26 0 26
BE58 0 0 24 0 24
BE60 0 0 10 0 10
BE76 0 0 8 0 8
BL17 0 0 10 0 10
BN2P 0 0 2 0 2
C0L4 0 0 36 0 36
C150 0 0 35 0 35
C152 0 0 34 0 34
C162 0 0 12 0 12
C170 0 0 2,855 0 2,855
C172 0 0 1,777 0 1,777
C177 0 0 70 0 70
C180 0 0 60 0 60
C182 0 0 746 0 746
C185 0 0 358 0 358
C195 0 0 3 0 3
C206 0 0 343 0 343
C207 0 0 3 0 3
C210 0 0 159 0 159
C240 0 0 28 0 28
C310 0 0 20 0 20
C320 0 0 5 0 5
C337 0 0 13 0 13
C340 0 0 333 0 333
C402 0 495 86 0 581
C414 0 0 112 0 112
C421 0 0 135 0 135
C82R 0 0 3 0 3
C82T 0 0 2 0 2
CH7B 0 0 17 0 17
COL3 0 0 8 0 8
COL4 0 0 39 0 39
DA20 0 0 2 0 2
DA40 0 0 308 0 308
DA42 0 0 141 0 141
DC3 0 0 2 0 2
DV20 0 0 51 0 51
Continued on next page

A P P E N D I X C
Salt Lake City International Airport Master Plan 7
Aircraft Code Passenger Air Cargo GA Military Total Operations
DV40 0 0 1 0 1
EVOT 0 0 4 0 4
EXP 0 0 5 0 5
GLAS 0 0 3 0 3
HROC 0 0 2 0 2
HSKY 0 0 4 0 4
HUKY 0 0 6 0 6
HUSK 0 0 50 0 50
HXB 0 0 19 0 19
HXC 0 0 2 0 2
L60 0 0 1 0 1
LAKE 0 0 1 0 1
LEG2 0 0 2 0 2
LNC2 0 0 4 0 4
LNC3 0 0 1 0 1
LNC4 0 0 16 0 16
LNCE 0 0 1 0 1
M020 0 0 5 0 5
M021 0 0 1 0 1
M20 0 0 6 0 6
M20F 0 0 2 0 2
M20J 0 0 4 0 4
M20M 0 0 1 0 1
M20P 0 0 170 0 170
M20T 0 0 82 0 82
M5 0 0 1 0 1
MAUL 0 0 3 0 3
MO20 0 0 30 0 30
MO21 0 0 4 0 4
P06T 0 0 111 0 111
P210 0 0 21 0 21
P28A 0 0 330 0 330
P28B 0 0 4 0 4
P28R 0 0 149 0 149
P28T 0 0 1 0 1
P32R 0 0 18 0 18
P32T 0 0 1 0 1
P337 0 0 1 0 1
PA23 0 0 2 0 2
PA24 0 0 62 0 62
PA27 0 0 25 0 25
Continued on next page

A P P E N D I X C
Salt Lake City International Airport Master Plan 8
Aircraft Code Passenger Air Cargo GA Military Total Operations
PA28 0 0 85 0 85
PA30 0 0 6 0 6
PA31 0 0 206 0 206
PA32 0 0 81 0 81
PA34 0 0 43 0 43
PA44 0 0 287 0 287
PA46 0 0 101 0 101
PA60 0 0 3 0 3
PARO 0 0 5 0 5
PAYE 0 0 1 0 1
PAZT 0 0 1 0 1
PIPE 0 0 1 0 1
PZ4M 0 0 2 0 2
RV10 0 0 2 0 2
RV6 0 0 3 0 3
RV7 0 0 7 0 7
RV7A 0 0 1 0 1
RV8 0 0 3 0 3
RV9 0 0 1 0 1
S22T 0 0 31 0 31
SPRT 0 0 1 0 1
SR20 0 0 76 0 76
SR22 0 0 989 0 989
T206 0 0 2 0 2
T210 0 0 4 0 4
TBM 0 0 17 0 17
TRIN 0 0 1 0 1
U16 0 0 2 0 2
WACF 0 0 1 0 1
WACO 0 0 2 0 2
ZZZZ 0 0 16 0 16
SD330 0 0 0 2 2
F18 0 0 0 100 100
C17 0 0 0 10 10
C130 0 0 0 10 10
C12 0 0 0 200 200
C20 0 0 0 200 200
PC12 0 0 0 200 200
KC-135 0 0 0 6,580 6,580
V22 0 0 0 32 32
H64 0 0 0 4 4
Total 257,863 19,406 40,476 7,348 325,093