development activity highlights and five-year forecast
TRANSCRIPT
Development Activity Highlights
and Five-Year Forecast (2021-2025)
Prepared by:
City of San Jose
Department of Planning, Building and Code Enforcement
February 2020
Development Activity Highlights
and Five-Year Forecast (2021-2025)
For more information, please contact:
City of San José
Department of Planning, Building and Code Enforcement
Planning Division
200 East Santa Clara Street
San Jose, CA 95113
(408) 535-3555
This report in color and other information can be found
on the Planning Division website at:
http://www.sanjoseca.gov/index.aspx?NID=2050

Development Activity Highlights
and Five-Year Forecast (2021-2025)
TABLE OF CONTENTS
Section Title Page
I Purpose ................................................................................... 1
II Summary ................................................................................ 1
III Five-Year Forecast (2019-2023) ........................................... 4
IV Construction Taxes and Exemptions .................................. 6
V Major Development Activity Data ....................................... 7
Residential ............................................................................... 8
Commercial ............................................................................. 11Industrial ................................................................................. 13
VI Major Development Activity Maps (Planning Areas) ....... 15Alum Rock ............................................................................... 16Alviso ....................................................................................... 17Berryessa ................................................................................. 18Cambrian/Pioneer ................................................................... 19Central ..................................................................................... 20Edenvale .................................................................................. 21Evergreen ................................................................................ 22North ........................................................................................ 23South ........................................................................................ 24West Valley .............................................................................. 25Willow Glen ............................................................................. 26
VII Appendix: Sources ............................................................... 27

Development Activity Highlights
and Five-Year Forecast (2021-2025)
I. PURPOSE
The Development Activity Highlights and Five-Year Forecast (2021-2025) is a report
issued annually by the Department of Planning, Building and Code Enforcement. The
report serves three important functions, as follows:
1. Assists the Office of the City Manager in estimating future construction-related
tax revenues that generate funds for the City’s Capital Improvement Program;
2. Provides City policymakers and staff with key data for periodic assessment of
the rate, type, and location of development activity in San José; and,
3. As a tool for distributing information on major development projects to the
public.
II. SUMMARY
New industrial development decreased in fiscal year 2018/2019, but is projected to
significantly increase in fiscal year 2019/2020. New residential and commercial
development remained strong and current trends suggest levels will remain strong
through the next fiscal year. The rate of new development may begin to slowly decline
to historical averages.
Residential Development
After two historic years of residential development in fiscal years 2013/2014 and
2014/2015, construction of new units in fiscal year 2015/2016 declined but rebounded
in fiscal year 2016/2017 and fiscal year 2017/2018. Residential development in fiscal
year 2018/2019 returned to the historical average of around 3,000 units, but exceeded
the previous 5-year average of approximately 2,775 units.
During the first six months of fiscal year 2019/2020, building permits were issued for
approximately 1,300 new residential units. Additionally, as of February 2020, there
were approximately 7,400 new residential units that have received entitlements, but
have not yet started construction. Overall, new residential units are forecasted to
remain at or slightly below the five-year average, at 2,400 units during the forecast
period based on the current housing trends, which have slowed due to increases in the
costs associated with new construction, and the flattening of rents relative to these
increased costs.
1
In 2016 the City Council approved an accessory dwelling unit (ADU) ordinance that
loosened existing zoning code regulations to comply with state law. The City Council
approved additional updates to the Zoning Code in 2018 and 2019 to further ease
requirements for ADUs. As a result, more property owners are able to build secondary
units which are classified as single-family units in Table 2 of the Five-Year Forecast.
New construction of single-family units reached 250 units in 2017/2018, of which 153
were ADUs, noting the first time new construction of ADU’s surpassed single-family
homes. In 2018/2019 the trend continued as the number of new ADU unit climbed to
296 new units. This represented an approximately 90% increase in building permit
issuance for ADUs from the previous fiscal year. ADUs are forecasted to continue their
trend upward with 275 new units approved within the first 7 months of fiscal year
2019/2020.
High rents have spurred calls for action for many Bay Area communities, inciting a
continued discussion of displacement, gentrification, and affordability. Since 2010,
rents rose by 55%, averaging $2,876 per unit per month. Following multiple years of
steep increases, rents in Silicon Valley have leveled off. In San José rent growth has
plateaued advancing 0.1% year-over-year through November 2019 to $2,876. For the
first time since 2011, the median single-family home price decreased approximately 2.9
percent. From $1.055 million at the end of 2018 to $1.022 million by the end of 2019,
however the amount is still four times the U.S. Figure and up 57% since 2011.
Commercial Development
Similar to the last two fiscal years, large hotel and retail projects contributed to another
strong year of commercial growth with valuation of new commercial construction in
fiscal year 2018/2019 at $362 million, slightly lower than $411 million in the previous
fiscal year 2017/2018, but slightly above the historical 5-year average. Commercial
alterations remained strong in fiscal year 2018/2019 approximately 20 million above
the 5-year historic average at $285 million indicative of low retail vacancy rates in the
south bay, and a strong economy overall.
As of the fourth quarter of 2019, the overall retail vacancy rate in San José rose to
approximately 4.4%, slightly higher than the previous year (approximately 3.9%). This
is mostly due to new construction coming online rather than new vacant properties.
During the first six months of the current fiscal year (2019/2020) valuation of new
commercial construction has reached over $300 million, and is forecasted to reach
$340 million, slightly below previous fiscal year of $362 million. Over 1.6 million
square feet of commercial projects have been entitled but have not yet started
construction.
Commercial activity for 2018/2019 is slightly lower than the two previous fiscal years,
2016/2017 and 2017/2018, which were buoyed by issuance of building permits for the
Valley Fair Shopping Mall expansion. Construction activity for the Valley Fair
Shopping Mall has begun to slow down, but new commercial construction for Hampton
Inn and an expansion of Capitol Toyota has replaced a portion of commercial activity.
2

Fiscal year 2019/2020 and fiscal year 2020/2021 are projected to remain consistent and
return to the 5-year average levels of previous years. Lack of available land for large
retail centers and national retail trends, may result in decline in new commercial
construction in the future. On the national level, demand for retail space is shifting due
to competition from online sales, and investors are more focused on smaller retail
centers, including lifestyle/entertainment, food/beverage or grocery-anchored, and
niche power centers. In the past year, large retailers like Orchard Supply, Toys-R-Us,
Lowe’s, and Sears have gone out of business or closed locations as the retail market
evolves.
Due to these factors commercial construction activity is forecasted to slightly decline
over the next couple fiscal years. However, hotel development has shown an increase
with 1,373 hotel rooms pending entitlements and over 1,600 rooms entitled but not
constructed.
Industrial/Office Development
New industrial construction incorporates construction for office buildings and
industrial manufacturing and warehouse space. Valuation of new industrial
construction activity decreased in fiscal year 2018/2019 at $152 million, compared to
the previous fiscal year of $244 million. Industrial/Office development can vary largely
depending on timeline of large pipeline projects. The demand for office is reflected in
the overall office vacancy rates in Silicon Valley, as they continued to decline during
the fourth quarter of 2019 to 7.5%, a decrease from the vacancy rate in 2018 of 9.8%.
Overall industrial warehouse vacancy rates remain low at 3.0% slightly up from 2.6%
in the fourth quarter of 2018. However, through the first six months of the current fiscal
year (2019/2020) valuation of new industrial construction surpassed $300 million, with
a forecasted valuation of $400 million for the year. Similar to the residential market,
high cost of construction and limited availability of workers is a limiting factor for new
industrial construction, with over 8 million square feet of industrial development
entitled and yet to start construction.
The office availability rate in downtown San José in the fourth quarter of 2019 has
remained consistent with a small increase from 12.7% at the beginning of 2019 to
12.9%. Downtown San José’s most significant milestone this year is the ground
breaking of two high-rise commercial projects, Adobe North Tower and 200 Park
Tower. The last office high rise in Downtown San José was the River Park Tower 2,
which rose on West San Carlos in 2010. 200 Park Tower a 19-story, 857,000 square-
foot office tower and Adobe North Tower a 18-story, 700,00 square-foot office tower
in Downtown San José signifying the strength in the economy and competitiveness of
Downtown San José.
3
The availability and vacancy rate for Research & Development (R&D) in the North
San José market decreased for fiscal year 2018/2019 to 15.2% from 20.2%. Higher
asking rates and BART’s (Bay Area Rapid Transit) upcoming extension into Milpitas
and North San José continues to accelerate demand in the North San José area.
The strong demand for office and R&D in Silicon Valley, driven by growth in tech
employment, has led to historically low vacancy rates and high rents in neighboring
cities. As technology and related sector companies continue to expand, San José can
offer several advantages for firms looking for office space including campus settings,
flexible office spaces, and significant housing, retail, transit, and other amenities. This
has led to increasing interest in industrial space in San Jose and resulted in large real
estate transactions in San José Airport, North San José, and Downtown San José
submarkets. The most notable being Google’s investment and interest to create an 8
million square foot campus Downtown.
On October 11, 2019 Google submitted their entitlement application and is proposing
to construct approximately 6,500,000 square feet of office (with a maximum of
7,300,000 square feet); approximately 3,000 to 5,000 units of housing (with a
maximum of 5,900 units); approximately 300,000 to 500,000 square feet of active uses,
which may include retail, cultural, arts, etc.; approximately 100,000 square feet of
event space; up to 300 hotel rooms and up to 800 rooms of limited-term corporate
accommodations. The proposed project represents approximately 27% of all industrial
square footage in the pipeline and 17% of all residential units in the development
process.
III. FIVE-YEAR FORECAST (2021-2025)
The Department of Planning, Building and Code Enforcement’s five-year forecast of
development activity is summarized in Tables 1 and 2 (next page). Construction
valuation in fiscal year 2019/2020 is expected to continue at or slightly below the
previous five-year average, fueled by a strong commercial and industrial construction,
and a slight slowdown of new residential construction. Although valuations of new
residential construction have declined, the number of units remain strong since a high
number of ADU’s are projected. Future development is predicted to be driven by
mixed-use residential projects, and certain commercial and industrial sectors as
described above. San José is poised to capitalize on on-going and growing demand for
office and warehouse space for expanding companies that has led to low vacancy rates
and high rents in neighboring cities. Additional connectivity with the expansion of the
BART into the Berryessa area and with plans for future expansion to Downtown is
another positive indication for future development in San José.
4
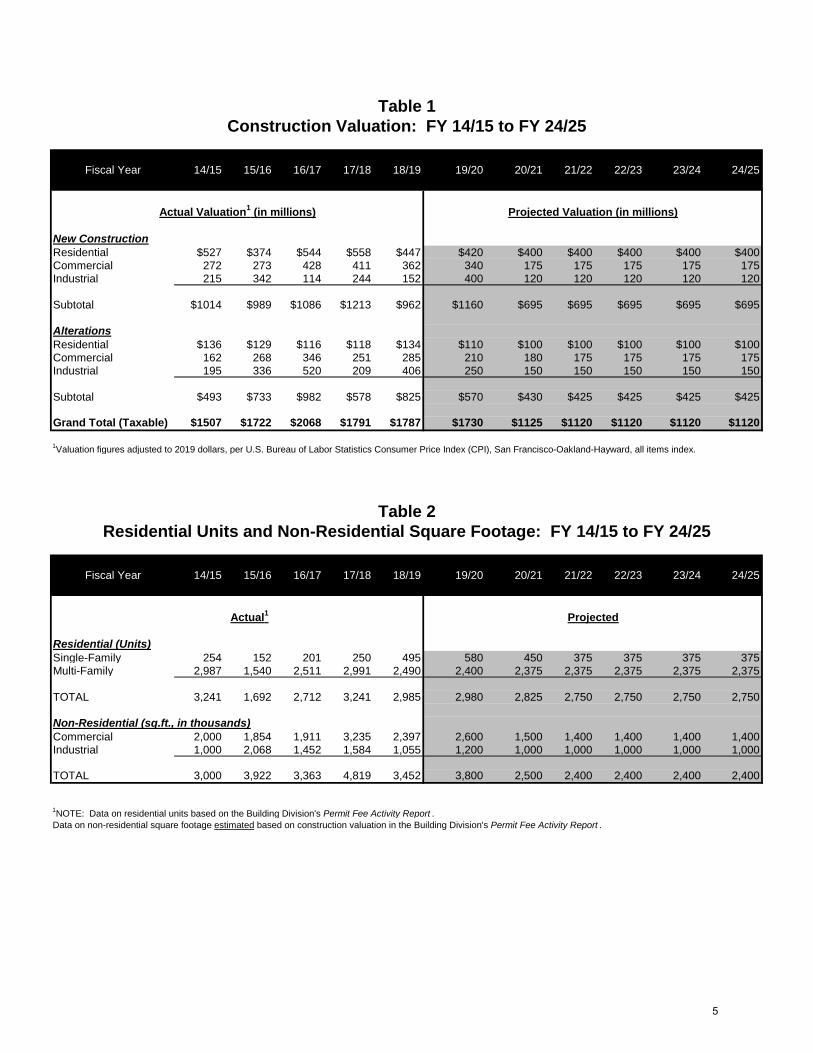
Fiscal Year 14/15 15/16 16/17 17/18 18/19 19/20 20/21 21/22 22/23 23/24 24/25
New Construction
Residential $527 $374 $544 $558 $447 $420 $400 $400 $400 $400 $400Commercial 272 273 428 411 362 340 175 175 175 175 175Industrial 215 342 114 244 152 400 120 120 120 120 120
Subtotal $1014 $989 $1086 $1213 $962 $1160 $695 $695 $695 $695 $695
Alterations
Residential $136 $129 $116 $118 $134 $110 $100 $100 $100 $100 $100Commercial 162 268 346 251 285 210 180 175 175 175 175Industrial 195 336 520 209 406 250 150 150 150 150 150
Subtotal $493 $733 $982 $578 $825 $570 $430 $425 $425 $425 $425
Grand Total (Taxable) $1507 $1722 $2068 $1791 $1787 $1730 $1125 $1120 $1120 $1120 $1120
1Valuation figures adjusted to 2019 dollars, per U.S. Bureau of Labor Statistics Consumer Price Index (CPI), San Francisco-Oakland-Hayward, all items index.
Fiscal Year 14/15 15/16 16/17 17/18 18/19 19/20 20/21 21/22 22/23 23/24 24/25
Residential (Units)
Single-Family 254 152 201 250 495 580 450 375 375 375 375Multi-Family 2,987 1,540 2,511 2,991 2,490 2,400 2,375 2,375 2,375 2,375 2,375
TOTAL 3,241 1,692 2,712 3,241 2,985 2,980 2,825 2,750 2,750 2,750 2,750
Non-Residential (sq.ft., in thousands)
Commercial 2,000 1,854 1,911 3,235 2,397 2,600 1,500 1,400 1,400 1,400 1,400Industrial 1,000 2,068 1,452 1,584 1,055 1,200 1,000 1,000 1,000 1,000 1,000
TOTAL 3,000 3,922 3,363 4,819 3,452 3,800 2,500 2,400 2,400 2,400 2,400
1NOTE: Data on residential units based on the Building Division's Permit Fee Activity Report .
Data on non-residential square footage estimated based on construction valuation in the Building Division's Permit Fee Activity Report .
Construction Valuation: FY 14/15 to FY 24/25
Table 1
Residential Units and Non-Residential Square Footage: FY 14/15 to FY 24/25
ProjectedActual1
Projected Valuation (in millions)Actual Valuation1 (in millions)
Table 2
5
IV. CONSTRUCTION TAXES
The City of San Jose imposes a series of construction-related taxes that are generally
used to finance the construction and improvement of facilities and infrastructure
systems that provide capacity beyond the needs attributed to a particular development.
These taxes are in addition to cost-recovery fees charged for processing and reviewing
applications for development approvals and permits. The largest construction-related
tax revenue sources are described below.
Building and Structure Construction Tax
The Building and Structure Construction Tax is imposed upon the construction, repair,
or improvement of any building or structure where a building permit is required (except
for authorized exemptions- see below). The proceeds from this tax are restricted in use
to the provision of traffic capital improvements on major arterials and collectors, the
acquisition of lands and interest in land, and the construction, reconstruction,
replacement, widening, modification and alteration (but not maintenance) of City
streets.
Construction Excise Tax
The Construction Excise Tax is imposed upon construction, alteration, repair, or
improvement of any residential or commercial structure (except for authorized
exemptions- see below). The tax does not apply to industrial development. This is a
general purpose tax that may be used for any “usual current expenses” of the City. The
City Council has historically used the majority of these funds for traffic infrastructure
improvements.
Residential Construction Tax
The Residential Construction Tax is imposed upon any construction of a one-family
dwelling unit or multi-family units or any mobile home lot in the City. This tax is
collected and placed in a fund used to reimburse private entities that have constructed a
portion of an arterial street that is wider than what is normally required in connection
with residential development. The funds are also used to construct median landscaping
and other street improvements.
6

V. MAJOR DEVELOPMENT ACTIVITY DATA
Planning staff has collected a significant amount of data on development activity,
which is the foundation for the five-year forecast contained in Section III of this report.
This data focuses on recent “major” projects with the highest likelihood to have the
most significant impact on the forecast. Major projects are defined as residential
projects greater than 50 dwelling units, commercial projects greater than 25,000 square
feet, and industrial projects greater than 75,000 square feet.
The development activity data on the following pages is first divided into three major
land use categories-- residential, commercial, and industrial. Then, individual projects
are divided into four subcategories based on project status— projects completed,
projects under construction, approved projects (construction not yet commenced), and
projects pending City approval.
7

Major Residential Development Activity
Projects of 50+ Dwelling Units
File Number Filing Date Project Name Tracking APN Address Planning Area Housing Type No. of Units Approval Date
Projects Completed 2019 to 2020
H14-010 2/28/14 The James 467-21-018 66 N. 1st Street Central MF 190 2/25/15
PD14-012 2/28/14 808 West Apartments 264-15-062 800 W. San Carlos Street Central MF 315 10/28/14
PD15-024 5/27/15 King & Dobbin Transit Vilage Lot G 254-55-006 1875 Dobbin Drive Alum Rock MF 101 11/4/15
PD14-031 6/27/14 Aura 264-30-067 180 Balbach Street Central MF 101 12/27/14
PDA07-094-01 1/13/15 2nd Street Studios 477-01-082 1140 S. 2nd Street Central MF 135 3/4/15
PD14-044 9/3/14 King & Dobbin Transit Vilage Lot E 254-04-079 1745 Dobbin Drive Alum Rock MF 67 7/29/15
H14-034 10/2/14 Sparq 472-26-030 598 S. 1st Street Central MF 105 10/7/15
CP15-078 11/16/15 Renascent Place 497-41-098 2500 Senter Road South MF 162 4/27/2016
PD16-001 1/15/16 Scotia Apartments 455-21-043 1777 Almaden Road South MF 55 5/17/16
PD16-006 2/5/16 Vespaio @ Diridon (Residential) 259-28-004 138 Stockton Avenue Central MF 164 5/25/2016
CP16-014 4/11/16 Villas on the Park 467-01-121 278 N. 2nd Street Central MF 84 2/24/2017
H16-036 10/4/16 The Graduate 467-46-005 80 E. San Carlos Street Central MF 260 3/22/17
Total 1,739
Projects Under Construction
PD12-008 3/1/12 Murano at Montecito Vista 455-09-060Southwest side of Montecito Vista Way at the western terminus of
Esfahan Drive and Montecito Vista DriveSouth SF 100 6/7/13
PD12-039 10/11/12 South Village (Hitachi Condo's) 706-65-020 0 Raleigh Road Edenvale MF 83 12/20/12
H12-020 1/16/13 San Pedro Square 259-32-044 195 W. Julian Street Central MF 406 2/24/14
PD13-027 7/1/13 Vicenza at Montecito Vista 455-09-062East side of Montecito Vista Way, between Esfahan Drive and Montecito
Vista DriveSouth MF 162 11/22/13
H13-041 10/31/13 Silvery Towers Apts 259-32-004 180 W. St. James Street Central MF 643 2/26/14
PDA14-035-01 8/21/14 Communication Hill (Phase 1) 455-28-017Junction of Communications Hill Blvd. and the CalTrain railway to the
terminus of Communications Hill Blvd. and Casselino Drive.South SF 314 3/18/15
PD14-051 10/30/14 777 Park Ave 261-36-062 777 Park Avenue Central MF 182 3/18/15
H15-007 1/23/15 Modera San Pedro Square 259-35-042 45 N. San Pedro Street Central MF 201 5/20/15
PD15-013 4/3/15 Arcadia/Evergreen Part 1 670-29-002 2140 Quimby Road Evergreen SF 250 11/30/15
PD15-014 4/16/15 1807 Almaden Rd 455-21-050 1807 Almaden Road South MF 96 10/7/15
PD15-035 7/9/15 Ohlone Block C 264-14-024 345 Sunol Street Central MF 268 12/16/15
PDA15-036-01 7/9/15 Ohlone Block B 264-14-024 345 Sunol Street Central MF 269 12/16/15
PD15-055 11/4/15 Shea Homes/ Japantown Corp. Yard 249-39-039Bounded by N. Sixth Street, E. Taylor Street, N. Seventh Street, and
Jackson StreetCentral MF 520 5/25/16
PDA12-031-01 11/13/15 Platform 241-04-011 1501 Berryessa Road Berryessa MF 551 4/13/16
PD15-067 12/22/15 The Reserve 299-26-059 881 S. Winchester Boulevard West Valley MF 640 4/27/2016
PD16-002 1/21/16 Berryessa Flea Market (KB) 241-04-011North side of Berryessa Road on the northern portion of the parcel just
west of Union Pacific Railroad tracks (Flea Market)Berryessa SF 162 5/18/16
PD16-005 2/4/16 Istar/Great Oaks 706-08-008West side of Great Oaks Blvd approx 1,000 feet northwesterly of
Highway 85Edenvale MF 301 5/18/2016
PD16-025 8/16/16 The Orchard (Residential) 254-06-042 641 N. Capitol Avenue Alum Rock MF 188 1/24/17
SPA17-009-01 9/7/17 Miro (formerly SJSC Towers) 467-20-086 33 N. 5th Street Central MF 630 12/13/17
PD14-055 1/13/15 Leigh Ave Apartments 284-32-014 1030 Leigh Avenue Willow Glen MF 64 3/18/15
PD15-044 9/11/15 Sparta 467-16-076 525 E. Santa Clara Street Central MF 85 9/20/16
H15-046 9/25/15 363 Delmas Avenue 264-26-006 341 Delmas Avenue Central MF 120 6/21/16
PDA14-035-04 4/9/17 Communication Hill Phase II 455-28-016junction of Communications Hill Blvd. and the CalTrain railway to the
terminus of Communications Hill Blvd. and Casselino Drive.South MF 486 7/26/17
PD17-029 12/15/17 Julian/Stockton Mixed Use 261-01-030 715 W. Julian Street Central MF 228 10/23/18
Total 6,949
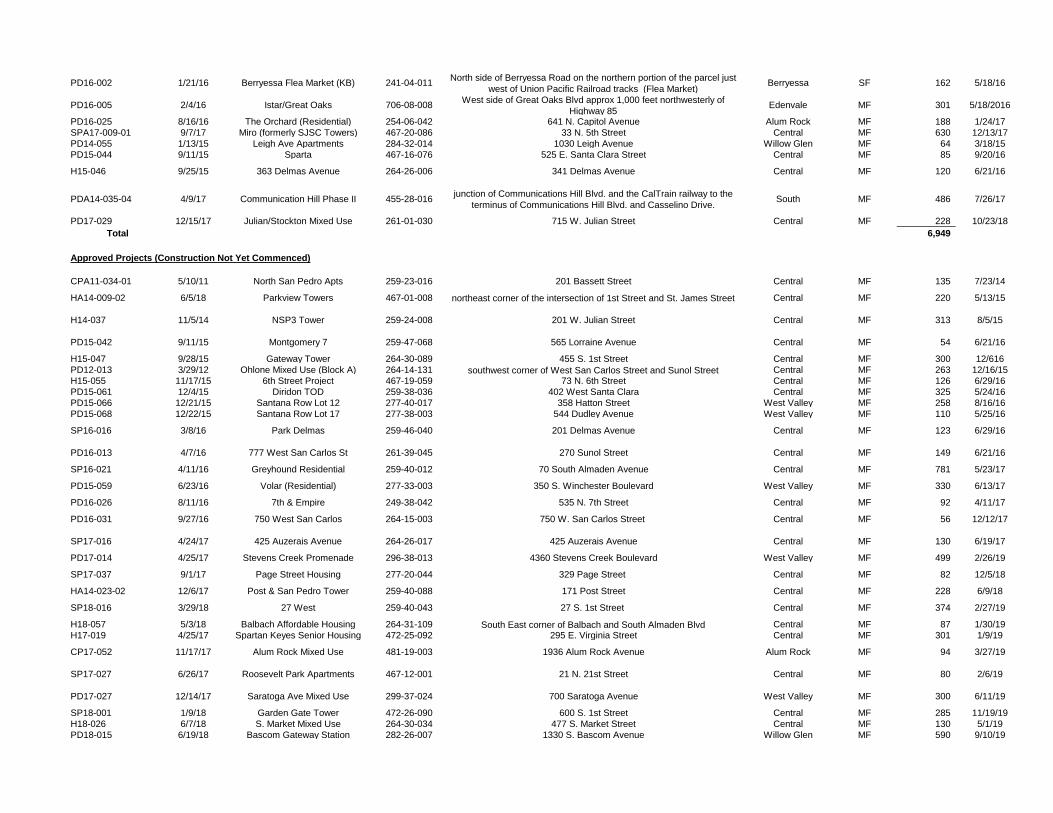
Approved Projects (Construction Not Yet Commenced)
CPA11-034-01 5/10/11 North San Pedro Apts 259-23-016 201 Bassett Street Central MF 135 7/23/14
HA14-009-02 6/5/18 Parkview Towers 467-01-008 northeast corner of the intersection of 1st Street and St. James Street Central MF 220 5/13/15
H14-037 11/5/14 NSP3 Tower 259-24-008 201 W. Julian Street Central MF 313 8/5/15
PD15-042 9/11/15 Montgomery 7 259-47-068 565 Lorraine Avenue Central MF 54 6/21/16
H15-047 9/28/15 Gateway Tower 264-30-089 455 S. 1st Street Central MF 300 12/616
PD12-013 3/29/12 Ohlone Mixed Use (Block A) 264-14-131 southwest corner of West San Carlos Street and Sunol Street Central MF 263 12/16/15
H15-055 11/17/15 6th Street Project 467-19-059 73 N. 6th Street Central MF 126 6/29/16
PD15-061 12/4/15 Diridon TOD 259-38-036 402 West Santa Clara Central MF 325 5/24/16
PD15-066 12/21/15 Santana Row Lot 12 277-40-017 358 Hatton Street West Valley MF 258 8/16/16
PD15-068 12/22/15 Santana Row Lot 17 277-38-003 544 Dudley Avenue West Valley MF 110 5/25/16
SP16-016 3/8/16 Park Delmas 259-46-040 201 Delmas Avenue Central MF 123 6/29/16
PD16-013 4/7/16 777 West San Carlos St 261-39-045 270 Sunol Street Central MF 149 6/21/16
SP16-021 4/11/16 Greyhound Residential 259-40-012 70 South Almaden Avenue Central MF 781 5/23/17
PD15-059 6/23/16 Volar (Residential) 277-33-003 350 S. Winchester Boulevard West Valley MF 330 6/13/17
PD16-026 8/11/16 7th & Empire 249-38-042 535 N. 7th Street Central MF 92 4/11/17
PD16-031 9/27/16 750 West San Carlos 264-15-003 750 W. San Carlos Street Central MF 56 12/12/17
SP17-016 4/24/17 425 Auzerais Avenue 264-26-017 425 Auzerais Avenue Central MF 130 6/19/17
PD17-014 4/25/17 Stevens Creek Promenade 296-38-013 4360 Stevens Creek Boulevard West Valley MF 499 2/26/19
SP17-037 9/1/17 Page Street Housing 277-20-044 329 Page Street Central MF 82 12/5/18
HA14-023-02 12/6/17 Post & San Pedro Tower 259-40-088 171 Post Street Central MF 228 6/9/18
SP18-016 3/29/18 27 West 259-40-043 27 S. 1st Street Central MF 374 2/27/19
H18-057 5/3/18 Balbach Affordable Housing 264-31-109 South East corner of Balbach and South Almaden Blvd Central MF 87 1/30/19
H17-019 4/25/17 Spartan Keyes Senior Housing 472-25-092 295 E. Virginia Street Central MF 301 1/9/19
CP17-052 11/17/17 Alum Rock Mixed Use 481-19-003 1936 Alum Rock Avenue Alum Rock MF 94 3/27/19
SP17-027 6/26/17 Roosevelt Park Apartments 467-12-001 21 N. 21st Street Central MF 80 2/6/19
PD17-027 12/14/17 Saratoga Ave Mixed Use 299-37-024 700 Saratoga Avenue West Valley MF 300 6/11/19
SP18-001 1/9/18 Garden Gate Tower 472-26-090 600 S. 1st Street Central MF 285 11/19/19
H18-026 6/7/18 S. Market Mixed Use 264-30-034 477 S. Market Street Central MF 130 5/1/19
PD18-015 6/19/18 Bascom Gateway Station 282-26-007 1330 S. Bascom Avenue Willow Glen MF 590 9/10/19

SP18-059 5/10/18 McEvoy Affordable Housing 261-38-004 699 W. San Carlos Central MF 365 2/11/20
SPA17-023-01 12/11/18 StarCity (Co-Living) 259-23-006 199 Bassett Street Central MF 800 5/29/19
CP18-022 6/26/18 Blossom Hill Affordable Apartments 690-25-021 397 Blossom Hill Road Edenvale MF 147 12/11/19
PD19-019 6/4/19 Winchester Ranch 303-38-001 555 S. Winchester Boulevard West Valley MF 688 1/14/20
Total 8,127
Projects Pending City Approval
PDA14-035-05 4/10/17 Communication Hill Village Center 455-28-017junction of Communications Hill Blvd. and the CalTrain railway to the
terminus of Communications Hill Blvd. and Casselino Drive.South MF 490
SP18-057 12/14/17 543 Lorraine Ave Mixed Use 259-47-069 543 Lorraine Avenue Central MF 70 ---
H18-025 6/5/18 Carlysle 259-35-033 51 Notre Dame Avenue Central MF 220 ---
SP18-033 6/28/18 Mitzi Place 299-16-001 4146 Mitzi Drive West Valley MF 50 ---
CP20-001 6/29/18 Silicon Sage 481-07-016 north side of Alum Rock Ave 220 feet westerly of Jose Figueres Avenue Alum Rock MF 792 ---
PD18-016 6/29/18 Little Portugal Gateway 481-12-069 1663 Alum Rock Avenue East San José MF 121 ---
H19-021 1/30/19 4th Street Housing 467-20-019 100 N. 4th Street Central MF 298 ---
PDA15-066-01 6/5/18 Santana Row Lot 12 277-40-017 385 Hatton Street West Valley MF 300 ---
H18-025 6/5/18 Carlysle 259-35-033 51 Notre Dame Avenue Central MF 290 ---
PD18-043 10/17/18 Race Street Housing 261-42-058 253 Race Street Central MF 206 ---
CP18-044 12/19/18 Affirmed housing 484-41-165 2348 Alum Rock Avenue Alum Rock MF 87 ---
SP19-064 2/19/19 Roem Affordable Housing 284-03-015 961 Meridian Avenue Willow Glen MF 230 ---
PDA14-035-06 4/2/19 Comm Hill Phase 3 455-28-017 0 Curtner Avenue South MF 798 ---
PD19-011 4/10/19 Meridian Mixed Use 274-14-152 259 Meridian Avenue Central MF 241 ---
SP20-004 4/29/19 W. San Carlos Mixed Use 277-18-019 1530 West San Carlos Central MF 173 ---
H19-019 5/6/19 Kelsey Ayer 259-20-015 447 North 1st Street Central MF 115 ---
PD19-020 6/13/19 Santa Clara University Mixed Use Housing230-14-004 1202 Campbell Avenue West Valley MF 290 ---
CP19-021 6/18/19 Bascom Residential Care 412-25-009 2375 South Bascom Avenue Willow Glen MF 138 ---
H19-028 6/20/19 750 W San Carlos 264-15-003 750 W. San Carlos Central MF 80 ---
SP19-067 8/30/19 1301 West San Carlos 261-42-059 1301 W. San Carlos Street Central MF 230 ---
H19-048 10/10/19 Virginia Studios 472-25-092 295 E. Virginia Street Central MF 347 ---
PD19-029 10/10/19 Google/ Downtown West 259-38-132 450 W. San Carlos Central MF 5,000 ---
H19-051 11/18/19 Eden Housing 264-26-088 425 Auzerais Avenue Central MF 130 ---
CP18-025 6/28/19 Union Assisted Living 421-20-010 0 Union Avenue Cambrian/Pioneer MF 152 ---
SP19-068 12/3/19 Hemlock Mixed Use Project 277-34-051 2881 Hemlock Avenue West Valley MF 51 ---
H19-054 12/18/19 Moorpark Supportive Housing 282-44-027 1710 Moorpark Avenue Willow Glen MF 108 ---
H20-001 1/3/20 Dahlia Apartments 467-11-021 1135 E. Santa Clara Street Central MF 91 ---
SP20-002 1/8/20 S. Winchester Mixed Use 299-25-038 1073 S. Winchester Boulevard West Valley MF 61 ---
H20-002 1/15/20 4th and Younger Apartments 235-09-020 1020 N. 4th Street Central MF 96 ---
Total 11,255
GRAND TOTAL 28,070
File Number Prefixes: PD= Planned Development Permit; SP= Special Use Permit; H= Site Development Permit; CP= Conditional Use Permit: HA, SPA, CPA, PDA = Amendment to Original Permit

File Number Filing Date Project NameTracking
APNAddress Planning Area
Square
Footage
(approx.)
Hotel
Guest
Rooms
Approval
Date
Projects Completed 2019-2020
H13-048 12/16/2013 Hampton Inn/Holiday Inn 237-17-067 2088 N. 1st Street North 173,000 284 9/3/16
HA14-006-01 1/22/2014 Hyatt Place/Hyatt House 101-05-002 82 Karina Court and 2105 N. 1st St. North 206,000 355 5/7/14
PD16-006 2/5/2016 Vespaio @ Diridon (Commercial) 259-28-004 130 Stockton Avenue Central 37,500 5/25/16
PD16-015 4/7/2016 Fairfield Inn & Suites 015-45-013 656 America Center Court Alviso 161,112 261 6/21/16
PD16-017 5/23/2016 Santana Row Commercial (Lot 9) 277-40-030 3060 Olsen Drive West Valley 30,000 11/9/16
PDA14-037-02 8/22/16 Wingate by Windham 458-17-032 5160 Cherry Avenue Cambrian/Pioneer 56,032 115 2/8/17
SP14-032 7/24/2014 Capitol Toyota 459-05-019 775 Capitol Ex Auto Mall South 261,286 1/28/15
Total 1,371,202 1,015
Projects Under Construction
HA06-027-02 6/10/2013 Valley Fair Expansion 274-43-035 2855 Stevens Creek Boulevard West Valley 525,000 10/30/13
PDA12-031-01 11/13/2015 The Platform Retail 241-04-011 north side of Berryessa Road on the southern
portion of the parcel just west of Union Pacific Berryessa 37,000 4/13/16
SP17-009 2/22/17 Miro Retail/Office 467-20-086 39 N. 5th Street Central 39,074 3/15/17
H15-023 5/4/2015 Holiday Inn Expansion 497-38-013 2660 Monterey Road South 48,100 81 7/13/16
CP16-029 6/16/16 Oakmont Residential Care 659-04-015 easterly side of San Felipe Road approximately
360 feet northerly of Fowler RoadEvergreen 91,714 4/26/17
PD16-025 8/16/16 The Capitol (Formerly Orchard) 254-06-042 641 N. Capitol Avenue Alum Rock 38,000 1/24/17
PD16-034 4/14/17 Topgolf 015-39-026 4701 N. 1st Street Alviso 182,000 200 12/13/17
CP17-046 10/26/17 Holden Assisted Living 282-11-014 1015 S. Bascom Avenue Willow Glen 156,022 9/12/18
H16-032 9/7/16 Hampton Inn 372-25-015 1090 S. De Anza Boulevard West Valley 51,279 90 8/14/18
H17-044 9/2/17 Hilton Garden Inn 235-03-002 111 E. Gish Road North 91,460 150 5/7/18
PD17-029 12/15/17 Julian/Stockton Mixed Use 261-01-030 715 W. Julian Street Central 26,571 10/23/18
PDA08-069-01 9/17/18 Market Park Shopping Center 254-17-084 1590 Berryessa Road Alum Rock 101,000 5/8/19
Total 1,570,098 755
Approved Projects (Construction Not Yet Commenced)
H16-010 2/29/2016 Cambria Hotel 277-34-014 2850 Stevens Creek Boulevard West Valley 173,043 175 12/7/16
PD08-001 1/7/2008 Pepper Lane Mixed Use 254-15-072 southeast corner of Berryessa and Jackson
AvenueAlum Rock 30,000 10/10/08
PD14-035 3/15/2013 Communications Hill 455-09-040
On the hills from the junction of Communications
Hill Blvd. and the CalTrain railway to the
terminus of Communications Hill Blvd. and
Casselino Drive. South 68,000 11/21/14
PD16-039 1/5/17 Creative Center for the Arts 249-39-044 bounded by N. Sixth Street, E. Taylor Street, N.
Seventh Street, and Jackson StreetCentral 60,000 10/11/17
CP17-047 10/20/17 Williams Rd Residential Care Facility 299-18-147 3924 Williams Road West Valley 31,801 11/14/18
H17-023 5/18/17 AC Hotel Stevens Creek Blvd 375-12-017 5696 Stevens Creek Boulevard West Valley 62,868 168 1/16/19
PDA15-013-02 8/9/18 Evergreen Circle Costco 670-29-024 2140 Quimby Road Evergreen 209,780 2/22/19
SP18-016 3/29/18 27 West (Retail Component) 259-40-043 27 South 1st Street Central 35,712 2/27/18
SP18-048 3/27/18 Hotel Baywood 277-34-038 375 South Baywood Avenue West Valley 123,120 105 2/27/18
Major Commercial Development Activity
Projects of 25,000+ Square Feet

CP17-052 11/17/17
Alum Rock Mixed Use (Retail
Component) 481-19-003 1936 Alum Rock Avenue Alum Rock 39,000 3/27/19
H18-002 1/9/18 Silver Creek Valley Rd Hotel 678-93-015 5952 Silver Creek Valley Road Edenvale 73,862 127 5/1/19
SP18-005 2/1/18 Bark Lane Hotel 372-24-033 7285 Bark Lane West Valley 45,306 126 6/4/19
H18-016 4/11/18 Piercy Hotel 678-93-040 469 Piercy Road Edenvale 119,333 175 5/29/19
H18-033 7/24/18 2nd Street Hotel 472-26-070 605 S. 2nd Street Central 90,263 106 10/2/19
PDA16-034-02 11/5/18 Shilla Stay Hotel 015-39-026 4701 N. 1st Street Alviso 109,991 200 6/19/19
PDA12-019-04 12/10/18 Coleman Hotel 1125 Coleman Avenue North 115,392 175 6/26/19
H18-038 8/28/18 Almaden Corner Hotel 259-35-055 8 N. Almaden Boulevard Central 153,275 272 1/14/20
Total 1,540,746 1,629
Projects Pending City Approval
H15-014 3/30/15 Tropicana Shopping Center Expansion 486-10-091 1664 Story Road Alum Rock 31,744 ---
H16-042 10/18/16 Tribute Hotel 259-42-079 211 S. 1st Street Central 186,426 279 ---
SP18-060 8/18/17 Stockton Ave Hotel 261-07-001 615 Stockton Avenue Central 34,698 54 ---
H17-059 10/28/17 Hotel Clariana Addition 467-23-088 10 S. 3rd Street Central 51,573 63 ---
SP18-008 1/30/18 Presentation High School Master Plan 446-38-035 2281 Plummer Avenue Willow Glen 106,248 ---
CP18-026 6/29/18 Sunset at Alum Rock 481-07-016 north side of Alum Rock Ave 220 feet westerly of
Jose Figueres AvenueAlum Rock 26,500 ---
CP18-034 9/4/18 995 Oakland Road Hotel 235-16-011 955 Oakland Road Central 67,766 116 ---
SP18-012 2/27/18 West San Carlos Hotel 277-20-035 1470 W. San Carlos Street Central 64,262 ---
PD18-010 3/14/18 Mercedes Dealership Expansion 296-38-012 4500 Stevens Creek Boulevard West Valley 171,351 ---
PD18-035 8/7/18 Stockton Ave Hotel 259-28-028 292 Stockton Avenue Central 356,470 ---
PD18-042 10/9/18 Oakland Road Comfort Suites 241-13-019 northeast corner of Oakland Road and Faulstich
Court
Berryessa 38,400 61 ---
H19-004 1/31/19 South Almaden Office (Retail) 264-28-023northwest corner of Almaden Boulevard and
Woz Way Central 65,000 ---
H19-047 10/8/19 Davidson Towers 259-31-071 255 W. Julian Street Central 23,402
CP19-031 10/10/19 Stevens Creek Fitness 303-25-016 3806 Stevens Creek boulevard Central 150,000
PD19-029 10/10/19 Google - Downtown West Mixed Use West of Downtown Central 500,000 800
Total 1,873,840 1,373
GRAND TOTAL 6,355,886 4,772
File Number Prefixes: PD= Planned Development Permit; SP= Special Use Permit; H= Site Development Permit; CP= Conditional Use Permit: HA, SPA, CPA, PDA = Amendment to Original Permit
File Number Filing Date Project NameTracking
APNAddress Planning Area
Square
Footage
(approx.)
Approval Date
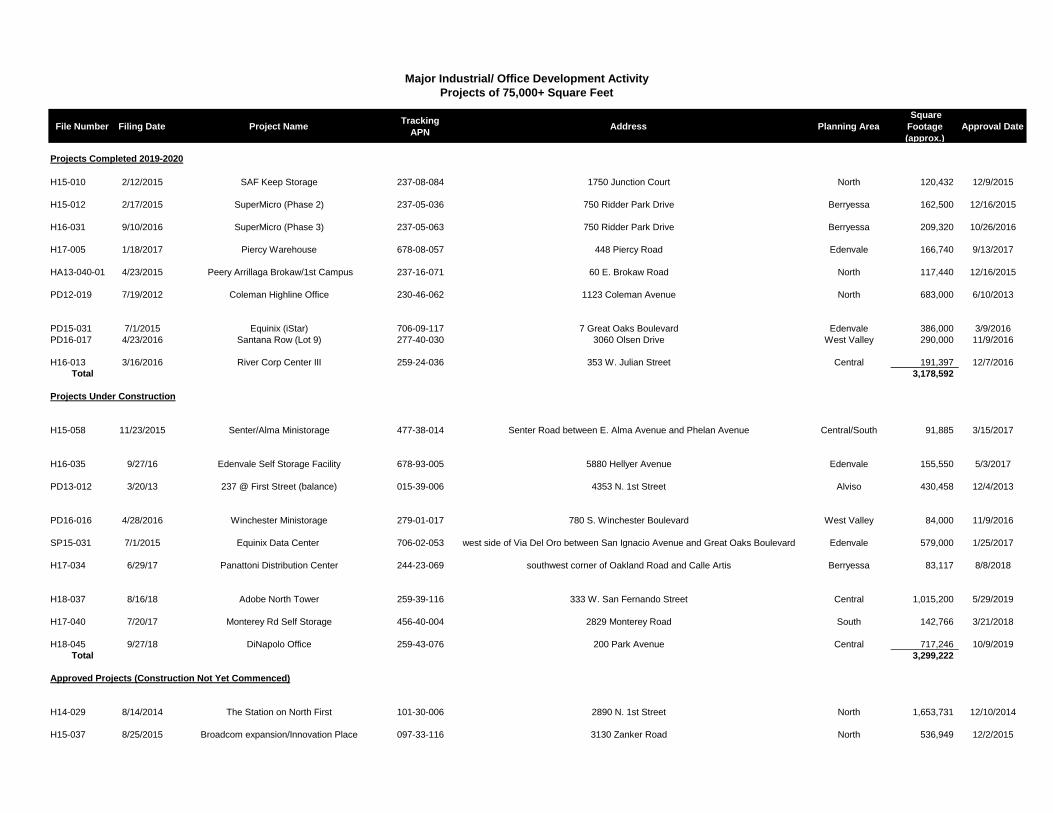
Projects Completed 2019-2020
H15-010 2/12/2015 SAF Keep Storage 237-08-084 1750 Junction Court North 120,432 12/9/2015
H15-012 2/17/2015 SuperMicro (Phase 2) 237-05-036 750 Ridder Park Drive Berryessa 162,500 12/16/2015
H16-031 9/10/2016 SuperMicro (Phase 3) 237-05-063 750 Ridder Park Drive Berryessa 209,320 10/26/2016
H17-005 1/18/2017 Piercy Warehouse 678-08-057 448 Piercy Road Edenvale 166,740 9/13/2017
HA13-040-01 4/23/2015 Peery Arrillaga Brokaw/1st Campus 237-16-071 60 E. Brokaw Road North 117,440 12/16/2015
PD12-019 7/19/2012 Coleman Highline Office 230-46-062 1123 Coleman Avenue North 683,000 6/10/2013
PD15-031 7/1/2015 Equinix (iStar) 706-09-117 7 Great Oaks Boulevard Edenvale 386,000 3/9/2016
PD16-017 4/23/2016 Santana Row (Lot 9) 277-40-030 3060 Olsen Drive West Valley 290,000 11/9/2016
H16-013 3/16/2016 River Corp Center III 259-24-036 353 W. Julian Street Central 191,397 12/7/2016
Total 3,178,592
Projects Under Construction
H15-058 11/23/2015 Senter/Alma Ministorage 477-38-014 Senter Road between E. Alma Avenue and Phelan Avenue Central/South 91,885 3/15/2017
H16-035 9/27/16 Edenvale Self Storage Facility 678-93-005 5880 Hellyer Avenue Edenvale 155,550 5/3/2017
PD13-012 3/20/13 237 @ First Street (balance) 015-39-006 4353 N. 1st Street Alviso 430,458 12/4/2013
PD16-016 4/28/2016 Winchester Ministorage 279-01-017 780 S. Winchester Boulevard West Valley 84,000 11/9/2016
SP15-031 7/1/2015 Equinix Data Center 706-02-053 west side of Via Del Oro between San Ignacio Avenue and Great Oaks Boulevard Edenvale 579,000 1/25/2017
H17-034 6/29/17 Panattoni Distribution Center 244-23-069 southwest corner of Oakland Road and Calle Artis Berryessa 83,117 8/8/2018
H18-037 8/16/18 Adobe North Tower 259-39-116 333 W. San Fernando Street Central 1,015,200 5/29/2019
H17-040 7/20/17 Monterey Rd Self Storage 456-40-004 2829 Monterey Road South 142,766 3/21/2018
H18-045 9/27/18 DiNapolo Office 259-43-076 200 Park Avenue Central 717,246 10/9/2019
Total 3,299,222
Approved Projects (Construction Not Yet Commenced)
H14-029 8/14/2014 The Station on North First 101-30-006 2890 N. 1st Street North 1,653,731 12/10/2014
H15-037 8/25/2015 Broadcom expansion/Innovation Place 097-33-116 3130 Zanker Road North 536,949 12/2/2015
Major Industrial/ Office Development Activity
Projects of 75,000+ Square Feet

File Number Filing Date Project NameTracking
APNAddress Planning Area
Square
Footage
(approx.)
Approval Date
Major Industrial/ Office Development Activity
Projects of 75,000+ Square Feet
H16-018 4/27/2016 335 West San Fernando St 259-39-116 333 W. San Fernando Street Central 700,000 11/9/2016
PD15-053 10/29/2015 America Center (balance) 015-45-047 northwest corner of State Highway 237 and Gold Street Alviso 192,350 1/23/2018
PD15-061 12/4/2015 Diridon TOD (Office) 259-38-036 402 W. Santa Clara Street Central 1,040,000 5/24/2016
PD15-062 12/9/2015 Bay 101 Technology Place office (Phase II) 235-01-020 1740 N. 1st Street North 234,192 12/7/2016
PD16-023 7/22/16 Samaritian Medical Phase 1 421-37-001 north of Samaritan Drive, approximately 700 feet east of S. Bascom Drive Cambrian/Pioneer 350,000 8/2/2017
PD16-037 11/29/16 Self-storage (King Rd) 670-12-006 2905 South King Road Evergreen 198,000 4/12/2017
SP16-053 11/4/16 Microsoft data center/industrial 015-31-054 1657 Alviso-Milpitas Road Alviso 426,093 10/24/2017
SP18-020 12/15/17 Akatiff/Platform 16 259-29-104 440 W. Julian Street Central 982,128 5/30/2018
H17-041 7/21/17 Knox Trojan Storage 481-39-003 1025 Knox Avenue Alum Rock 139,615 2/28/2018
PD16-027 8/29/16 Oakland Rd Self Storage 235-18-001 645 Horning Street Central 91,875 5/8/2018
PDA14-005-10 5/3/18 Western Digital Great Oaks Campus 706-07-020 5601 Great Oaks Parkway Edenvale 73,400 11/14/2018
PD17-014 4/25/17 Stevens Creek Promenade (Office) 296-38-013 4360 Stevens Creek Boulevard West Valley 233,000 2/26/2019
H18-024 5/31/18 Winfield Self Storage 694-06-009 5775 Winfield Boulevard Edenvale 109,527 9/4/2019
H18-027 6/12/18 2829 Monterey Distribution 456-40-004 2829 Monterey Road South 81,100 6/12/2019
PD18-015 6/19/18 South Bascom Gateway Station 282-26-007 1330 S. Bascom Avenue Willow Glen 213,500 9/10/2019
H17-058 11/2/17 970 McLaughlin Industrial 472-10-109 970 Mclaughlin Avenue Central 223,717 3/13/2019
SP18-054 10/3/18 San Ignacio Data and Office 706-09-023 6320 San Ignacio Avenue Edenvale 282,000 3/27/2019
PD18-045 10/26/18 Santana West Phase 1 303-40-010 3161 Olsen Drive West Valley 850,000 5/29/2019
PD18-039 9/12/18 Cloud 10 Skyport Plaza 230-29-117 1601 Technology Drive North 350,000 12/23/2019
Total 8,961,177
Projects Pending City Approval
H18-018 4/30/18 475 Tully Road Mini Storage 477-51-004 475 Tully Road South 219,282 ---
SP18-049 9/5/18 335 Winchester Office 303-39-047 335 S. Winchester Boulevard West Valley 94,996 ---
PD19-029 10/10/19 Google - Downtown West Mixed-Use Plan (Office) Central 7,300,000
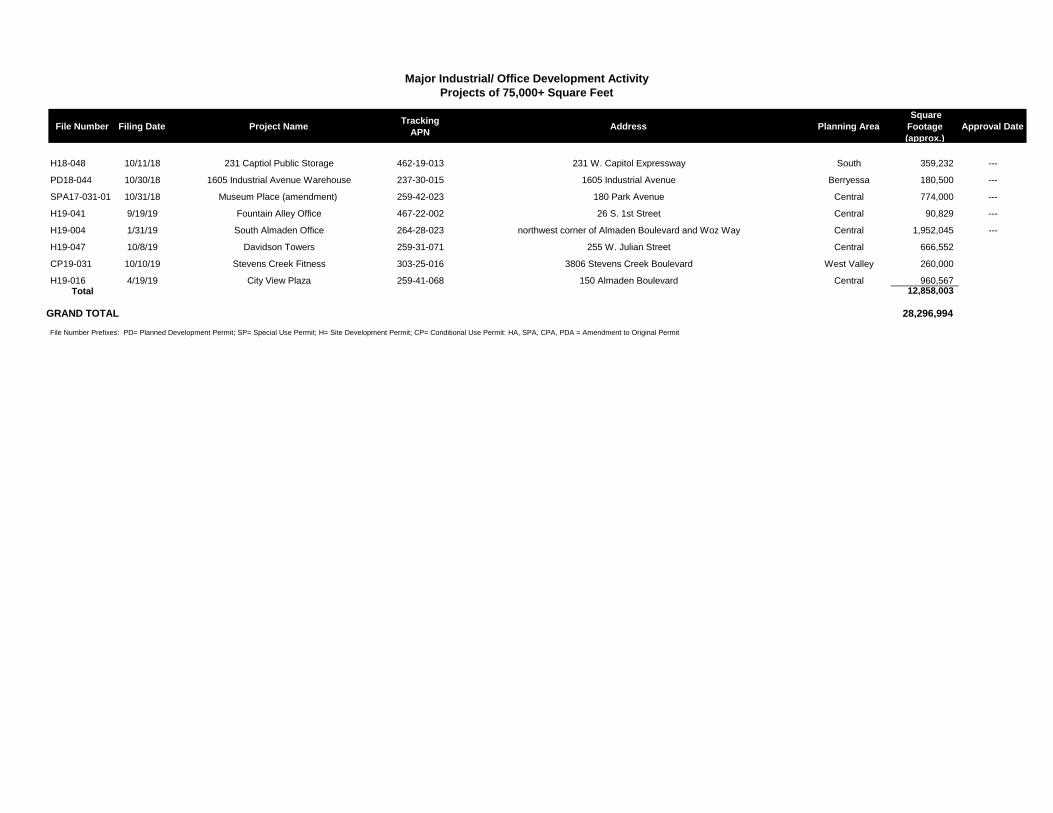
File Number Filing Date Project NameTracking
APNAddress Planning Area
Square
Footage
(approx.)
Approval Date
Major Industrial/ Office Development Activity
Projects of 75,000+ Square Feet
H18-048 10/11/18 231 Captiol Public Storage 462-19-013 231 W. Capitol Expressway South 359,232 ---
PD18-044 10/30/18 1605 Industrial Avenue Warehouse 237-30-015 1605 Industrial Avenue Berryessa 180,500 ---
SPA17-031-01 10/31/18 Museum Place (amendment) 259-42-023 180 Park Avenue Central 774,000 ---
H19-041 9/19/19 Fountain Alley Office 467-22-002 26 S. 1st Street Central 90,829 ---
H19-004 1/31/19 South Almaden Office 264-28-023 northwest corner of Almaden Boulevard and Woz Way Central 1,952,045 ---
H19-047 10/8/19 Davidson Towers 259-31-071 255 W. Julian Street Central 666,552
CP19-031 10/10/19 Stevens Creek Fitness 303-25-016 3806 Stevens Creek Boulevard West Valley 260,000
H19-016 4/19/19 City View Plaza 259-41-068 150 Almaden Boulevard Central 960,567 Total 12,858,003
GRAND TOTAL 28,296,994
File Number Prefixes: PD= Planned Development Permit; SP= Special Use Permit; H= Site Development Permit; CP= Conditional Use Permit: HA, SPA, CPA, PDA = Amendment to Original Permit

VI. MAJOR DEVELOPMENT ACTIVITY MAPS (PLANNING AREAS)
San Jose is divided into a total of fifteen (15) planning areas (see Figure 1, below). The
individual planning area maps that follow include projects in all status categories.
These maps can be used in conjunction with the data contained in Section V of this
report to allow closer analysis of the rate, type, and location of major development
activity in the City. (Note: map exhibits are not provided for the Calero and San Felipe
planning areas, as no major development activity occurred there and/or these areas are
outside the City’s Urban Service Area and Urban Growth Boundary).
Figure 1: San Jose Planning Areas
15
E JU
LIAN
ST
MURILLOAV
E SANTA
CLARA ST
TULLY RD
E TAYLO
RST
LUNDYAV
101
E SAN ANTONIO ST
K IRK AV
SCAPITO
LAV
MCKEE RD
RU
BY AV
ALUM ROCKAV
STORY RD S WHITE RD
MARTEN AV
ADRIAN WY
CLAYTO N RD
MT PLEASANT RD
TOYO
N AVCAPITOL EX
S JACKSON AV
FLEMING AV
ECAPITOL
EX
N KING RD
OCALA AVN CAPITOL AV
MT HAMILT ONRD
N WHITE RD
N JACKSONAV
MABURY RD
S KING RD
680
4
3
1 2
6
7
1
2
34
5
61
Alum Rock Planning AreaMajor Development Activity
Residential Projects
Industrial Projects
Commercial Projects1. Pepper Lane Mixed Use2, The Orchard (Commercial)3. Alum Rock Mixed Use (Retail)4. Tropicana Shopping Center Expansion5. Sunset at Alum Rock6. Market Park Shopping Center
Total Commercial Square Feet = 266,224
1. King & Dobbin Transit Vilage Lot E2. King & Dobbin Transit Village Lot G3. The Orchard (Residential)4. Alum Rock Mixed Use5. Silicon Sage6. Affirmed Housing7. Little Portugal Gateway
Total Dwelling Units = 1,450
1. Knox Trojan Storage
Total Industrial Square Feet = 139,615
Status
CompletedCompleted
Under ConstructionApproved
PendingPendingPending
Status
ApprovedUnder Construction
ApprovedPendingPending
Under Construction
Status
Approved
16

TAYLORST
ZAN
KE
RR
D
N1STST
237
GO
LDST
ZAN
KE
R R
D
LOS ESTE ROS RD
1 2 & 3
3
2
1
Alviso Planning AreaMajor Development Activity
Industrial ProjectsCommercial Projects
1. Fairfield Inn & Suites2. Top Golf3. Shilla Stay Hotel
Total Commercial Square Feet = 453,103
1. America Center2. Microsoft Data Center3. 237 @ First Street
Total Industrial Square Feet = 1,048,901
Status
CompletedUnder Construction
Approved
Status
ApprovedApproved
Under Construction
17
101
N CAPITOL AV
LANDESS
AV
880
BERRYESSA RD
MABURYRD
OLD BAYSHORE HY
E B ROKAW RD
MCKAY DR
MURPHY AV
MONTAGUE EX
COMMERCIAL ST
TRADE ZONE BL
FLICKINGER AV
HOSTETTER RD
SIERRA RDSUNCREST AV
CROPLEY AV
MORRILL
AV
680
LUNDYAV
PIEDMONT
RD
OA
KLANDRD
1122
3
2
4
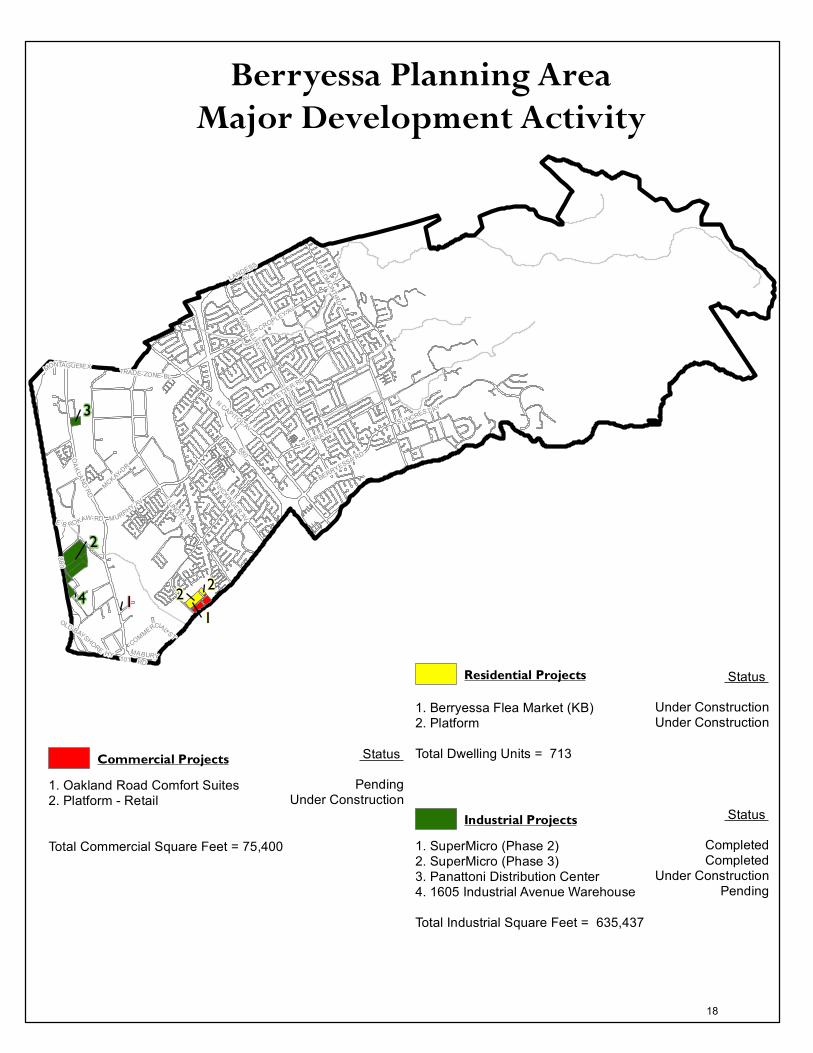
Berryessa Planning AreaMajor Development Activity
Residential Projects
Industrial Projects
Commercial Projects
1 Berryessa Crossing (Phase 1)2 Berryessa Crossing (Phase 2)3 Berryessa Flea Market (Apt)4 Berryessa Flea Market (KB)5 Centered on Capitol Townhomes6 Orchard Park
Total Dwelling Units = 1,783
1. Oakland Road Comfort Suites2. Platform - Retail
Total Commercial Square Feet = 75,400
1. Berryessa Flea Market (KB)2. Platform
Total Dwelling Units = 713
1. SuperMicro (Phase 2)2. SuperMicro (Phase 3)3. Panattoni Distribution Center4. 1605 Industrial Avenue Warehouse
Total Industrial Square Feet = 635,437
Status
PendingUnder Construction
Status
CompletedCompleted
Under ConstructionPending
Status
Under ConstructionUnder Construction
18
BRANHAM LN
HILLSDALE
AV
CHYNOWETHAV
BLOSSOM HILL RD
CLO
VERC
REST D
R
WAY
LAN
D
AV
S BA
SCOMAV
SA
NC
HEZ
DR
LOSGATOS-ALMADEN RD
HAR
WO
OD
RD
KOOSER RD
SAMARITAN DR UN
ION
AV
CH
ERR
YAV
L EIG
HAV
ALM
ADE
NEX
MERIDIANAV
CAMDEN
AV
85
1
1
1
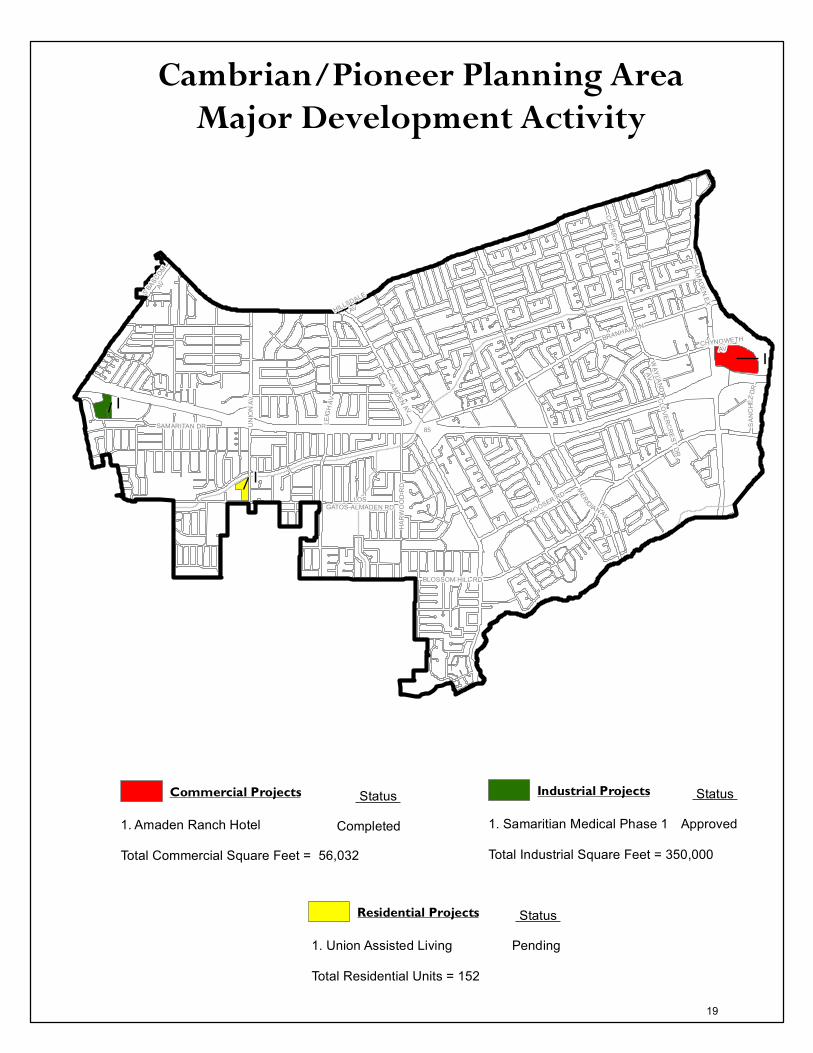
Cambrian/Pioneer Planning AreaMajor Development Activity
Industrial Projects
Residential Projects
Commercial Projects
1. Samaritian Medical Phase 1
Total Industrial Square Feet = 350,000
1. Amaden Ranch Hotel
Total Commercial Square Feet = 56,032
Status
Approved
Status
Completed
1. Union Assisted Living
Total Residential Units = 152
Status
Pending
19
2
1833
1
3
4
5
6
7
8
910
11
12
1314
15
16
17
19
20 2122
2324
25
26
2728
29
30
31
3234
3536
37 38
39
4041
42
43
44
45
46
47
484950
51
5253
5455
56
57
58
GRANT
ST
S 2ND STS 3RD ST
S 10TH ST
S 11TH ST
S 7TH ST
880
W HEDDING ST
WILLOW
ST
E SAN
ANTONIO ST
LINCOLN
AV
BIRD AV
S 1ST ST
17
N 2ND ST
COLEMAN AV
STORY RD
E REED ST
101
MCLAUGHLIN AV
MONTEREY
RDSOUTHW EST
EX
NS
AN
PEDRO
ST
ALM
ADE
NEX
SENTER
N 3RD ST
N 4TH ST
HANCHETT AV
680
FOREST AV
N 1ST ST
E WILLIAM ST
S BA
SCO
M A
V
LEIG
H A
V
N 10TH ST
STEVENSCREEK BL
W VIRGINIA ST
SHASTAAV
RAC
E ST
KEYES ST
E SAN
FERNANDO ST
S 4TH ST
MER
IDIA
NAV
E ALMA AV
W ALMA AV
NBASCO
MAV
VINE ST
ALMADEN AV
NAGLEE AV
E ST JAMES ST
E HEDDING ST
W TAYLOR ST
N 13TH ST
N 17TH ST
E TAYLOR ST
THE ALAMEDA
E JULIAN ST
E SANTA
CLARA ST
280
PA RK AV
87
W SAN CARLOS ST
2
5715 2
13
14
1
345
6
7
8
9 10
11
12
13
4
6
8
910
11
12
13
14
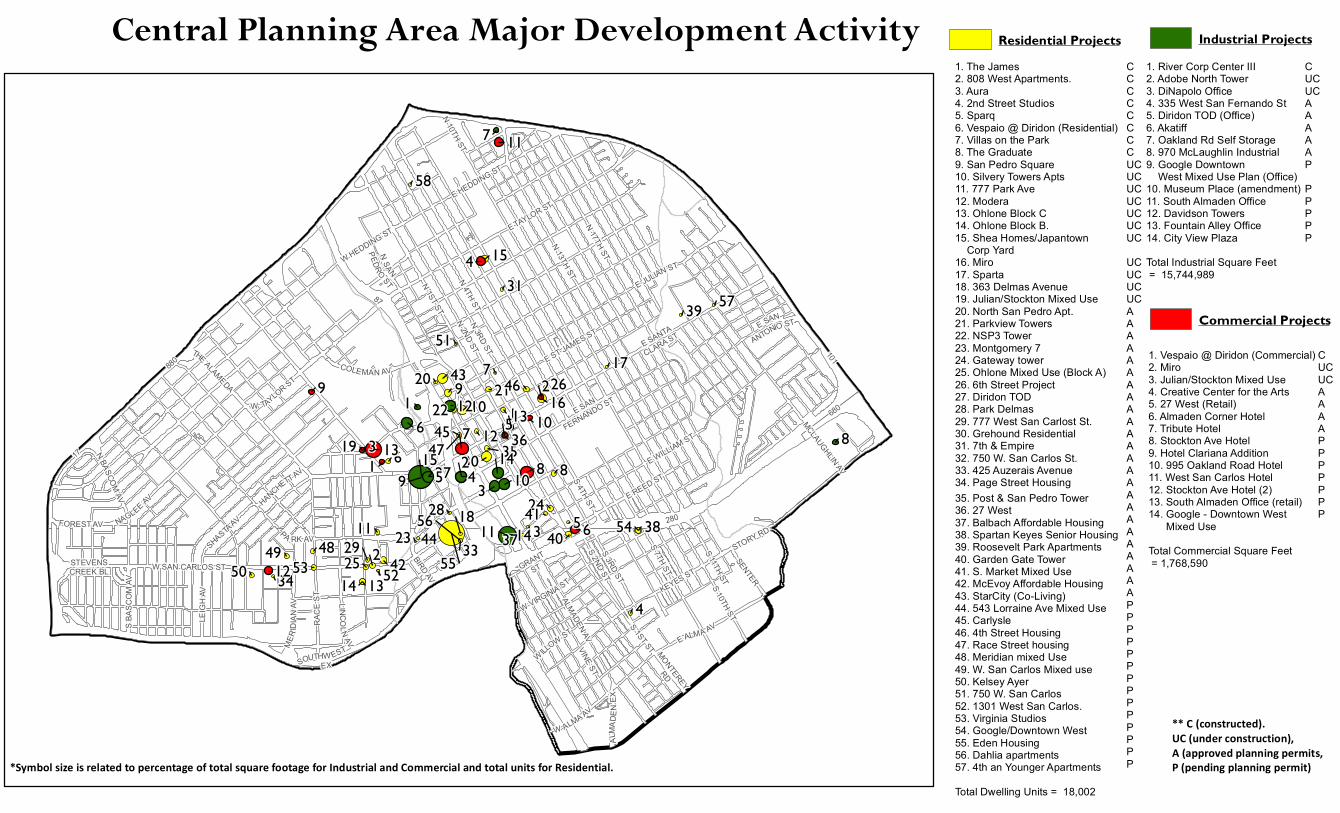
Central Planning Area Major Development Activity Residential Projects Industrial Projects
Commercial Projects
1. Vespaio @ Diridon (Commercial)2. Miro3. Julian/Stockton Mixed Use4. Creative Center for the Arts5. 27 West (Retail)6. Almaden Corner Hotel7. Tribute Hotel8. Stockton Ave Hotel9. Hotel Clariana Addition10. 995 Oakland Road Hotel 11. West San Carlos Hotel12. Stockton Ave Hotel (2)13. South Almaden Office (retail)14. Google - Downtown West Mixed Use
Total Commercial Square Feet = 1,768,590
35. Post & San Pedro Tower36. 27 West37. Balbach Affordable Housing38. Spartan Keyes Senior Housing39. Roosevelt Park Apartments40. Garden Gate Tower41. S. Market Mixed Use42. McEvoy Affordable Housing43. StarCity (Co-Living)44. 543 Lorraine Ave Mixed Use45. Carlysle46. 4th Street Housing47. Race Street housing48. Meridian mixed Use49. W. San Carlos Mixed use50. Kelsey Ayer51. 750 W. San Carlos52. 1301 West San Carlos. 53. Virginia Studios54. Google/Downtown West 55. Eden Housing56. Dahlia apartments57. 4th an Younger Apartments
Total Dwelling Units = 18,002
1. The James2. 808 West Apartments. 3. Aura 4. 2nd Street Studios5. Sparq6. Vespaio @ Diridon (Residential)7. Villas on the Park8. The Graduate9. San Pedro Square10. Silvery Towers Apts11. 777 Park Ave12. Modera13. Ohlone Block C14. Ohlone Block B. 15. Shea Homes/Japantown Corp Yard16. Miro17. Sparta18. 363 Delmas Avenue19. Julian/Stockton Mixed Use20. North San Pedro Apt. 21. Parkview Towers22. NSP3 Tower23. Montgomery 724. Gateway tower25. Ohlone Mixed Use (Block A) 26. 6th Street Project27. Diridon TOD28. Park Delmas29. 777 West San Carlost St. 30. Grehound Residential 31. 7th & Empire32. 750 W. San Carlos St. 33. 425 Auzerais Avenue34. Page Street Housing
1. River Corp Center III2. Adobe North Tower3. DiNapolo Office4. 335 West San Fernando St5. Diridon TOD (Office) 6. Akatiff7. Oakland Rd Self Storage8. 970 McLaughlin Industrial9. Google Downtown West Mixed Use Plan (Office)10. Museum Place (amendment)11. South Almaden Office12. Davidson Towers13. Fountain Alley Office 14. City View Plaza
Total Industrial Square Feet = 15,744,989
** C (constructed). UC (under construction), A (approved planning permits,P (pending planning permit)
CCCCCCCCUCUCUCUCUCUCUC
UCUCUCUCAAAAAAAAAAAAAAAAAAAAAAAAPPPPPPPPPPPPPP
CUCUCAAAAAP
PPPPP
CUCUCAAAAPPPPPPP
*Symbol size is related to percentage of total square footage for Industrial and Commercial and total units for Residential.

SNELLAV
METCALF
RD
SENTERRD
VISTAPARK
DR
CAH
ALAN
AV
STEINBECKDR
COLE M AN RD
ALLE
NAV
MANASS
ASRD
EMBEDDE D WY
SANIGNACIO AV
SKY W
AY
DR
ENDI COTT BL
ED
EN
VALE
AV
SIL
ICO
NV
ALL
EYBL
BERNAL RD
BE
SW
IC
KDR
LEANAV
RO
ED
ER
RD
CO
TTL
E R
D
VI S
TAPA
RK
DR
CHYNOWETH AV
CAH
ALAN
AV
CO
TTL
E R
D
HE
LLYER AV
CHYNOWETH AV
GRE AT
OAK SBL
COYOTER
D
BRANHAM LANE EAST
WIN
FIE
LDB
L CHYNOWETH AV
BER
NA
LR
D
PEARL AV
SN
ELL
AV
SILVE
RCREEK
VA
LLEY RD
87
BLO
SSO
MAV
LEAN
A V
HELLYER AV
CALERO AV
SNELLAV
BRANHAM LN
BLOSSOM HILL RD
101
85
MONTEREY RD
SANTA TERESA BL
3
21 1
3
2
1
5
64
7
21
Edenvale Planning AreaMajor Development Activity
Residential Projects
Industrial Projects
Commercial Projects1. Silver Creek Valley Road Hotel2. Piercy Hotel
Total Commercial Square Feet = 193,195
1. Piercy Warehouse2. Equinix( iStar)3. Edenvale Self Storage Facility4. Equinix Data Center5. Winfield Self Storage6. San Ignacio Data and Office7. Western Digital Great Oaks Campus
Total Industrial Square Feet = 1,752,217
1. South Village (Hitachi)2. Istar/Great Oaks3. Blossom Hill Affordable Apartments
Total Dwelling Units = 531
Status
CompletedCompleted
Under ConstructionUnder Construction
ApprovedApprovedApproved
Status
Under ConstructionUnder Construction
Approved
Status
ApprovedApproved
21

TULLY RD
101
NIEMANBL
DELTA RD
YERBA BUENA RD
SILVER
CREEKRD
FARNSWORTHDR
S KING RD
SAN FELIPE RD
SW
HITERD
RUBY AV
SILVE
RC
REEKVALLEY RD
MURILLO AV
ABORN RD
EC
AP
ITO
LE
X
QUIMBY RD
1
2
1
1
Evergreen Planning AreaMajor Development Activity
Residential Projects
Industrial ProjectsCommercial Projects
1. Oakmond Residential Care2. Evergreen Circle Costco
Total Commercial Square Feet = 301,494
1. Self-storage (King Rd)
Total Industrial Square Feet = 198,000
1. Arcadia/Evergreen part 1.
Total dwelling units = 250
Status
Under Construction
Status
Approved
Status
Under ConstructionApproved
22

ZANKER RD
237
OLD BAYSHORE HY
DE L
ACR
UZ B
L
E PLUMERIA DR
W MONTAGUE EX
880
RIVER
OAKS PY
AIRPORT BL
SKYPORT DR
AIRPORT P
Y
ORCHARD PY
E TRIM
BLE R
D
N 4TH ST
O'TOOLE AV
COLEMAN AV
W TASMAN DR
E BROKAW RDW TRIMBLE RD
E TASMAN DR
CHARCOT AV
87
MONTAGUE EX
101
N 1ST ST
4
21
3
4
6
2
5
7
1
5
North Planning AreaMajor Development Activity
Industrial Projects
Commercial Projects1. Hampton Inn/Holiday Inn2. Hyatt Place3. Hilton Garden Inn4. Coleman Hotel
Total Commercial Square Feet = 585,852
1. SAF Keep Storage2. Peery Arrillaga Brokaw/1st Campus3. Coleman Highline Office4. The Station on N. 1st5. Broadcom Expansion/ Innovation Place6. Bay 101 Casino & Mixed Use (Phase II)7. Cloud 10 Skyport Plaza
Total Industrial Square Feet = 3,695,744
Status
CompletedCompletedCompleted
ApprovedApprovedApproved
Pending
Status
CompletedCompleted
Under ConstructionApproved
23

7
2
3
1
4
ALMA
STORY
CAPITOL
LITTLE
ORCHARD
101
OLD
TULLY
SYLVANDALE
FOXW ORTHY
BARNARD
SNELL
COM
MU NICATIONS
HIL L
VI STAPARK
ALM
AD
EN
LITTLE ORCHARD
PHELAN
COYOTE
UMBARGER
YERBA BUENA
ALM
ADE
N
HELLYER
SENTER
7TH
10TH
HILLSDALE
CURTNER
ALMADEN
LUCRETIA
TULLY
CAPITOL
87
SENTER
MONTEREY
MCLAUGHLIN
3
1
2
36
5
8
14
2
9 6
South Planning AreaMajor Development Activity
Residential Projects
Industrial Projects
Commercial Projects1. Capitol Toyota2. Holiday Inn3. Communication Hill
Total Commercial Square Feet = 377,386
1. Scotia Apartments2. Renascent Place3. Murano at Montecito Vista4. 1807 Almaden Rd5 Communication Hill (Phase 1)6. Vicenza at Montecito Vista7. Communication Hill (Phase 2)8. Comm Hill Village Center9. Communication Hill (Phase 3)
Total Dwelling Units = 2,6631. Monterey Rd Self Storage2. 2829 Monterey Distribution3. 475 Tully Road Mini Storage4. 231 Capitol Public Storage
Total Industrial Square Feet = 443,148
Status
ConstructedConstructed
Under ConstructionUnder ConstructionUnder ConstructionUnder ConstructionUnder ConstructionUnder Construction
Pending
Status
ConstructedUnder Construction
Approved
Status
Under ConstructionApproved
PendingPending
24

SB
LANE
YAV
STEVENSCREEK BL
PARK AV
QU
ITO
RD W C
AMPBELL AV
880
FE
NIA
ND
R
NBAS
COM
AV
17THEALAMEDA
SK
IE
LY BL
S D
E A
NZA
BL
W HEDDING ST
85
WESTMONT AV
DOYLE RD SANTOM
AS
AQ
UIN
OR
D
JOH
NSO
N A
V
HAMILTON AV
N M
ON
RO
E S
T
MIL
LER
AV
RAINBOW DRPAYNE AV
SA
NTO
MA
SEX
S W
INC
HES
TER
BL
LAW
REN
CE
EX
BOLLINGER RD
WILLIAMS RD
SARATOGA AV
MOORPARK AV280
7
6
5
48
11
9
4
1
9
8
6
3752
43
2
15
West Valley Planning AreaMajor Development Activity
Residential Projects
Industrial Projects
Commercial Projects1. Valley Fair Expansion2. Santana Row Commercial (Lot 9)3. Boutique Hotel4. Williams Rd Residential Care Facility5. Hotel Baywood6. Hampton Inn (De Anza Blvd)7. AC Hotel Stevens Creek Blvd8. Holiday Inn Express & Suites (Bark Ln)9. Mercedes Dealership Expansion
Total Commercial Square Feet = 1,253,178
1. Volar (Residential)2. Santana Row Lot 173. Santana Row Lot 124. The Reserve5. Stevens Creek Lopina Signature Project6. Saratoga Ave Mixed Use7. Mitzi Place8. Winchester Ranch9. Santa Clara University Mixed Use Housing10. Hemlock Mixed Use11. S. Winchester Mixed Use
Total Dwelling Units = 3,577
1. Santana Row (Lot 9)2. Winchester Ministorage3. 335 Winchester Office4. Santana West Phase 15. Stevens Creek Promenade
Total Industrial Square Feet = 1,551,996
Status
CompletedUnder Construction
PendingApprovedApproved
Status
Under ConstructionCompleted
ApprovedApprovedApproved
Under ConstructionApprovedApproved
Pending
Status
ApprovedApprovedApproved
Under ConstructionApprovedApproved
PendingApproved
PendingPendingPending
25
FOXWORTHY AV
N L
EIG
HAV
S LE
IGH
AV
CAMDENAV
FRUITDALE AV
HILLSDALE
AV
280
PINE AV
W ALMA AV
17
SOUTHW
EST EX
MINNESOTA AV
HAMILTON AV
RAC
E S
T
PEDRO ST COE AV
W VIRGINIA ST
BIRD
AV
CURTNER AV
87
UN
ION
AV
MOORPARK AV
ALM
ADE
NEX
CHERRY AV
S BA
SC
OM
AV
LEIG
HA
V
WILLOW ST
LINCOLN AV
MERIDIAN AV
1
2
1 1
2
3
4
5
Willow Glen Planning AreaMajor Development Activity
Residential ProjectsIndustrial Projects
Commercial Projects1. Holden Assisted Living on Bascom 2. Presentation High School Master Plan
Total Commercial Square Feet = 262,270
1. Leigh Ave Apartments2. Bascom Gateway Station3. Bascom Residential Care4. Moorpark Supportive Housing5. Roem Affordable Housing
Total Dwelling Units = 1,130
1. South Bascom Gateway Station*
Total Industrial Square Feet = 213,500
Status
Approved
Status
Under ConstructionPending
Status
Under ConstructionApproved
PendingPendingPending
26

VII. APPENDIX: SOURCES
The Department of Planning, Building and Code Enforcement utilized a variety of
information sources in the preparation of this report. These sources are described
below.
Data Collection and Analysis
The Department’s development project database was the primary initial resource for
information on applications submitted to the City. Spreadsheets and Geographic
Information Systems (GIS) were also used to manage and display this empirical
information in a more readily comprehended format. Architectural drawings, aerial
photographs, and fieldwork were also used to evaluate site-specific issues that could
have affected the anticipated cost or timing of a project’s construction.
Planning staff conducted and/or participated in a series of interviews/discussions with
people with a variety of perspectives, including City staff processing development
applications, developers or their representatives, and others working in the
development industry or related fields.
Review of Publications
Planning staff consulted several publications that made contributions to the preparation
of this report, including: the Yardi Matrix Multi-family San José Report – Winter 2020,
Colliers Silicon Valley 2019 Q4, 2019 Market Forecast Reports, and Cushman &
Wakefield’s Marketbeat reports.
27