chapter 2 1999 study sponsored by the city of chicago on ... a survey of 4,700 downtown shoppers...
TRANSCRIPT
20
CHAPTER 2 Physical & Economic Assessment
DRAFTFinal ReportJune 2003
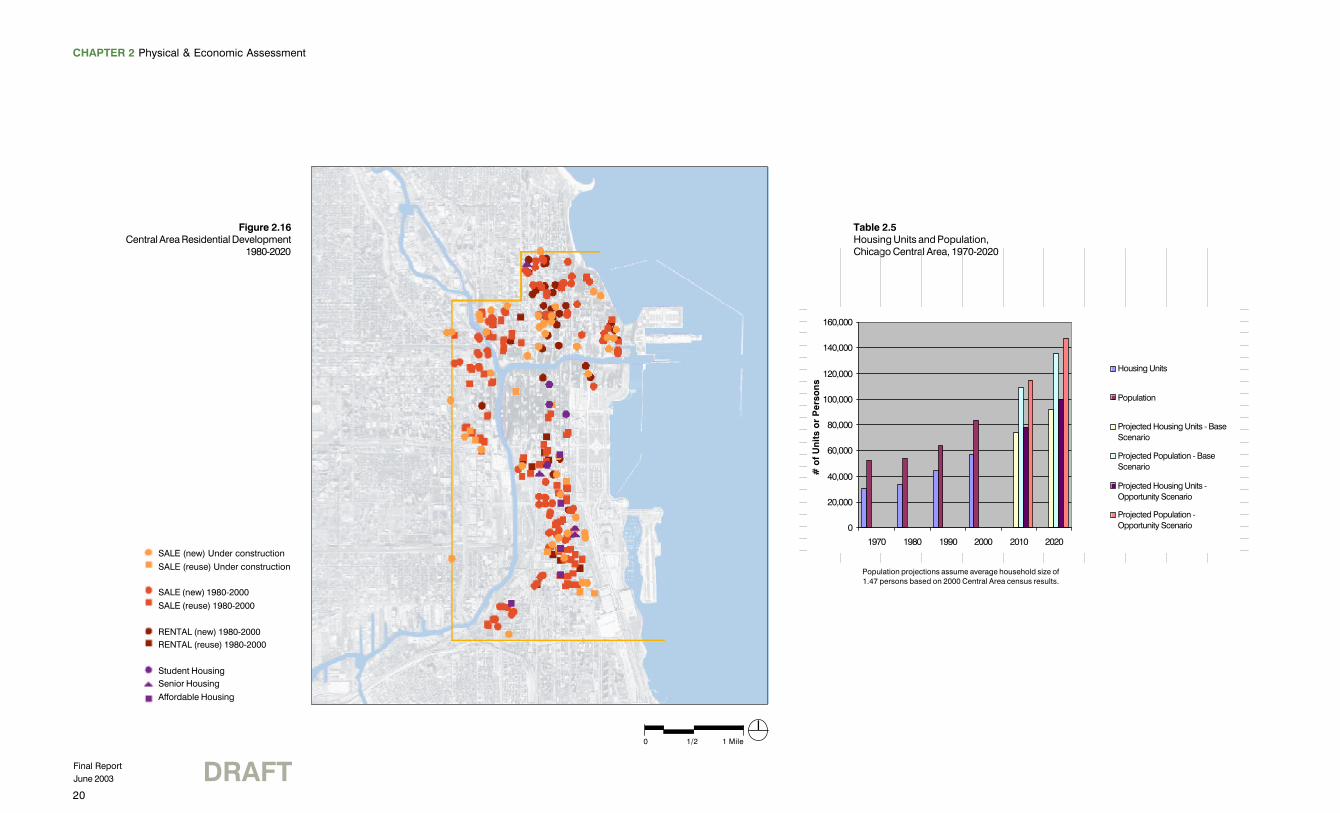
Population projections assume average household size of 1.47 persons based on 2000 Central Area census results.
Table 2.5Housing Units and Population,Chicago Central Area, 1970-2020
Figure 2.16Central Area Residential Development
1980-2020
SALE (new) Under constructionSALE (reuse) Under construction
SALE (new) 1980-2000SALE (reuse) 1980-2000
RENTAL (new) 1980-2000RENTAL (reuse) 1980-2000
Student HousingSenior HousingAffordable Housing
0 1/2 1 Mile
0
20,000
40,000
60,000
80,000
100,000
120,000
140,000
160,000
1970 1980 1990 2000 2010 2020
# o
f Uni
ts o
r P
erso
ns
Housing Units
Population
Projected Housing Units - BaseScenario
Projected Population - BaseScenario
Projected Housing Units -Opportunity Scenario
Projected Population -Opportunity Scenario

21
CHAPTER 2 Physical & Economic Assessment
CHICAGO CENTRAL AREA PLAN DRAFT Final ReportJune 2003
A Quality Place to Live:The Residential Sector
DRAMATIC RESIDENTIAL GROWTHThe surge in the Central Area residential market was one of the most remarkable development trends ofthe 1990’s. Between 1990 and 2000 downtown Chicago had one of the highest residential growth ratesof any major U.S. city. It now ranks fourth in downtown population behind New York, Boston, andPhiladelphia, and at the current rate of increase will rank second within a few years.
More than 32,000 dwellings were constructed in the Central Area between 1980 and 2000, for a netincrease (less demolitions) of 23,000 units. The residential population increased 56% and currentlyexceeds 83,000. The pace of development continues, with 15,000 units added between 2000 and 2002.
In the 1980’s, about four out of five new units were rental, many in large-scale developments financedwith federal or state assistance. Presidential Towers alone had nearly 2,500 units. In the 1990’s, over halfof the new units were in privately financed condominium projects. Shifting demographics, a healthyeconomy, and low interest rates were important factors in this change.
On average during the 1990’s roughly 1,600 dwellings were built annually, for a net increase of 1,300when demolitions are taken into account. A base growth scenario of 1,800 dwellings annually and anopportunity scenario of 2,200 are projected through 2020. These projections consider absorptionhistory, land availability, product trends, density, and the competitive position of the Central Area relativeto other Chicago communities.
CHANGING LAND USEAn important factor in the growth of downtown housing was the creation of stable residential marketssouth and west of the Loop, and the expansion of the Near North Side housing market south ofChicago Avenue. Many projects in these areas were built on former railroad and industrial land,including Dearborn Park, Illinois Center, Central Station, Kinzie Station, and River East. Adaptive reuseof office and industrial buildings led the way in creating new neighborhoods in the West Loop and RiverNorth and diversifying the Loop. Few conversion opportunities remain, leading developers to constructnew buildings.
ECONOMIC DIVERSITY
Central Area housing meets the needs of a broad range of household incomes. Much of the newdevelopment caters to the affluent, particularly empty nesters. Moderate-income, often youngerhouseholds tend to be attracted to moderately-priced lofts and condominium conversions. Chinatownand Pilsen continue their long history of providing affordable family housing. Affordable housing,including SROs, senior housing, low-income housing, and tax-credit rentals, remains an important partof Central Area housing stock.
Chicago Housing Authority properties include Hilliard Homes and Ickes Homes, which are beingredeveloped as mixed-income communities. Student housing is proliferating, particularly in the SouthLoop, adding considerably to the vitality of the Central Area.
Downtown residents are not typical of Chicagoans as a whole – they tend to be more affluent and havefewer children. A 1999 study sponsored by the City of Chicago on the demand for downtown housing,“An Analysis of the Market Potential for Residential Development – Central Core Area – Chicago, Illinois”,by Tracy Cross and Associates, Inc., concludes that the price of a typical three-bedroom townhome inthe Central Area is roughly twice that of a typical suburban home, limiting the appeal of the Central Areato families with children.
Projected Growth : 36,000-44,000 new dwellings, 54,000-64,000 more residents.
The Central Area housing boom will build on the momentum of the 1980’s and 1990’s
Figure 2.17 and Figure 2.18There was a net increase of 23,000 residentialunits between 1980 and 2000 in the Central Area.

22
CHAPTER 2 Physical & Economic Assessment
DRAFTFinal ReportJune 2003
A Crossroads of Ideas:The Education Sector
The East and South Loop are now home to a major concentration of post-secondary schools.Institutions of higher learning became a major presence in the Central Area during the study period.Currently 22 post-secondary schools are located downtown with a total enrollment of approximately51,000 students. The University of Illinois at Chicago, located immediately west of the Central Area,adds another 25,000 students for a total of 76,000. The largest concentration of schools are in theportion of the East Loop bounded by Michigan Avenue and Dearborn Street, Madison Street and 14th
Street.
Interviews were conducted with administrators at the Central Area institutions likely to experience thehighest levels of growth – Columbia College, DePaul University, Roosevelt University, and the School ofthe Art Institute of Chicago. These interviews revealed:
• Over the next five years, enrollment at these four institutions is expected to increase 34% from thecurrent 25,000 students to more than 34,000.
• Over the next five to 10 years, total square footage is projected to increase 18%, from approximately4.4 million square feet to more than 5.2 million.
• Over the next five to ten years, the demand for additional dormitory beds is expected to increase125% from the current 1,300 beds to more than 3,000 beds in order to meet the increase in the 18-to 24-year-old student population.
• Many institutions have purchased or leased lots or buildings that can be developed into classroom,administrative, or dormitory space in order to accommodate anticipated growth and compete in theincreasingly competitive downtown real estate market.
Projected Growth : an additional 3-4 million square feet of space by 2020 for classroom,administrative, or dormitory space.
Table 2.6Post Secondary School Enrollment
Figure 2.19DePaul University
Figure 2.20Educational institutions have preserved andreused many East and South Loop buildings.
Educational institutions will continue to invest in the Cen-tral Area, providing opportunities for life-long learning

23
CHAPTER 2 Physical & Economic Assessment
CHICAGO CENTRAL AREA PLAN DRAFT Final ReportJune 2003
Retail growth occurred throughout the Central Area during the 1990’s, partly in response to the growingdowntown residential population. Retail space increased from 7.2 million square feet in 1990 to 9.2million in 2000, an average of 200,000 square feet a year. During the period from 1997 to the presentmore than 3.6 million square feet of retail space were completed, under construction, or in planningthroughout the Central Area.
NORTH MICHIGAN AND STATE STREET
Together, North Michigan Avenue and the State Street - Wabash Avenue retail corridors constituteapproximately 60% of all retail activity in the Central Area. The two corridors serve distinctly differentmarkets. A survey of 4,700 downtown shoppers conducted for this plan found that Michigan Avenueshoppers were largely U.S. and international visitors while the State Street - Wabash Avenue corridorpredominantly served downtown workers and city residents.
New retail developments included the State Street openings of Sears, Borders Books, Old Navy, and theDePaul Center, as well as the North Bridge Mall development on North Michigan Avenue. The largestshare of new development (45%) occurred in the North Michigan Avenue corridor, which addedapproximately 900,000 square feet, including Nordstrom’s at 271,000 square feet. The State-Wabashcorridor added more than 285,000 square feet between 1991 and 1999, with the new Sears store onState Street adding another 243,000 square feet in 2001. Vacancy rates dropped and rents increased inboth districts between 1990 and 1999.
NEW TRENDSContinuing retail expansion is demonstrated by the 78 new stores that opened in the Central Areabetween 1999 and 2002. A major new trend is the emergence of convenience shopping to serve newresidents – eight new downtown food and drugstores have opened or are under construction. “Big box”retail is anticipated on Roosevelt Road and Cermak Road west of Canal Street on the Near South Side,similar to the type of retail in the North Avenue - Clybourn Street corridor on the North Side.
Projected Growth : Average annual growth of 250,000 to 350,000 square feet is projectedthrough 2020, for a total of 5 to 7 million square feet of new retail space.
The Marketplace:Retailing in the Central AreaCentral Area retailing is poised for growth extendingbeyond the established Michigan Avenue andState Street shopping districts
Figure 2.23State Street continues its tradition as a great retailstreet with its major anchor stores, the new Searsand Borders, and other new retailers.
Figure 2.21Specialty shopping districts are emerging, likethis one in River North.
Figure 2.22North Michigan Avenue had the largest share ofretail development in the 1990’s.
24
CHAPTER 2 Physical & Economic Assessment
DRAFTFinal ReportJune 2003
Visiting the Central Area:Convention & Hotel Sector
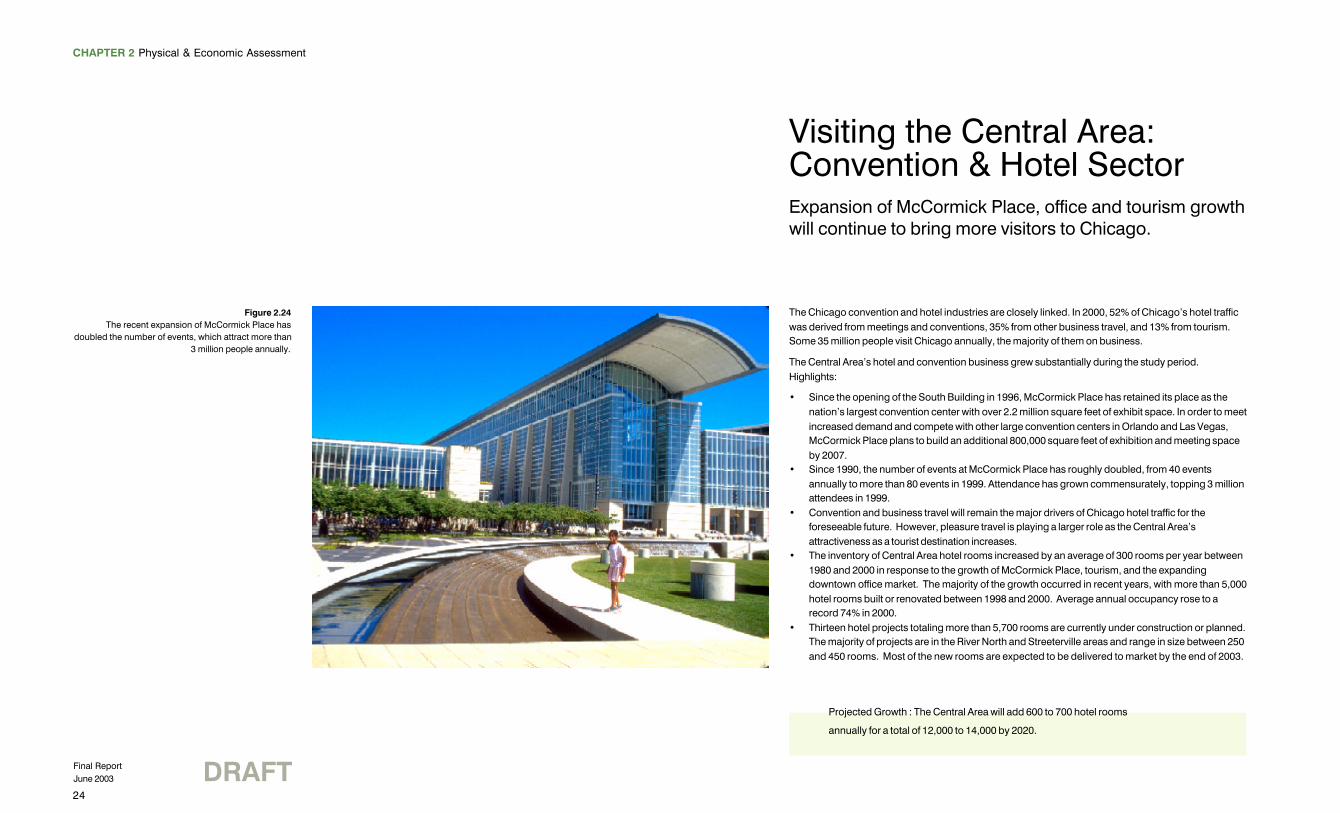
The Chicago convention and hotel industries are closely linked. In 2000, 52% of Chicago’s hotel trafficwas derived from meetings and conventions, 35% from other business travel, and 13% from tourism.Some 35 million people visit Chicago annually, the majority of them on business.
The Central Area’s hotel and convention business grew substantially during the study period.Highlights:
• Since the opening of the South Building in 1996, McCormick Place has retained its place as thenation’s largest convention center with over 2.2 million square feet of exhibit space. In order to meetincreased demand and compete with other large convention centers in Orlando and Las Vegas,McCormick Place plans to build an additional 800,000 square feet of exhibition and meeting spaceby 2007.
• Since 1990, the number of events at McCormick Place has roughly doubled, from 40 eventsannually to more than 80 events in 1999. Attendance has grown commensurately, topping 3 millionattendees in 1999.
• Convention and business travel will remain the major drivers of Chicago hotel traffic for theforeseeable future. However, pleasure travel is playing a larger role as the Central Area’sattractiveness as a tourist destination increases.
• The inventory of Central Area hotel rooms increased by an average of 300 rooms per year between1980 and 2000 in response to the growth of McCormick Place, tourism, and the expandingdowntown office market. The majority of the growth occurred in recent years, with more than 5,000hotel rooms built or renovated between 1998 and 2000. Average annual occupancy rose to arecord 74% in 2000.
• Thirteen hotel projects totaling more than 5,700 rooms are currently under construction or planned.The majority of projects are in the River North and Streeterville areas and range in size between 250and 450 rooms. Most of the new rooms are expected to be delivered to market by the end of 2003.
Projected Growth : The Central Area will add 600 to 700 hotel rooms
annually for a total of 12,000 to 14,000 by 2020.
Expansion of McCormick Place, office and tourism growthwill continue to bring more visitors to Chicago.
Figure 2.24The recent expansion of McCormick Place has
doubled the number of events, which attract more than3 million people annually.

25
CHAPTER 2 Physical & Economic Assessment
CHICAGO CENTRAL AREA PLAN DRAFT Final ReportJune 2003
A Global Draw:Cultural Attractions
Long valued for their contribution to the city’s cultural life, Chicago’s museums and cultural attractionshave assumed increasing importance as tourism destinations over the past 20 years, particularly since1995. Of Chicago’s top 14 tourist attractions, eight are cultural institutions: the Shedd Aquarium, FieldMuseum, Art Institute, Cultural Center, Chicago Symphony Orchestra, Adler Planetarium, ChicagoChildren’s Museum, and Museum of Broadcast Communications. Between 500,000 and 2.5 millionpeople visit each of these attractions annually. To accommodate the increase in visitors, many of themuseums have embarked on expansion programs. Highlights:
• The Adler Planetarium and Astronomy Museum spent $46 million on building expansion andexhibit improvements. The Planetarium expects to spend another $5 million in the next five yearson further improvements.
• The Art Institute of Chicago is planning a new wing. Tentatively scheduled for completion in 2006,the new wing will contain approximately 250,000 square feet and cost $175 million.
• The Field Museum invested approximately $43 million in recent years on the UndergroundAdventure and Sue the Dinosaur exhibits. The museum expects to spend approximately $250million over the next five years on new exhibits, a conservation/environmental initiative,maintenance, technology, and other purposes.
• The John G. Shedd Aquarium is currently in the midst of a $110 million program to renovateexisting facilities and add 45,000 square feet of space. The institution plans to spend another $110million by 2012 for further renovations and an additional 45,000 square feet.
• Millennium Park is expected to draw 2.5 to 3 million visitors annually, equal to the combined drawof the Art Institute and the Field Museum.
• The Randolph Street theater district saw the opening or renovation of the Cadillac Palace Theater,the Goodman Theatre, the Oriental Theater/ Ford Center for the Performing Arts and the ChicagoTheater. The forthcoming Chicago Music and Dance Theater in Millennium Park will add to thiscultural mix and extend the district.
• The Chicago Architectural Foundation has expanded its facilities to serve as a focal point for visitorswho come to explore Chicago’s rich architectural heritage.
Projected Growth : Central Area cultural institutions will add 85,000 to 100,000square feet of space annually, a total of 1.7 to 2 million square feet by 2020.
The Central Area’s world-class museums and culturalattractions are powerful tourist magnets
Figure 2.25The Field Museum and its neighbors on the newlyintegrated museum campus are major attractions fortourists and residents. Development of the museumcampus has dramatically enhanced lakefront publicspace.

26
CHAPTER 2 Physical & Economic Assessment
DRAFTFinal ReportJune 2003
Making and Moving Products:The Industrial SectorIndustrial land close to downtown is essentialfor warehousing and distribution services
Figure 2.26Printing and distribution in the Central Area
Figure 2.27Manufacturing on Goose Island
CHANGING LAND USE AND EMPLOYMENTCentral Area employment in traditional industrial and commercial sectors such as manufacturing,transportation, and wholesale trade has fallen to a fraction of the level of 30 years ago. As recently asthe 1970’s the loft buildings of Printing House Row still housed printing presses, and men’s suits weremanufactured in the West Loop. All of these buildings have since been torn down or converted toresidential or other uses.
FUTURE NEEDSDespite these changes, industrial land continues to have an important role to play in the Central Area.Downtown businesses are leading consumers of warehousing and distribution services, includingovernight package delivery, document storage, printing and binding, food and janitorial services, vehicledepots, and parts distribution. The continuing high rate of downtown construction requires convenientstaging areas and building materials transshipment points. The projected growth of the office core andthe restaurant and entertainment sector will create additional demand for warehousing and distributionservices over the next 20 years.
RETAINING INDUSTRIAL LANDGoose Island, the Kinzie Industrial Corridor and Pilsen are important centers for distribution,warehousing, and related uses, with rising employment and land prices and low vacancy rates. ThePilsen industrial corridor currently has 186 companies and 11,000 jobs, up from 8,500 jobs in 1998.
As existing industrial properties are converted to other uses, those remaining become increasinglyprecious. Planned manufacturing districts have been established to preserve industrial areas. Theremaining sizable reservoirs of industrial space in the Central Area are:• the Chicago-Halsted Planned Manufacturing District (PMD), which is anchored by the Tribune Company’s Freedom Center printing plant• the Canal-Desplaines corridor south of Harrison Street. Buffered by railroad tracks on the east and the Dan Ryan Expressway on the west, this corridor is ideal for continued industrial use.
Projected Growth: In the area bounded by Ashland, North Avenue, Lake Michiganand the Stevenson Expressway, there are currently 933 acres of industrial land,containing 272 businesses and 15,590 jobs. To serve the growing downtownbusiness core, it is critical to preserve a minimum of 933 acres for continuedindustrial, warehousing and distribution use.

27
CHAPTER 2 Physical & Economic Assessment
CHICAGO CENTRAL AREA PLAN DRAFT Final ReportJune 2003
Ensuring Capacity:Utilities
ELECTRIC POWERCommonwealth Edison is engaged in a multibillion dollar upgrade of its Chicago power distributiongrid, with emphasis on the Central Area. To maintain consistent service as demand for power grows,the upgraded system will feature additional substations and greater interconnection between nodes toprovide back-up connections. Completion of major substation projects in the optimization program isset for 2007.
The City of Chicago will implement its Energy Management Plan to make Chicago the nation’s smartestenergy manager, encouraging renewable energy and energy efficient new residential and officeconstruction.
COMMUNICATIONSThe Central Area is well positioned to take advantage of developments in communications technology,notably fiber optics:
• The nation’s network of fiber optic cable has been developed primarily along rail rights-of-way,which converge on downtown Chicago. Lines extend throughout downtown using the existingfreight tunnels. Numerous operators are actively laying fiber downtown.
• The Central Loop and East Loop are most densely served by the existing fiber network. Fiber isalso following the market into the West Loop, South Loop and other areas.
• The fiber optic system will be anchored by a network of telecom hotels, which provide analternative to the traditional hub-and-spoke (copper wiring) system. One telecom hotel has beenbuilt and one is currently under construction.
Existing high and low-tech utility service provides theCentral Area with a clear advantage over competingbusiness centers
Projected Peak Loads for Substations> 95% of capacity81 - 95%66 - 80%50 - 65 %Existing substationFuture substation with projected service area
0 1/2 1 Mile
Figure 2.28Commonwealth Edison is engaged in amultibillion dollar upgrade of its Chicago powerdistribution grid, with emphasis on the CentralArea.

28
CHAPTER 2 Physical & Economic Assessment
DRAFTFinal ReportJune 2003
CTA-Elevated
CTA-Subway
Metra
Bus Routes
Figure 2.29Central Area transit today.
0 1/2 1 Mile

29
CHAPTER 2 Physical & Economic Assessment
CHICAGO CENTRAL AREA PLAN DRAFT Final ReportJune 2003
Getting To and Around the Central Area:The Key Role of Transportation
Figures 2.30 and 2.31Today, CTA rail and bus and Metra commuter railaccounts for 53% of inbound work trips. As theCentral Area grows, it is critical to increase theuse of public transit, walking and alternativemodes of transportation in order to avoidgridlock, protect air quality and keep the CentralArea livable.
Growth in the downtown workforce will result in 166,000 to 240,000 additional inboundwork trips, an increase of 28% to 41%.
Chicago developed as the transportation hub of the Midwest, first because of its river, lake and canalconnections, and next as the nation’s railroad center. Commuter rail and the Chicago TransitAuthority’s rapid transit and bus systems have made it a regional hub, bringing thousands of people towork, shop and play daily. The exceptional transportation infrastructure of the Central Area makes it theideal place in the region for growth.
CURRENT ASSESSMENTCurrently, 53% of inbound work trips to the Central Area use public transit. The Loop has the mostconvenient transit access and the most expensive parking – therefore, more people ride transit to workin the Loop than to other Central Area neighborhoods.
More than 39% of Central Area workers arrive by automobile, while just over 7% walk or use alternativetransportation modes.
ACCOMMODATING GROWTHGrowth scenarios call for expanding inbound work trips by 28 to 41%. It is critical for Chicago’s airquality, economic success and quality of life that a high percentage of these trips use public transit, oralternative modes such as walking or bicycling. Existing roadway capacity is limited, and creatingadditional or expanded rights-of-way is cost prohibitive and would have adverse environmental impact.The Chicago Department of Transportation’s (CDOT) analyses indicate that a significant increase indowntown auto traffic during morning and evening peak periods will result in severe congestion.
Projected growthCDOT assumes that, conservatively, 58% of workers in 2020 will use mass transit, adding 116,000 to167,000 new inbound riders – an increase of 38% to 55% above current peak load. This would requirean additional 120 to 200 CTA buses, increased CTA rapid transit capacity, and 27-45 new peak hourMetra commuter trains.

30
CHAPTER 2 Physical & Economic Assessment
DRAFTFinal ReportJune 2003
Near North
Loop W. of River
Loop E. of River
South Loop Near South
Total
Office 11% 26% 60% 3% n/a 100%Retail 35% 9% 14% 17% 25% 100%Residential 30% 2.5% 7.5% 15% 45% 100%Cultural 10% 4% 36% 35% 15% 100%Convention/Conference n/a n/a n/a n/a 100% 100%Post Secondary Education 7% 1.5% 35% 53% 3.5% 100%Hotel 55% 5% 30% 10% n/a 100%
Market SegmentsOffice 0.3 0.6 0.9 0.2 n/a 2.00Retail 0.7 0.2 0.3 0.5 0.7 2.40Residential 1.0 0.1 0.4 1.0 4.4 6.90Cultural 0.05 0.02 0.2 0.2 0.1 0.57Convention/Conference n/a n/a n/a n/a 0.60 0.60Post Secondary Education 0.01 0.003 0.10 0.30 0.02 0.43Hotel 0.2 0.03 0.1 0.1 n/a 0.43
TOTAL Avg. Annual Demand Increase (acres) 2 1 2 2 6 13
20 Year Acreage Demand 40 20 40 40 120 260Total Year 2000 Land Supply (acres) 87 28 58 122 262 557
Build-out by District (years) 44 28 29 61 44 43
Market SegmentsOffice 0.5 0.8 1.3 0.2 n/a 2.80Retail 0.9 0.2 0.4 0.7 1.0 3.20Residential 1.5 0.2 0.5 1.5 6.2 9.90Cultural 0.06 0.02 0.2 0.2 0.1 0.58Convention/Conference n/a n/a n/a n/a 0.80 0.80Post Secondary Education 0.02 0.004 0.10 0.40 0.02 0.55Hotel 0.3 0.04 0.2 0.1 n/a 0.64
TOTAL Avg. Annual Demand Increase (acres) 3 1 3 3 8 18
20 Year Acreage Demand 60 20 60 60 160 360Total Year 2000 Land Supply (acres) 87 28 58 122 262 557
Build-out by District (years) 29 28 19 41 33 31
Source: Arthur Andersen LLP, Skidmore, Owings, and Merrill LLP, Goodman Williams Group, and City of Chicago, Dept. of Planning
Revised May 21, 2001
OPPORTUNITY DEMAND SCENARIO - AVERAGE ANNUAL ACREAGE DEMAND
Percent of Market Demand (Sq. Ft.)
Study Area Districts
BASE DEMAND SCENARIO -AVERAGE ANNUAL ACREAGE DEMAND
Table 2.7Allocation of Market Demand by Sector and District
Figure 2.32Opportunities for Development, 2001-2020
Vacant LandUnderutilized Land (surface parking, storage)Buildings (over 50% vacant, in need of renovationor reuse)
0 1/2 1 Mile

31
CHAPTER 2 Physical & Economic Assessment
CHICAGO CENTRAL AREA PLAN DRAFT Final ReportJune 2003
Opportunities for Growth
The Central Area has sufficient land to accommodate future development, but it is critical to directspecific types of growth to appropriate districts to create an economically successful, vibrant city. Figure2.31 shows opportunities for development, and Table 2.7 shows the demand for land by marketsegment under base and opportunity scenarios. The priorities in directing this growth will be to buildupon the strengths of the Central Area’s districts, focusing each use into those locations that have theappropriate level of access, compatible existing uses, and will promote quality of life.
THE OPPORTUNITY FOR DEVELOPMENT IN THE CENTRAL AREAVacant land, under-utilized land, obsolete and under-occupied buildings combine to offer theopportunity to develop 207 million square feet of new space by 2020.
New development is expected to restore and reuse many older buildings and find creative new uses forhistoric landmarks throughout the Central Area.
The largest land development opportunities are at former rail yard and industrial sites to the east, southand northwest of the Loop. Underutilized land is concentrated in the South Michigan-Wabash and Statestreet corridor and also found in the South Loop, West Loop and the Near North. The Loop offers largeropportunities for renovation or redevelopment of obsolete or vacant buildings and the sites they standon. Smaller renovation and redevelopment opportunities are offered in all of the Central Area districts.Development opportunities for service, distribution and light industry exist in planned manufacturingdistricts and industrial corridors.
THE DEMAND FOR LAND IN THE CENTRAL AREAThe Central Area’s various market sectors have sought out locations where infrastructure, amenities andcompatible neighbors make their success possible. Demand for office space is greatest in areasadjacent to the existing office core and near public transit, while residential demand is greatest beyondit. Retailers seek out each other, knowing they each benefit from a known shopping destination.Education institutions have developed a shared recognition of the value of older office buildings for theirown needs. Distribution and industrial uses are critical to support the growing business district, andland is being reserved for these in industrial corridors and planned manufacturing districts.
Demand for land and space varies by sector in the Near North, the South Loop and Near South side.The Central Area’s current land uses indicate clear concentrations by sector. However, a tremendousdiversity and mix of uses can be found in each of the Central Area’s districts, creating strong places aswell as a strong economy.
OFFICE GROWTH : SPECIAL REQUIREMENTSAt first glance, there appears to be ample room for growth. Under the most land-intensive scenario, 360acres would be required through 2020. Currently 555 acres are available. Sizable tracts are available forresidential and mixed-used development.
However, land suitable for high-density office development is limited. Under the most land-intensivescenario, office development will consume 62 acres through 2020. A location convenient to transit linesserving both city and suburbs is essential. Relatively little land remains in the traditional central businessdistrict.
The prospects for expansion of the office core north, south and east are limited. The North MichiganAvenue corridor and the East Loop saw weak office demand during the 1990’s because they were notconvenient to the West Loop commuter stations. Efforts to establish a speculative market for “backoffice” space south of Congress thus far have not been successful. As a result, the office core hasexpanded toward the west. Approximately 45% of recent projects have been built in the West Loop andwest of the river.
The widely-held view in the development community is that more projects would be built west of theriver if the zoning permitted higher density. Currently, the maximum permissible density in much of thisdistrict is relatively low, reflecting its industrial past. If greater density were permitted and new transitfacilities provided, an estimated 30 percent of projected office demand could be accommodated west ofthe river.

32
CHAPTER 2 Physical & Economic Assessment
DRAFTFinal ReportJune 2003
Figure 2.33The South Loop and the Near South providegreat opportunities for future residential andretail developments as well as continued rail
oriented uses.(View of Roosevelt Road Corridor looking east)