chapter 17 is regulatory impact analy sis of f … 17 is regulatory impact analy sis of ... and...
TRANSCRIPT
463
Source: Hester Peirce and Benjamin Klutsey, eds., Reframing Financial Regulation: Enhancing Stability and Protecting Consumers. Arlington, VA: Mercatus Center at George Mason University, 2016.
CHAPTER 17Is Regulator y Impac t Analy s is of F inancial Regulat ions Pos s i b le?
JERRY ELLIG AND VER A SOLIMANMercatus Center at George Mason University
During the past several years, a vigorous debate has raged in the courts, the US Congress, and academia about the proper role of economic analy sis in financial regulation. At first glance, this seems to be a
strange topic for debate. Most actors in financial markets are highly moti-vated by monetary values, financial market data are widely available, and the economics profession has a long history of studying banking and finance.1 Therefore, economic analy sis of financial regulation should be easier and less controversial than economic analy sis of some other forms of regulation, such as environmental or health and safety regulation. Nevertheless, skeptics abound, arguing that the unique nature of financial markets means that the analy sis is either impossible or at least must be conducted much differently than analy sis of economic, health, safety, and security regulations.2
No well- executed analy sis of a complex economic topic is easy, nor is it per-fect. But reasonably good regulatory impact analy sis of financial regulations is pos si ble, and it yields useful information for decision makers. In this chapter, we outline the basic ele ments of regulatory impact analy sis, suggest the standards a good regulatory impact analy sis should meet, and employ quantitative data from the Mercatus Center’s Regulatory Report Card (Report Card) to assess the

regulatory iMPact analy sis oF Financial regulations
464
current quality of analy sis for financial regulations issued by executive branch agencies. We also include an extensive case study of the regulatory impact analy-sis accompanying a financial regulation proposed by the Department of Housing and Urban Development (HUD) in 2008 to revise mandatory disclosures for residential real estate transactions. The case study demonstrates that HUD did a reasonably good job on what is arguably the most difficult aspect of regulatory impact analy sis: analyzing the under lying prob lem the regulation is intended to solve and quantifying the benefits of the regulation. The Report Card data and our case study both suggest that regulatory impact analy sis of financial regula-tions is no more difficult than for other types of regulations.
WHAT IS REGUL ATORY IMPACT ANALY S IS?For more than three de cades, presidents of both po liti cal parties have instructed executive branch agencies to conduct regulatory impact analy sis when issuing significant regulations.3 Some in de pen dent agencies are required by law to assess the economic effects of their regulations or “consider” the ben-efits and costs when they make decisions about regulations.4 Executive orders and laws requiring economic analy sis of regulations reflect a bipartisan con-sensus that the analy sis should inform, but not dictate, regulatory decisions. The purpose of the analy sis is to ensure that regulators base their decisions on knowledge of the likely consequences of regulations, “rather than on dogmas, intuitions, hunches, or interest group pressures.”5
A thorough regulatory impact analy sis should do at least four things:
1. Assess the nature and significance of the prob lem the agency is trying to solve. Assessment of the prob lem is the first princi ple of regulation listed in President Clinton’s Executive Order 12866, which has governed regulatory analy sis by executive branch agencies since 1993.6 It is also the logical starting point for regulatory impact analy sis.7 If the agency has not identified the root cause of the prob lem it is trying to solve, it has no basis for claiming that the regulation will create benefits (by solving the prob lem) and little guidance for developing effective alterna-tive solutions. Unfortunately, assessment of the prob lem is the aspect of regulatory impact analy sis that agencies perform most poorly.8 Often agencies merely cite the statute authorizing the regulation, assert a

jerry ellig and vera soliMan
465
prob lem exists without providing evidence, or claim the prob lem exists in spite of evidence to the contrary.9
If there is no significant prob lem, or if the prob lem is likely to shrink or dis appear in the future in the absence of new regulation, then it is wasteful to regulate. Public and private resources could be better devoted to other priorities. If a significant prob lem exists and is expected to per-sist, regulators are unlikely to devise an effective solution unless they identify the prob lem’s root cause or causes. Even if regulators get lucky and devise an effective solution without identifying the prob lem’s root cause, the regulation is likely to be over broad, covering entities that are not a significant source of the prob lem.
Regulations address three types of prob lems: market failures, govern-ment failures, and overriding social needs. Remedying the first two types of failures improves economic efficiency: it allows markets or government to produce the mix of goods and ser vices that consumers value most. The third type of prob lem, an overriding social need, usually involves some aspect of public health, fairness, or justice that may or may not have an explicit efficiency rationale.10
Analy sis of the prob lem should include a clear, coherent theory of why the prob lem exists and what caused it. For financial markets, theories of potential market or government failures abound. Equity holders in financial firms may have incentives to take on excessive risks, since they receive the profits from successful investments but can shift the losses to bondholders (through bankruptcy) or taxpayers (through deposit insurance or bailouts). Government policies intended to expand consumers’ access to credit can encourage excessive borrow-ing. Information asymmetries between lenders and borrowers create opportunities for deception and fraud, but mandated disclosures may backfire if they are poorly crafted or overload consumers with infor-mation. Incentive structures may not perfectly align the interests of agents, like corporate man ag ers or investment advisers, with the inter-ests of investors.11
The analy sis should include evidence demonstrating that the prob-lem is significant and widespread. In other words, the evidence should be systematic and generalizable, not just anecdotes about the be hav ior of a few bad actors.12

regulatory iMPact analy sis oF Financial regulations
466
2. Identify a wide variety of alternative solutions. Executive Order 12866 indicates that agencies should consider a variety of alternative solutions to the prob lem identified, including per for mance standards, economic incentives, provision of information, modification of existing regulations or laws, and the alternative of not regulating.13 The guidance document from the Office of Management and Bud get (OMB) for regulatory impact analy sis, Circular A-4, provides a broader list of alternatives, such as fees, bonds, insurance, changes in liability rules, definition or redefinition of property rights, and information provision or disclosure.14 Regulatory scholars suggest additional alternatives that can be effective in some situ-ations, such as requiring firms to analyze and plan for potential hazards or risks, or voluntary standards adopted at the behest of customers or suppliers.15 Or the regulator might consider a “nudge” strategy to require individuals or businesses to explic itly consider certain types of informa-tion before making a decision, but refrain from compelling any par tic u lar decision.16 Fi nally, alternatives can also consist of variations on the same basic regulatory approach, such as setting standards at diff er ent levels or making a larger or smaller number of entities subject to the regulation.17
A thorough regulatory impact analy sis can include alternatives out-side the scope of current law. OMB guidance indicates that agencies should include such alternatives if legislative constraints prevent them from adopting the most effective approach.18 Such information is use-ful to Congress if it considers disapproving the regulation under the Congressional Review Act or rewriting the law that authorized the regulation.
None of this means that a regulatory impact analy sis must identify and assess every alternative imaginable. That would be an impossible standard for any agency to satisfy. But prominent alternatives that have been dis-cussed in the scholarly lit er a ture, considered in the broader policy debate about the prob lem, or identified by agency staff as a result of their own expertise on the subject matter should be considered for inclusion in the regulatory impact analy sis.
3. Define the benefits the agency seeks to achieve in terms of ultimate outcomes that affect citizens’ quality of life, and assess each alterna-tive’s ability to achieve those outcomes. The analy sis should specify

jerry ellig and vera soliMan
467
the ultimate outcomes that benefit citizens— not just inputs, activities, or processes.19 For financial regulations, examples of outcomes could include improved returns to investors, reduced costs to borrowers, reduced administration and compliance costs, or reduced risk of a financial crisis (and thus a reduction in the expected costs of finan-cial crises). Improved compliance, successful enforcement actions, and increased bank capital are inputs or activities, not outcomes.
The analy sis should include a theory explaining how each alterna-tive is expected to produce the desired outcomes, along with evidence that the theory is actually correct. As with analy sis of the prob lem, the evidence that the regulation is likely to produce benefits should be sys-tematic and generalizable.
Wherever pos si ble, each type of outcome for each alternative should be quantified and converted into monetary terms to facilitate comparison with other outcomes and with costs. The analy sis should also forthrightly acknowledge and assess uncertainties associated with the estimates: “Rather than abandon the attempt to quantify costs and benefits, I think it would be better for the structures guiding cost- benefit analy sis to sim-ply reflect the statistician’s dictum: every number should have a band of uncertainty associated with it.”20
The benefits of each major requirement should be estimated sepa-rately. This practice helps decision makers understand which provisions produce most of the benefits, and it allows them to compare the benefits of each provision with its costs. Scholarly research finds that the cases in which regulatory impact analy sis has most clearly influenced decisions are usually cases in which regulators achieved significant increases in benefits or reduction in costs by altering regulations on the margins.21
4. Identify and mea sure costs. In mainstream economic theory, the term “cost” means “opportunity cost”— the value of benefits forgone because one course of action was chosen over another course of action.22 The social costs of a regulation are the good things that regulated entities, consumers, and other stakeholders must sacrifice to receive the benefits the regulation produces. Just like benefits, costs may involve far more than monetary expenditures. Costs include the value of time people spend complying with the regulation and the value consumers forgo

regulatory iMPact analy sis oF Financial regulations
468
when they cut back their purchases of a good or ser vice in response to regulation- induced price increases or quality reductions. Costs include the value of proj ects or innovations forgone because businesses or other regulated entities must devote time, attention, and money to regulatory compliance. Posner and Weyl illustrate this point in their assessment of the regulatory impact analy sis for a 2008 regulation on bank capital ade-quacy issued by the Office of the Comptroller of the Currency: “[W]hile it did quantify the trivial administrative costs to banks of implementing the regulations, it ignored the much larger opportunity costs.”23
It is a common impression that costs of regulation are usually eas-ier to estimate than benefits because costs are merely money spent by regulated entities, whereas benefits often involve things that are dif-ficult to place monetary values on, such as clean air, the existence of endangered species, or the reduced risk of a future financial crisis.24 This belief confuses monetary outlays with social opportunity costs. Correct estimation of the social cost of a regulation can require assessments of cause- and- effect relationships and monetary valuation challenges that are every bit as difficult as those involved in estimating benefits.
Where pos si ble, the costs of each alternative should be quantified and converted into monetary terms to facilitate comparison with benefits and with the costs of other alternatives. The cost of each major require-ment should be estimated separately. This practice helps decision mak-ers understand which provisions produce most of the costs, and it allows them to compare the costs of each provision with its benefits.
Without evidence- based analy sis of the systemic prob lem and the benefits and costs of alternatives, regulatory decisions are more likely to be based on hopes, intentions, and wishful thinking rather than real ity.
WHAT STANDARDS SHOULD THE ANALY S IS MEET?An academic debate has raged for several years over whether it is pos si ble to conduct a reliable, “quantified” benefit- cost analy sis of financial regula-tions. (Typically, commentators use the term “quantified” as a synonym for “monetized,” even though some benefits or costs might be quantified even if they are not monetized.) Skeptics contend that financial agencies should not be expected to quantify or monetize all (or even most) relevant benefits
jerry ellig and vera soliMan
469
and costs, because some of them are extremely difficult or even impossible to quantify or monetize given the current state of data and analytical techniques. Financial regulations pose special challenges because finance affects many other markets, estimating the effects of regulations requires predicting human be hav ior rather than the be hav ior of chemical compounds or machines, and there are fewer stable, predictable relationships in finance than in the physical sciences.25 Given these difficulties, the skeptics call for “qualitative” or “prag-matic” analy sis that considers the pros and cons of a proposed regulation but does not demand quantification of benefits and costs. One prominent skep-tic characterizes all analyses with partial quantification as “guesstimates” that camouflage agency judgments, apparently leaving nonquantified benefit- cost analy sis as the only intellectually honest option.26
Defenders of benefit- cost analy sis counter that estimating benefits and costs of financial regulations should be easier than estimating benefits and costs of some other types of regulations, since financial markets involve money and there is a great deal of financial market transaction data available.27 They also point out that, in practice, regulatory agencies are generally not held to the impos-sible standard of precisely quantifying every imaginable benefit and cost of a regulation. Instead, agencies are expected to do the best they can to quantify and monetize benefits and costs given the current state of data and analytical tech-niques.28 Monetization of all benefits and costs with complete certainty is rarely pos si ble, but some degree of quantification is usually pos si ble.29 When there are ranges of uncertainty associated with numerical values, analysts should identify those ranges and explain reasons for choosing some values over others.30 When significant benefits or costs are not quantified, techniques such as break- even analy sis can be used to assess how plausible it is that benefits may exceed costs.31 A key virtue of this “quantify where pos si ble” approach is that it forces agencies to be more explicit about the sizes and probabilities of effects that they are con-sidering anyway, at least implicitly.32
We agree with the critics that regulatory agencies should not be expected to perform analy sis that is impossible—or not currently pos si ble. But we also agree with the defenders that the current practice of quantifying benefits and costs when pos si ble is “the basic kind of analy sis one would expect of an economic regulatory agency.”33 The key to resolving the debate is a princi ple enunciated in Executive Order 12866: “Each agency shall base its decisions on the best reasonably obtainable scientific, technical, economic, and other

regulatory iMPact analy sis oF Financial regulations
470
information concerning the need for, and consequences of, the regulation.”34 This princi ple reflects the commonsense idea that regulatory agencies should not be expected to do the impossible but should be expected to use the best analytical information obtainable— including the best obtainable information that would help them to quantify and monetize benefits and costs.
This princi ple also implies that if the agency considers factors that are not quantified and/or monetized, it should nevertheless use the best reasonably obtainable information about those factors. In other words, if nonmonetized values play a major role in the decision, the agency has a responsibility, in its regulatory impact analy sis, to define those values, pres ent evidence that they matter to citizens, pres ent evidence that the regulation will significantly advance those values, and assess how alternative proposals would affect those values. The fact that the agency cites something other than benefits or costs as the reason for its decision does not mean that good intentions can take the place of evidence. Nonquantified values, fairness, and distributive impacts should be discussed thoughtfully, with citations to the best available relevant research and evidence.
The wording of this princi ple holds an additional implication that has not been discussed in the US debate over quantification of the benefits and costs of financial regulations. The executive order states that agencies should use the best reasonably obtainable information not just about the consequences (benefits and costs) of the regulation, but also “concerning the need for” the regulation. A regulatory impact analy sis assesses the need for regulation by assessing the nature, significance, and root cause of a systemic prob lem. Two financial economists at the UK’s former financial regulator—Financial Ser-vices Authority—have noted that “cost- benefit analy sis (CBA) is a practical and rigorous means of identifying, targeting, and checking the impacts of regula-tory mea sures on the under lying causes of ills with which regulators need to deal, those causes being the market failures that in turn may justify regulatory intervention.”35 A regulatory impact analy sis also assesses the need for the par tic u lar regulation the agency proposes by developing alternatives, assessing their consequences against the baseline of no regulatory change, and compar-ing these consequences with the likely consequences of the proposed regula-tion. Thus, the assessment of the systemic prob lem and alternatives should also use the best reasonably obtainable scientific, technical, economic, and other information.

jerry ellig and vera soliMan
471
E VALUAT ION OF REGUL ATORY IMPACT ANALY S IS OF F INANCIAL REGUL AT IONSUnfortunately, most regulatory impact analyses (RIAs) produced by executive branch agencies fail to live up to the standards articulated in Executive Order 12866. The most recent data on this topic come from the Mercatus Center’s Regulatory Report Card proj ect.
The Report Card qualitatively assessed the quality and use of regulatory analy-sis for proposed, eco nom ically significant, prescriptive regulations issued by exec-utive branch agencies from 2008 through 2013.36 The assessment criteria include the four key ele ments of regulatory impact analy sis described previously: analy-sis of the prob lem, alternatives, benefits, and costs. The scoring methodology is a middle ground between “checklist” systems for scoring regulatory analy sis37 and in- depth qualitative case studies.38 Expert reviewers trained in the evalua-tion method assign each regulatory analy sis a Likert scale (0–5) score. For each criterion, the evaluators assign a score ranging from 0 (no useful content) to 5 (comprehensive analy sis with potential best practices). The scores are ordinal, not cardinal, and so we caution the reader to interpret these numerical comparisons the same way one would interpret student test scores. An analy sis that earns twice as many points as another one is clearly better, but not necessarily twice as good.
A 2012 article in the peer- reviewed journal Risk Analy sis describes the Report Card’s methodology and first year’s results; we refer readers to that article for a more detailed description.39 Several articles using Report Card data have been published in scholarly journals.40 Statistical tests show that the method has produced consistent results from scorers trained in the evaluation method.41 Report Card findings on the quality of agency regulatory analy sis are generally consistent with the results of prior researchers’ quantitative and qualitative evaluations of RIAs.42
The Report Card results offer some hopeful signs for those who believe that decisions about financial regulations should be heavi ly informed by economic analy sis. First, the data suggest that economic analy sis of financial regula-tions is no more difficult than economic analy sis of other types of regulations. Second, although no regulatory impact analy sis of a financial regulation is consistently excellent, some parts of some regulatory impact analyses provide examples of reasonably good analytical practices.
The Report Card proj ect evaluated eight financial regulations between 2008 and 2011, listed in table 1. (No eco nom ically significant financial regulations

regulatory iMPact analy sis oF Financial regulations
472
Table 1. Financial Regulations Evaluated in the Mercatus Center’s Regulatory Report Card Proj ect, 2008–2011
Rule Name Proposing AgencyYear
Proposed
Regulatory Identifier Number
Real Estate Settlement Procedures Act
Department of Housing and Urban Development, Office of the Assistant Secretary for Housing
2008 2502- AI61
Class Exemption for Provision of Investment Advice, Proposed Rule
Department of Labor, Employee Benefits Security Administration
2008 1210- AB13
Fiduciary Requirements for Disclosure in Participant- Directed Plans
Department of Labor, Employee Benefits Security Administration
2008 1210- AB07
Notice of Class Exemption for Provision of Investment Advice
Department of Labor, Employee Benefits Security Administration
2008 1210- ZA14
Standardized Risk- Based Capital Rules (Basel II)
Department of the Trea sury, Office of the Comptroller of the Currency and Office of Thrift Supervision; Board of Governors of the Federal Reserve System; Federal Deposit Insurance Corporation
2008 1557- AD07
Definition of “Fiduciary”Department of Labor, Employee Benefits Security Administration
2010 1210- AB32
Prohibited Transaction Exemption for Provision of Investment Advice
Department of Labor, Employee Benefit Security Administration
2010 1210- AB35
Credit Risk Retention— Definition of Qualified Residential Mortgage
Department of the Trea sury, Office of the Comptroller of the Currency; Board of Governors of the Federal Reserve System; Federal Deposit Insurance Corporation
2011 2501- AD53
Source: www . mercatus . org / reportcard .
jerry ellig and vera soliMan
473
were proposed by executive branch agencies in 2012 and 2013.) The topics covered by these regulations include bank capital adequacy requirements, the form and content of disclosures to mortgage borrowers, regulation of financial advisers, and a definition that determines when a loan securitizer must retain some of the credit risk (aka “skin in the game”) from the mortgages it securi tizes. Many financial regulations are issued by in de pen dent agencies, such as the US Securities and Exchange Commission, the US Commodity Futures Trading Commission, and the Bureau of Consumer Financial Protection. Regulation issued solely by in de pen dent agencies are not included in the Report Card because they are not subject to Executive Order 12866. Nevertheless, the financial regulations issued by executive branch agencies touch on many of the same kinds of prudential, consumer protection, and investor protection issues that the in de pen dent financial regulators deal with.
Figure 1 compares the Report Card scores for financial and nonfinancial regulations on the four major ele ments of regulatory impact analy sis for 2008 through 2011, the time period when the financial regulations were proposed. Average scores for both types of regulations are quite similar.43 The small dif-ferences between scores are not statistically significant; in other words, the differences could be due to random chance rather than any real differences in the quality or use of analy sis.44 Figure 1 clearly contradicts the claim that there is something unique about financial regulations that makes regulatory impact analy sis more difficult than for other regulations. It is more consistent with Posner and Weyl’s claim that “CBA [cost- benefit analy sis] is at least as well suited to financial regulation as to other forms of regulation.”45
Financial regulations evaluated in the Report Card share another similarity with nonfinancial regulations: no regulation offers an example of consistently good analy sis on all of the criteria. Few financial regulations received a score of 5 on any of the four criteria, which would indicate complete analy sis with one or more “best practices” that other agencies could learn from.46 A score of 4 indicates that the analy sis contains a reasonably thorough assessment of most aspects of the topic or an example of at least one “best practice.” No regulation achieved a score of 4 on all four criteria.
One regulation, however— HUD’s Real Estate Settlement Procedures Act (RESPA) regulation— received a score of 4 on the criterion that most often stymies all agencies: analy sis of the prob lem. And the RIA clearly demonstrates how the benefits of the regulation flow from solving the prob lem. We examine

regulatory iMPact analy sis oF Financial regulations
474
this part of HUD’s analy sis in greater detail to show how it is eminently pos-si ble to perform these crucial first steps of an RIA reasonably well, even for a financial regulation.
HUD’S RESPA REGUL ATORY IMPACT ANALY S IS: A CASE STUDYCongress passed RESPA in 1974 to help consumers become better shoppers for settlement ser vices and to eliminate kickbacks and referral fees. Since the passage of RESPA, HUD has adopted numerous regulations. One regulation, proposed in 2008, would have revised the good faith estimate (GFE) of closing costs, revised the HUD-1 form consumers receive at closing to make it track more closely with the proposed new GFE, and added a “closing script” to the
5
4
3
2
1
0systemicproblem
alternatives benefits costs
Rep
ort
Car
d Sc
ore
(Max
imum
Pos
sibl
e =
5)
nonfinancial financial
Figure 1. Comparison of Regulatory Report Card Scores for Financial and Nonfinancial Regulations, 2008–2011
Source: Authors’ calculations based on data available at www . mercatus . org / reportcards .

jerry ellig and vera soliMan
475
revised HUD-1. The proposed GFE revision was accompanied by extensive analy sis assessing the under lying prob lem HUD sought to solve and suggest-ing how the new regulation could create benefits for consumers.
Theor y of the Prob lemThe department argues that the system for originating and closing mortgages is unnecessarily complex, makes it hard for many borrowers to identify the cheapest loan, and thus allows mortgage originators to impose higher costs on borrowers who cannot identify the cheapest loan.47 Higher costs for bor-rowers create an obvious distributional issue that Congress was concerned about, but higher costs can also create economic inefficiency by prompting some potential borrowers to forgo home owner ship or refinancing of an exist-ing mortgage.
A key reason for consumer confusion was that the then- current GFE dis-closures did not pres ent costs and fees in an understandable way. Previous regulations under RESPA simply required increased disclosure of informa-tion on the GFE form, which the RIA acknowledges did little to help alleviate consumer confusion.48 Confusion is especially likely when the loan involves a yield spread premium (YSP). A yield spread premium is a payment the lender makes to the mortgage originator because the loan carries an above- market interest rate. In theory, a YSP allows the borrower to reduce up- front closing costs in exchange for paying a higher interest rate. But if the GFE disclosures are not clear, consumers may not understand the tradeoffs and may have dif-ficulty comparing loans from diff er ent lenders with diff er ent terms.
Ev idence of the Prob lemThe RIA cites several studies to support the claim that asymmetric information or consumer confusion lead to higher settlement costs.
Woodward S tudy. One study, conducted for HUD by Susan E. Woodward and the Urban Institute,49 used data from a national sample of 7,560 thirty- year, fixed- rate home purchase loans, insured by the Federal Housing Administration (FHA), that closed in May and June of 2001. Woodward’s assessment included several findings that support HUD’s theory:

regulatory iMPact analy sis oF Financial regulations
476
• 495 of the 7,560 loans studied were no- cost loans. These are loans for which the YSP covered all lender and broker closing costs. Borrow-ers choosing no- cost loans simplified their shopping prob lem by shopping on rate alone, and they saved $1,200 compared to other borrowers.50
• Borrowers from direct lenders who received counseling from a third party saved $306 compared to borrowers who declined counseling or received counseling from the lender. This suggests that if a better dis-closure could go part of the way in providing what counseling provides, borrowers could find better deals.51
• Borrowers with only a high school education paid higher settlement charges than buyers with a college education.52 The differentials are large by any metric.53 The difference amounts to nearly $1,090 for all loans classified as “nonsubsidized” and almost $1,271 for nonsubsidized loans with an interest rate above 7 percent.54 This observation implies that better disclosures can fill a gap in the knowledge of borrowers who do not have the benefit of more (formal) education.55 While all FHA loans are subsidized in the sense that that they carry lower interest rates because FHA guarantees them, in this study “subsidized” loans are those that have contributions to closing costs or down payments by state or local programs, interest rates at or below 6 percent, or interest rates off the one- eighth tick that is standard in the FHA market.56
Urban Ins t i tu te S tud y. The Urban Institute also conducted an analy sis of 5,926 nonsubsidized FHA loans drawn from the 7,560 loans in the Woodward study.57 As table 2 shows, there is significant variation in closing costs. The ratio of what the 75th percentile pays to what the 25th percentile pays is 1.7 for total closing costs, 2.0 for total loan charges, 2.4 for the YSP, 2.9 for direct loan fees, 1.7 for title charges, and 1.6 for other third- party charges.58 The variation is still substantial when the charges are calculated as a percentage of the loan amount. The ratio of what the 75th percentile pays as a percentage of the loan to what the 25th percentile pays is 1.8 for total loan charges, 2.1 for the YSP, and 2.4 for direct loan fees.59
From these results HUD concludes that half of the borrowers pay loan charges equal to or greater than 3.2 percent of the loan amount; one- quarter

jerry ellig and vera soliMan
477
pay loan charges of at least 4.2 percent of the loan amount; and 5 percent pay loan charges of at least 6.2 percent of the loan amount. The variation is similar for title charges and other third- party charges. Half of the borrowers pay total closing costs equal to or greater than 5.1 percent of the loan amount; one- quarter pay closing costs of at least 6.4 percent of the loan amount; and 5 percent pay closing costs of at least 8.9 percent of the loan amount.60
Root Cause of the Prob lem: Misleading Mandated DisclosuresHUD made extensive use of a Federal Trade Commission (FTC) study on mortgage disclosure, as well as its own tests of alternative GFE disclosures.61 These studies revealed that substantial percentages of borrowers could not identify impor tant loan costs using then- current GFE disclosures, but some simple revisions could substantially improve consumer understanding.
The FTC conducted thirty- six in- depth interviews with recent mort-gage customers and tested current and proposed disclosure language with more than 800 mortgage customers.62 The interviews revealed that many respondents could not understand the disclosures on their own and asked the loan originators or closing agents to explain them.63 Many did
Table 2. Distribution of Categories of Closing Costs
Series5th
Percentile25th
Percentile
50th Percentile (median)
75th Percentile
95th Percentile
Total closing cost $2,663 $4,045 $5,334 $6,889 $10,183
Total loan charges $1,104 $2,310 $3,392 $4,714 $7,394
Yield spread premium (indirect) loan fee
$250 $1,249 $2,041 $3,016 $4,658
Direct loan fee $21 $683 $1,387 $2,008 $3,696
Total title charges $666 $953 $1,267 $1,652 $2,407
Total other third- party charges
$293 $469 $574 $744 $1,097
Source: Department of Housing and Urban Development (HUD), Office of the Assistant Secretary for Housing, “Real Estate Settlement Procedures Act (RESPA): Simplification and Improvement of the Pro cess of Obtaining Home Mortgages and Reducing Consumer Costs,” Regulatory Impact Analy sis (March 14, 2008): 6-22 at table 2-2 (reproducing Signe- Mary McKernan, Doug Wissoker, and William Margrabe, “Descriptive Analy sis of FHA Loan Closing Costs, Prepared for the Department of Housing and Urban Development,” Urban Institute, May 9, 2007, exhibit 11).

regulatory iMPact analy sis oF Financial regulations
478
not understand the vari ous itemized fees on the GFE form, such as the discount fee,64 annual percentage rate (APR), amount financed, and the finance charge disclosure, or they could not determine how the individual fees related to the total.65
The quantitative consumer tests were conducted with two diff er ent loan- cost scenarios— one with relatively simple loans and the other with more com-plex loans that included features such as optional credit insurance, interest- only monthly payments that did not include escrow for taxes and insurance, a large balloon payment, and prepayment penalties.66 Table 3 shows that
Table 3. Percentage of Respondents Viewing the Current Disclosure Forms Who Could Not Correctly Identify Vari ous Loan Costs
Loan CostPercentage of Current- Form
Respondents
APR amount 20
Settlement charges amount 23
Interest rate amount 32
Whether loan amount included financed settlement charges
33
Which loan was less expensive 37
Loan amount 51
Presence of prepayment penalty for refinance in two years
68
Presence of charges for optional credit insurance 74
Reason why the interest rate and APR sometimes differ
79
Property tax and homeowner’s insurance cost amount
84
Total up- front charges amount 87
Prepayment penalty amount 95
Balloon payment (presence and amount) 30
Monthly payment (including whether it included taxes and insurance)
21
Cash due at closing amount 20
Source: James M. Lacko and Janis K. Pappalardo, “Improving Consumer Mortgage Disclosures: An Empirical Assessment of Current and Prototype Disclosure Forms,” Staff Report, Federal Trade Commission (Washington, DC: Bureau of Economics, June 2007), 79.

jerry ellig and vera soliMan
479
substantial percentages of consumers could not correctly identify impor tant information such as the total settlement charges, total up- front charges, the loan amount, optional charges, or which loan was less expensive.
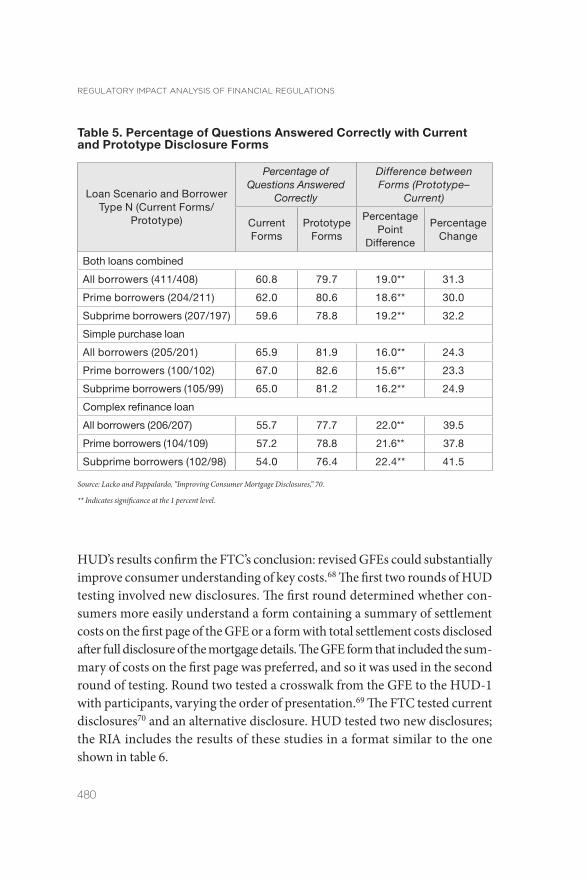
The FTC also found that a revised GFE significantly increased consumer understanding. FTC researchers designed a three- page prototype disclosure form that summarized all key loan costs on the first page and provided addi-tional detail on the second and third pages.67 Table 4 reveals that the prototype form substantially increased the proportion of consumers who could correctly identify most major costs using the form, regardless of whether the loan was prime or subprime. As table 5 shows, much larger percentages of consumers correctly identified loan costs using the prototype form.
HUD also conducted multiple rounds of tests of alternative disclosures. Many of the questions HUD asked consumers were either identical to or closely analogous to those used in the FTC’s survey. Table 6 reveals that
Table 4. Improvements Provided by the Prototype Disclosure Form in the Percentage of Respondents Correctly Identifying Vari ous Loan Costs
Loan Cost Percentage Point Improvement
APR amount 16
Settlement charges amount 15
Interest rate amount 12
Whether loan amount included financed settle-ment charges
9
Which loan was less expensive 13
Loan amount 37
Presence of prepayment penalty for refinance in two years
24
Presence of charge for option credit insurance 43
Reason why the interest rate and APR some-times differ
21
Property tax and homeowner’s insurance cost amount
62
Total up- front charges amount 66
Prepayment penalty amount 53
Source: Lacko and Pappalardo, “Improving Consumer Mortgage Disclosures,” 80.
regulatory iMPact analy sis oF Financial regulations
480
HUD’s results confirm the FTC’s conclusion: revised GFEs could substantially improve consumer understanding of key costs.68 The first two rounds of HUD testing involved new disclosures. The first round determined whether con-sumers more easily understand a form containing a summary of settlement costs on the first page of the GFE or a form with total settlement costs disclosed after full disclosure of the mortgage details. The GFE form that included the sum-mary of costs on the first page was preferred, and so it was used in the second round of testing. Round two tested a crosswalk from the GFE to the HUD-1 with participants, varying the order of pre sen ta tion.69 The FTC tested current disclosures70 and an alternative disclosure. HUD tested two new disclosures; the RIA includes the results of these studies in a format similar to the one shown in table 6.
Table 5. Percentage of Questions Answered Correctly with Current and Prototype Disclosure Forms
Loan Scenario and Borrower Type N (Current Forms/
Prototype)
Percentage of Questions Answered
Correctly
Difference between Forms (Prototype–
Current)
Current Forms
Prototype Forms
Percentage Point
Difference
Percentage Change
Both loans combined
All borrowers (411/408) 60.8 79.7 19.0** 31.3
Prime borrowers (204/211) 62.0 80.6 18.6** 30.0
Subprime borrowers (207/197) 59.6 78.8 19.2** 32.2
Simple purchase loan
All borrowers (205/201) 65.9 81.9 16.0** 24.3
Prime borrowers (100/102) 67.0 82.6 15.6** 23.3
Subprime borrowers (105/99) 65.0 81.2 16.2** 24.9
Complex refinance loan
All borrowers (206/207) 55.7 77.7 22.0** 39.5
Prime borrowers (104/109) 57.2 78.8 21.6** 37.8
Subprime borrowers (102/98) 54.0 76.4 22.4** 41.5
Source: Lacko and Pappalardo, “Improving Consumer Mortgage Disclosures,” 70.
** Indicates significance at the 1 percent level.

jerry ellig and vera soliMan
481
OutcomesThe RIA identified the desired outcome of this rule as decreased settlement costs, which would make home owner ship more affordable for consumers. Decreased settlement cost is clearly an outcome of great interest to con-sumers. In economic terms, the reduction in settlement cost is a transfer to consumers. The cost reduction may lead to an improvement in economic effi-ciency if more consumers buy homes or refinance existing loans as a result.71
Table 6. Percentage of Respondents Who Could Not Correctly Identify Loan Costs, Terms, and Conditions
Redesigned Disclosures
Current Required
Disclosures (Tested in
FTC Study)(%)
Alternative Tested in
FTC Study (%)
Alternative Tested in Round 1
HUD Study (%)
Alternative Tested in Round 2
HUD Study (%)
APR 20 5 n/a n/a
Amount of cash due at closing 20 17 n/a n/a
Monthly payment 21 10 5 0
Settlement charges 23 8 9 3
Presence of balloon payment 30 30 7 10
Interest rate 32 20 7 0
Finance settlement charges 33 24 n/a n/a
Less expensive of two loans 37 24 27 14
Loan amount 51 13
Presence of a prepayment penalty
68 44 9 3
Presence of charges for optional credit insurance
74 30 n/a n/a
Reason why the interest rate and APR sometimes differ
79 59 n/a n/a
Property tax and homeowner’s insurance amount
84 21 n/a n/a
Total up- front cost 87 22 n/a n/a
Prepayment penalty amount 95 42 n/a n/a
Source: HUD, “Real Estate Settlement Procedures Act (RESPA),” 2-61.
Note: HUD marked cells as n/a when “the methodology of those surveys was diff er ent enough to preclude direct one- to- one comparison” with the FTC results. Ibid., 2-60.

regulatory iMPact analy sis oF Financial regulations
482
To test the theory that more straightforward disclosures could increase con-sumer understanding of loan and mortgage offers, and that this understand-ing could reduce consumer costs, HUD engaged a contractor to conduct six rounds of consumer surveys that tested revised GFE forms. Vari ous rounds of testing occurred from 2002 through 2007.
In the first two rounds of testing, consumers were asked to compare two loan offers using information from a redesigned GFE. In the first round of test-ing the revised GFE, 73 percent of people could identify the less costly loan. After further revision, round two increased this proportion to 90 percent. The third round of testing evaluated consumer understanding of a GFE with an alternative pre sen ta tion of discount points (i.e., the amount of money a con-sumer pays up- front to decrease the interest rate) and the yield spread premium. Under this GFE format, 93 percent of the participants correctly identified the cheaper loan.72
Both the FTC and HUD undertook consumer tests to determine whether disclosure of the yield spread premium had any effect on a consumer’s abil-ity to accurately compare the cost of diff er ent loans.73 Both agencies created information for a broker loan that was cheaper than a loan from a lender. The FTC tested several versions of GFE information with and without disclosure
Table 7. Identification and Se lection of Broker Loan as Cheaper Loan with and without YSP Disclosure
FTC Testing HUD Testing: Round 4
When YSP Is Disclosed
When YSP Is Not Disclosed
YSP Disclosed
YSP Not Disclosed
% Correctly selecting broker loan as cheaper
72 90 83 92
% Incorrectly identifying lender loan as cheaper
17 4 8 1
% Who would choose broker loan
70 85 72 88
% Who would choose lender loan
16 3 11 1
Source: HUD, “Real Estate Settlement Procedures Act (RESPA),” 3-40.

jerry ellig and vera soliMan
483
of the YSP. HUD tested one version of the GFE with and without a YSP dis-closure. Table 7 shows the results. In both sets of tests, a higher percentage of consumers identified and chose the cheaper loan when the YSP was not disclosed. The difference was narrower for HUD’s version of the GFE. In HUD’s test, 83 percent of consumers identified the cheaper loan when the YSP was disclosed, compared to 72 percent in the FTC’s test.
The FTC concluded that the disclosure of the YSP impaired the ability of borrowers to comparison- shop and that disclosure of the YSP introduced bias in the se lection pro cess that favored lenders over brokers.74
The fifth round of HUD testing sought to verify that consumers’ choices were the result of their understanding and not of a bias for or against a broker or a lender. All loan options included a YSP disclosure, but sometimes the bro-ker loan was cheaper, sometimes the lender loan was cheaper, and sometimes the loans cost the same.75 More than 90 percent of participants identified the cheapest loan, regardless of whether the broker loan or the lender loan was cheaper or the loans cost the same. A final round of testing included changes in the language on time frames and compensation to lenders, changes in the title, government recording and transfer charges, and an expansion of dis-closed loan terms to alert the borrower to potentially unfavorable changes in their obligations.76
Following these tests, the department expressed great confidence that the simpler and more straightforward pre sen ta tion of information in the proposed GFE form would improve the ability of the consumer to shop, compare offers, and identify the cheapest loan.77
Quant i ta t i ve Es t imates of OutcomesMultiple studies have estimated the typical percentage of the yield spread premium that accrues to the borrower to offset closing costs. Empirical studies have also demonstrated that consumers pay lower fees when they seek loans that require simpler shopping strategies.78 Since more informa-tive disclosures are expected to make it easier for consumers to shop, the RIA assumes that improved disclosures will increase the percentage of the YSP that offsets borrower closing costs, generating savings for borrowers. The RIA offers a primary estimate that improved disclosures will reduce origination fees by 14 percent, saving borrowers $5.88 billion. It estimates
regulatory iMPact analy sis oF Financial regulations
484
an additional $2.47 billion in savings on third- party fees that are partially due to improved disclosures and partially due to other aspects of the regula-tion that we have not considered here.79 (Unfortunately, the sizes of these effects are not broken out separately.) The RIA accurately labels these savings as transfers from loan originators and ser vice providers to borrowers, not social benefits.80 A separate analy sis quantifies the portion of the trans-fers that comes from small businesses.81 Another section pres ents extensive discussion of how the regulation would affect the competitive positions of vari ous types of lenders, mortgage originators, and third- party ser vice providers.82
The RIA notes that there is substantial uncertainty about the size of the likely consumer savings because the regulation could lead to substantial changes in mortgage markets.83 Rather than using this as an excuse to avoid quantification, the RIA quite properly performs a sensitivity analy sis to see how the results change when key input par ameters change. The sensitivity analy sis shows how the size of the transfers changes under several alterna-tive calculation methods. It also shows how the results change under dif-fer ent assumptions about the size of origination charges as a percentage of the loan value, dif fer ent levels of third- party fees, dif fer ent volumes of mortgage origination, dif fer ent percentages of consumer savings from improved disclosures, and dif fer ent percentages of transactions accounted for by small businesses.84 Alternative assumed input values are usually based on ranges of findings implied by studies or data sources, not just arbitrary assumptions.
The regulation generates an improvement in economic efficiency and social benefits if the savings that borrowers achieve as a result of more accurate dis-closures prompt more people to become homeowners. Multiple studies find that insufficient cash to pay up- front closing costs is a significant barrier to home owner ship, and they estimate the effect on home owner ship of cash grants to pay closing costs. Since consumer savings from more effective shop-ping also reduce up- front costs, the RIA uses the results of the cash grant stud-ies to estimate how the consumer savings from the regulation would affect home owner ship. It estimates that the savings from the regulation could lead 100,000 to 400,000 renters to become homeowners.85 It also estimates that the cost savings would generate between 500,000 and 3 million additional

jerry ellig and vera soliMan
485
refinancings, since refinancing becomes more attractive to more homeowners when the up- front cost falls.86
CONCLUSIONThe available evidence suggests that economic analy sis of financial regulations needs substantial improvement. But the evidence also suggests that there is no reason financial regulations are inherently more difficult to analyze. In fact, the regulatory impact analy sis for HUD’s RESPA disclosure regulation demonstrates that even for the step in the analy sis that most agencies neglect— analy sis of the prob lem the regulation seeks to solve—it is pos si ble to do quite good analy sis for a financial regulation.
Skeptics concerned with the current state of data and analytical techniques, which they regard as an obstacle to the quantification of all (or even most) benefits and costs of financial regulation, should find reassurance in HUD’s RESPA RIA. While it is true that financial regulation addresses prob lems that are diff er ent from the prob lems addressed by health, safety, or environmental regulation, success or failure can still be understood using numbers and units of mea sure ment like percentages and dollar values. To assess the need for the regulation, the RIA utilized studies that mea sured the percentage of consum-ers who correctly understood loan costs and other terms after reading the current mandated disclosures and several pos si ble alternatives. HUD found that the existing mandated disclosures confused consumers and enabled mort-gage originators to impose higher costs on consumers (the Woodward study and FTC study).
Estimating the improvement in consumer understanding expected to flow from clearer disclosures was the first step in estimating the expected benefits of the regulation. The RIA then proceeded to estimate potential savings to con-sumers, accompanied by a sensitivity analy sis that accounted for substantial uncertainties. The department determined that the asymmetric information prob lem could be mitigated by revising and simplifying mortgage cost disclo-sures, which would help consumers choose the lowest cost loan (FTC study, HUD study, comparison of results in RIA). The RIA also relied on studies that tested alternative disclosure forms, which helped to identify the sources of con-sumer confusion and identify ways to improve the disclosures (HUD study).
regulatory iMPact analy sis oF Financial regulations
486
HUD certainly did not let a lack of available data restrict the analy sis contained in this RIA. In fact, the Woodward study prepared for HUD and dis-cussed extensively throughout the RIA itself, states that “[HUD] is responsible for writing the regulations for and enforcing RESPA, but has, until this study, lacked any data with which it might assess its effectiveness.”87 In other words, upon realizing a need for data, the agency commissioned research from out-side scholars with expertise in consumer shopping be hav ior in the mortgage market and amassed a body of research to consult in the future.
The former administrator of the Office of Information and Regulatory Affairs (OIRA), Cass Sunstein, in an article describing his experience with OIRA review of RIAs, noted that “the most difficult prob lems appeared quite rarely, and when they did, there were generally standardized methods of handling them.”88 Our research suggests that Sunstein’s statement is as true of financial regulation as it is of other types of regulation. The appropriate course of action, therefore, is to undertake regulatory impact analy sis for financial regulations with the expectation that we will learn much more by trying than by cata loging prob lems that prevent perfect analy sis.
NOTES1. Posner and Weyl, “Cost- Benefit Analy sis of Financial Regulations.”
2. See, for example, Coates, “Cost- Benefit Analy sis of Financial Regulations”; Gordon, “Empty Call for Benefit- Cost Analy sis”; Cochrane, “Challenges for Cost- Benefit Analy sis.”
3. Exec. Order 12044, 43 Fed. Reg. (March 24, 1978): 12661; Exec. Order 12291, 46 Fed. Reg. (February 19, 1981): 13193; Exec. Order 12866, 58 Fed. Reg. (October 4, 1993): 51735; Exec. Order 13563, 76 Fed. Reg. (January 21, 2011): 3821.
4. Copeland, “Economic Analy sis and In de pen dent Regulatory Agencies”; and Peirce, “Economic Analy sis.”
5. Sunstein, “Financial Regulation and Cost- Benefit Analy sis.”
6. Exec. Order 12866, §1(b)(1).
7. Williams and Thompson, “Integrated Analy sis,” 1617.
8. Ellig, “Improving Regulatory Impact Analy sis,” 4.
9. Ellig, Broughel, and Bell, “Regulating Real Prob lems.”
10. McLaughlin, Ellig, and Shamoun, “Regulatory Reform in Florida.”
11. Posner and Weyl, “Benefit- Cost Paradigms.”
12. Muris, “Rules without Reason.”
13. Exec. Order 12866, §§ 1(a), 1(b)(2), 1(b)(3), 1(b)(8).
14. OMB, Circular A-4, 8–9.

jerry ellig and vera soliMan
487
15. Coglianese and Lazer, “Management- Based Regulation”; Prakash and Potoski, “Racing to the Bottom?”
16. Thaler and Sunstein, Nudge.
17. OMB, Circular A-4, 8.
18. Ibid., 17.
19. Ibid., 12.
20. Cochrane, “Challenges for Cost- Benefit Analy sis,” S99.
21. Hahn and Tetlock, “Has Economic Analy sis Improved Regulatory Decisions?”
22. The Mercatus Center has developed a survey instrument called the Regulatory Cost Calculator that agencies and stakeholders can use to gather more accurate information about opportunity costs. See http:// mercatus . org / publication / regulatory - cost - calculator.
23. Posner and Weyl, “Benefit- Cost Paradigms,” S17.
24. See, for example, Senate Committee on the Bud get, “Hearing,” 45.
25. Coates, “Cost- Benefit Analy sis of Financial Regulations,” 999– 1003; Gordon, “Empty Call for Benefit- Cost Analy sis,” S358– 60.
26. Coates, “Cost- Benefit Analy sis of Financial Regulation,” 891– 92.
27. Posner and Weyl, “Cost- Benefit Analy sis of Financial Regulations,” 247.
28. Cass Sunstein, former administrator of the Office of Information and Regulatory Affairs (OIRA), offers numerous stylized examples. See Sunstein, “Real World of Cost- Benefit Analy sis.” This argument is made in the specific context of financial regulation by Rose and Walker, “Importance of Cost- Benefit Analy sis,” 17– 18.
29. Alfon and Andrews, “Cost- Benefit Analy sis in Financial Regulation,” 344.
30. Posner and Weyl, “Cost- Benefit Analy sis of Financial Regulations,” 258.
31. Sunstein, “Real World of Cost- Benefit Analy sis,” provides several examples.
32. Posner and Weyl, “Cost- Benefit Analy sis of Financial Regulations,” 257.
33. Manne, “ Will the SEC’s New Embrace?,” 22.
34. Exec. Order 12866 §1(b)(7).
35. Alfon and Andrews, “Cost- Benefit Analy sis of Financial Regulation,” 339– 40.
36. “Eco nom ically significant” regulations have a material adverse effect on the economy or have an annual effect on the economy of $100 million or more. “Prescriptive” regulations are what most people think of when they think of regulations: they mandate or prohibit certain activities. This is distinct from bud get regulations, which implement federal spending programs or rev-enue collection mea sures. The Report Card methodology is explained in Ellig and McLaughlin, “Quality and Use of Regulatory Analy sis.” An explanation of the scoring method and all score data for the Mercatus Regulatory Report Card are available at http:// mercatus . org / reportcard.
37. Fraas and Lutter, “Challenges of Improving the Economic Analy sis”; Hahn et al., “Assessing Regulatory Impact Analyses”; Hahn and Dudley, “How Well Does the Government?”; Hahn and Litan, “Counting Regulatory Benefits and Costs.”
38. Harrington, Heinzerling, and Morgenstern, Reforming Regulatory Impact Analy sis; Morgenstern, Economic Analyses at EPA; McGarity, Reinventing Rationality.
39. Ellig and McLaughlin, “Quality and Use of Regulatory Analy sis.”

regulatory iMPact analy sis oF Financial regulations
488
40. Ellig, McLaughlin, and Morrall, “Continuity, Change, and Priorities”; Ellig and Conover, “Presidential Priorities.”
41. An evaluation of inter- rater reliability is available at http:// mercatus . org / reportcard.
42. Ellig, “Comprehensive Regulatory Impact Analy sis,” 5– 6.
43. Results are substantially the same when comparing median scores. Median scores for finan-cial regulations on each of the four criteria are either equal to or slightly higher than median scores for nonfinancial regulations.
44. A t- test found that none of the differences are significant at even the 10 percent level; that is, there is a greater than 10 percent likelihood that the differences are due to random chance. The conventional cutoff point in economics for judging whether a difference is “statistically significant” is a 5 percent or lower likelihood that the difference is due to random chance. Three of the Labor Department regulations on exemptions for provision of investment advice are closely related; two utilize the same RIA, and the third modified some assump-tions in the initial RIA. Differences in average scores are still not statistically significant when this RIA is included in the average only once.
45. Posner and Weyl, “Cost- Benefit Analy sis of Financial Regulations,” 262.
46. In this context, the term “best practices” means the best practices the Report Card evaluators have seen while evaluating regulatory impact analyses for eco nom ically significant regulations.
47. HUD, “Real Estate Settlement Procedures Act (RESPA),” 6-20.
48. Ibid., 6-5: “The current GFE is typically comprised of a long list of charges, as today’s rules do not prescribe a standard form and consolidated categories. Such a long list of individual charges can be overwhelming, often confuses consumers, and seems to provide little useful information for consumer shopping. The current GFE certainly does not inform consum-ers what the major costs are so that they can effectively shop and compare mortgage offers among diff er ent loan originators. The current GFE does not explain how the borrower can use the document to shop and compare loans. Also, the GFE fails to make clear the relation-ship between the closing costs and the interest rate on a loan, notwithstanding that many mortgage loans originated today adjust up- front closing costs due at settlement, either up or down, depending on whether the interest rate on the loan is below or above ‘par.’ Fi nally, current rules do not assure that the ‘good faith estimate’ is a reliable estimate of final settle-ment costs. As a result, under today’s rules, the estimated costs on GFEs may be unreliable or incomplete, and final charges at settlement may include significant increases in items that were estimated on the GFE, as well as additional fees, which can add to the consumer’s ulti-mate closing costs.”
49. Woodward, “Study of Closing Costs.” The report lists a date of 2008 because the study was not presented in public until then. It is listed in RIA references as Urban Institute, “A Study of Closing Costs for FHA Mortgages,” prepared for Department of Housing and Urban Development Office of Policy Development and Research by Susan E. Woodward, November 29, 2007b; and also referred to as “The HUD/FHA Study of Mortgage Closing Costs: Preliminary Report” in chapter 2 of the RIA and Urban Institute (2007b), 37–41.
50. HUD, “Real Estate Settlement Procedures Act,” 2-43.
51. Ibid.
52. Ibid., 2-51. The HUD study used the average educational attainment of the adults in the borrower’s census tract as a mea sure of education level because actual individual education levels are not known. The differences are calculated from regression analyses that control for the following borrower characteristics: loan amount, credit scores, income, whether borrow-ers were counseled and by whom, metropolitan area incomes, and borrower race, etc.

jerry ellig and vera soliMan
489
53. Ibid., 2-50.
54. Ibid.
55. Ibid., 2-42.
56. Woodward, “Study of Closing Costs,” 22 (also mentioned in RIA, chap. 2, 42n52).
57. McKernan, Wissoker, and Margrabe, “Descriptive Analy sis of FHA Loan Closing Costs.” According to the RIA, this study was conducted for internal use only (see the RIA references list, 17). The RIA refers to this study by two diff er ent short forms “Urban Institute 2007a” and “Urban Institute (2008).”
58. HUD, “Real Estate Settlement Procedures Act,” 6-21.
59. Ibid., 6-22, including table.
60. Ibid., 6-21.
61. Lacko and Pappalardo, “Improving Consumer Mortgage Disclosures.” Also referred to as “the FTC study.”
62. Lacko and Pappalardo, “Improving Consumer Mortgage Disclosures,” ES-3: “The current disclosure forms consisted of the Truth- in- Lending Act (‘TILA’) statement that is required for closed- end, fixed- rate residential mortgages under TILA, and the Good Faith Estimate of Settlement Costs (‘GFE’) required under the Real Estate Settlement Procedures Act (‘RESPA’).”
63. Lacko and Pappalardo, “Improving Consumer Mortgage Disclosures,” 31.
64. Ibid., 34: “The discount fee denotes a charge on the borrower in exchange for a lower interest rate than would other wise be charged on the loan. The term ‘discount’ refers to the lowered interest rate, not lowered fees. The discount fee is one of the required itemized settlement charges that must be disclosed in the GFE, if such a charge is included in the loan . . . roughly a third of the respondents misunderstood the term to indicate a discount received by the borrower, rather than a charge paid, and believed that the settlement fees were being discounted by the stated amount. . . .”
65. Lacko and Pappalardo, “Improving Consumer Mortgage Disclosures,” 31–37.
66. The results of twenty- five questions (or combinations of questions) were analyzed to assess the ability of respondents to understand and use the disclosure forms. Twenty- one questions were used in the simple- loan scenario because some of the loan terms were not pres ent in these loans.
67. Lacko and Pappalardo, “Improving Consumer Mortgage Disclosures,” 11.
68. HUD, “Real Estate Settlement Procedures Act,” 2-60.
69. Ibid., 3-35n21.
70. Ibid., 2-60: “Since no standardized good faith estimate (GFE) form exists, a form similar to many currently in use was created specifically for this purpose; both the FTC and the Department believe that the instrument is representative of mainstream practices.”
71. Ibid., 3-120. Of course, not every policy that incentivizes renters to become homeowners represents an improvement in economic efficiency. Improved disclosures that give consum-ers more accurate information about the cost of loans, however, reduce transaction costs and hence improve efficiency.
72. Ibid., 3-37, 3-39. According to the department, while this technique identifies how well participants use the GFE form as a stand- alone document in a testing situation, consumers using these forms in actual situations may perform even better because a loan originator and local consumer groups that focus on lending issues would be able to answer borrower ques-

regulatory iMPact analy sis oF Financial regulations
490
tions about the information on the forms and improve the borrower’s understanding of the form. The department notes that because none of these sources were available during the testing, the results should be viewed as underestimates of how much the new forms will help consumers who are actually obtaining financing to purchase a home or refinance an exist-ing loan.
73. Ibid., 3-39 (this is actually referring to Lacko and Pappalardo, “Effect of Mortgage Broker Compensation Disclosures”).
74. Ibid., 3-41.
75. Ibid., 2-43, 3-42.
76. Ibid., 3-45.
77. Ibid., 3-47.
78. Ibid., 3-92–93.
79. Ibid., 3-98.
80. Ibid., 3-103.
81. Ibid., 3-104–8.
82. Ibid., 3-131–51.
83. Ibid., 3-87.
84. Ibid., 3-108–15.
85. Ibid., 3-121–23.
86. Ibid., 3-123–24.
87. Woodward, “Study of Closing Costs,” viii.
88. Sunstein, “Real World of Cost- Benefit Analy sis,” 4.
REFERENCESAlfon, Isaac, and Peter Andrews. “Cost- Benefit Analy sis in Financial Regulation: How to Do It
and How It Adds Value.” Journal of Financial Regulation and Compliance 7, no. 4 (1999): 339– 52.
Coates, John C., IV. “Cost- Benefit Analy sis of Financial Regulations: Case Studies and Implications.” Yale Law Journal 124, no. 4 (January– February 2015): 882– 1011.
Cochrane, John H. “Challenges for Cost- Benefit Analy sis of Financial Regulation.” Journal of Legal Studies 43 (2014): S63– S105.
Coglianese, Cary, and David Lazer. “Management- based Regulation: Prescribing Private Management to Achieve Public Goals.” Law and Society Review 37, no. 4 (December 2003): 691–730.
Copeland, Curtis W. “Economic Analy sis and In de pen dent Regulatory Agencies.” Report prepared for the Administrative Conference of the United States, April 30, 2013.
Department of Housing and Urban Development (HUD), Office of the Assistant Secretary for Housing. “Real Estate Settlement Procedures Act (RESPA): Simplification and Improvement of the Pro cess of Obtaining Home Mortgages and Reducing Consumer Costs.” Regulatory Impact Analy sis, March 14, 2008.
jerry ellig and vera soliMan
491
Ellig, Jerry. “Improving Regulatory Impact Analy sis through Pro cess Reform.” Testimony before the US Congress Joint Economic Committee, June 26, 2013.
— — —. “Comprehensive Regulatory Impact Analy sis: The Cornerstone of Regulatory Reform.” Testimony before the Senate Committee on Homeland Security and Government Affairs, February 25, 2015.
Ellig, Jerry, James Broughel, and Spencer Bell. “Regulating Real Prob lems: The First Princi ple of Regulatory Impact Analy sis.” Mercatus on Policy, Mercatus Center at George Mason University, Arlington, VA, March 2016.
Ellig, Jerry, and Christopher J. Conover. “Presidential Priorities, Congressional Control, and the Quality of Regulatory Impact Analy sis: An Application to Health Care and Homeland Security.” Public Choice 161 (2014): 305– 20.
Ellig, Jerry, and Patrick A. McLaughlin. “The Quality and Use of Regulatory Analy sis in 2008,” Risk Analy sis 32 (2012): 855– 80.
Ellig, Jerry, Patrick A. McLaughlin, and John F. Morrall III. “Continuity, Change, and Priorities: The Quality and Use of Regulatory Analy sis across U.S. Administrations.” Regulation & Governance 7 (2013): 153– 73.
Fraas, Art, and Randall Lutter. “The Challenges of Improving the Economic Analy sis of Pending Regulations: The Experience of OMB Circular A-4.” Annual Review of Resource Economics 3, no. 1 (2011): 71– 85
Gordon, Jeffrey N. “The Empty Call for Benefit- Cost Analy sis in Financial Regulation.” Journal of Legal Studies 43, no. S2 (June 2014): S351– 78.
Hahn, Robert W., Jason Burnett, Yee- Ho I. Chan, Elizabeth Mader, and Petrea Moyle. “Assessing Regulatory Impact Analyses: The Failure of Agencies to Comply with Executive Order 12,866.” Harvard Journal of Law and Public Policy 23, no. 3 (2001): 859–71.
Hahn, Robert W., and Patrick Dudley. “How Well Does the Government Do Cost– Benefit Analy-sis?” Review of Environmental Economics and Policy 1, no. 2 (2007): 192–211.
Hahn, Robert W., and Robert Litan. “Counting Regulatory Benefits and Costs: Lessons for the U.S. and Eu rope.” Journal of International Economic Law 8, no. 2 (2005): 473– 508.
Hahn, Robert W., and Paul C. Tetlock. “Has Economic Analy sis Improved Regulatory Decisions?” Journal of Economic Perspectives 22, no. 1 (Winter 2008): 67– 84.
Harrington, Winston, Lisa Heinzerling, and Richard D. Morgenstern, eds. Reforming Regulatory Impact Analy sis. Washington, DC: Resources for the Future, 2009.
Lacko, James M., and Janis K. Pappalardo. “The Effect of Mortgage Broker Compensation Disclosures on Consumers and Competition: A Controlled Experiment.” Bureau of Economics Staff Report, Federal Trade Commission, 2004.
— — —. “Improving Consumer Mortgage Disclosures: An Empirical Assessment of Current and Prototype Disclosure Forms.” Staff Report, Federal Trade Commission, Bureau of Economics, Washington, DC, June 2007.
Manne, Henry G. “ Will the SEC’s New Embrace of Cost- Benefit Analy sis Be a Watershed Moment?” Regulation (Summer 2012): 20–25.
McGarity, Thomas O. Reinventing Rationality: The Role of Regulatory Analy sis in the Federal Bureaucracy. New York: Cambridge University Press, 1991.
McKernan, Signe- Mary, Doug Wissoker, and William Margrabe. “Descriptive Analy sis of FHA Loan Closing Costs.” Urban Institute for US Department of Housing and Urban Development, Washington, DC, May 9, 2007.

regulatory iMPact analy sis oF Financial regulations
492
McLaughlin, Patrick A., Jerry Ellig, and Dima Yazji Shamoun. “Regulatory Reform in Florida: An Opportunity for Greater Competitiveness and Economic Efficiency.” Florida State University Business Review 13, no. 1 (Spring 2014): 110– 15.
Morgenstern, Richard D. Economic Analyses at EPA: Assessing Regulatory Impact. Washington, DC: Resources for the Future, 1997.
Muris, Timothy J. “Rules without Reason.” Regulation (September– October 1982): 20– 26.
Peirce, Hester. “Economic Analy sis by Federal Financial Regulators.” Journal of Law, Economics, and Policy 9, no. 4 (2013): 569– 613.
Posner, Eric A., and E. Glen Weyl. “Benefit- Cost Paradigms in Financial Regulation.” Journal of Legal Studies 43, no. S2 (June 2014): S16– S25.
— — —. “Cost- Benefit Analy sis of Financial Regulations: A Response to Criticisms.” Yale Law Journal Forum (January 22, 2015): 246– 62.
Prakash, Aseem, and Matthew Potoski. “Racing to the Bottom? Trade, Environmental Governance, and ISO 14001.” American Journal of Po liti cal Science 50, no. 2 (April 2006): 350–64.
Rose, Paul, and Christopher Walker. “The Importance of Cost- Benefit Analy sis in Financial Regulation.” Report for the US Chamber of Commerce, March 2013.
Senate Committee on the Bud get. “Hearing: Moving to a Stronger Economy with a Regulatory Bud get.” Transcript, December 4, 2015.
Sunstein, Cass R. “Financial Regulation and Cost- Benefit Analy sis.” Yale Law Journal 124 (January 22, 2015): 263. http:// www . yalelawjournal . org / pdf / SunsteinPDF _ 4nf1d4ar . pdf.
— — —. “The Real World of Cost- Benefit Analy sis: Thirty- Six Questions (and Almost as Many Answers).” Columbia Law Review 114 (2015): 168– 212.
Thaler, Richard H., and Cass R. Sunstein. Nudge: Improving Decisions about Health, Welfare, and Happiness. New Haven, CT: Yale University Press, 2008.
Williams, Richard A., and Kimberly M. Thompson. “Integrated Analy sis: Combining Risk and Economic Assessments while Preserving the Separation of Powers.” Risk Analy sis 24, no. 6 (2004): 1613–23.
Woodward, Susan E. “A Study of Closing Costs for FHA Mortgages.” Urban Institute for US Department of Housing and Urban Development, Office of Policy Development and Research, Washington, DC, May 2008.