chapter 16 the coevolution of innovative ties, proximity
TRANSCRIPT

337© The Author(s) 2017 J. Glückler et al. (eds.), Knowledge and Networks, Knowledge and Space 11, DOI 10.1007/978-3-319-45023-0_16
Chapter 16The Coevolution of Innovative Ties, Proximity, and Competencies: Toward a Dynamic Approach to Innovation Cooperation
Uwe Cantner, Susanne Hinzmann, and Tina Wolf
The growing complexity and shortening of cycles inherent in the innovation process have changed the industrial and technological environment in which firms operate. The associated increase in uncertainty and costs accompanying R&D projects has shaped a landscape that favors collaboration (Hagedoorn, 2002). Especially in high- tech industries, where knowledge creation and accumulation is a crucial input factor and competition has become a learning race, joint research has steadily grown since the 1980s (Mowery, Oxley, & Silverman, 1996; Powell, 1998).
A basic feature of joint research is the exchange and sharing of knowledge among the cooperation partners. Actors choose research cooperation in the expecta-tion that it will maximize their potential gain in knowledge. In this context several scholars have stressed the importance that similarity between cooperation partners has for knowledge transfer and successful collaboration. Similarity determines with whom one connects, for it creates trust, facilitates knowledge flows, and increases the mutual attractiveness of potential collaboration partners (Boschma, 2005; McPherson, Smith-Lovin, & Cook, 2001). Similarity or proximity in three dimen-sions—cognitive, social, and competence-related—seems to play a cardinal role in knowledge exchange in collaborations intended to generate innovation.
These three dimensions are not simply exogenously given and static; they develop in the course of the partners’ collaboration. Continued collaboration even-tually leads trust, experience, and common understanding to increase and knowl-edge differences to decrease. These dynamics are expected to determine whether the
U. Cantner • S. Hinzmann • T. Wolf (*) Department of Economics, Friedrich Schiller University Jena, Carl-Zeiss-Straße 3, 07743 Jena, Germanye-mail: [email protected]; [email protected]; [email protected]
338
same partners always cooperate or whether they switch partners over time. Increasing trust, experience, and common understanding tend to contribute to the continuation of the partnership because they increase the efficiency of knowledge exchange and sharing. Conversely, the declining difference between knowledge stocks of continuously cooperating partners—that is, an increase in their cognitive proximity (the degree of similarity of their knowledge bases)—indicates that oppor-tunities to exchange and share knowledge have been exploited by them and should therefore lead to partner-switching.
Hence, the relation between certain proximity dimensions and continuation of collaboration is by no means unidirectional (Ter Wal & Boschma, 2011). In fact, individual characteristics (e.g., technological capabilities), and thus the proximity to others, coevolve with continuous collaboration (Balland, Boschma, & Frenken, 2015; Ter Wal & Boschma, 2011). These dynamics have undergone little empirical analysis (Balland et al., 2015). Although the coevolution of factors driving collaboration choice and the evolution of ties can be explored only with a dynamic approach, most of the studies on the relation between proximity and cooperation have been rather static (e.g., Cantner & Meder, 2007; Paier & Scherngell, 2011; Wuyts et al., 2005).
In this chapter we want to contribute to the field of dynamic approaches and analyze the interplay between cognitive proximity, knowledge exchange, and col-laboration. We focus our analysis on ties within innovator networks defined as an ensemble of direct and indirect connections, with the direct ones being research collaborations intended to produce innovations (Cantner & Graf, 2006). Tracking the individual actors and their collaborations over time, we pursue the following core research question: To what extent do knowledge dynamics between two coop-erating actors determine the continuation of their innovative ties? Accordingly, we concentrate mainly on the dynamics of partners’ cognitive proximity. In addition, we analyze the other two dimensions, trust and competencies, as further important covariates.
Our descriptive analysis suggests that firms are generally prone to switching their cooperation partner rather than to repeating the collaboration with that partner. We thus find that the knowledge transfer and cooperation that partners have experi-enced with each other have no significant effect on the likelihood that they will repeat their cooperation. Our empirical analysis also shows that cooperation is pro-moted by several factors: an overlap between the firms’ knowledge bases, an uneven distribution of the reciprocal potential for knowledge exchange, general collabora-tion experience of the partners, and similarity in the degree of popularity of the collaboration partners. We also find that firms prefer to cooperate with partners that are different in organizational nature and age.
We begin by providing a general overview of basic concepts and principle argu-ments that describe the relation between similarity in knowledge, experience, and their effect on tie formation. After characterizing how these relations dynamically coevolve with ongoing collaboration, we present our hypotheses. In the second sec-tion we explain our methodological approach, including descriptions of the data and variables. The third section presents the final results and our discussion of them. We conclude with suggestions for further research.
U. Cantner et al.
339
Knowledge Dynamics and the Evolution of Innovation Linkages
The Role of Cognitive Proximity, Social Proximity, and Similarity in Competencies in the Formation of Innovative Ties
The increased orientation to collaboration, especially in research and development (R&D), has led to an upsurge of studies analyzing the advantages and incentives that are encouraging the trend toward the formation of alliances (e.g., Ahuja, 2000; Gilsing, Nooteboom, Vanhaverbeke, Duysters, & van den Oord, 2008; Gulati, 1999; Hagedoorn, 2002; Hamel, 1991; Khanna, Gulati, & Nohria, 1998; Mowery et al., 1996; Powell, 1998). Essentially, most alliances are prompted by concerns about access to external resources that are too costly to be acquired internally (Kogut, Shan, & Walker, 1992). In innovation-oriented alliances the access to a partner’s technology and knowledge-related resources—be they a particular technical infra-structure or, more important, technological capabilities and complementary skills—is the primary motive for joint research, besides the sharing of risks and R&D costs (Hagedoorn, 2002). Firms, especially those in high-tech industries, are unable to generate internally all the resources they need in order to survive the rapid pace of technological change (Powell & Grodal, 2006). According to the knowledge-based view of the firm (which draws on the resource-based view of the firm originally proposed by Penrose, 1959), a firm’s knowledge base, understood as a unique resource difficult to imitate, is a key competitive advantage (Grant & Baden-Fuller, 1995). In this regard firms can be seen as bundles of competencies (Hamel, 1991, p. 83) that they have accumulated throughout their lifespan. Because environments and solutions to problems differ between firms, knowledge gathered by firms is an idiosyncratic property and quite heterogeneous among them (Cantner & Graf, 2011). Even firms operating in the same industry or market differ in what they know and what they are able to accomplish with their competencies. Although this propri-etary knowledge resource affords a basis for opportunities, its exploitation within the firm’s boundaries is limited and leads mostly to incremental, not necessarily optimal, improvements (Ahuja, 2000; March, 1991; Yang, Phelps, & Steensma, 2010). To broaden the knowledge base and explore new possibilities for recombina-tion and radical innovations, firms depend on external sources of knowledge (March, 1991; Yang et al., 2010). In looking for solutions to complex problems, successful innovators extend their search to the environment beyond their own boundaries (Freeman, 1991). The generation of knowledge and innovation thus results progres-sively from a collective learning process among various actors interacting formally or informally (Asheim & Gertler, 2005).
In innovation-oriented alliances rational actors choose their potential interaction partners according to the highest expected outcome in terms of successful knowl-edge exchange and potential innovations. The efficacy of knowledge exchange between two or more actors is governed by the degree of heterogeneity between
16 Coevolution of Innovative Ties, Proximity, and Competencies
340
them. The proximity approach, proposed originally by Boschma (2005), empha-sizes that similarity (conceptually the inverse of heterogeneity)—or, as he calls it, proximity—affects the ease of knowledge transfer between actors. He thereby dif-ferentiates between various dimensions of proximity whose prominence can differ from one type of alliance to another. In R&D alliances explicitly conceived to gen-erate novel ideas and innovations, cognitive proximity might predominate over other forms of proximity as the basis for potential knowledge flows, and social proximity (also called the strength of social ties between collaborators) might take precedence as the control mechanism for knowledge flows.
Understood as the similarity of knowledge bases, cognitive proximity can deter-mine the degree of knowledge exchange between actors through two central charac-teristics representing a trade-off in collective learning: mutual understanding and learning potential. Mutual understanding is the degree to which different actors comprehend each other, and it increases with cognitive proximity. Potential partners therefore need to exhibit some minimum degree of cognitive proximity to warrant mutual understanding.1 Learning potential has to do with the amount of what can be mutually learned, and it decreases with cognitive proximity. The heterogeneity of firms in knowledge space is a source of learning effects because relatively great dis-similarity can increase learning potential and the exchange of knowledge (Nooteboom, 2005).
The idea of combining the two dimensions of cognitive proximity—that of being a condition for mutual understanding and that of being a source of knowledge exchange—suggests the existence of an intermediate degree of proximity at which beneficial exchange of knowledge is maximized (Boschma, 2005; Gilsing et al., 2008; Nooteboom, 1999). A deviation from this level will lead either to increased potential for exchanging knowledge combined with lowered common understand-ing or to increased common understanding combined with lowered potential for novelty. Consequently, an actor conducting a strategic and rational search for a research partner should, at least theoretically, try to connect with a candidate who is similar in knowledge stocks and who partly complements his or her own so as to acquire the potential for creating novelty.
Besides the relevance of an optimal degree of cognitive proximity for under-standing and learning, the second condition for effective collaboration to take place is the controllability of the knowledge-exchange-and-sharing relation. It is here that social proximity comes in. Social proximity accounts for familiarity and trust between cooperation partners, two facets that facilitate the transfer of tacit knowl-edge and reduce the occurrence of opportunistic behavior. Trust affects the effi-ciency of knowledge transfer, for familiar and trusting partners have internalized
1 The concept of cognitive proximity is closely related to that of absorptive capacity (the ability to assimilate external knowledge). Absorptive capacity is largely a function of the extent to which the knowledge bases of collaboration partners are related (Boschma, 2005; Cantner & Meder, 2007; Cohen & Levinthal, 1990). A lack of absorptive capacities tends to result in a sharing of knowledge rather than in its exchange, for the partners are not able to integrate the external knowledge into their own knowledge stock.
U. Cantner et al.
341
norms of communication and can therefore improve their control of undesired behavior such as free riding (Granovetter, 2005). Hence, the cooperation with trusted partners warrants increased reciprocity for their efforts. Frequently proposed mechanisms for developing social proximity include mobile inventors, who often maintain social relations with their former workplace; the existence of positive experience gained in previous collaboration; familiarity with each other before cooperation; and acquaintance through a common partner (Ter Wal & Boschma, 2009). A strategic and rational actor should therefore prefer to link up with actors who are already in his or her circle of acquaintances. In addition to cognitive and social proximity as means to develop social proximity, Boschma (2005) suggested geographic, organizational, and institutional proximity between partners to support learning and innovation. For successful R&D collaboration and the generation of innovations, we assume that social and cognitive proximity outweigh other dimen-sions of proximity because the creation of new ideas and the generation of innova-tion is a costly and uncertain process primarily determined by the knowledge involved (Mowery, Oxley, & Silverman, 1998). In focusing on the examination of learning dynamics in R&D collaborations, we concentrate our argumentation on these two relevant dimensions of proximity. The likelihood of collaboration increases with the social proximity and shows an inverted-U relationship with respect to the cognitive proximity of the potential partners.
Recent empirical findings underpin these arguments. Despite the differences in measuring the proximity dimensions, the positive effect of social proximity on the probability of collaboration has become stylized fact in most of the studies on bilat-eral collaboration and the factors explaining its establishment and the exchange of knowledge (Ahuja, 2000; Broekel & Boschma, 2012; Cantner & Meder, 2007; Criscuolo, Salter, & Ter Wal, 2010; Gulati, 1995, 1999; Gulati & Gargiulo, 1999; Mowery et al., 1998; Paier & Scherngell, 2011; Powell, 1998; Singh, 2005).
The results concerning cognitive proximity’s effect on the probability of collabo-ration are less consistent, chiefly because it is difficult to find appropriate proxies and the divergence of applied measures. Paier and Scherngell (2011), Cantner and Meder (2007), and Singh (2005) found that knowledge proximity had a purely posi-tive effect on tie formation, whereas Criscuolo et al. (2010), Mowery et al. (1998), and Wuyts, Colombo, Dutta, and Nooteboom (2005) gave evidence of the inverted- U relationship between cognitive proximity and the proclivity to cooperate or to share knowledge as originally proposed by Nooteboom (1999). Consistently, Gilsing et al. (2008) and Wuyts et al. (2005) observed an inverted U-shaped curve also for the relation between cognitive proximity and the innovative performance of R&D projects. By contrast, Broekel und Boschma (2012) observed what is called the proximity paradox in their analysis of link formation and link performance in the aviation industry: Although proximity seemed to guide the formation of new R&D alliances, cognitive proximity especially hindered the innovative performance of the observed links.
Scholars have likewise identified factors that go beyond the link-specific prox-imity as inducers of opportunities for actors to collaborate. Among them are eco-nomic factors (e.g., accumulated capabilities and resources) and the general
16 Coevolution of Innovative Ties, Proximity, and Competencies
342
embeddedness of a firm in its relevant environment (e.g., the industry, the region). Signaling competence to other actors in the network (Ahuja, 2000; Stuart, 2000), both aspects enhance the perceived attractiveness of actors as a potential collabora-tion partner. In general, firms relatively well endowed with resources, such as inno-vative capabilities (past innovation activity) or technical capital (technology stock), can exploit more opportunities to form links than less well-endowed firms can, for potential partners perceive them as more competent than other firms and as better able to offer more knowledge and relevant information (Ahuja, 2000). In turn, the number of connections that the firm already possesses—its embeddedness—favors new collaborations. In network studies the popularity of actors (or centrality as defined by their number of linkages with other partners) is highly contingent on the degree of their popularity in prior periods. This continually recurring phenomenon, often referred to as preferential attachment (Barabási & Albert, 1999, p. 510),2 is attributable to two effects. First, highly connected actors have broader access to information about potential partners than less connected actors do (Gilsing et al., 2008). The more connections an actor has, the more information that actor auto-matically also has about the partners of his or her partners, and the more visible potential partners are. Second, potential partners perceive the central firm or actor as more attractive than other candidates because the information about the central actor diffuses more widely and quickly among a high number of potential partners than is the case with noncentral firms. Moreover, a high number of connections signals to potential partners a high level of competence and experience in managing and organizing alliances, a large repertoire of technical capabilities, and access to a broad and diverse knowledge pool (Ahuja, 2000; Gulati, 1999). Giuliani (2007), for instance, found that the most central actors in the knowledge network possess the most comprehensive knowledge base. The causal direction of this link is not clear, however.
Firms or actors do not have infinite capacity to establish new links. The returns on the creation of new links decrease with the total number of linkages because the costs of managing all the linkages increase as the information benefits decrease (Ahuja, 2000; Hagedoorn & Frankort, 2008). Besides, overembeddedness poses the risk of becoming locked in, of forfeiting access to novel and nonredundant informa-tion, and of thereby losing innovative potential (Gilsing et al., 2008; Uzzi, 1997). Corroborating this curvilinear relationship for the composition of linkages as well, Wuyts et al. (2005) found that the diversity of the collaboration portfolio positively influences innovativeness up to a certain optimal threshold. Actors whose popular-ity and opportunities are growing have to be increasingly selective in their partner choice (Ahuja, 2000).
In the context of mutual agreements on collaboration and the search for the opti-mal linkages out of a pool of potential partners, reciprocity becomes paramount. Firms or actors want a return on the effort and resources they invest in the collabora-tion. Reciprocity creates trust among the potential partners and makes collaboration
2 Preferential attachment essentially refers to the tendency of a network’s new entrants to be partial to connecting to central actors (Barabási & Albert, 1999).
U. Cantner et al.
343
more likely and sustainable (Cantner, Meder, & Wolf, 2011). Furthermore, the bal-ance between partners’ invested effort and reciprocated learning determines how well the alliance functions and how long it endures. Unilateral learning or an imbal-ance of resources might result in asymmetric bargaining power and dependency (Hamel, 1991; Khanna et al., 1998). Firms (actors) find that their attractiveness in terms of resources and efforts is reciprocated in collaborations with others similarly endowed. In sociological studies on the relations of individuals, the attractiveness of similarity has been termed homophily (McPherson et al., 2001; Rogers & Bhowmik, 1970). In the context of R&D collaborations, homophily might be driven by the search for reciprocity. If so, then actors similar in experience and competence will exhibit higher reciprocal potential than will dissimilar actors and will thus have mutual incentive to associate with each other (Cantner & Meder, 2007).
The Dynamics of Tie Formation
Although much work has been done to identify factors that lead to the formation of innovative alliances, little is known about the factors that determine the continua-tion3 of these alliances (Dahlander & McFarland, 2013). Because comprehensive longitudinal data on collaboration is difficult to find, most studies on innovation networks have relied on static analyses. Conceptual frameworks, too, such as Boschma’s proximity approach, are basically static in nature (Balland et al., 2015). In addition, the relation between the competence, proximity, and collaboration of a firm is characterized by strong interconnectedness. The embeddedness of firms also feeds back into the proximity to other actors, influencing their attractiveness as potential partners and future collaboration opportunities (Balland et al., 2015). The proximity of the partners changes throughout their bilateral collaboration as well, a shift that has consequences for its continuation. Both the underexplored coevolution of these factors and the evidence of the paradoxical effects of proximity and embed-dedness make it unclear whether collaboration alliances are finite (develop toward a specific date of expiration) and whether one can use an alliance’s continuation or termination to indicate an R&D alliance’s success. These coevolutionary processes can be captured only by dynamic approaches.
Advances in this direction have been recently made mainly in the research on networks by scholars such as Balland, de Vaan, & Boschma (2013), Broekel (2015), and Ter Wal (2014). They have developed frameworks for empirically analyzing the parallel development of proximity, structural embeddedness, and the overall linkage distribution. One of this literature’s foremost contributions has been the inclusion of endogenous network forces (the feedback effects of structural position in the net-work) as an explanation for the probability of link formation other than relational
3 In this chapter the continuation of a linkage is synonymous with its persistence, recurrence, or repetition. It is defined technically as the reappearance of a link over multiple years in our time frame of observations.
16 Coevolution of Innovative Ties, Proximity, and Competencies
344
effects (proximity) (Gilsing et al., 2008). Initial findings consistently have shown that the relevance of different proximity dimensions for the network configuration changes over time. Ter Wal (2014) elaborated the role of geographic proximity and triadic closure (which is close to social proximity; see Boschma & Frenken, 2010) in the network dynamics of the German biotech industry.4 He found that the effect of geographic proximity disappears over time, whereas the effect of social aspects increases in importance over time. Conversely, analysis of a creative industry, such as that of video games, showed that the effects of geographical and social proximity were pronounced throughout all stages of the industry, whereas cognitive aspects were relevant only in later stages (Balland et al., 2013). The interrelations between the various proximity dimensions have also come under study. Cognitive, social, institutional, and geographical proximity were found to coevolve over time, but the association between cognitive and institutional proximity did not decrease over time (Broekel, 2015). At the regional level, Cantner and Graf (2006) examined the net-work of innovators in Jena over two periods and found that the configuration of technological proximity among the actors changed over time in conjunction with the instability of collaboration. From this observation they concluded that the very process of knowledge exchange depletes the cooperation potential between two partners and eventually renders cooperation obsolete.
However, neither the various mechanisms that cause a change of proximities nor the association with actions at the microlevel has been sufficiently considered yet (Balland et al., 2013). Given this gap in the literature, we adopt a dynamic perspec-tive to take a step toward describing the coevolution of collaboration decisions, proximity, and competencies. By analyzing the endurance of innovative ties and relating them to the change in the underlying cognitive and social proximity and to the competencies of actors, we go beyond the mere explanation of the formation of these linkages.
Two opposite dynamics have been identified in the ongoing debate about the effects that social aspects and cognitive aspects have on the continuation and dis-continuation of collaborative ties, respectively. First, familiarity breeds trust and facilitates communication among partners (Gulati, 1995), so building up link- specific social capital and the social proximity it entails contributes to the continua-tion and stability of linkages (Cantner, Conti, & Meder, 2010; Gulati, 1995; Gulati & Gargiulo, 1999). Second, an increase in cognitive proximity between collaborat-ing partners fosters their mutual understanding but depletes the potential for novelty and reduces incentive to continue the collaboration (Wuyts et al., 2005). As for the development of innovation potential over time, we expect the positive returns of increased social proximity and mutual understanding between partners to be out-weighed by the negative returns of excessively similar knowledge bases. The argu-ment against long- term relations derives from the need for a diversity of knowledge for successful innovation (Nooteboom, 1998; Gilsing et al., 2008). In summary,
4 According to the concept of triadic closure, actors indirectly linked to one another by a third actor in period t - 1 are more likely to establish a direct link in period t than are actors with no indirect linkages (Ter Wal, 2014).
U. Cantner et al.
345
repeated ties accelerate the diffusion of information, whereas infrequent ties serve as a source of novel and nonredundant knowledge (Granovetter, 2005).
Cognitive Proximity
Adding to what has already been done, we unravel the multifaceted concept of cog-nitive proximity into overlap, reciprocal potential, and knowledge transfer and track their dynamics within the evolution of collaboration. Basically, the decision to form or maintain a link is continuously evaluated according to the potential gains in knowledge and in innovation (Hamel, 1991; Wuyts et al., 2005). The knowledge endowment of partners can be considered a pool of potential knowledge flows. For these flows to be take place, two conditions must be met. First, a certain minimum similarity of knowledge bases, the overlap, is necessary to provide a basis for mutual understanding. The ability to absorb external knowledge is largely a function of the relatedness of the knowledge bases of collaboration partners (Boschma, 2005; Cantner & Meder, 2007; Cohen & Levinthal, 1990). Second, the exchange of knowledge requires potential knowledge that can be acquired because it is novel for the partner and not similar to the knowledge that the partner already possesses. The implication is that the dissimilarity of knowledge bases is also fruitful for potential knowledge flows. Collaboration will be established or continued only if the expected knowledge gains are positive.
From a dynamic perspective partners move along this proposed scale of cogni-tive proximity by increasing their overlap when collaborations evolve. After col-laboration has been initiated, partners who are able to learn will experience an assimilation of knowledge bases that results in both an increase in overlap and a decrease in novelty potential (Balland et al., 2015; Nooteboom, 1998; Wuyts et al., 2005). The positive effects that overlap has on mutual understanding will eventually be offset by the negative effects on novelty creation (Balland et al., 2015). These dynamic reverse effects have been found in empirical studies on the persistence of collaboration between researchers (Dahlander & McFarland, 2013) and on the performance of continuing cooperation between organizations (Beaudry & Schiffauerova, 2011; Wuyts et al., 2005). At Stanford University, too much intel-lectual similarity (overlap) of the literature cited in publications by collaborating researchers has hampered the perpetuation of their collaborative ties (Dahlander & McFarland, 2013). Lack of diversity decreases innovative performance in repeated collaborations as patent rates and the quality of patents diminish in long- term col-laborations (Beaudry & Schiffauerova, 2011), and the less variation a collaboration portfolio has, the less likely it is to result in technical novelty (Wuyts et al., 2005). We therefore assume that strategic actors who seek to maximize the benefits of col-laboration for innovation will terminate their teamwork after it has exceeded the optimal level of overlap.
Hypothesis 1a The relation between the cognitive overlap of two actors and the likelihood of their continued collaboration follows an inverse-U curve.
16 Coevolution of Innovative Ties, Proximity, and Competencies
346
Considering only the sheer overlap of knowledge does not necessarily imply the full exploitation of learning potential, for the remaining novel and complementary knowledge in the partner’s knowledge base is not taken into account (Mowery et al., 1998). The need to broaden that perspective becomes especially relevant in a dynamic examination of collaborations. If the knowledge bases of partners increase disproportionally to the overlap, the novelty potential does not necessarily decrease with overlap over time. Remaining potential for novelty is a key incentive to con-tinue collaboration. Furthermore, collaborations as mutual agreements are estab-lished or continued only if both partners have incentives to engage in them. In general these incentives encompass a certain level of reciprocity: Actors want their invested efforts and competencies to be reciprocated. Seeking potential knowledge flows, actors search for collaboration that they can expect to reciprocate the amount of new knowledge they “offer” the partner (Cantner et al., 2011). The greater this reciprocal potential is, the more attractive they rate the collaborative opportunity to be (Cantner & Meder, 2007). In other words, the likelihood of collaboration increases as the knowledge gains of the respective partners approach equality (referred to as the increase in reciprocal potential). We assume that the search for reciprocity in knowledge gains is also relevant for the continuation of collaboration.
Hypothesis 1b The reciprocal potential between two actors is positively correlated with the likelihood of their continued collaboration.
Apart from overlap and reciprocal potential, the very process of learning by the partners has consequences for the continuation or termination of collaboration (Hamel, 1991; Khanna et al., 1998). We define learning as the outcome of success-ful knowledge transfer, that is, as the successful integration of external knowledge into the given partner’s own knowledge stock. This definition includes the possibil-ity that the newly integrated knowledge is applicable outside the cooperative activ-ity as well (Khanna et al., 1998). When learning potential has been exhausted and the associated knowledge has been transferred, the collaboration becomes obsolete to the partner who benefits from learning (Hamel, 1991). Learning also influences the power distribution among the partners. An asymmetry in learning might lead to an imbalance in bargaining power and dependency structures. Competitive collabo-ration can be understood as a learning race in which the “first learner” gains a higher bargaining power than the lagging partner, who thereby becomes less attractive (Hamel, 1991; Khanna et al., 1998). Hence, learning might cause the termination of collaboration by shifting the power balance and by decreasing innovative potential. In this regard the continuity of an alliance can be interpreted as learning failure rather than as success (Hamel, 1991). We hypothesize that the degree of learning determines the continuation of collaboration. In line with the cognitive and power- related arguments, our assumption is that effective knowledge exchange will decrease the incentives to maintain the collaboration. If, on the contrary, knowledge is only shared but not transferred, actors will retain sufficient diversity in knowledge to benefit from the continuation of the collaboration. We thus expect that knowledge
U. Cantner et al.

347
exchange between partners will lead to the termination of their collaboration, whereas mere knowledge-sharing will result in continued collaboration.
Hypothesis 1c Knowledge transfer between two actors is negatively correlated with the likelihood of their continued collaboration.
Social Proximity
In the case of the collaboration among researchers at Stanford University, a shared history likewise has increased the probability of continuing the relationship (Dahlander & McFarland, 2013). Established link-specific social capital seems to reinforce collaboration (Gulati, 1995). A reason for this conjecture lies in the effect that social proximity has on the degree of comfort that accompanies communica-tion. Social proximity is associated with trust, the establishment of mutually agreed social norms, and the control over undesired, noncooperative behavior such as opportunism (Boschma, 2005; Granovetter, 2005; Walker et al., 2003). Because social proximity is rooted in experience gained through successful cooperation, its supportive effects on knowledge exchange become increasingly evident with repeti-tion of the cooperation. In this sense, increasing trust could explain the persistence of cooperation observed for alliances of firms (e.g., Gulati, 1995; Mowery et al., 1998). However, the relevance of social aspects might be contingent on the context of the collaboration. Cantner et al. (2010), for instance, found that social capital as measured by the frequency of the contact plays a role only for innovative outcomes of cooperation with research institutes. In a dynamic context we expect that social proximity as indicated by the experience that partners have shared through coopera-tion on innovation will promote future collaboration, all other factors remaining the same.
Hypothesis 2 The likelihood of continued collaboration between two actors increases with their prior common experience.
Competence
Other factors that coevolve with collaboration and that are subject to temporal changes are the actor’s capabilities, overall experiences, and embeddedness in the overall network. Innovative capabilities and experience in managing collaborative agreements have been found to increase an actor’s attractiveness as a collaboration partner (Ahuja, 2000; Gulati, 1999; Stuart, 2000). As the number of innovative col-laborations increases, the experience in running an alliance, managing skills, and developing innovative capabilities mounts, attracting further potential partners. Assuming that the condition of reciprocity needs to be fulfilled if collaboration is to be maintained, we expect the likelihood of continued cooperation to be positively correlated with the combined innovative and collaborative experience of both partners.
16 Coevolution of Innovative Ties, Proximity, and Competencies
348
Hypothesis 3a The greater the general inventive or innovative experience of both partners is, the higher the likelihood of their continued collaboration.
Hypothesis 3b The greater the general collaboration experience of both partners is, the more likely it is that their collaboration will continue.
The embeddedness of an actor as defined by the number of collaborative ties that the actor has established also determines the number of opportunities for additional collaborations. The mechanism by which the rich eventually get richer explains a certain path dependency in the evolution of networks: Central actors tend to become more central over time (Barabási & Albert, 1999). This phenomenon is known as preferential attachment, or cumulative advantage (Barabási & Albert, 1999; Dahlander & McFarland, 2013). This process might be explained by the broad access that central actors have to information about potential partners and by the high visibility that central actors have for other potential partners (Ahuja 2000). However, the reciprocity criterion applies as well. When seeking to maximize the benefits of the collaboration, central actors are more likely to find that their invested efforts are reciprocated by actors who exhibit the same degree of popularity. Moreover, the bargaining power of central firms is greater than that of the less con-nected actor (Gilsing et al., 2008). If collaboration is to continue, then that power needs to be equally distributed among the partners so as to avoid unilateral depen-dence (Hamel, 1991). Partners are therefore more likely to connect with each other and to maintain this connection if they possess a similar number of collaborative ties (Dahlander & McFarland, 2013).
Hypothesis 3c The more similar the degree of popularity of two actors is, the more likely it is that their collaboration will continue.
Methodology
In our theoretical considerations we identified three main factors that might explain the repetition of innovative linkages in our longitudinal study: (a) cognitive proxim-ity between the cooperation partners, (b) social proximity between the cooperation partners, and (c) similarity in competencies that the partners bring to the collabora-tion. This section presents the database we used, the variables we created, and the methodology we applied.
Data
To construct potential and realized linkages, we used relational information found in patent applications. Successful collaboration leaves a trail in public patent data because patented inventions can be considered the output of a preceding intensive
U. Cantner et al.
349
cooperative research process (Singh, 2005). By definition, cooperative patents com-prise inventive success in this context. Although patent data come with certain limi-tations (see Griliches, 1990; Ter Wal & Boschma, 2009), they offer a rich and comprehensive database on inventive activities. While working with patents, one must carefully define the scope of analysis in order to avoid the bias stemming from unobserved heterogeneity in patenting behavior (across industries and nations, for example). To reduce this bias arising from intercountry and interindustry differ-ences, we narrowed our analysis to patents that were filed by German applicants in the field of biotechnology between 1978 and 2010. The biotech industry is charac-terized by a high propensity to patent and a high frequency of joint research (Griliches, 1990; Powell & Grodal, 2006; Ter Wal, 2014). We gathered the data from the OECD REGPAT database5 (January 2012 ed.), which covers patent appli-cations to the European Patent Office (EPO) and the United States Patent and Trademark Office (USPTO). To match the collaborative actors to their respective other patents, we used the OECD Harmonised Applicants’ Names (HAN) database, “which provides a dictionary of applicants’ names which have been elaborated with business register data, so that it can easily be matched by all users” (retrieved July 15, 2015, from http://www.oecd.org/sti/inno/oecdpatentdatabases.htm).
The use of patent data in our analysis requires some qualifications. First, our pool of potential collaborators encompassed all applicants with at least one patent appli-cation between 1978 and 2010. The influx of entries meant that this pool was not fixed over time; it grew from year to year, so we had to deal with an unbalanced panel. Second, a link between actors occurred when actors appeared together as applicants on one patent document (coapplication). The probability of false posi-tives in detecting collaborations was assumed to be very small because a coapplica-tion reduces the applicants’ claim to the patent. Third, it was debatable whether continuous cooperation was evident in patent data. If two applicants were persis-tently copatenting, we assumed that they were still conducting joint research. In this sense, we were able to identify long-lasting relationships but may have underesti-mated the number of ongoing partnerships that did not result in patents. Fourth, patents have been established as a measure of technological capabilities (Mowery et al., 1996). The suitability of patent data as a proxy for firms’ knowledge stock derives from the disaggregate information they convey. The International Patent Classification (IPC) offers a standardized and detailed technological classification system that enables one to assign the protected invention to a certain field of tech-nology and to characterize the firms’ research activities by constructing firm- specific technology portfolios (Griliches, 1990; Jaffe, 1986; Benner & Waldfogel, 2008).
5 “The OECD REGPAT database presents patent data that have been linked to regions according to the addresses of the applicants and inventors. The data have been ‘regionalised’ at a very detailed level so that more than 2 000 regions are covered across OECD countries. REGPAT allows patent data to be used in connection with other regional data such as GDP or labour force statistics, and other patent-based information such as citations, technical fields and patent holders’ characteristics (industry, university, etc.), thus providing researchers with the means to develop a rich set of new indicators and undertake a broad range of analyses to address issues relating to the regional dimen-sion of innovation.” (Maraut, Dernis, Webb, Spiezia, & Guellec, 2008, p. 3).
16 Coevolution of Innovative Ties, Proximity, and Competencies
350
Jaffe (1986) was one of the first researchers to use patent data as a proxy for tech-nological competencies of firms. He constructed the knowledge portfolios as a vec-tor of patent classes in which firms patented, and he computed the distances between technology vectors of firms to obtain a measure of proximity among them. Researchers subsequently adopted Jaffe’s approach in using patent classes to show a firm’s technology portfolio, technological distances among firms, or potential pools of knowledge spillover in the firm’s environment (Benner & Waldfogel, 2008; Boschma & Frenken, 2010; Cantner & Graf, 2006; Cantner & Meder, 2007). We, too, made use of this rich information by constructing the knowledge portfolios of the actors and tracing their changes over time. Because it is unfeasible to approxi-mate knowledge portfolios of the individual inventor by means of patent informa-tion, we focused our analysis on the organizational level.
Sample
The basic characteristics of the sample are presented in Table 16.1. The sample consisted of 197 firms that applied for patents with partners between 1983 and 2010, the period for which we sought to explain links between partners. Because our objective was to explain a link between actors by examining their prior patent-ing activities, we consulted patent information on the 5 years before the actors’ first link as of 1983. Our calculation of the variables is therefore based on all patents the two actors applied for between 1978 and 2010. To analyze the dynamics of coopera-tion choice, we considered only the 91 firms that had cooperated at least twice between 1983 and 2010, and we observed their collaborative behavior over the years that followed the firms’ first appearance in the dataset. When a firm was coop-erating in 1 year, we paired it with each of the potential cooperation partners that were active in the pool at the same time. The pool of a firm’s potential cooperation partners consisted of all patenting actors who were active in the focal year or had entered the sample before that point (Cantner & Meder, 2007). For all possible combinations, we assigned a 1 for each realized cooperation and a zero otherwise. Double pairs were excluded. The size of the pool of potential partners was nonde-creasing from year to year. It amounted to a maximum of 2369 potential partners.
By definition, the collaborations we looked at included the subject firm and, from the pool, one potential partner that could be of any type (e.g., firm, university), implying that the observations were not symmetric. All told, the 27-year span cov-ered by our analysis encompassed 321,683 possibilities to form dyads, of which 293 were ultimately realized.
When we grouped actors according to their overall collaboration activity over the whole period or over their all-time partner portfolio (Wuyts et al., 2005), we identified 106 firms that had collaborated only once (one-shot), 27 that had collabo-rated at least twice but with different partners (hop-on, hop-off), 24 that had col-laborated persistently with the same partner (persistent), and 40 that had pursued a mixed strategy (mixed-type). For the purpose of our analysis, we focused on the
U. Cantner et al.

351
firms that had collaborated at least twice (i.e., excluding the one-shot collaborators). As for the continuity of linkages, we found that 60 of the 293 linkages were persis-tent and that 138 did not recur. Most of the 293 linkages had been repeated once, and the maximum number of times that a link was subsequently observed to have recurred was 6.
Variables
We aim to explain the reappearance of linkages that were established between 1983 and 2010. Assume, for example, that we observed a certain firm to have cooperated with a partner in 1997 and that this link recurred in 1998. This activity is what we call repeated cooperation. Assume also that recurrence of this link ceased from 1999 on. With our analysis we seek to explain why the variable for cooperation (the
Table 16.1 Description of firms in the sample analyzed for the dynamics of cooperation, 1983–2010
Actors
Characteristics No.
Size of the pool of potential partners 2369 Cooperating firms 197 One-shot 106 Repeaters 91 Hop-on-Hop-off 27 Mixed-type 40 Persistent 24Partner diversity (collaboration partners of focal firms) Minimum 1 Maximum 17 Median 2
LinksPossible links 321,683 Realized links 293 Repeated links 60 Nonrecurring link 138Continuity of links (distribution of linkages across times of repetition, without duplicates) 0 138 1 41 2 11 3 3 4 3 5 1 6 1
16 Coevolution of Innovative Ties, Proximity, and Competencies

352
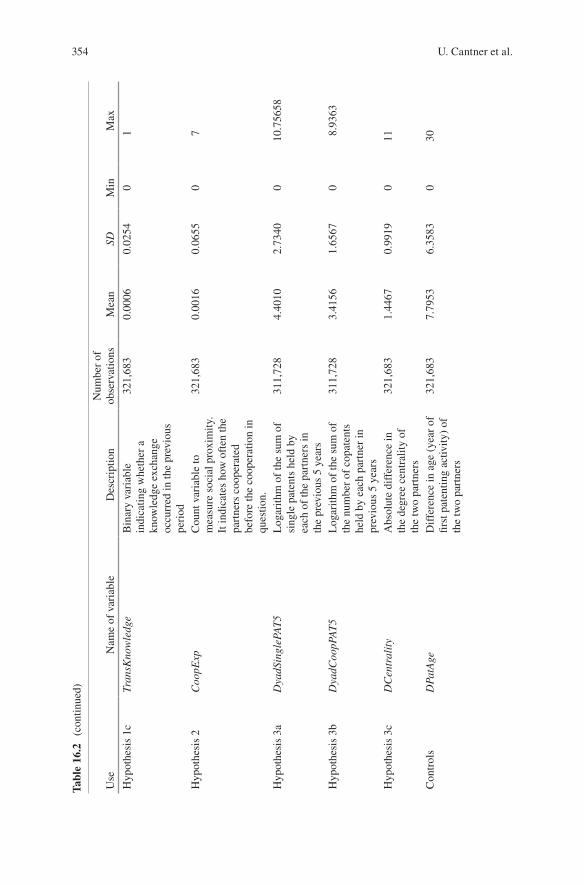
dependent variable) became zero after 1998. To do so, we constructed variables based on the cooperation partners’ characteristics that had accumulated in the years before the cooperative relationship in 1998. All explanatory variables have been lagged by 1 year. Assuming that collaboration was the outcome of a mutual agree-ment, we derived the explanatory variables (except for Knowledge Transfer, that is, TransKnowledge) by matching the attributes of a given firm with those of the part-ner it selected or was assigned to. In our analysis we have evaluated the mutual attractiveness of the collaboration opportunity according to social, technological, and experiential aspects of reciprocity. Table 16.2 gives a comprehensive descrip-tion of the variables used.
Dependent Variable
The dependent variable, Coop, represents the cooperation between two actors in the current year and is binary. It has the value of 1 if there is cooperation between the actors as a pair; zero, if there is no cooperation. With our interest in explaining con-tinuous collaboration and the dissolution of cooperation, previously existing nonre-curring links (expressed technically by the change of the dependent variable from 1 to zero) are detected by the variable for common experience (see Social proximity between the cooperation partners, below).
Independent Variables
Cognitive Proximity Between the Cooperation Partners
Overlap
A widely accepted procedure to operationalize the construct of cognitive proximity is to categorize the innovative pursuits of the actors in some way. For this purpose, the IPC offers a practical, detailed system for documenting their technological activities. In empirical studies it is claimed that the IPC is useful for measuring technological proximity as an aspect of cognitive proximity (Gilsing et al., 2008, pp. 1719–1720, 1723). In keeping with previous studies (e.g., Cantner & Graf, 2006; Cantner & Meder, 2007; Gilsing et al., 2008; Jaffe, 1986), we, too, adopted this resource to classify patent documents and used technological proximity as a proxy for the multifaceted concept of cognitive proximity.
To test hypothesis 1a, we included a simple measure used in previous studies (e.g., Singh, 2005; Cantner & Graf, 2006). To observe whether a minimum level of mutual understanding of both partners was guaranteed, we calculated the two part-ners’ overlapping areas of knowledge (technically, just the count of the IPC classes that partners or potential partners share). To correct for the fact that a potential overlap is more likely between firms with relatively large portfolios than between for firms with smaller ones, we divided the overlap by the sum of the IPC classes in
U. Cantner et al.

353
Tabl
e 16
.2
Des
crip
tion
of v
aria
bles
exp
lain
ing
the
reap
pear
ance
of
linka
ges
betw
een
part
ners
in th
e sa
mpl
e, 1
978–
2010
Use
Nam
e of
var
iabl
eD
escr
iptio
nN
umbe
r of
ob
serv
atio
nsM
ean
SDM
inM
ax
Dep
ende
nt
vari
able
Coo
pB
inar
y va
riab
le
indi
catin
g w
heth
er th
e pa
ir a
ctor
s co
oper
ated
in
a ce
rtai
n ye
ar
321,
683
0.00
090.
0302
01
Hyp
othe
sis
1aR
elO
verl
apC
ontin
uous
var
iabl
e in
dica
ting
the
over
lap
of
the
part
ners
’ kn
owle
dge
rela
tive
to th
e ov
eral
l kn
owle
dge
both
par
tner
s po
sses
s. M
easu
red
as th
e ra
tio o
f co
mm
on I
PC
clas
ses
to th
e su
m o
f al
l IP
C c
lass
es b
oth
part
ners
co
ver.
319,
323
0.05
197
0.06
620
0.5
Rel
Ove
rlap
2T
he s
quar
ed v
alue
s of
kn
owle
dge
over
lap
319,
323
0.00
710.
0158
00.
25
Hyp
othe
sis
1bR
eciP
otC
ontin
uous
var
iabl
e ra
ngin
g fr
om z
ero
to o
ne
and
mea
suri
ng th
e ra
tio
betw
een
the
min
imum
an
d m
axim
um o
f no
nove
rlap
ping
kn
owle
dge
clas
ses
of
both
par
tner
s. T
he h
ighe
r th
e va
lue,
the
clos
er th
e pa
rtne
rs a
re to
hav
ing
an
equa
l num
ber
of p
oten
tial
new
cla
sses
.
319,
256
0.23
070.
2730
01 (c
ontin
ued)
16 Coevolution of Innovative Ties, Proximity, and Competencies
354
Tabl
e 16
.2
(con
tinue
d)
Use
Nam
e of
var
iabl
eD
escr
iptio
nN
umbe
r of
ob
serv
atio
nsM
ean
SDM
inM
ax
Hyp
othe
sis
1cTr
ansK
now
ledg
eB
inar
y va
riab
le
indi
catin
g w
heth
er a
kn
owle
dge
exch
ange
oc
curr
ed in
the
prev
ious
pe
riod
321,
683
0.00
060.
0254
01
Hyp
othe
sis
2C
oopE
xpC
ount
var
iabl
e to
m
easu
re s
ocia
l pro
xim
ity.
It in
dica
tes
how
oft
en th
e pa
rtne
rs c
oope
rate
d be
fore
the
coop
erat
ion
in
ques
tion.
321,
683
0.00
160.
0655
07
Hyp
othe
sis
3aD
yadS
ingl
ePA
T5
Log
arith
m o
f th
e su
m o
f si
ngle
pat
ents
hel
d by
ea
ch o
f th
e pa
rtne
rs in
th
e pr
evio
us 5
yea
rs
311,
728
4.40
102.
7340
010
.756
58
Hyp
othe
sis
3bD
yadC
oopP
AT
5L
ogar
ithm
of
the
sum
of
the
num
ber
of c
opat
ents
he
ld b
y ea
ch p
artn
er in
pr
evio
us 5
yea
rs
311,
728
3.41
561.
6567
08.
9363
Hyp
othe
sis
3cD
Cen
tral
ity
Abs
olut
e di
ffer
ence
in
the
degr
ee c
entr
ality
of
the
two
part
ners
321,
683
1.44
670.
9919
011
Con
trol
sD
PatA
geD
iffe
renc
e in
age
(ye
ar o
f fir
st p
aten
ting
activ
ity)
of
the
two
part
ners
321,
683
7.79
536.
3583
030
U. Cantner et al.
355U
seN
ame
of v
aria
ble
Des
crip
tion
Num
ber
of
obse
rvat
ions
Mea
nSD
Min
Max
DSt
atus
Bin
ary
vari
able
in
dica
ting
whe
ther
the
part
ners
are
of
the
sam
e ty
pe: 1
mea
ns n
ot o
f th
e sa
me
type
, zer
o m
eans
bo
th p
artn
ers
are
firm
s.
321,
683
0.54
800.
4977
01
Inte
ract
ions
Tran
sKno
wle
dge
× C
oopE
xpIn
tera
ctio
n of
kno
wle
dge
Tran
sKno
wle
dge
with
C
oopE
xp
321,
683
0.00
100.
0560
07
Tran
sKno
wle
dge
× R
elO
verl
apIn
tera
ctio
n of
Tr
ansK
now
ledg
e w
ith
Rel
Ove
rlap
319,
323
0.00
010.
0035
00.
3478
16 Coevolution of Innovative Ties, Proximity, and Competencies

356
the portfolios of both partners, using the relative overlap as one measure of cogni-tive proximity (RelOverlap). We also included this measure as a quadratic term to capture the trade-off between minimum levels of knowledge overlap (as a warrant for mutual understanding) and maximum levels of overlap (as a hurdle that knowl-edge redundancy poses to innovation) (RelOverlap2).
Reciprocal Potential
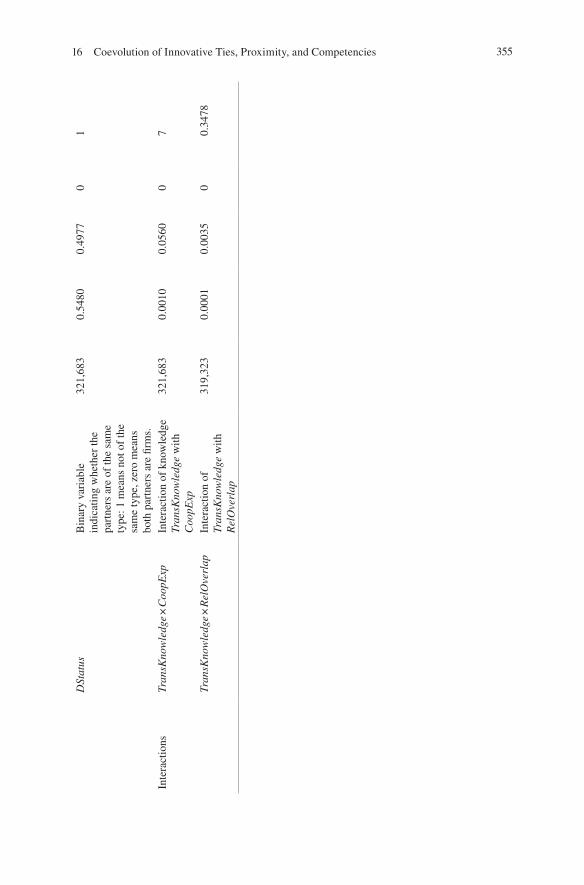
Following Cantner and Meder (2007), we tested hypothesis 1b by operationalizing the potential knowledge benefits from a potential collaboration as the relation between partner A’s and partner B’s new knowledge that is brought to the collabora-tion. However, we extended the approach of that earlier study by differentiating the individual classes that were new to the partner rather than solely considering the absolute number of patents. We counted the number of nonoverlapping IPC classes for each actor and took the ratio between the minimum number and the maximum number of new knowledge classes. This measure is named ReciPot. It is a continu-ous variable that ranges between 0 and 1, taking a 1 when the amount of new knowl-edge that the one partner offers is equal to that of the other (perfect reciprocity). The greater the divergence between the amount of partner A’s and partner B’s nonover-lapping knowledge (i.e., the less reciprocal the gain is between the partners), the more the measure of potential benefit approaches zero.
Knowledge Transfer
To test hypothesis 1c, we needed to measure the knowledge transfer between col-laborators. Citations of previous documents (patents and publications) pertaining to the patent have become a favored instrument with which scientific authors detect knowledge spillovers (e.g., Griliches, 1990; Hall, Jaffe, & Trajtenberg, 2001; Jaffe, Trajtenberg, & Henderson, 1993; Mowery et al., 1996; Nelson, 2009; Nomaler & Verspagen, 2008; Schmoch, 1993; Singh, 2005). A frequent criticism, however, has been that patent citations may not imply real knowledge flows, for many citations are added by the patent examiner rather than the inventor or applicant.
We took a different avenue and measured knowledge transfer between partners. To do so, we defined the vector of a firm’s patented technological classes as its cumulated knowledge stock and compared pre- and postcollaboration knowledge stocks. We defined knowledge transfer as the appearance of a new patent class in the firm’s patent portfolio after the collaboration had taken place (i.e., after the copatent had been filed).6 To attribute the portfolio changes to the cooperation, the newly added class had to have been part of the partner’s precollaboration knowledge base. This measure enabled us to differentiate pure knowledge-sharing (as the pure access to knowledge) from knowledge exchange (the integration of new knowledge into the firm’s own knowledge base). We assumed that if a class was subsequently
6 New in this context meant that the patent class did not appear in the firm’s precooperation portfo-lio before the application for the copatent.
U. Cantner et al.
357
assigned to single patents, then the knowledge had been successfully integrated and was applicable afterward without further collaboration. Used in conjunction with this procedure, the binary variable TransKnowledge indicates whether knowledge has been exchanged in prior collaborations. This variable takes the value 1 if either partner has gained new knowledge; otherwise it takes the value zero. That is, the variable captures both symmetric and asymmetric learning.
Our three measures of cognitive proximity—RelOverlap, ReciPot, and TransKnowledge—do not develop independently of each other. Their changes over time go hand in hand. Figure 16.1 illustrates the dynamics of these three variables. Two actors, I and II, hold specific knowledge portfolios before cooperating with each other (precollaboration). Actor I’s portfolio comprises ABCDEF; actor II’s, ABGH. The knowledge overlap in t-1 is given by AB and amounts to .2, relative to the overall knowledge. The reciprocal potential equals .5 because actor II possesses two knowledge units that actor I can gain as opposed to four knowledge units that actor II might be able to acquire from actor I. In other words, actor I can gain at most only half the amount of knowledge that actor II, the partner, stands to gain. Formulated differently, actor II can earn twice the amount of new knowledge that is being offered to actor I. In this example, the potential gains are unequal. Assume that collaboration then leads to symmetric learning in that C and G are exchanged. Actor I’s postcollaboration portfolio is thereby enlarged to ABCDEFG; actor II’s, to ABCGH. As a result, the overlap has increased to ABCEG and amounts now to .3 in relation to the overall knowledge possessed by the two firms. In turn, the ratio between the potential knowledge gains has decreased to .3 because actor II now offers only one new knowledge unit to actor I, whereas actor I now offers three knowledge units to actor II. The potential for knowledge flows has thus decreased and become more uneven. The attractiveness of this fictive alliance and the likeli-hood that it will continue have therefore declined. This example illustrates the case of knowledge having been efficiently exchanged. When actors collaborate but are unable to integrate new knowledge into their stock, then knowledge has only been shared and the collaboration is more likely to continue than if they are able to inte-grate the new knowledge. In this sense, a continuation of collaboration can be inter-preted as a failure to learn (Hamel, 1991).
Social Proximity Between the Cooperation Partners
To test whether the probability for the creation or re-creation of a link increases with the social proximity between the partners (hypothesis 2), we included a variable for common experience, CoopExp, as a proxy for social proximity. CoopExp measures how often the pair was cooperating prior to the cooperation in question. The number of prior research projects with the partner is commonly used as a measure of the strength of the tie and is assumed to capture the trust and ease of communication between the partners (Cantner & Meder, 2007).
16 Coevolution of Innovative Ties, Proximity, and Competencies

358
Similarity in Competencies
Innovative Capabilities
Patents are an approved proxy for innovative activities, for the number of patents an actor holds is highly correlated with that actor’s R&D activities (Mowery et al., 1996). To elaborate on the relation between accumulated technological capital and the continuation of linkages (hypothesis 3a), we therefore added up the single
Overlap t - 1 Overlap t + 1
Reciprocal Potential t - 1 Reciprocal Potential t + 1
Knowledge Transfer t - 1 Knowledge Transfer t + 1
Postcollaborationt + 1
t = CollaborationPrecollaboration t - 1
t
A B C D GE FIA B C D E FI
A B C G HIIA HGBII
Fig. 16.1 The dynamics in cognitive proximity and collaboration (Design by authors)
U. Cantner et al.
359
patents (not copatents) that both partners owned in the 5 years prior to their collabo-ration. We regarded that sum as a proxy for their accumulated innovative capabili-ties (DyadSinglePAT5). To delimit the domain of the variable, we took the logarithm of these values. We limited the observation period to the 5 years preceding the col-laboration of the two firms, assuming the knowledge to be almost obsolete thereaf-ter and accounting for the depreciation of innovative capabilities. Studies on the depreciations of R&D activities (Czarnitzki, Hall, & Oriani, 2006; Edworthy & Wallis, 2009; Hall, 2007) have indicated that R&D investment is completely depre-ciated after 3–5 years.
General Collaboration Experience Analogously, to capture the attractiveness of the collaboration opportunity in terms of management ease, we took the sum of the shared patents (copatents) that both actors held in the 5 years prior to the collabora-tion as a proxy for their accumulated collaboration experience (DyadCoopPAT5). Because we wanted to detect the general collaboration experience, we used this measure to add up all collaborations except the one in question. The greater the col-laborative experience is, the higher the likelihood of further collaborations. We also assumed average capability depreciation after 5 years and applied the logarithmic transformation to delimit the range of the variable.
Popularity Taking reciprocal incentives into account, Giuliani (2007) has argued that central actors who are popular (as measured by their number of other linkages) tend to connect to similarly embedded actors. We believe that the potential for knowledge spillovers might be greater when partners are equally popular and pos-sess a similar pool of potential knowledge sources (links). To test this relation (hypothesis 3c), we followed Dahlander and McFarland (2013) in using the abso-lute difference between the two partners’ degree of centrality (the number of links) in the year before actual or potential collaboration. We called this variable DCentrality. Theoretically, this measure is closely related to the general collabora-tion experience. In our analysis, however, it captures the reciprocity of popularity in collaboration activity rather than the pure amount of previous collaboration activity.
Control Variables
Apart from technological, social, and competence aspects, we also wanted to con-trol for additional effects stemming from organizational and age similarity. Both variables might increase the likelihood of collaboration due to ease of communica-tion when the cooperating partners are exposed to the same institutional factors and environments (organizational similarity) or when they have had the same amount of time to operate in these environments and to accumulate experience and resources (age similarity). Organizational dissimilarity—DStatus—is a binary variable taking the value 1 when the two actors differ in organizational nature and zero when they are of the same organizational type (interfirm collaboration). DPatAge is the
16 Coevolution of Innovative Ties, Proximity, and Competencies
360
absolute difference between the ages of the actors (measured as the length of time since their first patent application). Our age variable was also assumed to capture the effect of firm size because the age and the size of the firm are usually highly correlated.
Estimation Strategy
The choice of a pair of partners to cooperate was modeled as the probability of observing the realization of a link (coopi,j,t taking the value 1) contingent on the explanatory variables we have discussed in this section. The decision to collaborate in the form of a copatent is a binary one (see Fig. 16.2). We therefore estimate the following logistic model (see Kennedy, 2009).
We included all realized and potential i, j combinations over the period from 1983 to 2010. To prevent potential biases from confining our sample to collabora-tive actors only, we included all possible combinations between the focal firms and all actors who had patented at least once. However, inclusion of combinations with all potential actors in the sample (even those that have never collaborated) intro-duces a source of bias due to unobserved heterogeneity. That is, control-group dyads that were never realized might differ systematically in unobserved factors from dyads that were realized at least once. These differences in unobserved characteris-tics might account for systematic differences in the general propensity of actors to collaborate. Furthermore, other specific factors that are not observable and that therefore cannot be included in our model might have caused the formation of each dyad (Gulati & Gargiulo, 1999; Heckman, 1981). To account for pair-specific het-erogeneity, we applied a random-effects panel model by including a random inter-cept for each pair. We thereby assumed that the unobserved differences in the dyads were the results of a random process. However, this method also comes with the strong assumption that the unobserved factors are not correlated with any of the explanatory variables. This assumption is hard to test empirically. Conversely, the fixed-effects estimator would remove these time-invariant factors but would dra-matically shrink the size of the sample. This change would come at a cost: The number of observations would drop from more than 300,000 to 501. Moreover, random-effects estimation allows the model to include additional time-invariant variables, such as DStatus. Given these considerations, we preferred the random- effects over the fixed-effects model.
Another issue that arises in the analysis of network data is the dependence of observations. The observations are not completely independent; individual actors might be part of multiple dyads. Consequently, the estimates are consistent, but the standard errors might be underestimated (Kennedy, 2009). Because we could not make any distributional assumption, we obtained robust standard errors by resorting to bootstrapping methods for panel data. We calculated the standard errors from the empirical distribution that was drawn by resampling the original dataset in 1000 iterations. Another form of bootstrapping commonly used to analyze dyadic data is
U. Cantner et al.

361
that of gathering the empirical distribution by repeated random permutation of the complete adjacency matrix—an approach known as multiple regression quadratic assignment procedures (MRQAP). Although this method has proven to be appropri-ate for linear models with a continuous dependent variable, it is still unclear how it performs when employed to analyze binary models (Broekel, Balland, Burger, & van Oort, 2014; Dekker, Krackhardt, & Snijders, 2007). Besides, MRQAP has not been tested much in panel settings.
Results
Descriptives
Diversity in Partner Portfolio
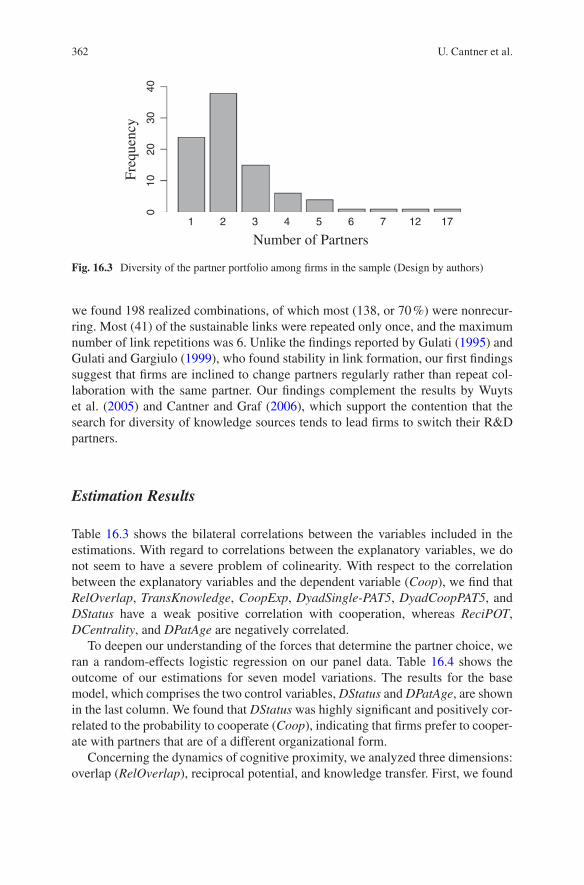
For an initial overview of the diversity of the firms’ partner portfolios, we consid-ered the number of different partners firms cooperated with in the years from 1978 to 2010. Table 16.1 contains summary statistics about the number of partners and the continuity of links. As shown by the distribution of actors across the different partners (see Fig. 16.3), most firms cooperated with two different partners, the median being 2. Only a few firms cooperated with a larger variety of actors. The maximum number of different partners in one portfolio was 17. In other words, one firm cooperated with 17 different actors during the period under study. For the firms in our sample, the implication was that repeated collaboration with only one partner was not a dominant behavior.
Dynamics of Link Formation
Concerning the recurrence of links, we found that 138 of the 293 realized links came about just once (nonrecurring), whereas 60 links were repeated at least once (the sum of repetitive links was 155). Without double-counting the repeated links,
Fig. 16.2 The model of the cooperation decision that is estimated to explain cooperation by the presented explanatory variables
16 Coevolution of Innovative Ties, Proximity, and Competencies
362
we found 198 realized combinations, of which most (138, or 70 %) were nonrecur-ring. Most (41) of the sustainable links were repeated only once, and the maximum number of link repetitions was 6. Unlike the findings reported by Gulati (1995) and Gulati and Gargiulo (1999), who found stability in link formation, our first findings suggest that firms are inclined to change partners regularly rather than repeat col-laboration with the same partner. Our findings complement the results by Wuyts et al. (2005) and Cantner and Graf (2006), which support the contention that the search for diversity of knowledge sources tends to lead firms to switch their R&D partners.
Estimation Results
Table 16.3 shows the bilateral correlations between the variables included in the estimations. With regard to correlations between the explanatory variables, we do not seem to have a severe problem of colinearity. With respect to the correlation between the explanatory variables and the dependent variable (Coop), we find that RelOverlap, TransKnowledge, CoopExp, DyadSingle-PAT5, DyadCoopPAT5, and DStatus have a weak positive correlation with cooperation, whereas ReciPOT, DCentrality, and DPatAge are negatively correlated.
To deepen our understanding of the forces that determine the partner choice, we ran a random-effects logistic regression on our panel data. Table 16.4 shows the outcome of our estimations for seven model variations. The results for the base model, which comprises the two control variables, DStatus and DPatAge, are shown in the last column. We found that DStatus was highly significant and positively cor-related to the probability to cooperate (Coop), indicating that firms prefer to cooper-ate with partners that are of a different organizational form.
Concerning the dynamics of cognitive proximity, we analyzed three dimensions: overlap (RelOverlap), reciprocal potential, and knowledge transfer. First, we found
1
010
2030
40
2 3 4 5
Number of Partners
Freq
uenc
y
6 7 12 17
Fig. 16.3 Diversity of the partner portfolio among firms in the sample (Design by authors)
U. Cantner et al.

363
Tabl
e 16
.3
Cor
rela
tion
betw
een
expl
anat
ory
vari
able
s an
d de
pend
ent v
aria
ble
(Coo
p)
Var
iabl
esC
oop
Rel
Ove
rlap
Rel
Ove
rlap
2R
eciP
otTr
ansK
now
ledg
eC
oopE
xpD
Cen
tral
ity
Dya
d Si
ngle
PAT
5D
yad
Coo
pPA
T5
DSt
atus
DPa
tAge
Coo
p1
Rel
Ove
rlap
0.04
71*
1R
elO
verl
ap2
0.06
73*
0.90
98*
1R
eciP
ot−
0.00
79*
0.20
81*
0.18
61*
1Tr
ansK
now
ledg
e0.
2332
*0.
0250
*0.
0219
*−
0.00
191
Coo
pExp
0.24
79*
0.02
65*
0.02
53*
−0.
0058
*0.
6577
*1
DC
entr
alit
y−
0.01
82*
−0.
0381
*−
0.02
55*
0.02
52*
0.00
59*
−0.
0004
1D
yadS
ingl
ePA
T5
0.01
05*
−0.
1366
*−
0.10
83*
−0.
4396
*0.
0241
*0.
0172
*0.
0222
*1
Dya
dCoo
pPA
T5
0.02
15*
−0.
1455
*−
0.10
79*
−0.
3693
*0.
0351
*0.
0298
*0.
0770
*0.
6526
*1
DSt
atus
0.01
23*
−0.
0120
*−
0.00
01−
0.06
52*
0.00
71*
0.00
58*
0.00
05−
0.11
69*
−0.
0053
*1
DPa
tAge
−0.
0021
−0.
2131
*−
0.16
84*
−0.
1866
*−
0.00
29−
0.00
46*
0.09
37*
0.16
38*
0.27
81*
−0.
0054
1
*p <
= .0
1
16 Coevolution of Innovative Ties, Proximity, and Competencies

364
that the squared term of the relative overlap (RelOverlap2) between the knowledge bases of the two partners had a highly significant positive correlation to the probability of collaboration. However, we found no evidence of a moderate overlap and, hence, no support for hypothesis 1a. When controlling for combined effects of experience and overlap (see the column labeled “Interactions”), we found only a pure positive correlation between overlap and the likelihood of collaboration. Thus, the degree of mutual understanding seems to increase the likelihood that linkages will be recreated.
Second, our impression of the search for diversity as illustrated in Fig. 16.2 was confirmed by the results of our estimation. We found that firms were more likely to reconnect with actors who differed from them in the amount of potentially new knowledge than with actors who were the same or similar in that respect. The nega-tive relation between reciprocal potential (ReciPot) and the likelihood of collabora-tion indicates that reciprocity in knowledge gains is not a necessary precondition for the continuity of collaborations. Our result was opposite to the assumed relation stated in hypothesis 1b.
Third, concerning hypothesis 1c, we did not find a significantly positive correla-tion between collaboration and previous knowledge transfer (TransKnowledge). Our results seem to contradict our hypotheses on the relevance of knowledge diver-sity in the evolution of cooperation. Concerning cognitive proximity, the need for mutual understanding seems to predominate over need for reciprocity in potential knowledge gains.
Regarding social proximity, we found no empirical connection between the chances for cooperation and prior common experience (CoopExp), a result that does not support our suggestion in hypothesis 2 that the propensity of collaboration increases with prior common experience.
Even though common experience did not play a significant role in partner choice among the firms in our sample, the combined overall cooperation experience (DyadCoopPAT5) was positively and significantly correlated with the re-creation of linkages. That is, choices to collaborate were preferred when at least one actor exhibited great capability in managing cooperation. This finding is consistent with the results reported by Gulati (1999), who observed the same supportive effect that an actor’s general experience with collaboration has on that actor’s chances of forming linkages. The importance of cumulative advantages is also reflected in the negative relation between collaboration propensity and the difference in the degree of popularity (DCentrality). Firms tended to seek reciprocal incentives when it came to accumulating experience and building their cooperation capability but not when they were interested in gaining knowledge benefits. Our results indicate that firms prefer to link up with actors who offer an equal amount of accumulated resources. Dahlander and McFarland (2013) found the same negative correlation between the difference between the “cumulative advantage” (p. 72) of both partners and the persistence of collaboration between researchers at Stanford University. Conversely, the common cumulative innovative potential as measured by the total number of single patents held by both actors (DyadSinglePAT5) seems rather irrel-evant when it comes to partner choice. Therefore, we find support for our hypothe-ses 3b and 3c but not for hypothesis 3a.
U. Cantner et al.

365
Tabl
e 16
.4
Est
imat
ion
resu
lts o
f th
e ra
ndom
-eff
ects
logi
stic
reg
ress
ion
(Met
hod)
—D
epen
dent
var
iabl
e C
oop
Exp
lana
tory
var
iabl
esH
ypot
hesi
s 1a
Hyp
othe
sis
1bH
ypot
hesi
s 1c
Hyp
othe
sis
2H
ypot
hese
s 3
a–c
Inte
ract
ions
Con
trol
s
Rel
Ove
rlap
5.56
5527
.077
7***
(1.5
8)(7
.79)
Rel
Ove
rlap
249
.711
0***
(5.5
9)R
eciP
ot−
2.24
86**
*(−
3.88
)Tr
ansK
now
ledg
e0.
9032
1.67
96(1
.19)
(1.5
3)C
oopE
xp0.
0077
−0.
1455
(0.0
3)(−
0.33
)D
yadS
ingl
ePA
T5
−0.
0431
(−1.
00)
Dya
dCoo
pPA
T5
0.61
09**
*9.
53D
Cen
tral
ity
−1.
1718
**−
1.97
Tran
sKno
wle
dge
× C
oopE
xp−
0.99
84(−
1.51
)Tr
ansK
now
ledg
e ×
Rel
Ove
rlap
−4.
3422
DSt
atus
1.24
70**
*1.
1283
***
0.99
80**
*1.
0228
***
1.10
42**
*1.
4245
***
1.02
15**
*(4
.18)
(4.3
9)(4
.40)
(4.2
9)(4
.42)
(4.0
6)(4
.15)
DPa
tAge
0.07
43**
*−
0.00
03−
0.00
41−
0.00
39−
0.03
93**
0.11
49**
*−
0.00
39(−
3.43
)(−
0.01
)(−
0.23
)(−
0.23
)(−
2.19
)(4
.69)
(−0.
23)
(con
tinue
d)
16 Coevolution of Innovative Ties, Proximity, and Competencies

366
Tabl
e 16
.4
(con
tinue
d)
Exp
lana
tory
var
iabl
esH
ypot
hesi
s 1a
Hyp
othe
sis
1bH
ypot
hesi
s 1c
Hyp
othe
sis
2H
ypot
hese
s 3
a–c
Inte
ract
ions
Con
trol
s
Con
stan
t−
20.9
707*
**−
17.1
154*
**−
14.1
513*
**−
14.3
361*
**−
14.8
631*
**−
24.0
424*
**−
14.3
457*
**(−
15.6
2)(−
13.0
9)(−
8.44
)(−
8.17
)(−
7.66
)(−
8.81
)(−
9.34
)N
o. o
f ob
serv
atio
ns31
9323
3192
5632
1683
3216
8331
1728
3193
2332
1683
No.
of
Gro
ups
1424
1714
2384
1429
8414
2984
1393
1814
2417
1429
84L
R c
hi2
−16
10.3
110
19.0
347
9.56
613.
0754
2.03
−16
04.7
−18
08.1
9Pr
ob >
chi
20.
0000
0.00
000.
0000
0.00
000.
0000
0.00
000.
0000
Wal
d ch
i2 (3)
33.0
819
.68
19.8
9W
ald
chi2 (
5)17
8.66
Wal
d ch
i2 (7)
146.
14W
ald
chi2 (
2)17
.62
Wal
d ch
i2 (4)
164.
27/ln
sig2
u3.
4286
3.22
342.
7003
2.73
822.
7401
3.60
292.
7404
Sigm
a_u
5.55
285.
0114
3.85
793.
9318
3.93
556.
0583
43.
9362
Rho
0.90
360.
8842
0.81
900.
8245
0.82
480.
9177
0.82
49
**m
eans
sig
nific
ant a
t 5 %
***m
eans
sig
nific
ant a
t 1 %
U. Cantner et al.
367
Our findings lend support to the hypothesis that similarity in knowledge and accumulated capabilities enhance the attractiveness of collaboration options and link maintenance. Nevertheless, firms also seek some degree of heterogeneity in the controls DStatus and DPatAge, for the probability of repeated collaboration increases when the partner is not a firm or when the partner is significantly different in patenting experience. However, these findings can be partially attributed to the specificities of research in biotechnology. One reason is that relationships between industry and the university are prevalent in German biotechnology. Because the innovation process is rather linear, with discoveries being introduced by public research institutes, collaboration between industry and the university is an impor-tant mechanism of technology transfer and thus increases its likelihood. Furthermore, the influence of the difference between the patenting ages of the partners might reflect another widespread form of collaborative combination in biotechnology: young, small companies as the creative engine of joint research and large pharma-ceutical companies as a source of financial resources (McKelvey, 1997; Powell, Koput, & Smith-Doerr, 1996; Ter Wal, 2014).
In summary, our findings generally suggest that both similarity and diversity of actors afford incentives to form alliances. Similarity plays a specific role in partner choice with regard to general collaboration experience (DyadCoopPAT5) and the accumulation of resources (DCentrality). Actors seek to connect to actors who can reciprocate their general collaboration expertise and provide a certain basis for mutual understanding. The reciprocity in knowledge gains and the amount of inno-vative capability seem to play a comparatively subordinate role. As far as organiza-tional similarity and patenting age are concerned, actors are inclined to choose diverse partners.
Conclusion and Further Research
The aim of this study was to elaborate on the coevolution of several attributes of cognitive proximity, social proximity, and similarity in competencies as collabora-tion between two actors progresses. We have contributed to the debate on whether networks are rather stable (i.e., with actors always cooperating with the same part-ners) or volatile (i.e., with actors changing partners regularly). Our findings suggest that firms are prone more to switching their cooperation partner than to repeating the collaboration with a given partner. We found no significant effect of knowledge transfer and prior common experience on repeated link formation. Instead, we found that firms prefer to cooperate with a partner whose knowledge bases and accumulated collaboration experience are rather similar to their own and whose organizational nature and patenting age are rather dissimilar to their own. We did not find evidence to support the hypothesis that potential for innovation and collabo-ration decreases as the overlap of the knowledge bases increases (Gilsing et al., 2008; Nooteboom, 1998; Wuyts et al., 2005).
16 Coevolution of Innovative Ties, Proximity, and Competencies
368
Our methodology has limitations and drawbacks that one must consider when interpreting the final results. First, the degree to which the number of linkages observable in our data matches that in the real world heavily depends on the patent-ing practices among actors (e.g., cross-patenting or cases in which a central institu-tion may administrate the patenting process and is therefore the only applicant). Including only those collaborations that are defined by coapplication might under-estimate the number of actual linkages. Yet if we were also to take account of the connections realized through shared inventors, we might overestimate the number of linkages (Ter Wal & Boschma, 2009). In addition, we expect the number of dis-regarded cases to be rather small because inventor mobility is rare in Europe (Ter Wal & Boschma, 2009). Crescenzi, Gagliardi, and Percoco (2013) estimated that barely 5 % of inventors change their employer. A closely related drawback to our methodology is the underrepresentation of informal ties, for we considered only formal collaboration agreements. Prior studies have emphasized the importance that informal ties have for innovative outcomes (e.g., Powell & Grodal, 2006), but it has been found that formal ties, especially in the life sciences, are generally preceded by informal ties (Powell et al., 1996). On this basis we argue that preceding informal ties are manifest in formal ties and are therefore captured in the study of the latter.
Second, by focusing on the research of the dynamics in bilateral R&D collabora-tion, we set aside the study of the effects of the micromechanism on the overall network structure. We thereby also opted to forgo explicit consideration of the feed-back effects that an actor’s position in the overall network has on partner choices at the microlevel. We tried to control for this limitation by incorporating information on whether an actor was highly connected (central) or rather peripheral and by adapting the standard errors accordingly. However, recent research on networks has made advances regarding the explicit modeling of endogenous structural mecha-nisms such as triadic closure and preferential attachment (Broekel et al., 2014). Our analysis could be extended by elaborating the overall network evolution as a result of partner choice at the microlevel, a selection that is itself determined by similarity and diversity aspects. Stochastic actor-oriented models, for instance, allow for examination of the relationship between the individual partner choice and overall network dynamics (Balland et al., 2013). In this context, however, it is debatable to what extent firms can directly influence and are aware of the network beyond their ego network (direct connections) (Gilsing et al., 2008).
The third concern about studies that focus on analyzing a certain pattern in a specific industry is the generalizability of their results. Application of our results is limited, for example, by the appearance of patterns that might be caused by industry specificities. However, some of the factors that our analysis identifies (e.g., positive effects of overlap, the reciprocal cumulative advantage, and reciprocal general col-laboration experience) have also been observed in other environments and at other levels of observations (Cantner & Meder, 2007; Dahlander & McFarland, 2013; Gulati, 1999).
In view of our results and the type of analysis suggested with this study, we have taken a further step in the effort to disentangle the coevolution of the proximity of collaboration partners and the formation and repetition of cooperative ties. In doing
U. Cantner et al.
369
so, we have already taken into consideration factors that go beyond dyadic relation-ships, factors such as network characteristics. Extending this dimension in future research will help improve the understanding of the dynamics of cooperation net-works at the core of clusters and of local and regional innovation systems.
References
Ahuja, G. (2000). Collaboration networks, structural holes, and innovation: A longitudinal study. Administrative Science Quarterly, 45, 425–455. doi:10.2307/2667105
Asheim, B. T., & Gertler, M. S. (2005). The geography of innovation: Regional innovation systems. In J. Fagerberg, D. Mowery, & R. Nelson (Eds.), The Oxford handbook of innovation (pp. 291–317). Oxford: University Press. doi:10.1093/oxfordhb/9780199286805.003.0011
Balland, P.-A., Boschma, R. A., & Frenken, K. (2015). Proximity and innovation: From statics to dynamics. Regional Studies, 49, 907–920. doi:10.1080/00343404.2014.883598
Balland, P.-A., de Vaan, M., & Boschma, R. A. (2013). The dynamics of interfirm networks along the industry life cycle: The case of the global video games industry, 1987–2007. Journal of Economic Geography, 13, 741–765. doi:10.1093/jeg/lbs023
Barabási, A.-L., & Albert, R. (1999). Emergence of scaling in real networks. Science, 286, 509–512. doi:10.1126/science.286.5439.509 [ISSN No. 1095–9203]
Beaudry, C., & Schiffauerova, A. (2011). Impacts of collaboration and network indicators on pat-ent quality: The case of Canadian nanotechnology innovation. European Management Journal, 29, 362–376. doi:10.1016/j.emj.2011.03.001
Benner, M., & Waldfogel, J. (2008). Close to you? Bias and precision in patent-based measures of technological proximity. Research Policy, 37, 1556–1567. doi:10.3386/w13322
Boschma, R. A. (2005). Proximity and innovation: A critical assessment. Regional Studies, 39, 61–74. doi:10.1080/0034340052000320887
Boschma, R. A., & Frenken, K. (2010). The spatial evolution of innovation networks: A proximity perspective. In R. A. Boschma & R. Martin (Eds.), The handbook of evolutionary economic geography (pp. 120–136). Cheltenham: Edward Elgar. doi:10.4337/9781849806497.00012
Broekel, T. (2015). The co-evolution of proximities—A network level study. Regional Studies, 49, 921–935. doi:10.1080/00343404.2014.1001732
Broekel, T., Balland, P.-A., Burger, M., & van Oort, F. (2014). Modeling knowledge networks in economic geography: A discussion of four empirical strategies. The Annals of Regional Science, 53, 423–452. doi:10.1007/s00168-014-0616-2
Broekel, T., & Boschma, R. A. (2012). Knowledge networks in the Dutch aviation industry: The proximity paradox. Journal of Economic Geography, 12, 409–433. doi:10.1093/jeg/lbr010
Cantner, U., Conti, E., & Meder, A. (2010). Networks and innovation: The role of social assets in explaining firms’ innovative capacity. European Planning Studies, 18, 1937–1956. doi:10.1080/09654313.2010.515795
Cantner, U., & Graf, H. (2006). The network of innovators in Jena: An application of social net-work analysis. Research Policy, 35, 463–480. doi:10.1016/j.respol.2006.01.002
Cantner, U., & Graf, H. (2011). Innovation networks: Formation, performance and dynamics. In C. Antonelli (Ed.), Handbook on the economic complexity of technological change (pp. 366–394). Cheltenham: Edward Elgar.
Cantner, U., & Meder, A. (2007). Technological proximity and the choice of cooperation partners. Journal of Economic Interaction and Coordination, 2, 45–65. doi:10.1007/s11403-007-0018-y
Cantner U., Meder, A., & Wolf, T. (2011). Success and failure of firms’ innovation co-operations: The role of intermediaries and reciprocity. Papers in Regional Science, 90, 313–329. doi:10.1111/j.1435-5957.2011.00366.x
16 Coevolution of Innovative Ties, Proximity, and Competencies
370
Cohen, W. M., & Levinthal, D. A. (1990). Absorptive capacity: A new perspective on learning and innovation. Administrative Science Quarterly, 35, 128–152. doi:10.2307/2393553
Crescenzi, R., Gagliardi, L., & Percoco, M. (2013). Social capital and the innovative performance of Italian provinces. Environment and Planning A, 45, 908–929. doi:10.1068/a45221
Criscuolo, P., Salter, A., & Ter Wal, A. (2010). Summer Conference 2010 on “Opening Up Innovation: Strategy, Organization and Technology”: The role of proximity in shaping knowl-edge sharing in professional services firms. London: Imperial College London Business School.
Czarnitzki, D., Hall, B. H., & Oriani, R. (2006). Market valuation of US and European intellectual property. In D. Bosworth & E. Webster (Eds.), The management of intellectual property (pp. 111–131). Cheltenham: Edward Elgar.
Dahlander, L., & McFarland, D. A. (2013). Ties that last: Tie formation and persistence in research collaborations over time. Administrative Science Quarterly, 58, 69–110. doi:10.1177/0001839212474272
Dekker, D., Krackhardt, D., & Snijders, T. A. B. (2007). Sensitivity of MRQAP tests to collinearity and autocorrelation conditions. Psychometrika, 72, 563–581. doi:10.1007/s11336-007-9016-1
Edworthy, E., & Wallis, G. (2009). Research and development as a value creating asset. In OECD and the swiss federal office of statistics (FSO), Productivity Measurement and Analysis (pp. 303–335). Paris: OECD. doi:http://dx.doi.org/10.1787/9789264044616-16-en
Freeman, C. (1991). Networks of innovators: A synthesis of research issues. Research Policy, 20, 499–514. doi:10.1016/0048-7333(91)90072-X
Gilsing, V., Nooteboom, B., Vanhaverbeke, W., Duysters, G., & van den Oord, A. (2008). Network embeddedness and the exploration of novel technologies: Technological distance, betweenness centrality and density. Research Policy, 37, 1717–1731. doi:10.1016/j.respol.2008.08.010
Giuliani, E. (2007). The selective nature of knowledge networks in clusters: Evidence from the wine industry. Journal of Economic Geography, 7, 139–168. doi:10.1093/jeg/lbl014
Granovetter, M. (2005). The impact of social structure on economic outcomes. Journal of Economic Perspectives, 19, 33–50. doi:10.1257/0895330053147958
Grant, R. M., & Baden-Fuller, C. (1995, August). A knowledge-based theory of inter-firm collabo-ration. In D. P. Moore (Ed.), Academy of Management Best Papers Proceedings 1995 (pp. 17–21). Fifth Annual Meeting of the Academy of Management, Vancouver. doi:10.5465/AMBPP.1995.17536229
Griliches, Z. (1990). Patent statistics as economic indicators: A survey. Journal of Economic Literature, 28, 1661–1707. doi:10.3386/w3301
Gulati, R. (1995). Does familiarity breed trust? The implications of repeated ties for contractual choice in alliances. Academy of Management Journal, 38, 85–112. doi:10.2307/256729
Gulati, R. (1999). Network location and learning: The influence of network resources and firm capabilities on alliance formation. Strategic Management Journal, 20, 397–420. doi:10.1002/(SICI)1097-0266(199905)20:5<397::AID-SMJ35>3.0.CO;2-K
Gulati, R., & Gargiulo, M. (1999). Where do interorganizational networks come from? American Journal of Sociology, 104, 1439–1493. doi:10.1086/210179
Hagedoorn, J. (2002). Inter-firm R&D partnerships: An overview of major trends and patterns since 1960. Research Policy, 31, 477–492. doi:10.1016/S0048-7333(01)00120-2
Hagedoorn, J., & Frankort, H. T. W. (2008). The gloomy side of embeddedness: The effects of overembeddedness on inter-firm partnership formation. In J. A. C. Baum & T. J. Rowley (Eds.), Network strategy (pp. 503–530). Advances in Strategic Management: Vol. 25. Binglay: Emerald Group Publishing limited. doi:10.1016/S0742-3322(08)25014-X
Hall, B. H. (2007). Measuring the returns to R&D: The depreciation problem (NBER Working Paper No. 13473). Cambridge, MA: National Bureau of Economic Research. doi:10.3386/w13473
Hall, B. H., Jaffe, A. B., & Trajtenberg, M. (2001). The NBER Patent Citations Data File: Lessons, Insights and Methodological Tools (NBER Working Paper No. 8498). Cambridge: National Bureau of Economic Research. doi:10.3386/w8498
U. Cantner et al.

371
Hamel, G. (1991). Competition for competence and interpartner learning within international stra-tegic alliances. Strategic Management Journal, 12(S1), 83–103. doi:10.1002/smj.4250120908
Heckman, J. J. (1981). Heterogeneity and State Dependence, NBER Chapters. In S. Rosen (Ed.), Studies in labor markets (pp. 91–140). Chicago: University of Chicago Press.
Jaffe, A. (1986). Technological opportunity and spillovers of R&D: Evidence from firms’ patents, profits and market value. American Economic Review, 76, 984–999. doi:10.3386/w1815
Jaffe, A. B., Trajtenberg, M., & Henderson, R. (1993). Geographic localization of knowledge spillovers as evidenced by patent citations. Quarterly Journal of Economics, 108, 577–598. doi:10.2307/2118401
Kennedy, P. (2009). A guide to econometrics (6th ed.). Cambridge: Wiley-Blackwell.Khanna, T., Gulati, R., & Nohria, N. (1998). The dynamics of learning alliances: Competition,
cooperation, and relative scope. Strategic Management Journal, 19, 193–210. doi:10.1002/(SICI)1097-0266(199803)19:3<193::AID-SMJ949>3.0.CO;2-C
Kogut, B., Shan, W., & Walker, G. (1992). The make or cooperate decision in the context of an industry network. In N. Nohria & R. Eccles (Eds.), Networks and organizations: Structure, form, and action (pp. 348–365). Boston: Harvard Business School Press.
Maraut, S., Dernis, H., Webb, C., Spiezia, V., & Guellec, D. (2008, June 3). The OECD REGPAT database: A presentation (OECD Science, Technology and Industry Working Papers No. 2008/02). doi:10.1787/241437144144
March, J. G. (1991). Exploration and exploitation in organizational learning. Organization Science, 2, 71–87. doi:10.1287/orsc.2.1.71
McKelvey, M. (1997). Coevolution in commercial genetic engineering. Industrial and Corporate Change, 6, 503–532. doi:10.1093/icc/6.3.503
McPherson, M., Smith-Lovin, L., & Cook, J. M. (2001). Birds of a feather: Homophily in social networks. Annual Review of Sociology, 27, 415–444. doi:10.1146/annurev.soc.27.1.415
Mowery, D. C., Oxley, J. E., & Silverman, B. S. (1996). Strategic alliances and inter-firm knowl-edge transfer. Strategic Management Journal, 17, 77–91. doi:10.1002/smj.4250171108
Mowery, D. C., Oxley, J. E., & Silverman, B. S. (1998). Technological overlap and interfirm coop-eration: Implications for the resource-based view of the firm. Research Policy, 27, 507–523. doi:10.1016/S0048-7333(98)00066-3
Nelson, A. J. (2009). Measuring knowledge spillovers: What patents, licenses and publications reveal about innovation diffusion. Research Policy, 38, 994–1005. doi:10.1016/j.respol.2009.01.023
Nomaler, Ö., & Verspagen, B. (2008). Knowledge flows, patent citations and the impact of science on technology. Economic Systems Research, 20, 339–366. doi:10.1080/09535310802551315
Nooteboom, B., (1998). Cost, quality and learning based governance of buyer-supplier relations. In M. G. Colombo (Ed.), The changing boundaries of the firm (pp. 187–208). London: Routledge. doi:10.4324/9780203443408.pt3
Nooteboom, B. (1999). Innovation and inter-firm linkages: New implications for policy. Research Policy, 28, 793–805. doi:10.1016/S0048-7333(99)00022-0
Nooteboom, B. (2005). Learning and governance in inter-firm relations (Center for Economic Research Discussion Paper No. 2005–38). Tilburg, The Netherlands: Tilburg University. Retrieved from https://pure.uvt.nl/portal/files/773588/38.pdf
Paier, M. F., & Scherngell, T. (2011). Determinants of collaboration in European R&D networks: Empirical evidence from a discrete choice model. Industry and Innovation, 18, 89–104. doi:10.1080/13662716.2010.528935
Penrose, E. G. (1959). The theory of the growth of the firm. New York: Oxford University Press.Powell, W. W. (1998). Learning from collaboration: Knowledge and networks in the biotechnol-
ogy and pharmaceutical industries. California Management Review, 40, 228–240. doi:10.1002/9780470755679.ch14
Powell, W. W., & Grodal, S. (2006). Networks of innovators. In J. Fagerberg, D. C. Mowery, & R. L. Nelson (Eds.), The Oxford handbook of innovation (pp. 56–85). Oxford: University Press. doi:10.1093/oxfordhb/9780199286805.003.0003
16 Coevolution of Innovative Ties, Proximity, and Competencies
372
Powell, W. W., Koput, K. W., & Smith-Doerr, L. (1996). Interorganizational collaboration and the locus of innovation: Networks of learning in biotechnology. Administrative Science Quarterly, 41, 116–145. doi:10.2307/2393988
Rogers, E. M., & Bhowmik, D. K. (1970). Homophily–heterophily: Relational concepts for com-munication research. Public Opinion Quarterly, 34, 523–538. doi:10.1086/267838
Schmoch, U. (1993). Tracing the knowledge transfer from science to technology as reflected in patent indicators. Scientometrics, 26, 193–211. doi:10.1007/BF02016800
Singh, J. (2005). Collaborative networks as determinants of knowledge diffusion patterns. Management Science, 51, 756–770. doi:10.1287/mnsc.1040.0349
Stuart, T. E. (2000). Interorganizational alliances and the performance of firms: A study of growth and innovation rates in a high-technology industry. Strategic Management Journal, 21, 791–811. doi:10.1002/1097-0266(200008)21:8<791::AID-SMJ121>3.0.CO;2-K
Ter Wal, A. L. J. (2014). The dynamics of the inventor network in German biotechnology: Geographic proximity versus triadic closure. Journal of Economic Geography, 14, 589–620. doi:10.1093/jeg/lbs063
Ter Wal, A. L. J., & Boschma, R. A. (2009). Applying social network analysis in economic geog-raphy: Framing some key analytical issues. The Annals of Regional Science, 43, 739–756. doi:10.1007/s00168-008-0258-3
Ter Wal, A. L. J., & Boschma, R. A. (2011). Co-evolution of firms, industries and networks in space. Regional Studies, 45, 919–933. doi:10.1080/00343400802662658
Uzzi, B. (1997). Social structure and competition in interfirm networks: The paradox of embed-dedness. Administrative Science Quarterly, 42, 35–67. doi:10.2307/2393808
Walker, W. E., Harremoes, P., Rotmans, J., Van der Sluijs, J. P., Asselt, M. B. A., Janssen, P., & Krayer von Krauss, M. P. (2003). Defining uncertainty: A conceptual basis for uncertainty management in model-based decision support. Integrated Assessment, 4, 5–17. doi:10.1076/iaij.4.1.5.16466
Wuyts, S., Colombo, M. G., Dutta, S., & Nooteboom, B. (2005). Empirical tests of optimal cogni-tive distance. Journal of Economic Behavior & Organization, 58, 277–302. doi:10.1016/j.jebo.2004.03.019
Yang, H., Phelps, C. C., Steensma, K. (2010). Learning from what others have learned from you: The effects of knowledge spillovers on originating firms. Academy of Management Journal, 53, 371–389. doi:10.5465/AMJ.2010.49389018
Open Access This chapter is distributed under the terms of the Creative Commons Attribution 4.0 International License (http://creativecommons.org/licenses/by/4.0/), which permits use, duplica-tion, adaptation, distribution and reproduction in any medium or format, as long as you give appro-priate credit to the original author(s) and the source, provide a link to the Creative Commons license and indicate if changes were made.
The images or other third party material in this chapter are included in the work’s Creative Commons license, unless indicated otherwise in the credit line; if such material is not included in the work’s Creative Commons license and the respective action is not permitted by statutory regu-lation, users will need to obtain permission from the license holder to duplicate, adapt or reproduce the material.
U. Cantner et al.