the coevolution of organizational knowledge and market technology · · 2016-03-14the coevolution...
TRANSCRIPT
The Coevolution of Organizational Knowledge and Market Technology
Elizabeth G. Pontikes
University of Chicago Booth School of Business
William P. Barnett
Stanford Graduate School of Business
January 2016
Keywords: Organizational coevolution, organizational knowledge, organizational learning, innovation,
technological change, computers, microprocessors
Thanks to Glenn Carroll, Jerker Denrell, Mike Hannan, Olga Khessina, Jesper Sørensen, Giacomo Negro,
Hayagreeva Rao, and Olav Sorenson for comments and advice, and the University of Chicago Booth
School of Business and Stanford Graduate School of Business for support. This work is partially
supported by the Charles E. Merrill Faculty Research Fund at the University of Chicago Booth School of
Business.
1
The Coevolution of Organizational Knowledge and Market Technology
Abstract
A coevolutionary approach to knowledge strategy is developed, where variant positions
in knowledge space are predicted to result in differential advantages in product space. In
particular, advantages to being both consistent and specialized in knowledge space are predicted
to generate advantages in product space. Results in support of this prediction are found in an
analysis of the history of the computer industry. The theory advanced has implications for both
technology strategy and for researchers interested in introducing choice to evolutionary models
of organizations.
2
The Coevolution of Organizational Knowledge and Market Technology
Evolutionary thinking has progressed in the strategy field in recent years, with
developments across a broad range of theoretical perspectives, including complexity theory
(Siggelkow and Rivkin, 2009) evolutionary economics ( Knudsen et al, 2013), technology
studies (Eggers, 2014), and organizational ecology (Khessina and Carroll, 2008) – to name just a
few. Meanwhile, the field of strategic management continues to emphasize the importance of
decision making and leadership, and to benefit from recent advances in the variety of disciplines
that focus on decision making. A noteworthy feature of the strategy field is that it allows such
incompatible bedfellows to lie together, if not in harmony, then at least in parallel. Paging
through a journal in the field one will read an evolutionary analysis describing processes of
variation and selective retention akin to biology, and then move on to a study of behavioral
decision making and its effects on firm strategies.
In this paper, we take a coevolutionary analysis of strategy, and in the process emphasize
the importance of decision making. Far from being purely “systemic,” akin to biology, our
approach draws heavily on cultural anthropological theory and in so doing introduces choice to
the coevolutionary model. We do this in a study of organizational strategies in two distinct, but
related areas: organizational knowledge and products. Describing variation and selection within
each of these “spaces,” we then model the coevolution of the two using data from the history of
the computer industry. Choice turns out to shape this coevolution in two ways. First, choices by
organizations shape the variant positions that they take in knowledge space. Second, these
knowledge positions, in turn, help to determine which organizations are advantaged in product
3
space. Certain choices in knowledge space thus trigger and constrain the ability to make choices
in product space, as organizations coevolve in both areas.
Knowledge Space and Market Space: Two Systems of Organizational Learning
Research highlights two domains where organizational learning takes place. One
involves organizations interacting directly with the resource environment – for example business
firms interacting with their markets. In this setting, organizations learn by doing, taking in new
information from the environment and adjusting activities accordingly (Argote, 1999; Greve,
2003). Another domain encompasses the research and development (R&D) activities carried out
by organizations. How organizations develop knowledge through R&D and its implications for
an organization’s innovative behavior is the central focus of this research tradition (Pisano, 1990;
Sørensen and Stuart, 2000). Over time, organizations build up a base of knowledge from their
R&D activities, enabling them to adopt new technologies embodied in new products or services.
Organizational learning occurs within each of two distinct but related domains: experientially
through market interaction, and by knowledge development through R&D.
At any point in time, an organization can be located within each of these two domains. In
“market space,” an organization’s location is based on the products and services that it offers
(Hannan and Carroll, 2000). We also can place organizations in “knowledge space” according to
the knowledge they have developed through R&D. Following Stuart and Podolny (1996), we
locate organizations in an n-dimensional knowledge space based on whether their knowledge is
similar, measuring similarity using citation patterns of their patents (Podolny, Stuart and Hannan,
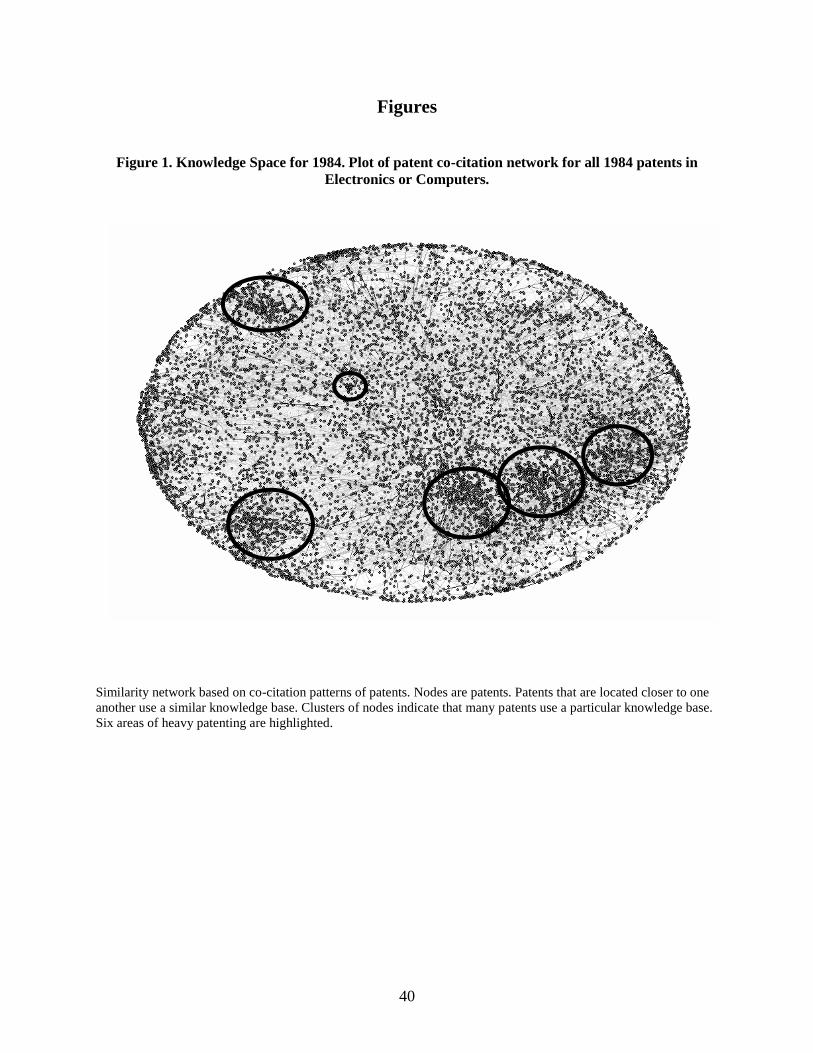
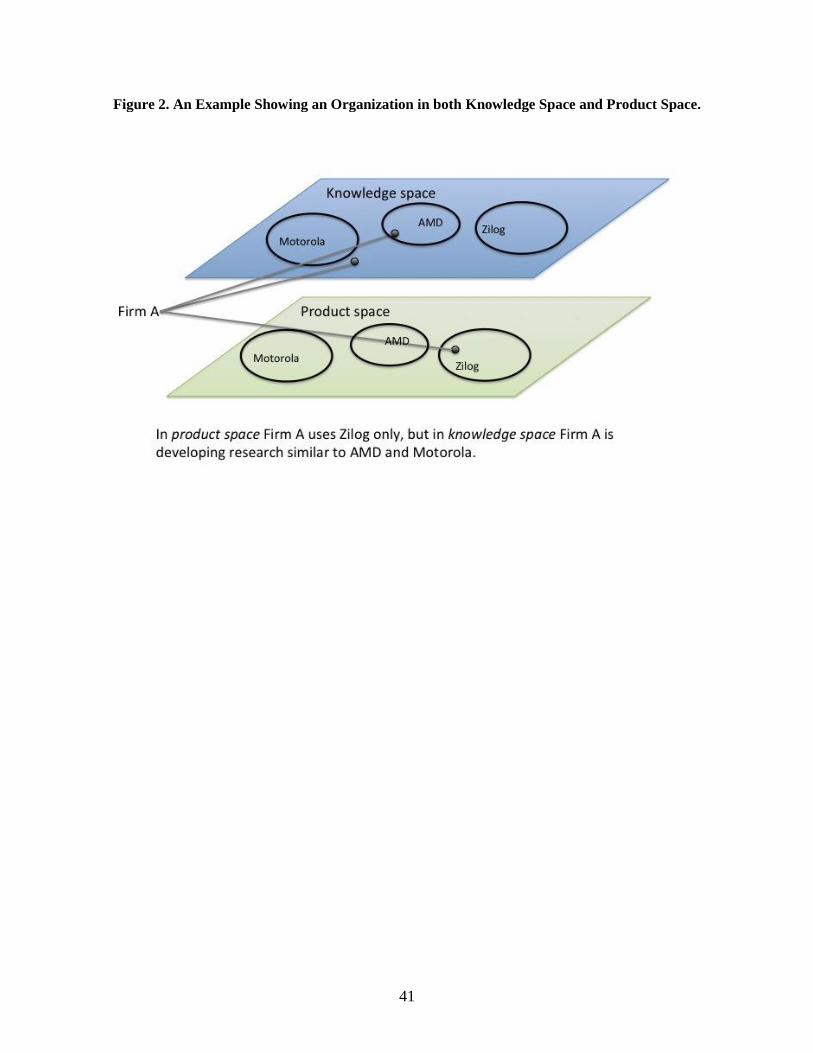
1996; Fleming, 2001). An example of knowledge space is illustrated in figure 1, which shows
the co-citation networks for all computer and electronics patents in the US in 1984. Proximate
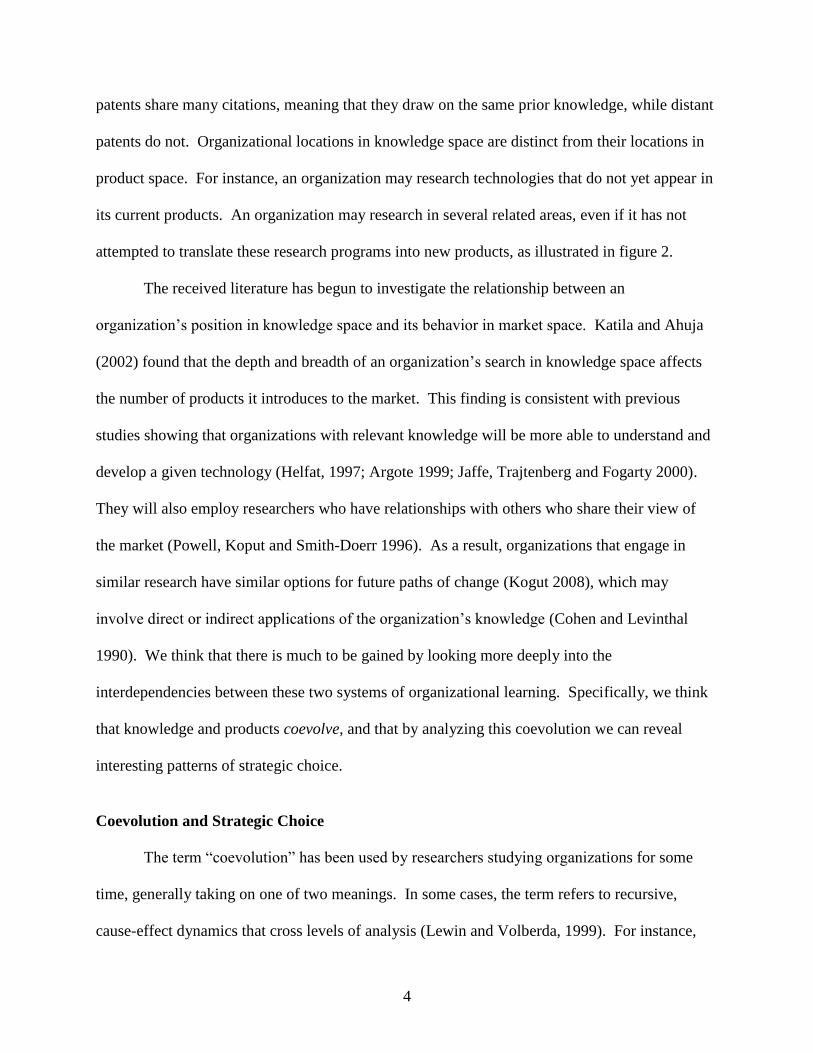
4
patents share many citations, meaning that they draw on the same prior knowledge, while distant
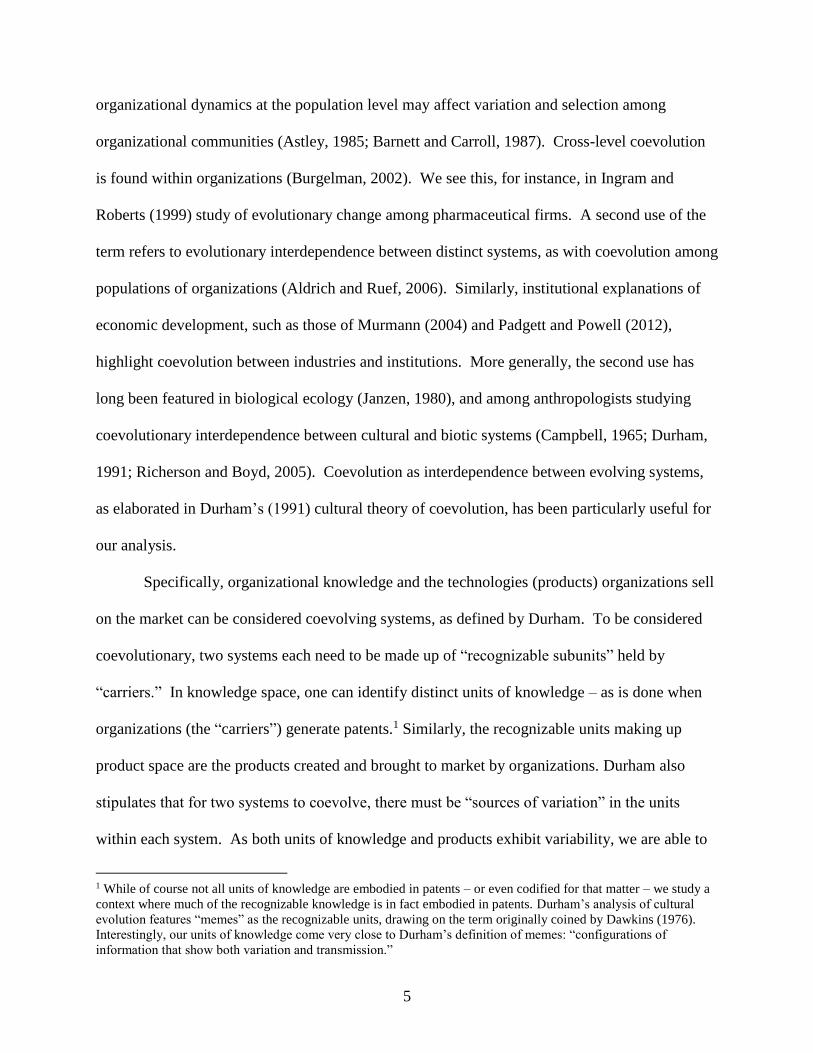
patents do not. Organizational locations in knowledge space are distinct from their locations in
product space. For instance, an organization may research technologies that do not yet appear in
its current products. An organization may research in several related areas, even if it has not
attempted to translate these research programs into new products, as illustrated in figure 2.
The received literature has begun to investigate the relationship between an
organization’s position in knowledge space and its behavior in market space. Katila and Ahuja
(2002) found that the depth and breadth of an organization’s search in knowledge space affects
the number of products it introduces to the market. This finding is consistent with previous
studies showing that organizations with relevant knowledge will be more able to understand and
develop a given technology (Helfat, 1997; Argote 1999; Jaffe, Trajtenberg and Fogarty 2000).
They will also employ researchers who have relationships with others who share their view of
the market (Powell, Koput and Smith-Doerr 1996). As a result, organizations that engage in
similar research have similar options for future paths of change (Kogut 2008), which may
involve direct or indirect applications of the organization’s knowledge (Cohen and Levinthal
1990). We think that there is much to be gained by looking more deeply into the
interdependencies between these two systems of organizational learning. Specifically, we think
that knowledge and products coevolve, and that by analyzing this coevolution we can reveal
interesting patterns of strategic choice.
Coevolution and Strategic Choice
The term “coevolution” has been used by researchers studying organizations for some
time, generally taking on one of two meanings. In some cases, the term refers to recursive,
cause-effect dynamics that cross levels of analysis (Lewin and Volberda, 1999). For instance,
5
organizational dynamics at the population level may affect variation and selection among
organizational communities (Astley, 1985; Barnett and Carroll, 1987). Cross-level coevolution
is found within organizations (Burgelman, 2002). We see this, for instance, in Ingram and
Roberts (1999) study of evolutionary change among pharmaceutical firms. A second use of the
term refers to evolutionary interdependence between distinct systems, as with coevolution among
populations of organizations (Aldrich and Ruef, 2006). Similarly, institutional explanations of
economic development, such as those of Murmann (2004) and Padgett and Powell (2012),
highlight coevolution between industries and institutions. More generally, the second use has
long been featured in biological ecology (Janzen, 1980), and among anthropologists studying
coevolutionary interdependence between cultural and biotic systems (Campbell, 1965; Durham,
1991; Richerson and Boyd, 2005). Coevolution as interdependence between evolving systems,
as elaborated in Durham’s (1991) cultural theory of coevolution, has been particularly useful for
our analysis.
Specifically, organizational knowledge and the technologies (products) organizations sell
on the market can be considered coevolving systems, as defined by Durham. To be considered
coevolutionary, two systems each need to be made up of “recognizable subunits” held by
“carriers.” In knowledge space, one can identify distinct units of knowledge – as is done when
organizations (the “carriers”) generate patents.1 Similarly, the recognizable units making up
product space are the products created and brought to market by organizations. Durham also
stipulates that for two systems to coevolve, there must be “sources of variation” in the units
within each system. As both units of knowledge and products exhibit variability, we are able to
1 While of course not all units of knowledge are embodied in patents – or even codified for that matter – we study a
context where much of the recognizable knowledge is in fact embodied in patents. Durham’s analysis of cultural
evolution features “memes” as the recognizable units, drawing on the term originally coined by Dawkins (1976).
Interestingly, our units of knowledge come very close to Durham’s definition of memes: “configurations of
information that show both variation and transmission.”
6
array units of each kind over a multi-dimensional space (see figure 2). Finally, Durham’s third
criterion is “that there exist one or more mechanisms of transmission through which these units
are conveyed among the individuals of the population” (Durham, 1991: 421). Units of
knowledge are transmitted among organizations when they build on each other’s knowledge as
revealed in patent citations. And transmission occurs in product space too, when organizations
imitate or improve upon each other’s products over time. In these ways, organizational
knowledge and product technologies constitute distinct systems that coevolve.
Organizations, as carriers in this evolutionary analysis, are a key source of variation
within each of these systems. More generally, theories of coevolution in culture and biology
look at the different “variant forms” exhibited by the carriers in an evolving system, because they
are what drive the observed patterns in the world around us. These variant forms are referred to
as “alleles” in biological evolution, and as “allomemes” in cultural evolution (Durham, 1991:
423). For our purposes, we too can characterized the carriers in our study (organizations) by the
variant positions they assume within each system. Some organizations are knowledge
generalists while others are knowledge specialists, and some are product generalists while others
are product specialists.
Evolutionary analysis focuses on differential preference of variant forms – in our case
why some positions in knowledge or product space prevail over others. Typically organizational
scholars study differential selection among alternatives in terms of one particular mechanism:
differences in rates of organizational failure. But cultural anthropologists argue that
coevolultionary processes involve other, potentially more important mechanisms. Specifically,
human choice plays a prominent role. Durham concludes his monumental study by
summarizing: “The single most important force in the differential transmission of allomemes is
7
conscious, value-based decision making by culture carriers” (Durham, 1991: 436). Campbell’s
(1965) seminal article foreshadowed this finding, observing that “vicarious forces” in the form of
learning and imitation shape variability in socio-cultural evolution. Richerson and Boyd (2005)
note that the ability to choose gives flexibility and direction to cultural evolution. In short, as
Durham (1991: 436) states, cultural systems are characterized by “self selection.”
In the same way, choices made by organizations clearly shape the variant positions they
take, and we think that these choices lead to coevolutionary interdependence between knowledge
space and product space. We know that organizations vary in their innovativeness within
knowledge space (Mowery et al., 1996; Gautam, 2000; Zollo and Winter, 2002). And we also
know that an organization’s knowledge shapes its ability to create and deploy new products
(Cohen and Levinthal, 1990; Katila and Ahuja, 2002). If organizational positions in knowledge
space map onto product space in a 1 to 1 correspondence, then choices made with regards to
knowledge development lead to straightforward predictions about product development. This
interdependence would be coevolutionary, but quite unsurprising. We would see some
differences in the rate of market adoption of technologies across firms (Chatterjee and Eliashberg,
1990; Kogut and Zander, 1992; Rogers, 2003) – resulting in adoption rates that vary over time
according to an “S-shaped” curve (Strang and Soule, 1998; Rogers, 2003). But with respect to
the relationship between knowledge space and product space, a 1 to 1 mapping would lead us to
expect organizations that had chosen to develop the requisite knowledge to be differentially
favored to introduce products based on that knowledge.
Of course, the relationship between organizational knowledge and product development
is more complex than a 1 to 1 mapping. Organizations vary in their ability to translate
knowledge into products (Zollo and Winter, 2002). Some organizations may choose not to
8
capitalize on knowledge due to other, market-based factors. These differences shape how
knowledge coevolves with the other activities of an organization (Van den Bosch et al, 1999).
Here, we look at two variant positions in knowledge space and consider how these variants lead
organizations to be differentially favored in product introduction. In this way, we examine
coevolution where variants in knowledge space drive outcomes in product space.
Knowledge Consistency
The first variant we consider is whether an organization’s knowledge has been rapidly
acquired. An idea fundamental to studies of scientific development is that knowledge built
gradually over time is more complete and more fully understood. Philosophers of science find
that productive research programs build paradigmatic bodies of interrelated research, referred to
as the “requirement of consistency” (Lakatos 1970). In the sociology of science, Merton (1973)
observes that especially novel and influential innovations build heavily on prior knowledge and
link well-established lines of research. For this reason, R&D departments in large firms
historically have been important to technological change because they coordinate consistent and
cumulative research over relatively long periods of time (Galbraith 1967). Other studies reaffirm
this finding, showing that accretive knowledge development facilitates change (Dewar and
Dutton 1986; Iansiti, 2000; Katila and Ahuja, 2002). Building knowledge over time in a
consistent research program leads to a comprehensive knowledge base that cannot be easily
replicated by a quick move into a particular research area.
Attempts to shortcut the accretion of knowledge often fall short. To be effective,
processes in organizations need to unfold over time and cannot be compressed into a short and
intense period of activity (Ancona et al., 2001). Coordination problems escalate when more
9
people are devoted to research in an effort to produce results faster. This is behind the “mythical
man month” problem identified in R&D, where having two people work on an initiative for one
month is not equivalent to having one person work for two months (Brooks, 1975). On top of
coordination problems, rapidly learning organizations tend to lose background information from
the past that makes knowledge more complete (Levinthal and March, 1993). Rapid learning
suffers from not being able to distinguish information from “noise” (Holland et al., 1989; March
1994). So having the relevant knowledge is not enough. Also important is that an organization
build its knowledge in a particular area consistently over time.
Knowledge Consistency Hypothesis: Organizations following a consistent strategy in
knowledge space are differentially favored in the relevant area of product space.
Knowledge Specialism
The consistency hypothesis implies that by foreseeing where to research, organizations
can prepare for changes in the market. But knowing in advance where to research is difficult.
There is uncertainty over the technologies that will prevail (Anderson and Tushman, 1990),
especially in early stages of an industry when organizations experiment along different
technological paths. After the fact it may seem obvious that a particular technology would end
up as the “dominant design” (Abernathy and Utterback, 1978), but a priori many alternative
technologies seem viable (Barnett, 2008). In the microcomputer market, for instance, consensus
emerged around the Intel chip design, but this convergence was far from obvious in early years.
Dozens of possible designs were available to microcomputer manufacturers, some which seemed
stronger than Intel’s offerings.
10
In the face of uncertainty, decision makers can choose either to specialize knowledge
development on what they believe is the most promising technology, or to hedge their bets as a
generalist and research in various areas of knowledge space. Knowledge generalism has “option
value” (Kogut, 2008), giving managers the ability to place bets on various possible future time
paths. Managers may hope that knowledge generalism will keep the organization able to adopt
the most attractive technologies once that choice becomes clearer in the future. In this spirit,
Leiponen and Helfat (2009) find that managers who report having a broader range of knowledge
sources also are more likely to report that their organization is innovative. Knowledge
generalism will have an innovation advantage as long as there is no downside to involvement in
multiple areas. In the extreme, this implies that research in one area of knowledge space is
independent of an organization’s engagement in other areas. Under this assumption, knowledge
generalism will increase the likelihood of innovation simply because the generalist is researching
in a greater variety of areas.
We reach a different conclusion, however, if we relax the assumption that there is no
downside to being involved across multiple areas of knowledge space. Rather than assuming
independence across research areas, we allow that knowledge generalism can spread an
organization’s resources too thin. This problem is well researched with respect to material and
human resources, and often operates to the disadvantage of generalists in product strategy
(Hannan and Freeman, 1989). This constraint should also apply to organizations that pursue a
generalist position in their knowledge development. In addition to spreading material resources
too thin, knowledge generalism can lead to increased disagreement regarding the right direction
for an organization. Knowledge not only provides a technical basis for change, but also helps to
build a social consensus about an organization’s proper course of action (Barley, 1986). As
11
Stinchcombe (1990) argues, organizations innovate when there is a shared understanding of what
is involved in the innovation including its technical requirements, personnel requirements, its
likely costs and benefits, and implications for the distribution of benefits. These understandings
form a social basis for change (March, 1994). In this light, knowledge generalism reduces the
chances that the organization will develop a consensus around the promise of any particular
technology. The specialist to a given area of knowledge space devotes all its resources to
innovating in that area, and is likely to benefit from a powerful consensus among managers as to
the appropriateness of innovation in that area. While knowledge generalists may have an
advantage when it comes to their overall rate of innovation, we think they will be less likely than
a specialist to innovate in any given area:
Knowledge Specialism Hypothesis: Knowledge specialists are differentially
favored in their relevant product space compared to knowledge generalists.
Empirical Setting and Methods
We investigate these ideas over the evolution of the U.S. microcomputer industry, from
the early growth of commercial microcomputers in 1980 through the onset of the Internet era in
1994. Microcomputers were initially developed by computer hobbyists in the 1970s and became
a large and commercially viable product category in the early 1980s. Microcomputers were
dramatically smaller and cheaper than earlier computers and made computing widely accessible.
One of the most important elements of the microcomputer was the microprocessor, a small
component once called a “computer on a chip,” that contained all central processing unit (CPU)
functions. A critical technical decision for microcomputer manufacturers concerned which CPU
12
to use in their products. Initially, the functions and specifications of the CPU were not well
defined, and only with technical advances over time would they become clear. Consequently,
during the early years of this industry, there was a great deal of uncertainty about which
suppliers would consistently be able to offer a CPU with the best performance.2
Our interviews and articles from the archives indicate that manufacturers actively
managed their choice of CPU as a strategic decision. On the one hand, there were clear
economies from specializing. Electronic Data News, a top industry publication on electronic
design, stated in 1979, “Why choose a single family? The most compelling reason is the human-
factors benefit of having to deal with only one instruction set, one hardware architecture, one bus
structure and one development system,” (EDN, October 20, 1979). On the other hand,
specializing increased the risks of tying one’s fate too closely with one design. Should that
design cease to be competitive, the microcomputer firm would suffer. Early on, there was
considerable uncertainty around which microprocessor manufacturer would consistently develop
the best CPU. For example, in the late 1970’s Texas Instruments seemed to be a front-runner,
only to give way to Motorola, Intel, and others (EDN, various issues). Even as late as 1986,
EDN predicted that despite the prominence of the Motorola 6800 and Intel 8086 families, that
there would be plenty of room for other designs. At the time, this source asserted that one
microprocessor would not come to dominate the market, and instead suggested that
standardization would occur only at the level of the operating system (EDN, November 17, 1986).
Consequently, microcomputer manufacturers often maintained the knowledge required to
employ different CPUs, and valued being able to change CPUs. Managers weighed technical
benefits, the risks of being too dependent on a particular design, and the costs of creating new
2 We conducted interviews with a number of experts who worked during the study period on the design of
microcomputers, CPUs, and instruction sets.
13
knowledge when deciding whether or not to adopt a new CPU. If managers decided that the
organization should offer a CPU of a different design, then the organization needed the particular
knowledge about controls, instruction sets, architectures, and bus configurations that would work
with the new chip. All aspects of product design were affected by such a decision. For these
organizations, knowledge development was an important factor in their ability to adopt a new
CPU.
The experts we interviewed emphasized that adopting a new CPU was a major technical
change for microcomputer organizations, involving the architectural design of the computer and
the creation of assembly language code to enable the CPU to work within this design.
Functioning within a microcomputer, the CPU includes three general components (see
Rafiquzzaman, 2005). The “control section” of the CPU performs the basic operations of the
computer, receiving instructions from memory, storing them, decoding them to be
understandable by the computer’s hardware, and then carrying them out. Second, the “arithmetic
and logic unit” of the CPU deals with data manipulation, instructing at a fundamental level the
registers, circuitry, memory, and input/output devices. Third, the “register section” of the CPU
includes circuitry that temporarily stores data and program codes. Finally, these three
components of the CPU are connected by the system bus, where the architecture of the computer
is organized. All of these various functions are controlled by so-called “instruction sets,”
detailed assembly-language commands particular to each CPU design. Designing a
microcomputer to work with a new CPU involved developing these detailed instruction sets.
The adoption of a new CPU was further complicated by the fact that the specific
instruction sets for each CPU depended on the other components of the microcomputer. Later in
the history of the industry, the specifications of each CPU and its relationship to the architecture
14
of the microcomputer were well understood.3 But during the period we study, new CPU designs
were being introduced frequently, often expanding the range of functions carried out by the CPU
to incorporate functionality that previously had been performed by other components within the
microcomputer. Each new design also brought improved performance, but required that the
CPU interact in different ways with the rest of the microcomputer. Our interviews suggest that
adopting even a new version from the same manufacturer was a difficult and involved process,
requiring the redesign of the rest of the microcomputer and re-writing the CPU’s instruction sets.
Moving to a different CPU manufacturer was even more involved and amounted to a complete
re-thinking of the architecture of the computer.
Data
We used archival sources to track microcomputer organizations and the microprocessors
used in their products between 1980 and 1994. These data were constructed from Data Sources,
a publication that lists all computer manufacturers and the technical specifications of their
products sold in each year. This project is a subset of a larger data collection effort that tracks all
microcomputer organizations that ever existed in the U.S. using every known source that
documents the computer industry. Of these, only Data Sources contains comprehensive
information on the technologies within the products sold, and it includes information for 1657
organizations over 4798 organization-years, out of 1922 total microcomputer organizations over
6510 organization-years in the complete data. This sample is not size-biased, nor biased in any
other known way, and is the most complete known census of U.S. microcomputer organizations
and the technologies provided in their products for the years we cover.
3 By 2005, when Rafiquzzaman published his massive text containing detailed schematics and instruction sets, the
technical knowledge involved in changing CPUs was well known (if still complicated).
15
We study technical change in terms of when a microcomputer company adopts a CPU
from a new supplier. For each CPU in these data, we collected information on its manufacturer,
technical details, and its first release year, from the annual microprocessor report provided in
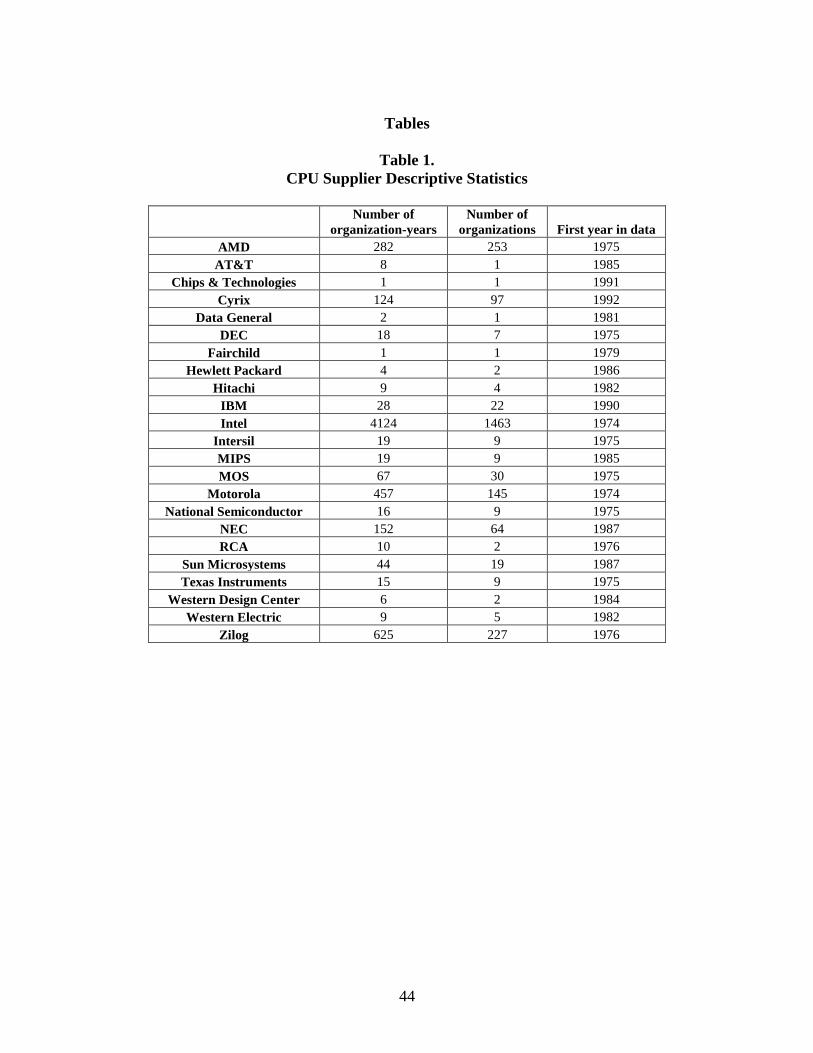
Electronic Data News. There are 115 distinct CPUs in these data produced by 23 different
manufacturers. Table 1 shows descriptive statistics for the CPU manufacturers in these data.
----------Insert table 1 here------------
Fifty-five percent of organizations use a supplier other than Intel, with AMD, Zilog, Motorola,
and Cyrix also popular suppliers. At any given time organizations tended to offer products using
between one and three microprocessor suppliers, but which suppliers they used varied.
Organizations might be more likely to adopt a new CPU if its technologies are more
compatible with those of their current suppliers. Computer technologies are affected by the
diffusion of standards, which benefit technologies that become more widespread in their use
(Katz and Shapiro, 1985). These network effects have been shown to shape rates of technology
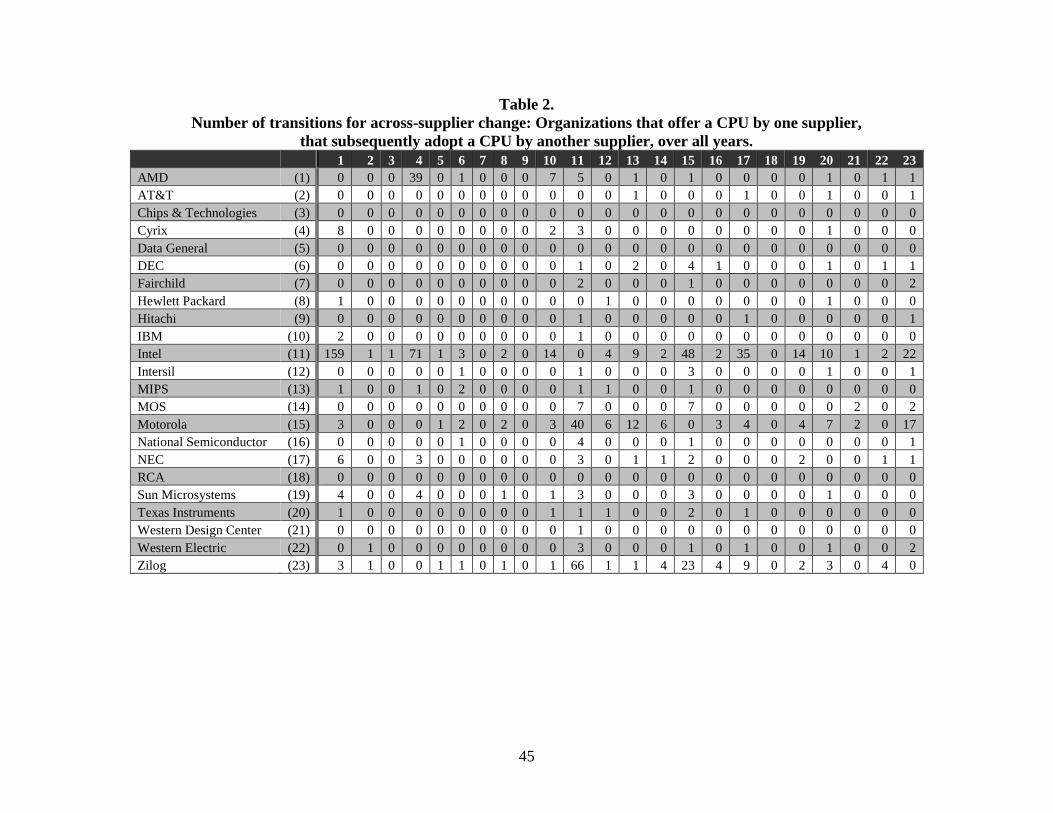
adoption (Farrell and Saloner, 1985). To take this into consideration, we construct the transition
matrix shown in table 2. This matrix identifies organizations that use CPUs from one supplier at
time t1 (listed in the rows) that adopt a CPU from a different supplier at time t2 (listed in the
columns). This matrix indicates that there is clustering, showing how patterns of technological
compatibility shaped the diffusion of these technologies. We will employ this transition matrix,
broken out over time, in supplementary analyses to determine whether our findings are sensitive
to compatibility among manufacturers.
--------------Insert table 2 here---------------
To investigate our hypotheses, we measure each organization’s position in knowledge
space. We do this based on the patenting behavior of these organizations, as documented by the
16
United States Patent Office. In order to obtain a U.S. patent, an organization must apply with a
new, unique and non-obvious invention. Patents also must cite all ‘prior art’ on which the new
invention is based, which reveals the knowledge foundation for the patent. We construct our
measure of knowledge space from patent and patent citation data from the National Bureau of
Economic Research patent citations data file (Hall, Jaffe and Trajtenberg 2001). In this file,
patents have been categorized into six broad categories; we use all patents granted in the
Computers & Communications or Electrical and Electronic categories, the two research areas
that are relevant to computers. There are 440,530 patents in these categories granted between
1975 and 1994.
Measures
These data allow us to measure organizational positions in knowledge space, under the
assumption that patent citations measure the technical foundation of research. The citations
included in a patent are identified by the inventor, professional consultants, patent attorneys and
the patent examiner (Gittleman 2008; Alcácer and Gittleman 2006). For research on the
knowledge of the specific inventor, this adds troublesome noise. However, here we use citation
overlap to place organizations within knowledge space. We seek to determine if they are
engaging in research very similar to or different from other organizations, not to approximate the
direct knowledge of the inventor. For our purposes, citations added by managers, patent
examiners, or others are helpful in refining the position of the organization in knowledge space.
We construct knowledge space at the level of the individual invention, using all 440,530
patents issued the Electronics and Computers categories from 1975 – 1994. Note that knowledge
space is based on all patents relevant to computers in the U.S. patent database, not just those
17
issued to microcomputer organizations. Building on previous research, we use citation overlap
to quantify how similar two patents are (Podolny, Stuart and Hannan 1996; Fleming 2001; Stuart
and Podolny 1996). Similarity between patents i and j is measured by dividing the number of
shared citations between i and j by the total citations made by patent j:
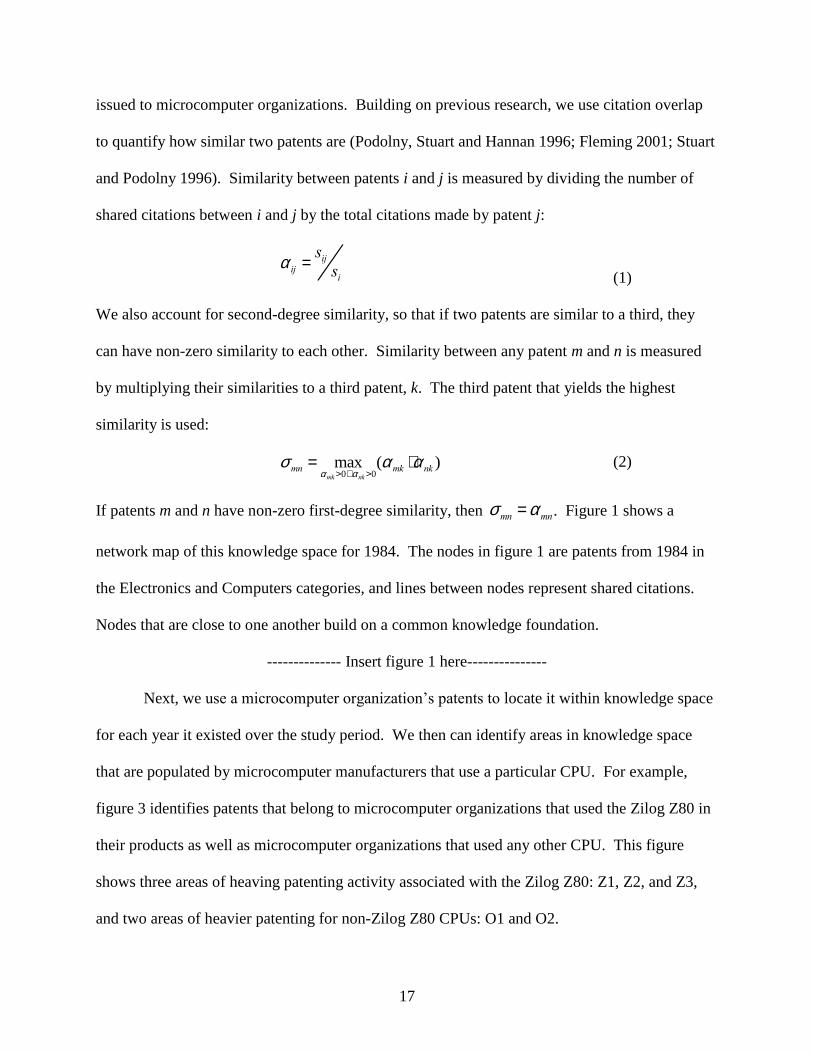
a ij =sijsi (1)
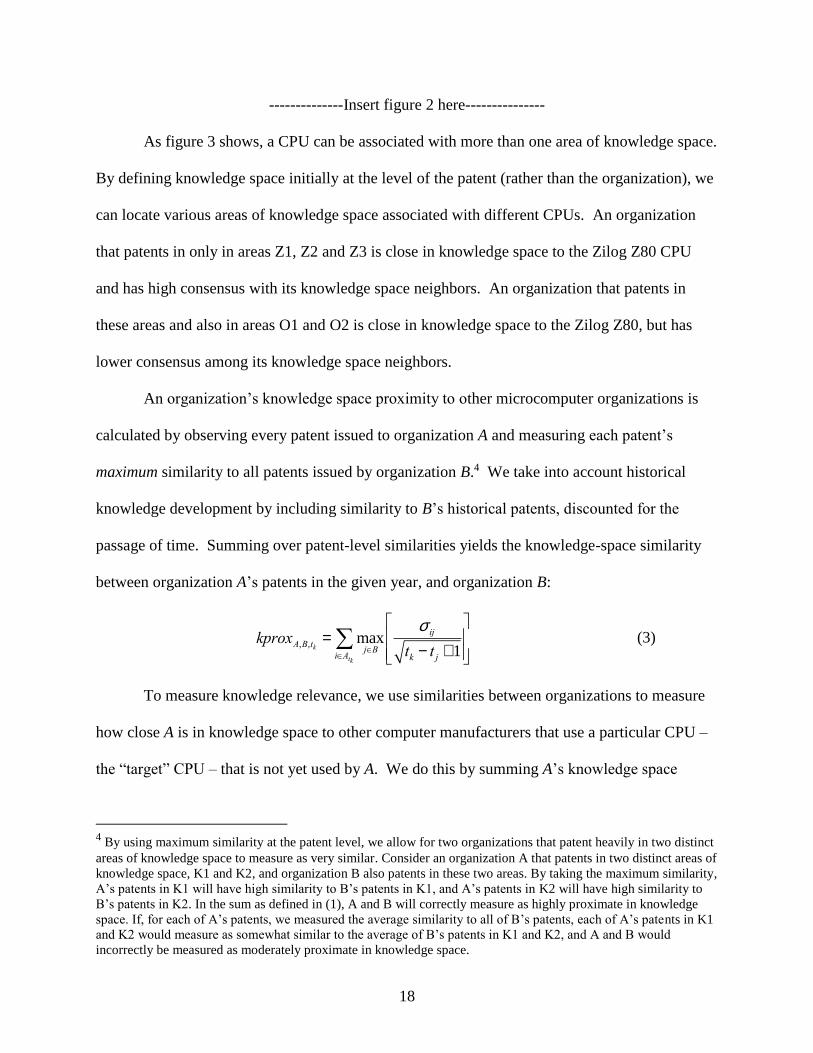
We also account for second-degree similarity, so that if two patents are similar to a third, they
can have non-zero similarity to each other. Similarity between any patent m and n is measured
by multiplying their similarities to a third patent, k. The third patent that yields the highest
similarity is used:
smn = maxamk>0Ùank>0
(amk ×ank ) (2)
If patents m and n have non-zero first-degree similarity, then . Figure 1 shows a
network map of this knowledge space for 1984. The nodes in figure 1 are patents from 1984 in
the Electronics and Computers categories, and lines between nodes represent shared citations.
Nodes that are close to one another build on a common knowledge foundation.
-------------- Insert figure 1 here---------------
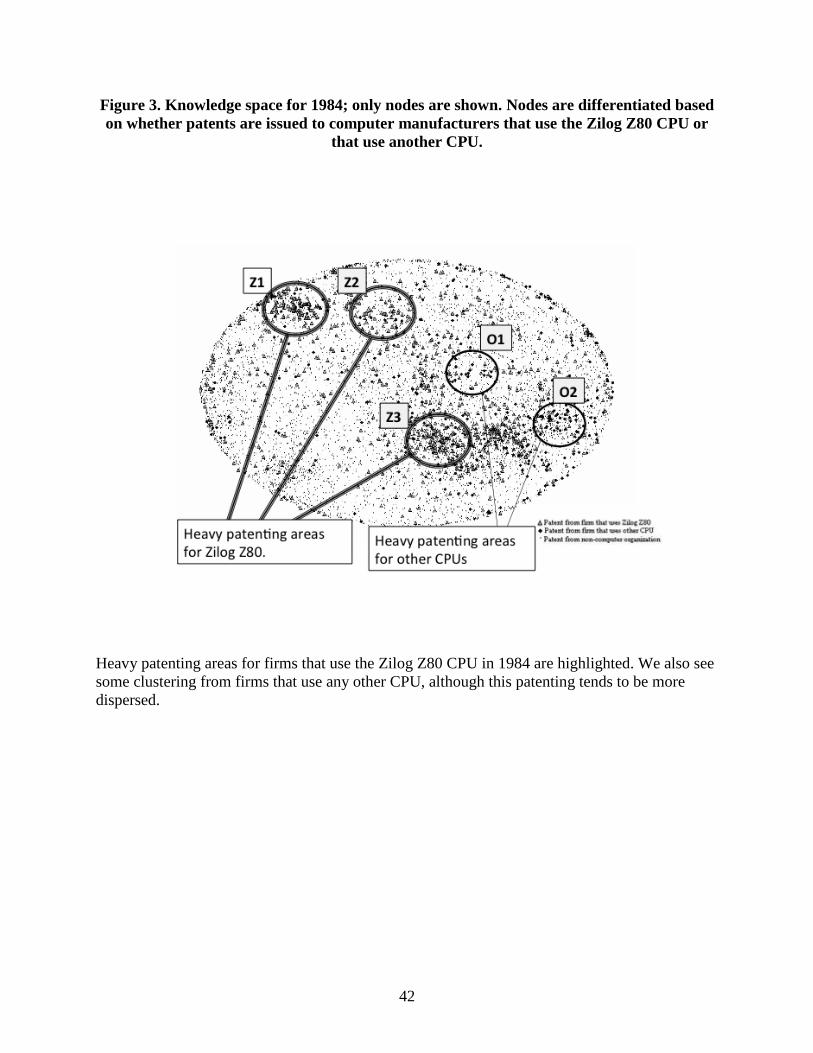
Next, we use a microcomputer organization’s patents to locate it within knowledge space
for each year it existed over the study period. We then can identify areas in knowledge space
that are populated by microcomputer manufacturers that use a particular CPU. For example,
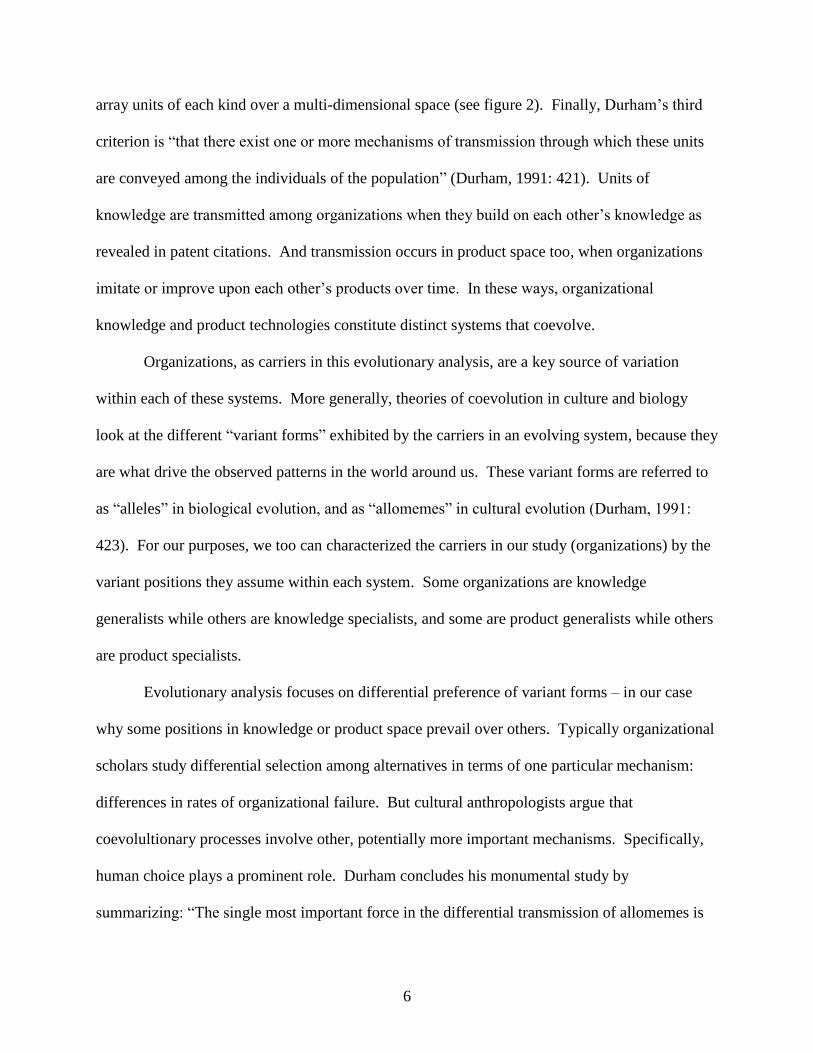
figure 3 identifies patents that belong to microcomputer organizations that used the Zilog Z80 in
their products as well as microcomputer organizations that used any other CPU. This figure
shows three areas of heaving patenting activity associated with the Zilog Z80: Z1, Z2, and Z3,
and two areas of heavier patenting for non-Zilog Z80 CPUs: O1 and O2.
smn = amn
18
--------------Insert figure 2 here---------------
As figure 3 shows, a CPU can be associated with more than one area of knowledge space.
By defining knowledge space initially at the level of the patent (rather than the organization), we
can locate various areas of knowledge space associated with different CPUs. An organization
that patents in only in areas Z1, Z2 and Z3 is close in knowledge space to the Zilog Z80 CPU
and has high consensus with its knowledge space neighbors. An organization that patents in
these areas and also in areas O1 and O2 is close in knowledge space to the Zilog Z80, but has
lower consensus among its knowledge space neighbors.
An organization’s knowledge space proximity to other microcomputer organizations is
calculated by observing every patent issued to organization A and measuring each patent’s
maximum similarity to all patents issued by organization B.4 We take into account historical
knowledge development by including similarity to B’s historical patents, discounted for the
passage of time. Summing over patent-level similarities yields the knowledge-space similarity
between organization A’s patents in the given year, and organization B:
kproxA,B,tk= max
jÎBiÎAtk
ås ij
tk - t j +1
é
ë
êê
ù
û
úú
(3)
To measure knowledge relevance, we use similarities between organizations to measure
how close A is in knowledge space to other computer manufacturers that use a particular CPU –
the “target” CPU – that is not yet used by A. We do this by summing A’s knowledge space
4 By using maximum similarity at the patent level, we allow for two organizations that patent heavily in two distinct
areas of knowledge space to measure as very similar. Consider an organization A that patents in two distinct areas of
knowledge space, K1 and K2, and organization B also patents in these two areas. By taking the maximum similarity,
A’s patents in K1 will have high similarity to B’s patents in K1, and A’s patents in K2 will have high similarity to
B’s patents in K2. In the sum as defined in (1), A and B will correctly measure as highly proximate in knowledge
space. If, for each of A’s patents, we measured the average similarity to all of B’s patents, each of A’s patents in K1
and K2 would measure as somewhat similar to the average of B’s patents in K1 and K2, and A and B would
incorrectly be measured as moderately proximate in knowledge space.
19
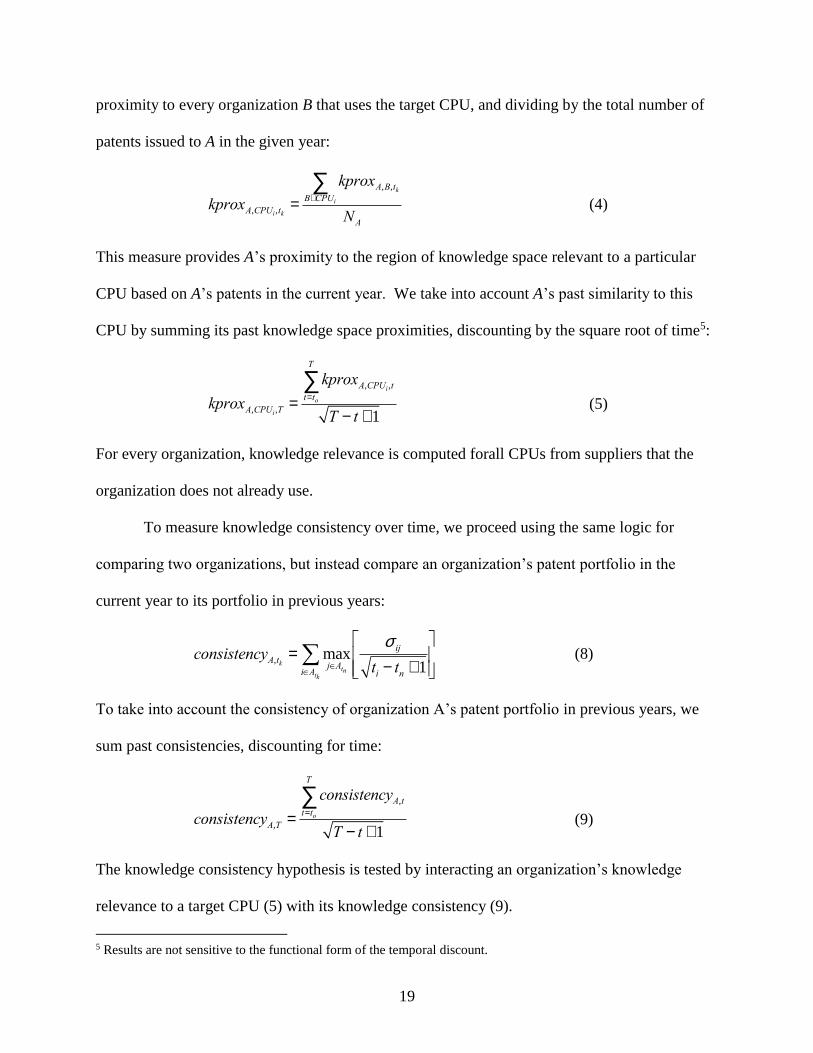
proximity to every organization B that uses the target CPU, and dividing by the total number of
patents issued to A in the given year:
kproxA,CPUi ,tk=
kproxA,B,tkBÎCPUi
å
NA (4)
This measure provides A’s proximity to the region of knowledge space relevant to a particular
CPU based on A’s patents in the current year. We take into account A’s past similarity to this
CPU by summing its past knowledge space proximities, discounting by the square root of time5:
kproxA,CPUi ,T=
kproxA,CPUi ,t
t=to
T
å
T - t +1 (5)
For every organization, knowledge relevance is computed forall CPUs from suppliers that the
organization does not already use.
To measure knowledge consistency over time, we proceed using the same logic for
comparing two organizations, but instead compare an organization’s patent portfolio in the
current year to its portfolio in previous years:
consistencyA,tk= max
jÎAtn
s ij
ti - tn +1
é
ëêê
ù
ûúúiÎAtk
å (8)
To take into account the consistency of organization A’s patent portfolio in previous years, we
sum past consistencies, discounting for time:
consistencyA,T =
consistencyA,t
t=to
T
å
T - t +1 (9)
The knowledge consistency hypothesis is tested by interacting an organization’s knowledge
relevance to a target CPU (5) with its knowledge consistency (9).
5 Results are not sensitive to the functional form of the temporal discount.
20
To test the knowledge specialism hypothesis, we construct a measure of knowledge
generalism (vs. specialism) by computing A’s knowledge space proximity to every organization
C that uses a CPU other than the target CPU:
A
CPUC
tCA
tCPUAN
kprox
kgen ik
k
ki
,,
,, (6)
Again, A’s past similarity to other CPUs are taken into account by summing past proximities and
discounting by time:
1
,,
,,
tT
kgen
kgen
T
tt
tCPUA
TCPUAo
i
i (7)
Model
To test our hypotheses we estimate the likelihood of an organization adopting a CPU
from a different supplier. Our interviews made clear that these changes were non-trivial both
technically and strategically for computer manufacturers. Adopting a new CPU from an existing
supplier typically meant staying within the same design family and so was often not as
significant a change. We model the hazard rate of new-supplier technology adoptions, with
changes taking place as a matching process for every potential organization-CPU dyad in our
data. The risk set thus includes all dyads of each computer manufacturer matched with every
CPU offered by a supplier that the manufacturer does not already use. Dyads enter the risk set
when there is a new microcomputer manufacturer or new CPU, and an event occurs when the
organization from the dyad adopts the CPU from the dyad. The hazard rate is estimated based on
the time from dyad entry to the time when the organization adopts the target CPU. Using the
dyad as the unit of analysis allows us to include variables at the organization-CPU level in order
21
to test these hypotheses. We specify the model as a Cox (1972) proportional hazard rate, which
does not make strong assumptions about the functional form of time dependence. This approach
also allows us to remove possibly troublesome unobserved heterogeneity by specifying CPU-
specific nuisances.
These data contain 58,992 potential organization-CPU pairings over 128,011
organization-CPU-years. During the time period of analysis there are 618 adoptions of a CPU
from a different supplier. For the sake of comparison, the hazard rate of upgrading CPUs from a
supplier that the computer manufacturer already uses is also estimated. For the same-supplier
analysis, there are 12,242 potential organization-CPU pairings over 26,581 organization-CPU-
years, and 934 adoptions of same-supplier CPUs. Models are estimated as competing risks for
adopting a new CPU from a different supplier or from a same supplier. Table 3 provides
descriptive statistics.
Control Variables
We expect the hazard rate of CPU adoption to be a function of CPU-level, organization-
level, and environmental variables.
Several CPU characteristics are likely to affect the hazard rate of adopting a particular
CPU. We include whether the CPU is the supplier’s latest release, to account for a propensity to
adopt recent technologies. Because not all organizations had access to a new CPU immediately
following its release, we also include time since CPU release. To measure perceived risks
associated with a particular CPU, we include the number of organizational failures for computer
manufacturers that did not use the target CPU and number of organizational failures for
computer manufacturers that used the target CPU.
22
We also control for organization-level covariates: size (categorized into small, medium,
and large with small as the reference category), whether the organization is also in the midrange
or mainframe markets, number of years the manufacturer has been in the microcomputer market,
number of CPU suppliers the manufacturer uses, number of CPUs the manufacturer offers in its
products, number of alternative CPUs available from the manufacturer’s suppliers, and the
number of CPUs available from different suppliers.
At the environmental level, these manufacturers are adopting technologies in the midst of
a broader technology diffusion process, as discussed above. Although we explicitly model
differences in propensities to adopt, we also include in the control variables several variables to
capture effects that change with the development of the microcomputer market and the diffusion
of the different CPUs: the number of microcomputer manufacturers, specified as an overall count
and then broken out into the numbers adopting different CPUs. We also control for the mass of
the population by including microcomputer product shipments. Broader economic trends are
included in the form of the US gross domestic product. All independent variables are measured
as of the beginning of each time period.
Results
Table 4 presents our hypothesis tests. Model 1 contains controls only, and is a baseline
for comparison. Models 2 through 5 include various specifications of knowledge position.
Models 2 and 4 both include the main effect of relevance, which is positive but never significant.
Our results clearly cast doubt on the idea of a 1 to 1 correspondence between knowledge space
and product space. Models 3-5 include the interaction of knowledge consistency and relevance,
which is positive and significant in every specification in support of the knowledge consistency
23
hypothesis. Note that the main effect of knowledge consistency, when included in models 2 and
4, is not significant and its inclusion or omission has no bearing on the interaction term’s effect.
Finally, across models 2 through 5, knowledge generalism has a negative and significant effect
on technology adoption. In support of the knowledge specialism hypothesis, organizations that
focus their R&D on a particular area are more likely to bring technologies to market based on
that area.
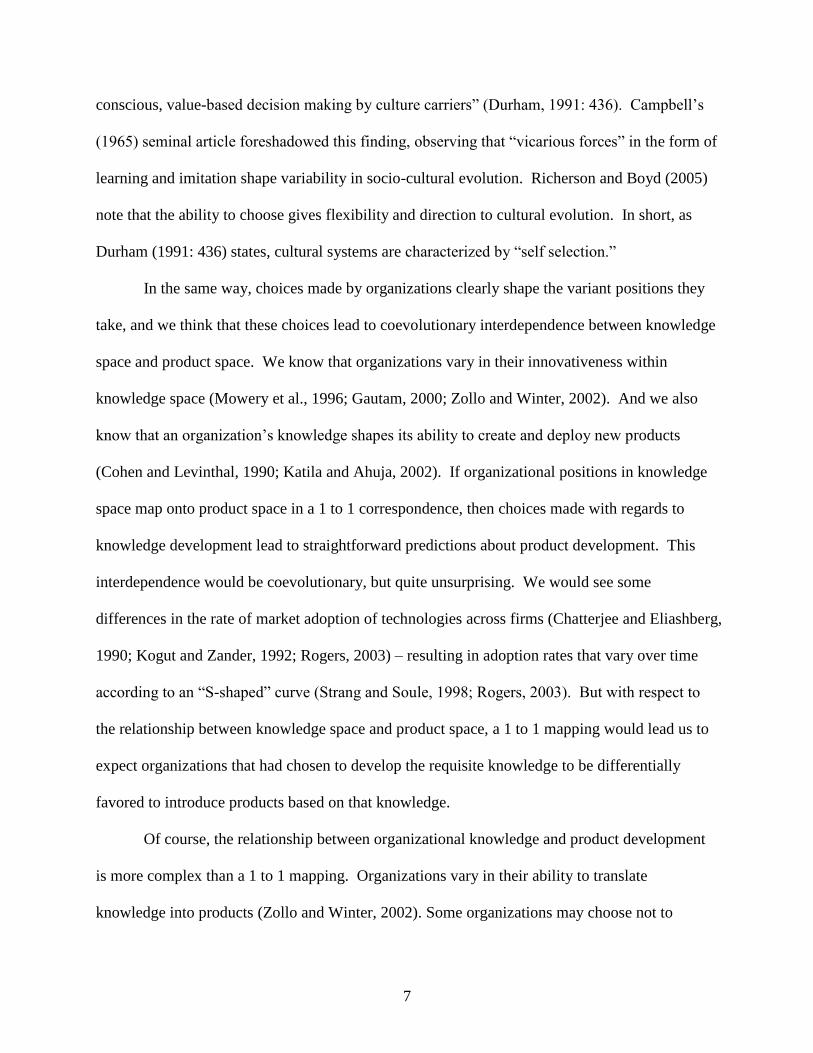
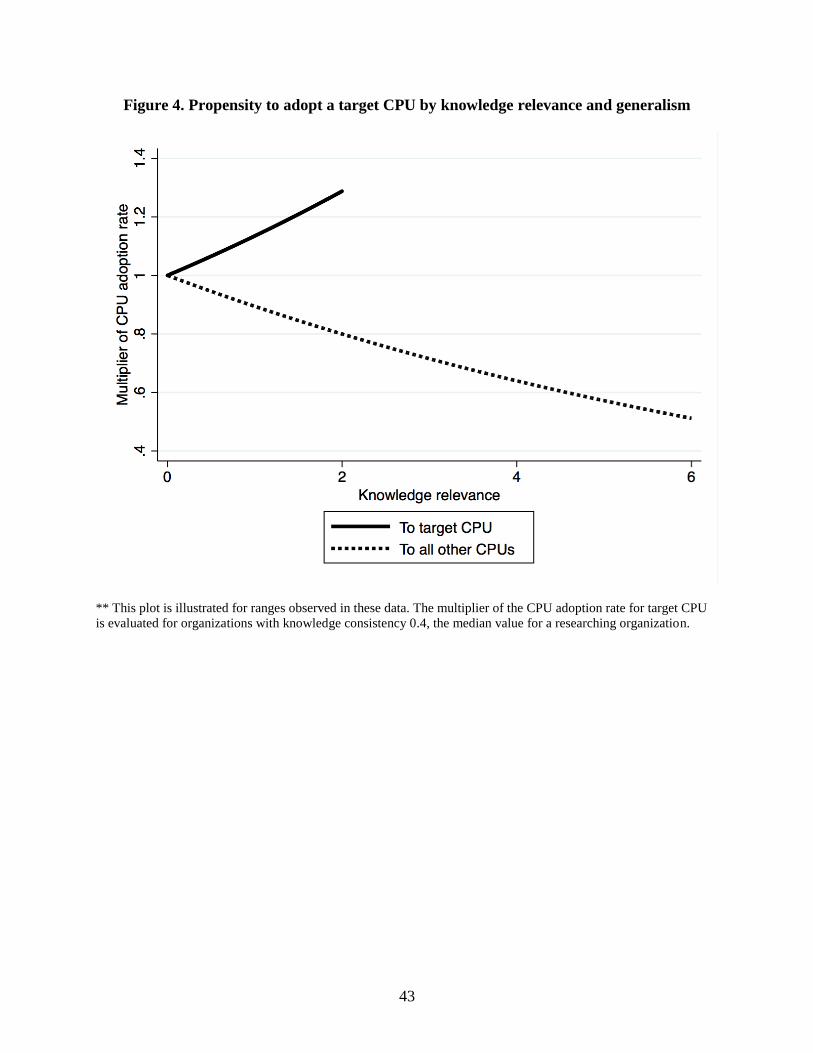
---- Insert figure 4 about here ----
In sum, we find that organizations must have consistently done relevant research in an
area to change technologies based on that area, but neither relevance nor consistency alone have
this effect. Furthermore, knowledge generalists, who spread their research across multiple areas,
have a lower rate of technological change in any particular area. Consequently only model 3,
which includes the (relevance x consistency) interaction and generalism, improves over the
baseline model 1 (based on a comparison of log pseudolikelihoods). Figure 4 illustrates the
magnitude of these effects, for organizations at the median level of knowledge consistency. The
solid line shows a dramatic increase in the propensity to adopt a particular CPU, peaking at a
multiplier of about 1.3. This implies a technology adoption rate about 30% higher for
organizations consistently doing relevant research than for those low on relevance or consistency.
Meanwhile, the dotted line shows how relevance cuts the other way when organizations research
in many different knowledge areas. As knowledge generalism increases, the technology
adoption rate in any particular area falls to about half at the maximum observed value of
generalism. Hedging by being relevant to many different technological areas diminishes the rate
of technological change in any given area.
24
Control Variables
CPUs that are latest releases are less likely to be adopted initially, but are more likely to
be adopted after they are out for some time, likely because microprocessor manufacturers would
take time to ramp up their manufacturing capacities. The higher the failure rate of organizations
that used the target CPU, the lower the likelihood of adoption, and the higher the failure rate of
those who used a different CPU, the higher the likelihood of adoption. This pattern is consistent
with organizations flocking into successful technologies and avoiding less successful ones –
where perceived lack of success of a technology is strongly influenced by failures among those
who use it.
Organizational characteristics also influence the propensity of an organization to adopt a
CPU. Larger organizations and those that span multiple markets tend to adopt CPUs more
frequently. Organizations that already use a wide range of suppliers and CPUs in their product
offerings adopt CPUs less frequently, which we believe is the result of a limit to the number of
components an organization can support. We also include the number of alternative CPUs
available, and whether the alternative CPU is from the same supplier or from different suppliers.
The more alternatives available from the organization’s suppliers, the more likely the
organization is to adopt a CPU from a different supplier. This result might be picking up
consequences of shared fates between organizations and their suppliers: when suppliers have the
resources to release a number of new CPUs, the organizations that use their components are also
doing well, and are expanding their offerings. The more alternatives available from different
suppliers, the less likely the organization will adopt the target CPU. This result probably reflects
a competitive effect.

25
Looking at the environmental controls, increases in microcomputer density and
microcomputer shipments decrease the organization’s likelihood to adopt a CPU. This changing
pattern of adoption over the development of the industry is consistent with the received literature
on technology diffusion (Rogers, 2003). Adoption rates were highest early in the diffusion
process, and then declined as the market matured.
Robustness checks
We also explore the implications of our results and test their robustness against
alternative explanations. Results are reported in tables 4 and 5.
---- Insert table 5 about here ----
General Patenting Activity
One alternative hypothesis is that general knowledge development drives technology
adoption, regardless of knowledge relevance and consistency. We address this possibility by
including in model 5 the number of patents issued to the organization in the previous year. This
does not have a statistical effect on its likelihood to adopt a CPU from a different supplier, and
the model does not improve over model 3, which omits this effect. Our results remain robust to
the inclusion of this variable. There are also similar results when the total number of patents
issued to an organization over time is included.
Upgrading same-supplier CPUs
We have investigated what leads organizations to adopt new technologies that require
significant technical changes within an organization. Scholars distinguish between organizations
26
making significant as opposed to incremental changes (March 1991; Tushman and Anderson
1986; Henderson and Clark, 1990; Hannan and Freeman 1984; Barnett and Carroll 1995). In this
vein, it is informative to compare hazards of adopting a CPU from a different manufacturer to
adopting a CPU from a supplier that the organization already uses. Same-supplier upgrades are
routine, and typically are organized by standard procedures within an organization. For change
of this sort, organizations already possess the relevant knowledge and have built that into their
routines, making R&D less relevant to the capability to change.
We investigate whether this is the case in model 6 in table 4. Consistent with these ideas,
results show that neither an organization’s knowledge relevance nor its knowledge consistency
has a significant effect on its likelihood to upgrade a same-supplier CPU. However, the number
of patents issued to the organization in the previous year has a positive and significant effect.
This result may represent the consequences of internal investment in research, speeding up the
rate at which it can upgrade.
Historical research activity
We also address whether our results reflect simply the fact that some organizations have a
long history of research activity – regardless of whether it is relevant and consistent. We
investigate this alternative by checking to see whether previous knowledge development that was
inconsistent yields the same results. The idea here is that if all knowledge development in the
past increases the rate of technology adoption, then our measure of consistency might be tapping
an overall development effect. So we need to be sure that our results are due to knowledge
relevance and consistency. To test for this possibility, we create a knowledge inconsistency
27
variable, which is the organization’s total knowledge development, represented by the total
number of patents issued to it, minus its consistent development:
inconsistencyA,T = totalpatentA,T - consistencyA,T (10)
Model 7 in table 5 includes the interaction of knowledge proximity with knowledge
inconsistency. This interaction has a positive significant effect on CPU adoption, but its
coefficient, 0.0007 (0.0003) is four hundred times smaller than the effect of knowledge
consistency from model 2: 0.3161 (0.1599). This indicates that there is a small effect of having
consistently developed any knowledge, but it is dwarfed by the effect of having consistently
developed relevant knowledge.
Technical Similarity and Standards
Next we investigate whether the results are sensitive to underlying technical similarities
between CPUs. In this alternative, it is not the knowledge developed by an organization that
leads to CPU adoption; rather, knowledge space proximity to a CPU reflects underlying
similarities between an organization’s current CPU offerings and the target CPU. For instance, if
particular CPUs are based on common standards, then their rates of adoption would be mutually
reinforcing (Barnett, 1990). To look at this, we re-visit the transition matrix from table 2, which
counts the number of organizations that offer CPUs made by one supplier in time t1 that adopt a
CPU made by another supplier in t2. If there is technical similarity between two CPU suppliers,
we will see more computer manufacturers transitioning between CPUs made by these suppliers.
We therefore include a count of the number of transitions from the organization’s suppliers to the
destination CPU up to a given point in time. Model 8 includes this variable, which is not
28
significant. Meanwhile, our findings on knowledge generalism, relevance, and consistency
strengthen with this variable included.
We further test against this alternative in model 9, which includes indicator variables for
whether the organization in the dyad uses a CPU from each of the 23 CPU suppliers in the data.
This captures whether there is an increased or decreased propensity for organizations using a
particular supplier to transition to the destination CPU. Our findings are robust in this
specification, indicating that technical similarities between CPUs are not driving the reported
effects.
Finally, models 10 and 11 allow effects to vary based on the number of microcomputer
manufacturers using the target CPU or the number using a CPU from the target supplier. Results
are robust. Neither variable has a significant effect. The number of failures of manufacturers that
used the target CPU, included as a control, has a negative and significant effect. This suggests
that whether successful competitors use a CPU is more influential to adoption than the sheer
numbers of other manufacturers that use a CPU.
Discussion and Conclusion
Taking a coevolutionary approach, we have identified a role for choice within an
evolutionary analysis of strategy. Choices made over time shape the variant positions that we
identified in knowledge space. These choice, in turn, affected the ability of organizations to
make choices to innovate in product space. Variant positions in knowledge space led to
differential advantages for these organizations in product space – a coevolutionary effect. In
particular, organizations that consistently engaged in research relevant to an area were likely to
adopt products that build on that area. But simply having the relevant knowledge did not have a
29
discernable effect on technological change. This means that organizations moving rapidly into
new areas of knowledge space – ”Johnny come lately” organizations – were not advantaged by
that strategy. It follows that frequent changes to the research policies of organizations are not an
advisable strategy for remaining on the cutting edge of technical knowhow. Rather,
organizations need to commit consistently build knowledge in an R&D area for that knowledge
to facilitate changes in the market.
Given technical and market uncertainty, organizations typically do not know well in
advance where to invest in a long-term, consistent body of research. For this reason, some
organizations choose to hedge their bets researching generally. We argued that this strategy
should be unlikely to pay off, since knowledge generalists will lose focus and suffer from
spreading their material, human, and cognitive resources too thin. Consistent with this argument,
we found that organizations were much less likely to adopt new technologies in any particular
area if they spread their knowledge across multiple areas. The organizations most likely to adopt
new technologies in our data were knowledge specialists that built a consistent base of relevant
R&D.
More generally, it is worthwhile to note that our findings hinged on taking an ecological
approach, including a consideration of the coevolution of knowledge and markets. Our
identification of each organization’s position – in both knowledge space and market space – is
relative to other organizations. By comparison, many existing studies of technology look at
patenting and patent citation patterns in absolute terms, measuring whether an organization
searches close or far by comparison to itself. In contrast, our approach locates organizations in
an ecology of organizations, each positioned relative to the others. Furthermore, we map the
coevolution of both knowledge space and market space, allowing us to identify not only whether
30
research was consistent, but also whether it was relevant to the firm’s product changes. By
making these distinctions, we were able to identify an underlying relationship between relevant
knowledge development and knowledge consistency in fostering technological change.
These findings have implications for organizations that encourage university-like
environments in their research labs, where many different areas of knowledge are simultaneously
explored. Organizations that engage in many different areas of knowledge space may hedge
their bets technically, but they put the organization in a position where it is difficult to develop
consensus to move in any one direction. Although it may seem that this strategy will keep an
organization’s options open, it reduces its ability to “close” on any one.
Similarly, these results suggest limits to whether organizations can effectively combat
technological inertia. They may explain why old and large organizations are often eclipsed by
younger competitors (Tushman and Anderson 1986). Cultivating agile or broad research
strategies in an attempt to overcome inertia may make matters worse, as it reduces the likelihood
that an organization will come to consensus about a new technology. Managers may want to
take a measured approach, balancing forays into new and different knowledge areas with a
careful analysis of the organization’s historical research strengths. Further, choosing to focus on
a few important knowledge areas is likely more fruitful than dabbling in a wide range of research.
This pattern of findings highlights a limitation to our study, and suggests a direction for
future research. In our data, we were able to identify organizations that moved recently into any
particular knowledge area, but we did not know how they did so. In particular, many
organizations attempt to change their strategies by merging with or acquiring other companies.
Our data did not investigate the effects of mergers and acquisitions on knowledge development,
but clearly these events could significantly alter the knowledge position of an organization. If
31
mergers and acquisitions gave rise to the “Johnny come lately” firms in different parts of
knowledge space, and if these firms then underperformed in terms of technical change, then our
results would follow. We cannot tell if this mechanism played a role in the pattern of results that
we found, but future research could look into this possibility.
Organizations benefit from stability, but they also need to change to keep up with the
times. This tension is an ongoing topic for research on strategy and organizations.
Organizational learning theory highlights both the need to change and the ways that rapid change
backfires (March, 1994). Organizational ecology reveals the problematic side of change, with
the benefits of adaptation available only after a period of disruptive adjustment (Barnett and
Carroll, 1995). Evolutionary economics theorizes that routines are stable repositories of
knowledge as well as the adaptive units behind economic change (Nelson and Winter, 1982;
Becker, 2004). Strategy research observes that organizations differ in terms of their dynamic
capabilities, which facilitate the ability to change (Teece et al., 1997). Azoulay and Lerner
(2013) highlight these differences, suggesting that organizations must balance retaining proven
practices with generating uncertain improvements to effectively innovate. Complexity theory
also addresses this problem and finds organizational adaptation leads to instability that makes
population-level selection less effective (Levinthal and Posen, 2007). Across this broad base of
research there is consensus that organizations face a fundamental tension between the benefits of
stability and the need to change.
We think there is an underlying process that helps resolve the tension between
organizational stability and change. This requires distinguishing between an organization
changing its knowledge and changing its products. Often researchers study organizational
change by observing alterations in products, technologies, or services. But organizations also
32
build a body of knowledge that is distinct from its market offerings. Changes in products or
services offered may or may not be coupled with changes in knowledge development.
Sometimes organizations build knowledge consistently in a particular area, as when a
pharmaceutical firm continues to do R&D in a particular area of immunology, or when a
consulting firm continues to train its associates in a certain business technique. In other cases, an
organization may shift the direction of knowledge development, choosing to move into new
areas. This type of change is different from changes to an organization’s market offerings.
Our research has implications for whether organizations can adapt to rapidly changing
environments. It is well known that significant organizational change is difficult and hazardous
(Hannan and Carroll, 2000), and often such changes are technological in nature (Christensen,
1997). If organizations can redirect their R&D so that they have the knowledge relevant to a
new product, then according to the relevance hypothesis they should be able to adapt well as
markets change. This idea appears frequently in the strategy field, where it is often proposed that
more adaptive organizations have “dynamic capabilities” – an ability to change (Teece et al.,
1997). Many organizations will have trouble adapting to technological change, but those that
keep their R&D efforts relevant to the cutting edge of new market developments will be uniquely
capable of adaptation (Helfat, 1997). If market requirements change dramatically, organizations
could rapidly adapt by changing R&D efforts (Ahuja and Lampert, 2001). But the findings here
suggest that persistence over time is required if knowledge is to lead to differential advantage in
product markets.
In this paper, we argue that building a stable base of knowledge has important
implications for an organization’s ability to change the products it takes to market. We suggest
that an organization can more easily draw from a knowledge base that is built consistently over
33
time. In developing this argument, we draw from research on innovation among scientists. A
scientist will typically come up with a number of new research projects, each different in some
ways from the ones before – but normally all will build on the scientist’s underlying area of
expertise. If the scientist changes areas of expertise frequently, she is less capable of innovation
in any one area (Lakatos, 1970). We apply this thinking to the organizational context and suggest
that knowledge consistency facilitates an organization’s ability to change the technologies in its
products. Stability and change enhance one another within organizations, with knowledge
stability and product change going hand-in-hand.
In closing, we think our theory and findings cast new light on the role of organizations in
the evolution of industries. In the years since March (1991) introduced the contrast of
exploration and exploitation, it has been widely used to juxtapose alternative strategies for search
and learning; organizations that focus on an area they know well are exploiters, while those who
probe more broadly are explorers. Our findings imply there may be two different forms of
exploration, one at the organization level, when firms research in multiple areas of knowledge
space, and another at the population level, when many individually focused organizations
collectively cover multiple areas of knowledge space. Our findings suggest that organization-
level exploration may be less fruitful, since organizations that research in multiple areas of
knowledge space face problems building consensus around implementing a particular technology.
Organizations focused on specific areas of research can build social consensus and bring
technologies to market at a faster rate. These organizations may collectively explore, creating an
adaptive system at the level of the population.
34
References
Abernathy, W.J., and J.M. Utterback. 1978. “Patterns of Industrial Innovation.” Technology
Review, 80: 40-47.
Ahuja, Gautam. 2000. “Collaboration Networks, Structural Holes and Innovation: A
Longitudinal Study.” Administrative Science Quarterly, 45: 425-455.
Ahuja, G. and C.M. Lampert. 2001. “Entrepreneurship in the Large Corporation: A Longitudinal
Study of How Established Firms Create Breakthrough Inventions.” Strategic
Management Journal, 22: 521-543.
Alcácer, J., and M. Gittleman. 2006. "Patent Citations As a Measure of Knowledge Flows: The
Influence of Examiner Citations." The Review of Economics and Statistics 88:774-779.
Aldrich, Howard E. and Martin Ruef. 2006. Organizations Evolving (2nd ed). Thousand Oaks,
CA: Sage.
Ancona, D.G., G.A. Okhuysen, and L.A. Perlow. 2001. “Taking Time to Integrate Temporal
Research.” Academy of Management Review, 26: 512-529.
Argote, L. 1999. Organizational Learning: Creating, Retaining and Transferring Knowledge.
Boston, MA: Kluwer.
Astley, W. Graham. 1985. “The Two Ecologies: Population and Community Perspectives on
Organizational Evolution.” Administrative Science Quarterly, 30: 224-241.
Azoulay, P. and J. Lerner. 2013. “Technological Innovation and Organization.” Pp. 575-603 in
Gibbons and Roberts (eds.) Handbook of Organizational Economics. Princeton:
Princeton University Press.
35
Barley, S.R. 1986. "Technology as an occasion for structuring: Evidence from observations of
CT scanners and the social order of radiology departments." Administrative Science
Quarterly, 31: 78-108.
Barnett, W.P. 2008. The Red Queen among Organizations. Princeton: Princeton University Press.
Barnett, W.P., and G Carroll. 1995. "Modeling Internal Organizational Change." Annual Review
of Sociology 21:217-236.
Becker, M.C. 2004. “Organizational Routines: A Review of the Literature.” Industrial and
Corporate Change, 13: 643-677.
Brooks, F.P. Jr. 1975. The Mythical Man-Month. New York: Addison Wesley.
Burgelman, Robert A. 2002. “Strategy as Vector and the Inertia of Coevolutionary Lock-in.”
Administrative Science Quarterly, 47: 325-357.
Campbell, Donald T. 1965. “Variation and Selective Retention in Socio-Cultural Evolution.” Pp.
19-49 in Barringer, Blanksten and Mack (eds.) Social Change in Developing Areas: A
Reinterpretation of Evolutionary Theory. Cambridge: Schenkman.
Chatterjee, R. and J. Eliashberg. 1990. “The Innovation Diffusion Process in a Heterogeneous
Population: A Micro Modeling Approach,” Management Science, 36: 1057-1079.
Christensen, C. 1997. The Innovator's Dilemma: When New Technologies Cause Great Firms to
Fail. Boston, MA: Harvard University Press.
Cohen, W, and D Levinthal. 1990. "Absorptive Capacity: A New Perspective on Learning and
Innovation." Administrative Science Quarterly 35:128-152.
Cox, D R. 1972. "Regression Models and Life-Tables." Journal of the Royal Statistical Society
34:187-220.
Dawkins, Richard. 1976. The Selfish Gene. Oxford: Oxford University Press.
36
Dewar, R D, and J. E. Dutton. 1986. "The Adoption of Radical and Incremental Innovations: An
Empirical Analysis." Management Science 32:1422-1433.
Durham, William H. 1991. Coevolution: Genes, Culture, and Human Diversity. Stanford:
Stanford University Press.
Farrell, J. and G. Saloner. 1985. “Standardization, Compatibility, and Innovation.” Rand Journal
of Economics, 16: 70-83.
Fleming, Lee. 2001. "Recombinant Uncertainty in Technological Search." Management Science
47:117-132.
Galbraith, J K. 1967. The New Industrial State. Princeton: Princeton University Press.
Gittleman, M. 2008. "A Note on the Value of Patents As Indicators of Innovation: Implications
for Management Research." Academy of Management Perspectives 22:21-27.
Hall, B., A. Jaffe, and M. Trajtenberg. 2001. "The NBER Patent Citations Data File: Lessons,
Insights, and Methodological Tools." in NBER Working Paper Series. Cambridge, MA:
National Bureau of Economic Research.
Hannan, M.T., and J. Freeman. 1984. "Structural Inertia and Organizational Change." American
Sociological Review 49:149-164.
Helfat, C.E. 1997. “Know-How and Asset Complementarity and Dynamic Capability
Accumulation: The Case of R&D.” Strategic Management Journal, 18: 339-360.
Holland, J.H., K.J. Holyoak, R.E. Nisbett, and P.R. Thagard. 1989. Induction: Processes of
Inference, Learning and Discovery. Cambridge, MA: MIT Press.
Iansiti, M. 2000. "How the Incumbent Can Win: Managing Technological Transitions in the
Semiconductor Industry." Management Science 46:169-185.
37
Ingram, Paul and Peter W. Roberts. 1999. “Suborganizational Evolution in the U.S.
Pharmaceutical Industry,” pp. 155-168 in Baum and McKelvey (eds.) Variations in
Organization Science. Thousand Oaks, CA: Sage.
Jaffe, A., M. Trajtenberg, and M. Fogarty. 2000. "Knowledge Spillovers and Patent Citations:
Evidence From a Survey of Inventors." The American Economic Review 90:215-218.
Janzen, Daniel H. 1980. “When is it Coevolution?” Evolution, 34: 611-612.
Katila, Riitta and Gautum Ahuja. 2002. “Something Old, Something New: A Longitudinal Study
of Search Behavior and New Product Introduction.” Academy of Management Journal,
45: 1183-1194.
Katz, M.L. and C. Shapiro, 1985. “Network Externalities, Competition, and Compatibility,”
American Economics Review, 75: 424-440.
Kogut, B. 2008. Knowledge, Options, and Institutions. Oxford: Oxford University Press.
Lakatos, I. 1970. "Falsification and the Methodology of Scientific Research Programmes." in
Criticism and the Growth of Knowledge, edited by I Lakatos and Musgrave. Cambridge
University Press.
Leiponen, A, and C. E. Helfat. 2010. "Innovation Objectives, Knowledge Sources, and the
Benefits of Breadth." Strategic Management Journal 31:224-236.
Levinthal, D, and J March. 1993. "The Myopia of Learning." Strategic Management Journal
14:95-112.
Lewin, Arie Y. and Henk W. Volberda. 1999. “Prolegomena on Coevolution: A Framework for
Research on Strategy and New Organizational Forms.” Organization Science, 10:519-
534.
38
March, J.G. 1991. "Exploration and Exploitation in Organizational Learning." Organization
Science 2:71-87.
March, J.G . 1994. A Primer on Decision Making: How Decisions Happen. New York, NY: The
Free Press.
Merton, R.K. 1973. The Sociology of Science. edited by Norman Storer. Chicago: University of
Chicago Press.
Mowery, David C., Joanne E. Oxley, and Brian S. Silverman. 1996. “Strategic Alliances and
Interfirm Knowledge Transfer.” Strategic Management Journal, 17: 77-91.
Murmann, Johann Peter. 2004. Knowledge and Competitive Advantage: The Coevolution of
Firms, Technology and National Institutions. Cambridge: Cambridge University Press.
Nelson, R.R. and S. G. Winter. 1982. An Evolutionary Theory of Economic change. Cambridge,
MA: Harvard University Press.
Padgett, John F. and Walter W. Powell. 2012. “The Problem of Emergence,” pp. 1-32 in Padgett
and Powell (eds.) The Emergence of Organizations and Markets. Princeton: Princeton
University Press.
Podolny, J., T. Stuart, and M.T. Hannan. 1996. "Networks, Knowledge, and Niches: Competition
in the Worldwide Semiconductor Industry, 1984-1991." American Journal of Sociology
102:659-689.
Powell, W.J., K. Koput, and L. Smith-Doerr. 1996. "Interorganizational Collaboration and the
Locus of Innovation." Administrative Science Quarterly 41:116-45.
Rafiquzzaman, M. 2005. Fundamentals of Digital Logic and Microcomputer Design (5th edition).
Hoboken, New Jersey: John Wiley & Sons.
39
Richarson, Peter J. and Robert Boyd. 2005. Not by Genes Alone: How Culture Transformed
Human Evolution. Chicago: University of Chicago Press.
Rogers, E. M. 2003. Diffusion of Innovations (5th ed). New York: Free Press.
Schumpeter, J. 1942. Capitalism, Socialism, and Democracy. New York: Harper & Brothers
Publishers.
Stinchcombe, A.L. 1965. "Social Structure and Organizations." in Handbook of Organizations,
edited by J G March. Chicago: Rand McNally.
Stinchcombe, A.L. 1990. Information and Organizations. Berkeley, California: University of
California Press.
Strang D. and S. Soule. 1998. “Diffusion in Organizations and Social Movements: From Hybrid
Corn to Poison Pills.” Annual Review of Sociology, 24: 265-290.
Stuart, T., and J. Podolny. 1996. "Local Search and the Evolution of Technological Capabilities."
Strategic Management Journal 17:21-38.
Teece, D.J., G. Pisano, and A. Shuen. 1997. "Dynamic Capabilities and Strategic Management."
Strategic Management Journal 18:509-533.
Tushman, M., and P. Anderson. 1986. "Technological Discontinuities and Organizational
Environments." Administrative Science Quarterly 31:439-465.
Van den Bosch, Frans A.J., Henk W. Volberda, and Michiel de Boer. 1999. “Coevolution of
Firm Absorptive Capacity and Knowledge Environment: Organizational Forms and
Combinative Capabilities.” Organization Science, 10:551-568.
Zollo, Maurizio and Sidney G. Winter 2002. “Deliberate Learning and the Evolution of Dynamic
Capabilities.” Organization Science, 13:339-351.
40
Figures
Figure 1. Knowledge Space for 1984. Plot of patent co-citation network for all 1984 patents in
Electronics or Computers.
Similarity network based on co-citation patterns of patents. Nodes are patents. Patents that are located closer to one
another use a similar knowledge base. Clusters of nodes indicate that many patents use a particular knowledge base.
Six areas of heavy patenting are highlighted.
41
Figure 2. An Example Showing an Organization in both Knowledge Space and Product Space.
42
Figure 3. Knowledge space for 1984; only nodes are shown. Nodes are differentiated based
on whether patents are issued to computer manufacturers that use the Zilog Z80 CPU or
that use another CPU.
Heavy patenting areas for firms that use the Zilog Z80 CPU in 1984 are highlighted. We also see
some clustering from firms that use any other CPU, although this patenting tends to be more
dispersed.
43
Figure 4. Propensity to adopt a target CPU by knowledge relevance and generalism
** This plot is illustrated for ranges observed in these data. The multiplier of the CPU adoption rate for target CPU
is evaluated for organizations with knowledge consistency 0.4, the median value for a researching organization.
44
Tables
Table 1.
CPU Supplier Descriptive Statistics
Number of
organization-years
Number of
organizations First year in data
AMD 282 253 1975
AT&T 8 1 1985
Chips & Technologies 1 1 1991
Cyrix 124 97 1992
Data General 2 1 1981
DEC 18 7 1975
Fairchild 1 1 1979
Hewlett Packard 4 2 1986
Hitachi 9 4 1982
IBM 28 22 1990
Intel 4124 1463 1974
Intersil 19 9 1975
MIPS 19 9 1985
MOS 67 30 1975
Motorola 457 145 1974
National Semiconductor 16 9 1975
NEC 152 64 1987
RCA 10 2 1976
Sun Microsystems 44 19 1987
Texas Instruments 15 9 1975
Western Design Center 6 2 1984
Western Electric 9 5 1982
Zilog 625 227 1976
45
Table 2.
Number of transitions for across-supplier change: Organizations that offer a CPU by one supplier,
that subsequently adopt a CPU by another supplier, over all years.
1 2 3 4 5 6 7 8 9 10 11 12 13 14 15 16 17 18 19 20 21 22 23
AMD (1) 0 0 0 39 0 1 0 0 0 7 5 0 1 0 1 0 0 0 0 1 0 1 1
AT&T (2) 0 0 0 0 0 0 0 0 0 0 0 0 1 0 0 0 1 0 0 1 0 0 1
Chips & Technologies (3) 0 0 0 0 0 0 0 0 0 0 0 0 0 0 0 0 0 0 0 0 0 0 0
Cyrix (4) 8 0 0 0 0 0 0 0 0 2 3 0 0 0 0 0 0 0 0 1 0 0 0
Data General (5) 0 0 0 0 0 0 0 0 0 0 0 0 0 0 0 0 0 0 0 0 0 0 0
DEC (6) 0 0 0 0 0 0 0 0 0 0 1 0 2 0 4 1 0 0 0 1 0 1 1
Fairchild (7) 0 0 0 0 0 0 0 0 0 0 2 0 0 0 1 0 0 0 0 0 0 0 2
Hewlett Packard (8) 1 0 0 0 0 0 0 0 0 0 0 1 0 0 0 0 0 0 0 1 0 0 0
Hitachi (9) 0 0 0 0 0 0 0 0 0 0 1 0 0 0 0 0 1 0 0 0 0 0 1
IBM (10) 2 0 0 0 0 0 0 0 0 0 1 0 0 0 0 0 0 0 0 0 0 0 0
Intel (11) 159 1 1 71 1 3 0 2 0 14 0 4 9 2 48 2 35 0 14 10 1 2 22
Intersil (12) 0 0 0 0 0 1 0 0 0 0 1 0 0 0 3 0 0 0 0 1 0 0 1
MIPS (13) 1 0 0 1 0 2 0 0 0 0 1 1 0 0 1 0 0 0 0 0 0 0 0
MOS (14) 0 0 0 0 0 0 0 0 0 0 7 0 0 0 7 0 0 0 0 0 2 0 2
Motorola (15) 3 0 0 0 1 2 0 2 0 3 40 6 12 6 0 3 4 0 4 7 2 0 17
National Semiconductor (16) 0 0 0 0 0 1 0 0 0 0 4 0 0 0 1 0 0 0 0 0 0 0 1
NEC (17) 6 0 0 3 0 0 0 0 0 0 3 0 1 1 2 0 0 0 2 0 0 1 1
RCA (18) 0 0 0 0 0 0 0 0 0 0 0 0 0 0 0 0 0 0 0 0 0 0 0
Sun Microsystems (19) 4 0 0 4 0 0 0 1 0 1 3 0 0 0 3 0 0 0 0 1 0 0 0
Texas Instruments (20) 1 0 0 0 0 0 0 0 0 1 1 1 0 0 2 0 1 0 0 0 0 0 0
Western Design Center (21) 0 0 0 0 0 0 0 0 0 0 1 0 0 0 0 0 0 0 0 0 0 0 0
Western Electric (22) 0 1 0 0 0 0 0 0 0 0 3 0 0 0 1 0 1 0 0 1 0 0 2
Zilog (23) 3 1 0 0 1 1 0 1 0 1 66 1 1 4 23 4 9 0 2 3 0 4 0
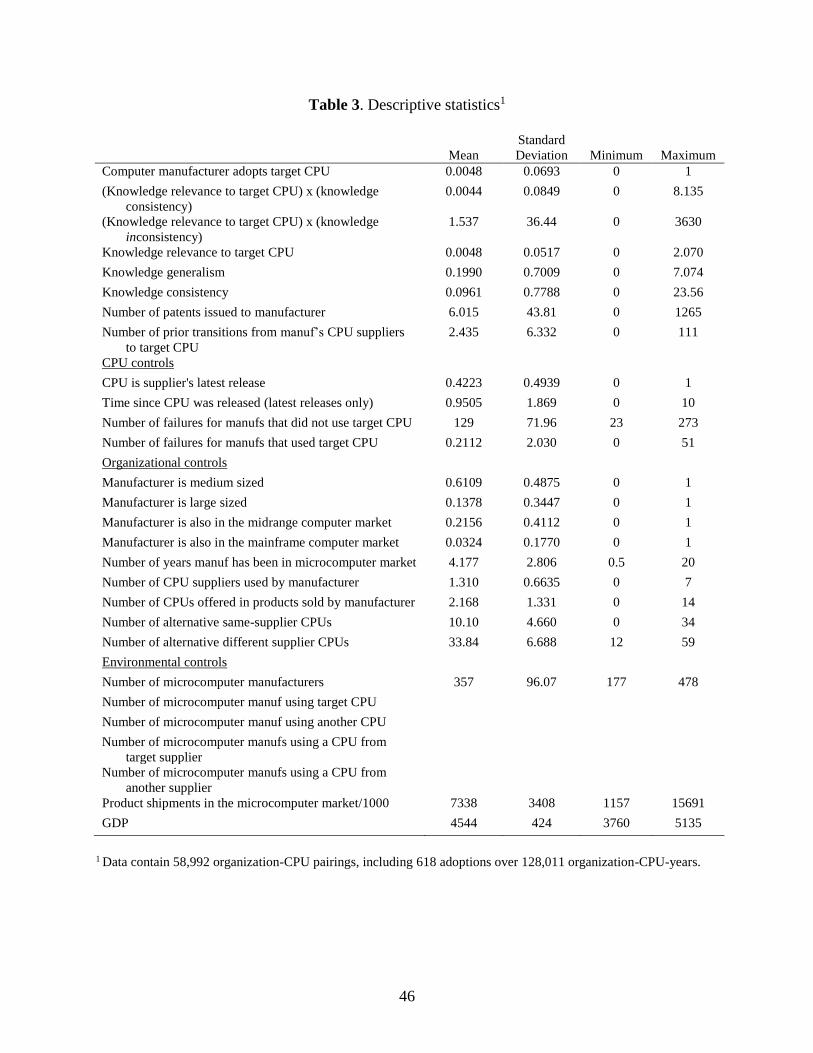
46
Table 3. Descriptive statistics1
Mean
Standard
Deviation Minimum Maximum
Computer manufacturer adopts target CPU 0.0048 0.0693 0 1
(Knowledge relevance to target CPU) x (knowledge
consistency)
0.0044 0.0849 0 8.135
(Knowledge relevance to target CPU) x (knowledge
inconsistency)
1.537 36.44 0 3630
Knowledge relevance to target CPU 0.0048 0.0517 0 2.070
Knowledge generalism 0.1990 0.7009 0 7.074
Knowledge consistency 0.0961 0.7788 0 23.56
Number of patents issued to manufacturer 6.015 43.81 0 1265
Number of prior transitions from manuf’s CPU suppliers
to target CPU
2.435 6.332 0 111
CPU controls
CPU is supplier's latest release 0.4223 0.4939 0 1
Time since CPU was released (latest releases only) 0.9505 1.869 0 10
Number of failures for manufs that did not use target CPU 129 71.96 23 273
Number of failures for manufs that used target CPU 0.2112 2.030 0 51
Organizational controls
Manufacturer is medium sized 0.6109 0.4875 0 1
Manufacturer is large sized 0.1378 0.3447 0 1
Manufacturer is also in the midrange computer market 0.2156 0.4112 0 1
Manufacturer is also in the mainframe computer market 0.0324 0.1770 0 1
Number of years manuf has been in microcomputer market 4.177 2.806 0.5 20
Number of CPU suppliers used by manufacturer 1.310 0.6635 0 7
Number of CPUs offered in products sold by manufacturer 2.168 1.331 0 14
Number of alternative same-supplier CPUs 10.10 4.660 0 34
Number of alternative different supplier CPUs 33.84 6.688 12 59
Environmental controls
Number of microcomputer manufacturers 357 96.07 177 478
Number of microcomputer manuf using target CPU
Number of microcomputer manuf using another CPU
Number of microcomputer manufs using a CPU from
target supplier
Number of microcomputer manufs using a CPU from
another supplier
Product shipments in the microcomputer market/1000 7338 3408 1157 15691
GDP 4544 424 3760 5135
1 Data contain 58,992 organization-CPU pairings, including 618 adoptions over 128,011 organization-CPU-years.
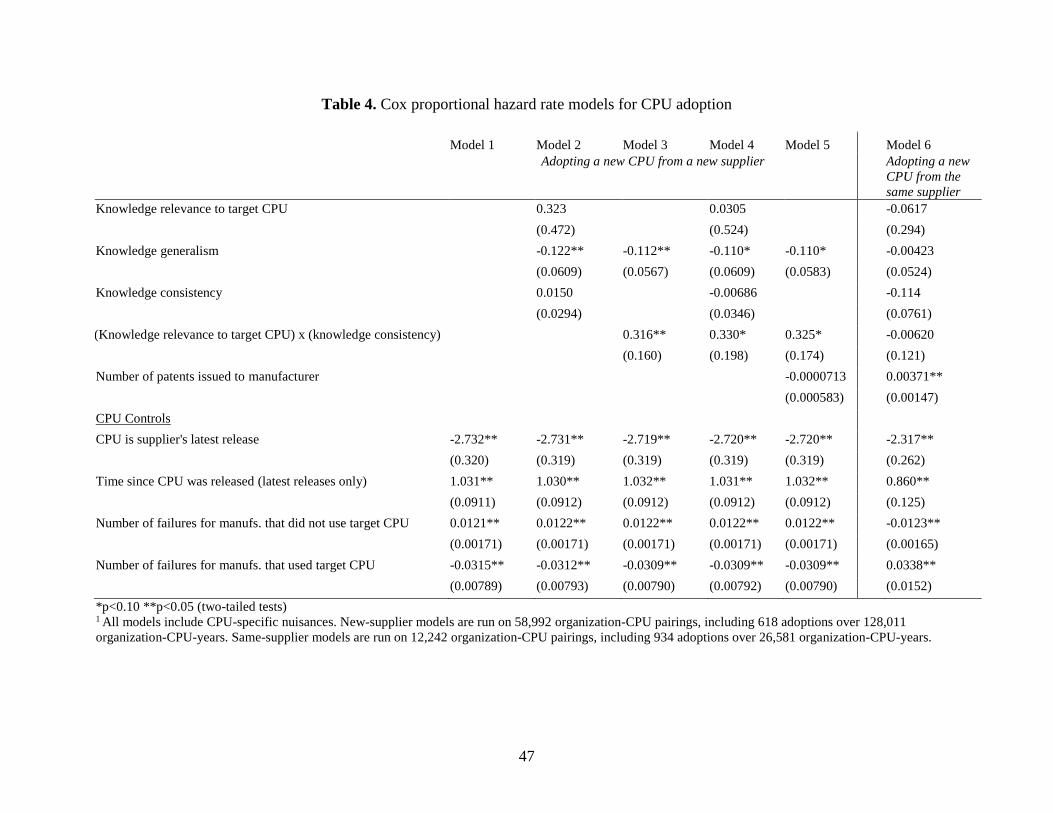
47
Table 4. Cox proportional hazard rate models for CPU adoption
Model 1 Model 2 Model 3 Model 4 Model 5
Model 6
Adopting a new CPU from a new supplier Adopting a new
CPU from the
same supplier
Knowledge relevance to target CPU 0.323 0.0305 -0.0617
(0.472) (0.524) (0.294)
Knowledge generalism -0.122** -0.112** -0.110* -0.110* -0.00423
(0.0609) (0.0567) (0.0609) (0.0583) (0.0524)
Knowledge consistency 0.0150 -0.00686 -0.114
(0.0294) (0.0346) (0.0761)
((Knowledge relevance to target CPU) x (knowledge consistency)
0.316** 0.330* 0.325* -0.00620
(0.160) (0.198) (0.174) (0.121)
Number of patents issued to manufacturer -0.0000713 0.00371**
(0.000583) (0.00147)
CPU Controls
CPU is supplier's latest release -2.732** -2.731** -2.719** -2.720** -2.720** -2.317**
(0.320) (0.319) (0.319) (0.319) (0.319) (0.262)
Time since CPU was released (latest releases only) 1.031** 1.030** 1.032** 1.031** 1.032** 0.860**
(0.0911) (0.0912) (0.0912) (0.0912) (0.0912) (0.125)
Number of failures for manufs. that did not use target CPU 0.0121** 0.0122** 0.0122** 0.0122** 0.0122** -0.0123**
(0.00171) (0.00171) (0.00171) (0.00171) (0.00171) (0.00165)
Number of failures for manufs. that used target CPU -0.0315** -0.0312** -0.0309** -0.0309** -0.0309** 0.0338**
(0.00789) (0.00793) (0.00790) (0.00792) (0.00790) (0.0152)
*p<0.10 **p<0.05 (two-tailed tests) 1 All models include CPU-specific nuisances. New-supplier models are run on 58,992 organization-CPU pairings, including 618 adoptions over 128,011
organization-CPU-years. Same-supplier models are run on 12,242 organization-CPU pairings, including 934 adoptions over 26,581 organization-CPU-years.
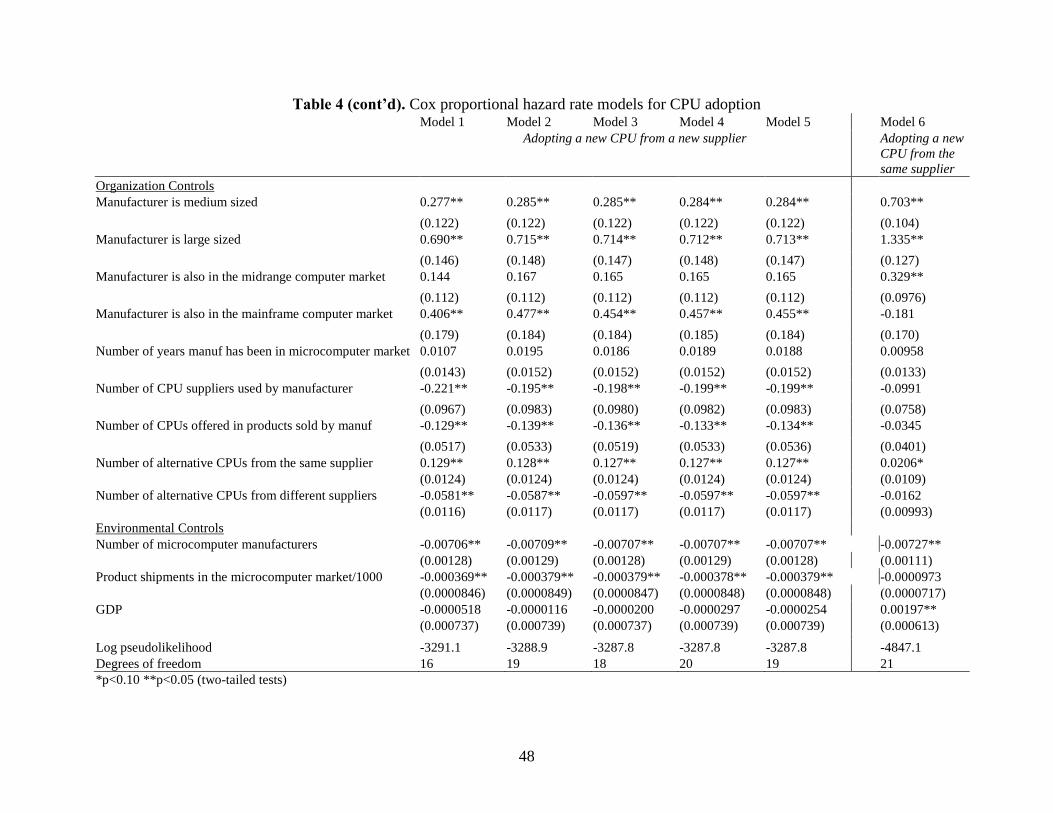
48
Table 4 (cont’d). Cox proportional hazard rate models for CPU adoption
Model 1 Model 2 Model 3 Model 4 Model 5
Model 6
Adopting a new CPU from a new supplier Adopting a new
CPU from the
same supplier
Organization Controls
Manufacturer is medium sized 0.277** 0.285** 0.285** 0.284** 0.284** 0.703**
(0.122) (0.122) (0.122) (0.122) (0.122) (0.104)
Manufacturer is large sized 0.690** 0.715** 0.714** 0.712** 0.713** 1.335**
(0.146) (0.148) (0.147) (0.148) (0.147) (0.127)
Manufacturer is also in the midrange computer market 0.144 0.167 0.165 0.165 0.165 0.329**
(0.112) (0.112) (0.112) (0.112) (0.112) (0.0976)
Manufacturer is also in the mainframe computer market 0.406** 0.477** 0.454** 0.457** 0.455** -0.181
(0.179) (0.184) (0.184) (0.185) (0.184) (0.170)
Number of years manuf has been in microcomputer market 0.0107 0.0195 0.0186 0.0189 0.0188 0.00958
(0.0143) (0.0152) (0.0152) (0.0152) (0.0152) (0.0133)
Number of CPU suppliers used by manufacturer -0.221** -0.195** -0.198** -0.199** -0.199** -0.0991
(0.0967) (0.0983) (0.0980) (0.0982) (0.0983) (0.0758)
Number of CPUs offered in products sold by manuf -0.129** -0.139** -0.136** -0.133** -0.134** -0.0345
(0.0517) (0.0533) (0.0519) (0.0533) (0.0536) (0.0401)
Number of alternative CPUs from the same supplier 0.129** 0.128** 0.127** 0.127** 0.127** 0.0206*
(0.0124) (0.0124) (0.0124) (0.0124) (0.0124) (0.0109)
Number of alternative CPUs from different suppliers -0.0581** -0.0587** -0.0597** -0.0597** -0.0597** -0.0162
(0.0116) (0.0117) (0.0117) (0.0117) (0.0117) (0.00993)
Environmental Controls
Number of microcomputer manufacturers -0.00706** -0.00709** -0.00707** -0.00707** -0.00707** -0.00727**
(0.00128) (0.00129) (0.00128) (0.00129) (0.00128) (0.00111)
Product shipments in the microcomputer market/1000 -0.000369** -0.000379** -0.000379** -0.000378** -0.000379** -0.0000973
(0.0000846) (0.0000849) (0.0000847) (0.0000848) (0.0000848) (0.0000717)
GDP -0.0000518 -0.0000116 -0.0000200 -0.0000297 -0.0000254 0.00197**
(0.000737) (0.000739) (0.000737) (0.000739) (0.000739) (0.000613)
Log pseudolikelihood -3291.1 -3288.9 -3287.8 -3287.8 -3287.8 -4847.1
Degrees of freedom 16 19 18 20 19 21
*p<0.10 **p<0.05 (two-tailed tests)

49
Table 5: Cox proportional hazard rate models, adopting a new CPU from a new supplier1 Model 7 Model 8 Model 9 Model 10 Model 11
Knowledge generalism -0.1100* -0.1115** -0.1317** -0.107* -0.115**
(0.0567) (0.0567) (0.0641) (0.0570) (0.0569)
(Knowledge relevance to target CPU) x (knowledge consistency)
0.3259** 0.3545** 0.281* 0.307*
(0.1602) (0.1617) (0.166) (0.164)
(Knowledge relevance to target CPU) x (knowledge inconsistency) 0.0007**
(0.0003)
Number of prior transitions from manufacturer's CPU suppliers to target CPU -0.004
(0.0061)
Environmental controls
Number of microcomputer manufacturers -0.0071** -0.0071** -0.0053**
(0.0013) (0.0013) (0.0014)
Number of microcomputer manufacturers using target CPU 0.00130
(0.00183)
Number of microcomputer manufacturers using another CPU -0.00831**
(0.00130)
Number of microcomputer manufacturers using a CPU from target supplier -0.00233
(0.00157)
Number of microcomputer manufacturers using a CPU from another supplier -0.00844**
(0.00132)
Product shipments in the microcomputer market/1000 -0.0004** -0.0004** -0.0004** -0.000433** -0.000399**
(0.0001) (0.0001) (0.0001) (0.0000851) (0.0000845)
Number of alternative same-supplier CPUs 0.1271** 0.1269** 0.1504** 0.127** 0.117**
(0.0124) (0.0124) (0.0130) (0.0123) (0.0125)
Number of alternative different-supplier CPUs -0.0598** -0.0601** -0.0611** -0.0570** -0.0669**
(0.0117) (0.0117) (0.0127) (0.0116) (0.0117)
GDP 0.0000 0.0000 0.0002 0.000362 -0.0000256
(0.0007) (0.0007) (0.0008) (0.000726) (0.000727)
Supplier fixed effect No No Yes No No
*p<0.10 **p<0.05 (two-tailed tests) 1All models include CPU-specific nuisances. Models are run on 58992 organization-CPU pairings, including 618 adoptions over 128011 organization-CPU-years.
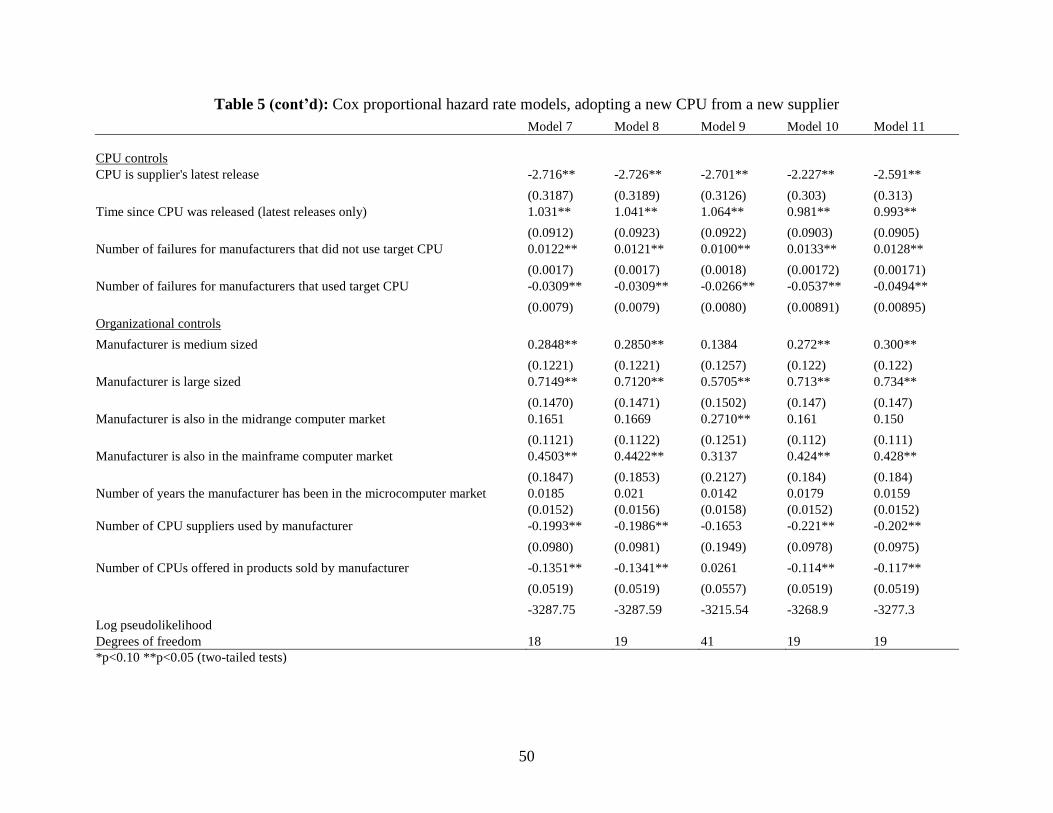
50
Table 5 (cont’d): Cox proportional hazard rate models, adopting a new CPU from a new supplier
Model 7 Model 8 Model 9 Model 10 Model 11
CPU controls
CPU is supplier's latest release -2.716** -2.726** -2.701** -2.227** -2.591**
(0.3187) (0.3189) (0.3126) (0.303) (0.313)
Time since CPU was released (latest releases only) 1.031** 1.041** 1.064** 0.981** 0.993**
(0.0912) (0.0923) (0.0922) (0.0903) (0.0905)
Number of failures for manufacturers that did not use target CPU 0.0122** 0.0121** 0.0100** 0.0133** 0.0128**
(0.0017) (0.0017) (0.0018) (0.00172) (0.00171)
Number of failures for manufacturers that used target CPU -0.0309** -0.0309** -0.0266** -0.0537** -0.0494**
(0.0079) (0.0079) (0.0080) (0.00891) (0.00895)
Organizational controls
Manufacturer is medium sized 0.2848** 0.2850** 0.1384 0.272** 0.300**
(0.1221) (0.1221) (0.1257) (0.122) (0.122)
Manufacturer is large sized 0.7149** 0.7120** 0.5705** 0.713** 0.734**
(0.1470) (0.1471) (0.1502) (0.147) (0.147)
Manufacturer is also in the midrange computer market 0.1651 0.1669 0.2710** 0.161 0.150
(0.1121) (0.1122) (0.1251) (0.112) (0.111)
Manufacturer is also in the mainframe computer market 0.4503** 0.4422** 0.3137 0.424** 0.428**
(0.1847) (0.1853) (0.2127) (0.184) (0.184)
Number of years the manufacturer has been in the microcomputer market 0.0185 0.021 0.0142 0.0179 0.0159
(0.0152) (0.0156) (0.0158) (0.0152) (0.0152)
Number of CPU suppliers used by manufacturer -0.1993** -0.1986** -0.1653 -0.221** -0.202**
(0.0980) (0.0981) (0.1949) (0.0978) (0.0975)
Number of CPUs offered in products sold by manufacturer -0.1351** -0.1341** 0.0261 -0.114** -0.117**
(0.0519) (0.0519) (0.0557) (0.0519) (0.0519)
Log pseudolikelihood
-3287.75 -3287.59 -3215.54 -3268.9 -3277.3
Degrees of freedom 18 19 41 19 19
*p<0.10 **p<0.05 (two-tailed tests)