chapter 14 managing projects and programs · pdf filechapter 14 managing projects and programs...
TRANSCRIPT

Chapter 14Managing Projects and Programs
“A journey of a thousand miles begins with a single step”
Chinese proverb
Carl D. Martland, “Toward More Sustainable Infrastructure”

“Successful organizations create projects that produce desired results in established
time frames with assigned resources.”
S.E. Portny et al, Project Management, 2008, p. 2

Management of Projects and Programs
• Project management: – Detailed planning, scheduling, monitoring and
adjusting the processes involved in implementing a specific project
• Program management – Evaluating and then managing a series of
related projects using common processes and evaluation criteria

Stages of Project Management
1. Preparing to implement the project
2. Managing construction
3. Managing the transition from construction to operation
4. Completing the project
5. Assessing or auditing the project

Preparing to Implement the Project: Sub-Tasks
• Financing • Acquisition of land • Public approvals • Construction strategy • Marketing • Transition planning

Preparing to Implement the Project: Potential Pitfalls
• As a result of general economic conditions, difficulty in obtaining financing may cause delay or cancellation
• Inability to acquire the necessary land may require restructuring of the project
• A major client may back out of a lease, so that it becomes impossible to get a construction loan

Managing Construction:Sub-Tasks
• Preparing a network diagram • Scheduling • Budgeting • Risk management planning • Mitigating social and environmental impacts
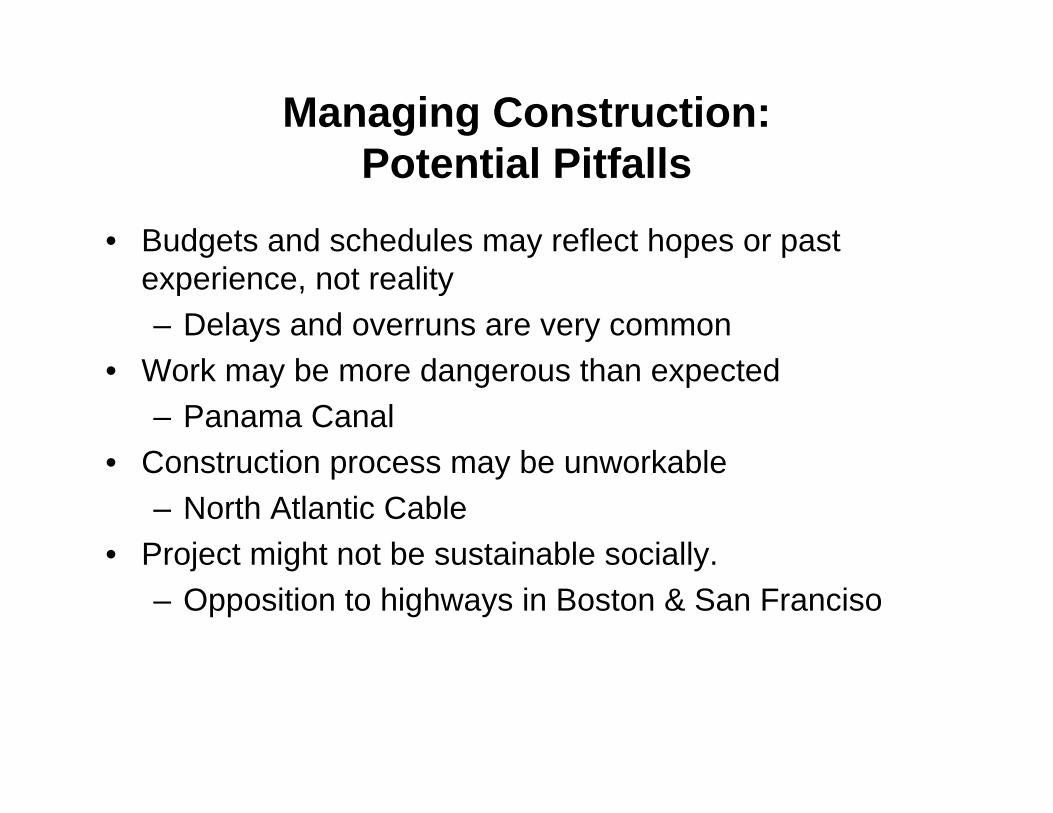
Managing Construction:Potential Pitfalls
• Budgets and schedules may reflect hopes or past experience, not reality –Delays and overruns are very common
• Work may be more dangerous than expected –Panama Canal
• Construction process may be unworkable –North Atlantic Cable
• Project might not be sustainable socially. – Opposition to highways in Boston & San Franciso

Separation of Storm SewersCambridge, Massachusetts
• Prevent run-off from storms causing overflowof sewerage into river.
• Managers coordinated project with upgrade ofMIT’s sewerage system.
• Implementation planned to minimize disruption tovehicle and pedestriantraffic on and across Mass Avenue, a majorarterial road in Cambridge.

Managing the Transition from Construction to Operation:
Sub-Tasks
• Sub-Tasks depend upon type of project • Buildings: prepare space for occupancy by
tenants • Transportation: prepare procedure for safe
opening of new facility
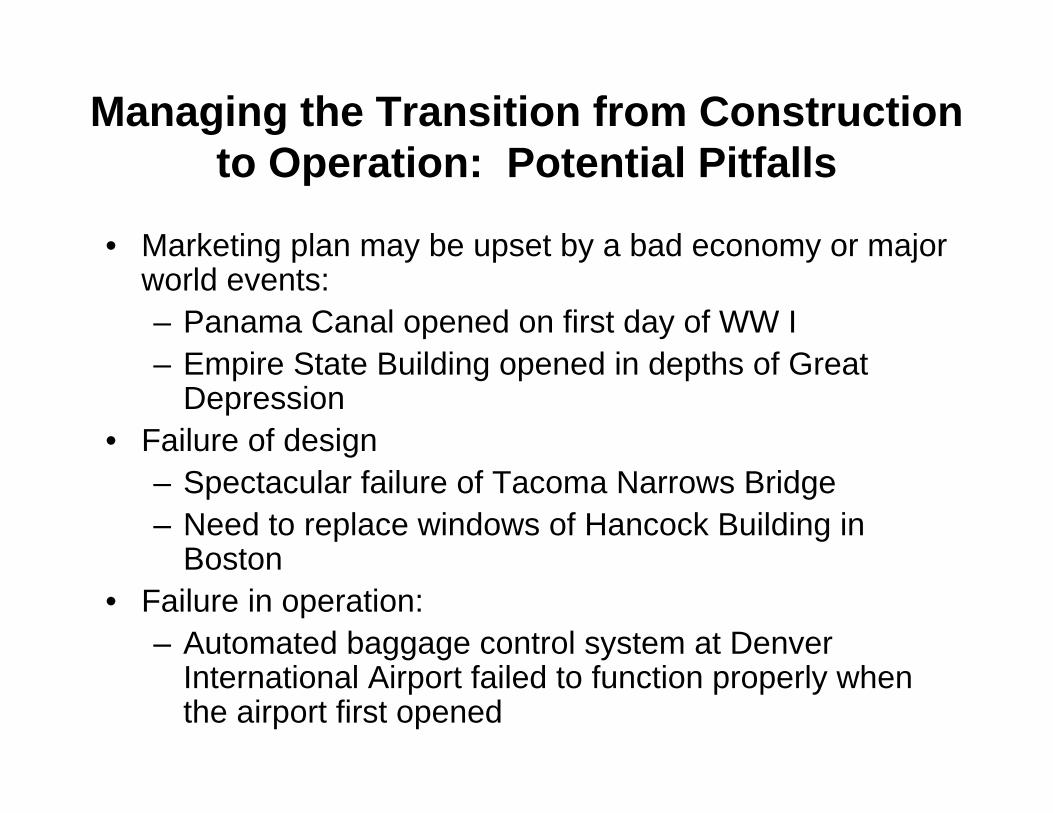
Managing the Transition from Construction to Operation: Potential Pitfalls
• Marketing plan may be upset by a bad economy or major world events: –Panama Canal opened on first day of WW I – Empire State Building opened in depths of Great
Depression • Failure of design
–Spectacular failure of Tacoma Narrows Bridge – Need to replace windows of Hancock Building in
Boston • Failure in operation:
– Automated baggage control system at Denver International Airport failed to function properly whenthe airport first opened
Project Completion:Sub-Tasks
• Finishing touches and corrections • Finances: sell or re-finance • Turn over all responsibility to new owners or
operating managers

Project Completion:Potential Pitfalls
• Lack of demand: – Many condominium complexes were built in
expectation of an ever-rising market, but were in fact completed after the collapse of the real estate market in 2008; thousands of condos remained vacant for years.
• Public resistance prevents operation: – The Shoreham Nuclear Power Plant on Long Island
was completed and eventually approved for operation, but new opened because of intense local opposition.

Assessing or Auditing the Project:Sub-Tasks
• Evaluation of the construction process – Safely completed on time and on budget?
• Evaluation of the construction design – Was this an effective design?
• Evaluation of the project with respect to its goals
– Did the project actually meet its original financial, social, or environmental goals?

Assessing or Auditing Projects:Potential Pitfalls
• Materials may turn out to be hazardous – Use of asbestos for insulation
• Failure to provide protection may lead to fatalities
– Failure to provide safety nets for construction of bridges or tall buildings
• Environmental impacts may be extreme – Reliance on auto has led to massive problems
related to safety, emissions and land use • Design may turn out to be inappropriate
– Public housing projects in St. Louis were demolished after only 20 years

Project Management Techniques
• Statement of work • Work breakdown structure • Network diagrams • Schedules • Budgets

Statement of Work
• Part of the contractual agreement between the owner and the builder or the basic objective for the project manager
• What is to be done, using what resources, within what timetable
• Changes to the statement of work may be needed: –Owner: change in scope of project – Contractors: changes in costs, time or processes
may be needed – Trade-off: time required to complete project vs. cost
of completion

Statement of Work:Basis for Initial Estimates
• Past experience – Just another fast food restaurant, or a typical
railroad siding, or another modest office building
• Self-confidence – Eiffel Tower – based upon use of same
materials to build bridges • Careful planning
– Dams, space stations and other projects requiring special technology and careful attention to the site

Work Breakdown Structure (WBS)
• Break down a complex project into manageable activities
• Identify and categorize all of the steps that will be required
• Can be shown as a table or as an organizational chart

Work Breakdown Structure
• Top-down description of the project • Functional and physical elements • Mutually exclusive, collectively exhaustive
description of the work elements
Goal: A logical structure that can be used at any
level of analysis related to estimating the cost of a project

Work Breakdown Structure(Partial)
Commercial Building Project 1-0
Grading 1-1-1
Excavation 1-1-2
Foundation 1-1-3
Site Work &Foundation 1-1
Exterior 1-2
Interior 1-3
Roof 1-4
Break the work into segments for which thereis a clear and logical way to assign costs.

WBS for Constructing a New Rail Line
Construct Rail Line
Prepare Route Construct Bridges Connect to Existing Lines Install Track Install Signals
Survey
Cut & Fill
Drainage
Install ballast
Install ties
Install rail
Select location
Design
Construct

Network Diagram
• Show how the activities in the WBS are related
• Some activities can start immediately; others must wait until prerequisite activities are completed
• Interdependencies among activities may reflect logic, regulations, choice of technology or contractor preferences

Network Diagram for a New Rail Line
Drainage Ballast Install ties
dge
Cut & Fill
Install rail Design Bri
Bridge Construct
Install Signals
Connect to Other Lines
Commence Operations

Shedules for Activities
• Earliest start date • Latest start date • Critical path of activities (the minimum time for
completion of the project) • Slack time
– The difference between the earliest and latest start date for an activity
– Equals zero for activities on the critical path
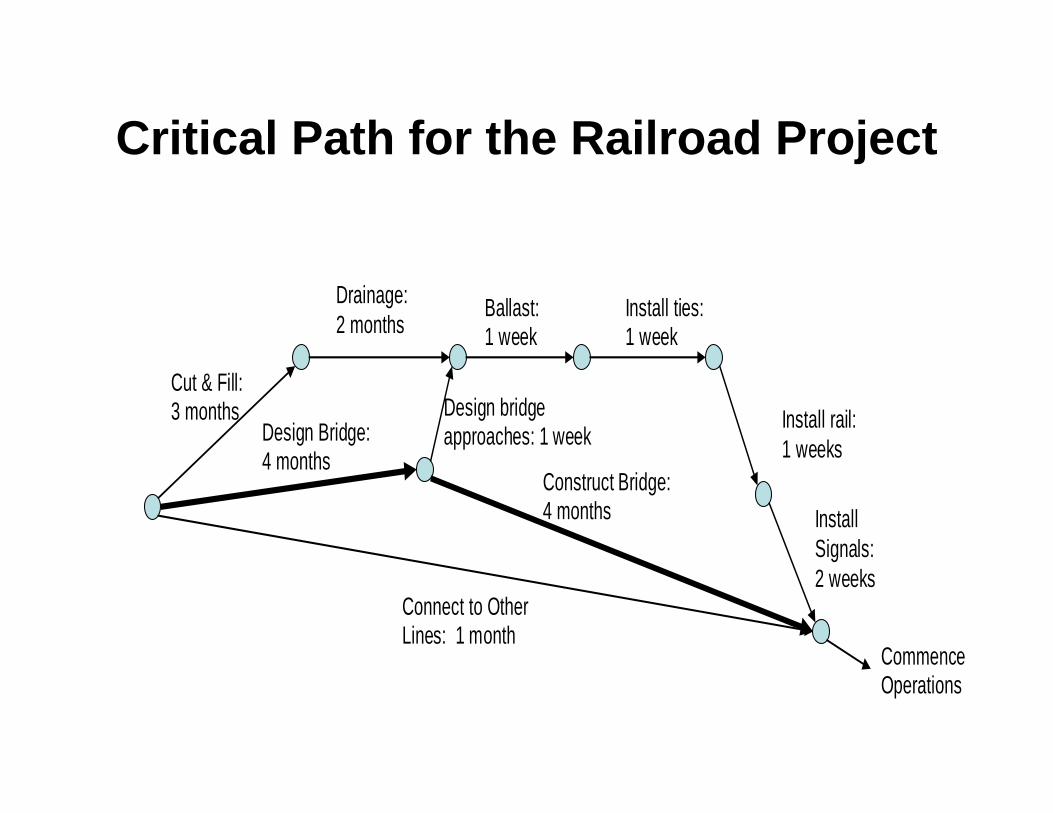
Critical Path for the Railroad Project
Cut & Fill: 3 months
Design Bridge: 4 months
Connect to Other Lines: 1 month
Construct Bridge: 4 months
Install rail:Design bridge
1 weeks
Install Signals: 2 weeks
approaches: 1 week
Commence Operations
Drainage: Ballast: Install ties: 2 months 1 week 1 week

Task Schedule for Construction of a New Rail Line
0 10 20 30 40
Weeks
Design Bridge
Install Bridge
Prepare Route
Install Track
Design Connection
Build Connection

Linear Responsibility Chart
• List all activities • Identify all people involved in managing project • Indicate who plays what role for each activity • Review responsibilities with each manager • Revise and repeat as necessary until the chart is
understood and accepted by everyone • Review and update as needed

Linear Responsibility Chart for Construction of a New Rail Line
Task Project
Manager
Assistant Chief Engineer -
Design
Leader, Route
Prepara-tion Gang
Leader, Track Gang
Leader, Bridge GangDesign Field
Design Connection A P
Build Connection A P S
Install Track A P S
Prepare Route A P S
Design Bridge A P
Install Bridge A P S
Logistics P S S
A – Approval Authority; P – Primary Responsibility; S – Secondary Responsibility
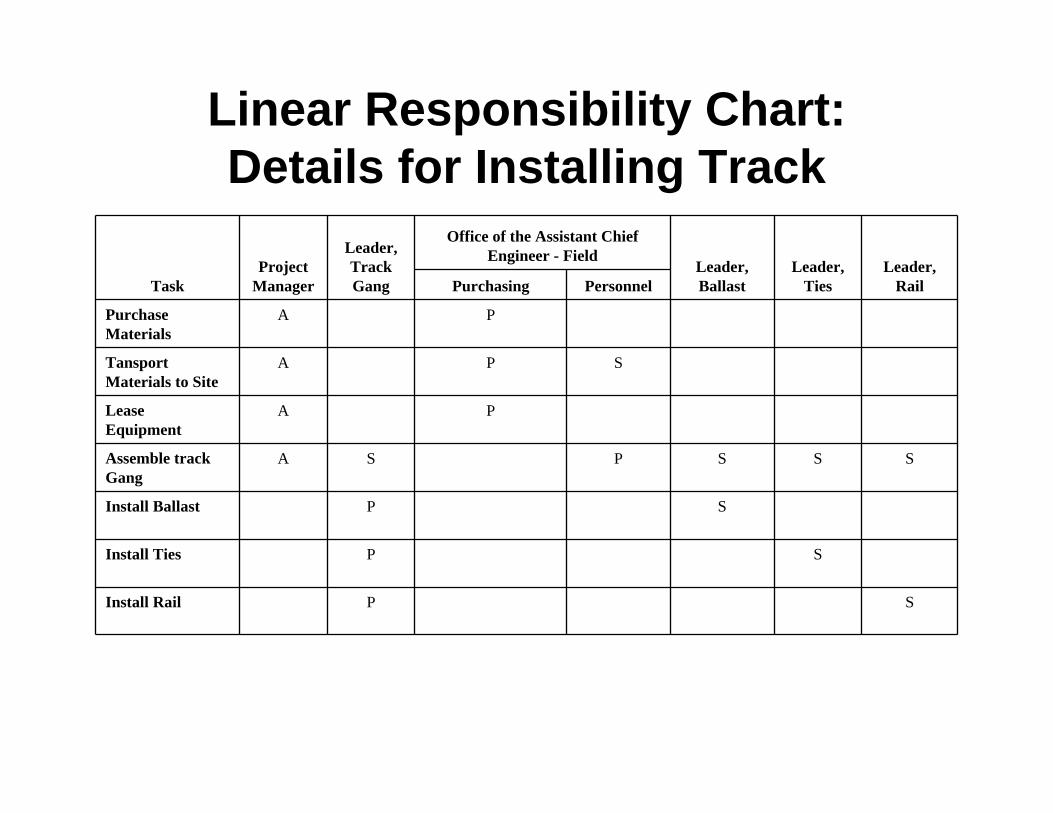
Linear Responsibility Chart:Details for Installing Track
Task Project
Manager
Leader, Track Gang
Office of the Assistant Chief Engineer - Field
Leader, Ballast
Leader, Ties
Leader, RailPurchasing Personnel
Purchase Materials
A P
Tansport Materials to Site
A P S
Lease Equipment
A P
Assemble track Gang
A S P S S S
Install Ballast P S
Install Ties P S
Install Rail P S

Estimating Resource Requirements
• How many people will be needed for each task?
• How long will it take them to complete each task?
• How many tasks can they complete each day and each week?
• How much material will be needed?

Estimating Resource Requirements:19th Century Rail Gang
Task Number Task Name Gang
Size Time Required
1 Position tie plate and spikes
2 men 5 minutes
2 Spike tie plates 4 men 5 minutes
3 Place rail 50 men 5 minutes
4 Spike rail 4 men 5 minutes
5 Attach joint bars 2 men 15 minutes
Total 62 men 35 minutes

Plan A for the 62-Man Gang: 16 Rails per Day
Time Interval
1st
Rail 2nd
Rail 3rd
Rail 4th
Rail 5th
Rail 6th
Rail 7th
Rail 0-5 min. 1 5-10 2 10-15 3 1 Increasing delays 15-20 4 2 are introduced 20-25 5 3 1 because in takes so 25-30 5 4 2 30-35 5 3 long for Task 5 35-40 5 4 1 40-45 5 2 45-50 5 3 1 50-55 5 4 2 55-60 5 3 1

Modifying the Work Schedule
• Problem: 16 rails per day means that it would take far too long to complete the job
• Plan B: – Have a few men come in early to position all
the tie plates for the day’s work (Task 1) – Have a few men start spiking tie plates before
the main gang arrives (Task 2) – Put more men to work on anchor bars (Task
5), which was the task holding up progress.

Plan B: 48 Rails per Day
Time 1st Rail 2nd Rail 3rd Rail 4th Rail 5th Rail 6th Rail 7th Rail Early Work 1,2 1,2 1,2 1,2 1,2 1,2 1,2
0-5 3 5-10 4 3
10-15 5a 4 3 15-20 5a 5b 4 3 20-25 5a 5b 4 3 25-30 5b 5a 4 3 30-35 5a 5b 4 3 35-40 5a 5b 4 40-45 5b 5a 45-50 5a 5b

Further Increases in Productivity
• Assign a third team to Task 5 in order to eliminate all of the delays – 80 rails per day
• Assign another gang to start from the other end of the new route: – 160 rails per day
• Provide some mechanical assistance in moving the rail, so that it wouldn’t take 50 men to do the job (Task 3); small gangs could then do morework in one day

The Modern Process is Highly Mechanised

Cost Estimation and Budgets
• Rough estimates will be sufficient at first – Cost estimates that are accurate only to +/- 30-40%
will likely still be better than estimates of possible benefits or the costs of financing
– Overlooking costs is more likely to be a problem than mis-estimating costs
–Rules-of-thumb are commonly used • More accurate costs will be needed as the number of
options dwindles, but +/- 10-15% will be OK • Eventually, once the project is approved, a budget
should be accurate to within a few percent

Sources of Information
• Internal to firm or agency – Accounting system & historical records– Special studies
• External – Expert opinion – Published data (e.g. industry cost studies)
• Special Studies – R&D – Comparison with prior studies

Expert Opinion
• Comprehensive perspective on range of costs
• Sophisticated Work Breakdown Structure
• Experience and Understanding – Cost drivers and unit costs – Potential problems – and how to deal with them – Contacts and comparisons re: similar projects

Costing Using WBS: Creating Rules of Thumb
• Obtain unit costs for all elements and activities required to construct a particular type of structure (e.g. excavation, floor coverings, walls, windows, or roofing)
• Design a “model” structure (e.g. an 8-story office building, with 12-foot stories, and 100,000 SF of floor space)
• Count the total units required for the model structure and calculate the cost/SF of floor space
• Use these costs/SF as estimates for similar buildings

Estimates of Unit Costs for Constructing an Office Building
Task Unit Unit Cost
Cost/SF of Building
1-1-2 Excavation and preparation for slab
Sq. Ft. of ground $1.10 $0.14
1-2-1 Exterior walls, pre-cast concrete panels (80%) SF of wall $17.59 $6.08
1-2-2 Windows (20%) Each $375 $2.16
1-3-6 Floor Finishes – 60% carpet; 40% tile SF of floor $5.02 $5.02
1-4-1Roof covering – tar & gravel with flashings SF of roof $2.32 $0.29
Add it all up to get a total cost/SF for the “model” Source: RS Means, “Square Foot Costs 2000”

Costs per Square Foot of Floor Area for 5-10 Story Office Buildings
Exterio Wall
Square Feet Area 50,000 60,000 70,000 80,000 90,000 100,000
Linear Feet Perimeter
328 370 378 410 441 450
Precast Concrete Panel
Steel Frame $92.45 $92.75 $88.20 $87.10 $86.20 $85.85
Reinforced Concrete Frame $92.85 $92.15 $89.55 $88.45 $87.55 $86.20
Source: RS Means, “Square Foot Costs 2000”

Exterio Wall
Square Feet Area 50,000 60,000 70,000 80,000 90,000
Linear FeetPerimeter
328 370 378 410 441
Costs per Square Foot of Floor Area for 5-10 Story Office Buildings
A steel frame building with 100,000 100,000SF of space would be estimated to
cost $85.85 per SF for a total of $8.6 million 450
Precast Steel Frame $92.45 $92.75 $88.20 $87.10 $86.20Concrete
Panel ReinforcedConcrete
$92.85 $92.15 $89.55 $88.45 $87.55 $86.20Frame
$85.85
Source: RS Means, “Square Foot Costs 2000”

Total Cost/SF, Various Office BuildingsModel: 8-stories, each 12’ high, 100,000 SF floor area
(Source: RS Means, “Square Foot Costs 2000”)
Steel Frame Concrete Frame
78 80 82 84 86 88 90 92 94
Con
stru
ctio
n C
ost
($/S
q.Ft
.)
60,000 80,000 100,000 120,000
Sq. Ft. of Floor Space

Total Cost/SF, Various Office Buildingsand the reported range for recently completed projects
(Source: RS Means, “Square Foot Costs 2000”)
Steel Frame Concrete Frame
60,000 80,000 100,000 120,000 Lowest Highest
Sq. Ft. of Floor Space
0 20 40 60 80
100 120 140
Con
stru
ctio
n C
ost
($/S
q.Ft
.)

Using Past Experience to Estimate Costs
• Past experience is useful, and statistical techniques can be used to estimate cost models
• It is necessary to adjust past experience for: – Inflation – Economies of Scale (e.g. power sizing) – Experience (i.e. the learning curve)

Statistical Techniques
• Data: cost for similar projects Cost as a Function of • Analysis: regression analysis Size • Model: relate cost to key
variables using reasonable 80
functional form 60 40 20
0 0 50
Tot
al C
ost
No. of Units or Size
Premium Std. El Cheapo
100

Adjusting for Inflation
Estimating current cost C(0)as a function of past cost C(P):
C(0) = C(P)(Current cost index/cost index year P)
Estimating future costs C(F) as a function of current cost C(0):
C(F) = C(0) (1 + Expected Inflation)

Adjusting Costs for Inflation: given actual costs from 1981 to 2009, predict costs for a similar project
in 2010 as the average of the current $ costs
Year of Project Actual Cost Cost Index
(1981 = 100)
Current $ Cost (2009
dollars)
Future $ Cost (2010
dollars)
1981 $70 thousand 88.3 $221
thousand $227 thousand
1985 $80 116.6 $191 $197
1997 $130 167.6 $216 $222
2001 $160 195.0 $228 $235
2004 $170 219.9 $215 $222
2009 $200 278.3 $200 $206
2010 278.3 (1.03) $212 $218

Power-Sizing
We can relate costs of new project (or of a workelement or of a component) to costs of a similar oneof a different size, if we know there is a clear relationship between size and cost
Cost is proportional to (Size)b
Cost A/Cost B = (Size A/Size B)b
Where b is based upon statistical analysis, physics,standards or expert opinion

Example: Power Sizing
Size of Project (Base Case = 100) b 50 75 100 150 200 500 1000
0.6 66 84 100 128 152 263 398
0.8 57 79 100 138 174 362 631
1.0 50 75 100 150 200 500 1000
1.2 44 71 100 163 230 690 1585
1.4 38 67 100 176 264 952 2512
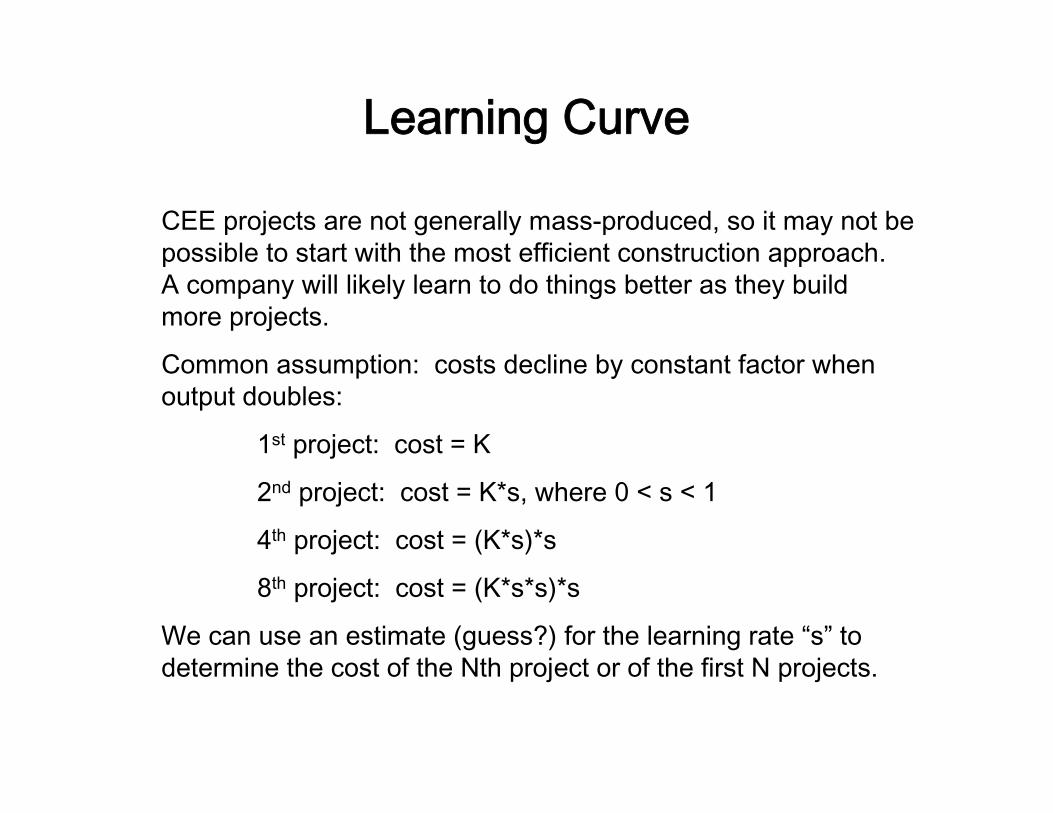
Learning Curve
CEE projects are not generally mass-produced, so it may not be possible to start with the most efficient construction approach. A company will likely learn to do things better as they build more projects.
Common assumption: costs decline by constant factor when output doubles:
1st project: cost = K
2nd project: cost = K*s, where 0 < s < 1
4th project: cost = (K*s)*s
8th project: cost = (K*s*s)*s
We can use an estimate (guess?) for the learning rate “s” to determine the cost of the Nth project or of the first N projects.

Effect of Learning Curve on the Cost of a Project (Base Cost = 100)
Repitions Doublings 98% 97% 95% 90% 85% 80% 75% 1 0 100 100 100 100 100 100 100 2 1 98 97 95 90 85 80 75 4 2 96 94 90 81 72 64 56 8 3 94 91 86 73 61 51 42
16 4 92 89 81 66 52 41 32 32 5 90 86 77 59 44 33 24 64 6 89 83 74 53 38 26 18
128 7 87 81 70 48 32 21 13 256 8 85 78 66 43 27 17 10 512 9 83 76 63 39 23 13 8
1024 10 82 74 60 35 20 11 6

Learning Curve Example • Bidding on a project to strengthen 8 bridges
–Estimated cost of first bridge: $1 million –Estimated learning curve: 90%
• Estimate costs for three bridges directly from the table:–Cost of second bridge: $0.9 million –Cost of fourth bridge: $0.81 million –Cost of eighth bridge: $0.73 million
• Interpolate to get the costs for the other bridges: –Cost of third bridge: approx. $0.85 million – Cost of bridges 5,6, and 7: approx. $0.77 million
each • Total for eight bridges: $6.6 million (versus $8 million if
there were no benefit from the learning curve)

Including Overhead Expenses
• Overhead includes expenses that are not directly associated with any project, such as: –Administration –Marketing –Office expenses –Property taxes
• Economists recommend pursuing projects if revenues will make some contribution to overhead and profit
• Accountants generally apportion overhead to projects based upon rules (which may be arbitrary and illogical): –Overhead = X% of project costs –Overhead = Y% of salaries plus Z% of other costs

Traditional Structure for a Public Project
• Design competition – Request submission of conceptual designs
• Selection of best concept and contract with winner to prepare final design
• Competitive bidding for the construction job • Select contractor or general contractor • Supervise contractor as construction proceeds • Upon completion, public agency manages
operations

Keys to Effective Cost Estimation
• Use common sense – Spend time on the “cost drivers” – Create a logical cost structure
• Use mathematics – Simple to sophisticated, as required
• Provide a reasonable level of detail • Use parameters (variables, not constants) for unit
costs, productivity, size, and performance • Be organized, consistent and careful

Using Common Sense to Create a Simple Cost Model: Basic Cost Information
Constant $ Costs for Completed Apartment
Buildings
80 60
40 20 0
0 20 40 60 80
No. of Units or Size
Premium Std. Budget
Tota
l Cos
t
Expert Judgment
1. Data seem to show a linear relationship
2. Quality should be a multiplier
3. Past projects each had their own quirks that need not be included in the model

Using Common Sense to Create a Simple Cost Model: Structuring the Model
1. Developer’s judgment determines the model structure:
TC = (FC + Cost/Unit*Units)(Quality Factor)
2. Past experience provides estimates of FC and VC
FC = $20 million
VC = $0.5 million per unit
3. An approximate quality factor will be fine:
Premium 140% of standard Lowest quality units: 80% of standard

Using Common Sense to Create a Simple Cost Model: A Simple, Easily Used Model
0 10 20 30 40 50 60 70 80 90
10 20 30 40 50 60 70
Number of Apartments
Con
stru
ctio
n C
ost (
$mill
ions
)
Premium Std. Budget

Organizational Structure
• Three broad phases in the life of a project: – Design – Build – Operate
• These phases can be managed by a single company or public agency or by different companies or agencies

Problems with the Traditional Approach
• There is a disconnect among the various stages of the project: – Designers may not be concerned with the costs of
construction or operations – Construction firms may not worry about the life cycle
costs of operations and maintenance – There is little opportunity for synergism, so that the
design may not reflect the expertise of contractors orthe needs of operators
• The public agency may not have the expertise to opearte the facility when it is completed
• The public agency may not be able to finance the facility

Other Approaches
• Design/Build (DB) – The same company designs and constructs
the project • Design/Build/Operate (DBO)
– The same company also operates the facility • Design/Build/Operate/Transfer (DBOT)
– Operation of the facility is transferred back to the public agency after a specified number of years
MIT OpenCourseWarehttp://ocw.mit.edu
1.011 Project Evaluation Spring 2011
For information about citing these materials or our Terms of Use, visit: http://ocw.mit.edu/terms.