chapter 13 statement of cash flows
TRANSCRIPT

1. It is costly to accumulate the data needed and to prepare the statement of cash flows.
2. It focuses on the differences between net income and cash flows from operating activities, and the data needed are generally more readily available and less costly to obtain than is the case for the direct method.
3. In a separate schedule of noncash investing and financing activities accompanying the statement of cash flows.
4. The $30,000 increase must be added to income from operations because the amount of cash paid to merchandise creditors was $30,000 less than the amount of purchases included in the cost of goods sold.
5. The $25,000 decrease in salaries payable should be deducted from income to determine the amount of cash flows from operating activities. The effect of the decrease in the amount of salaries owed was to pay $25,000 more cash during the year than had been recorded as an expense.
6. A. $100,000 gain
B. Cash inflow of $600,000
C. The gain of $100,000 would be deducted from net income in determining net cash flow from operating activities; $600,000 would be reported as cash flows from investing activities.
7. Cash flows from financing activities—issuance of bonds, $1,960,000 ($2,000,000 × 98%)
8. A. Cash flows from investing activities—Cash received from the disposal of fixed assets,$15,000
The $15,000 gain on asset disposal should be deducted from net income in determining net cash flow from operating activities under the indirect method.
B. No effect
9. The same. The total amount reported as the net cash flow from operating activities is not affected by the use of the direct or indirect method.
10. Cash received from customers, cash payments for merchandise, cash payments for operating expenses, cash payments for interest, cash payments for income taxes.
CHAPTER 13STATEMENT OF CASH FLOWS
DISCUSSION QUESTIONS
13-1© 2017 Cengage Learning. All Rights Reserved. May not be scanned, copied or duplicated, or posted to a publicly accessible website, in whole or in part.
Managerial Accounting 14th Edition Warren Solutions ManualFull Download: http://testbanklive.com/download/managerial-accounting-14th-edition-warren-solutions-manual/
Full download all chapters instantly please go to Solutions Manual, Test Bank site: testbanklive.com

CHAPTER 13 Statement of Cash Flows
BE 13–1
A. Investing D. OperatingB. Investing E. OperatingC. Operating F. Financing
BE 13–2
Net income……………………………………………………………………...………… $224,500
Adjustments to reconcile net income to net cash flow from operating activities:
Depreciation……………………………………………………..…………………… 11,575
Amortization of patents…………………………………..………………………… 2,500
Gain from sale of investments…………………………….……………………… (33,190)
Net cash flow from operating activities……………………..……………… $205,385
BE 13–3Net income…………………………………..……………………………………………… $75,800
Changes in current operating assets and liabilities:Increase in accounts receivable………………………………...………………… (5,000)
Increase in inventory…………………………….…………………………………… (7,450)
Increase in accounts payable………………………….…………………………… 3,380
Net cash flow from operating activities………………….…………………… $66,730
Note: The change in dividends payable impacts the cash paid for dividends,
which is disclosed under financing activities.
BE 13–4Cash flows from operating activities:
Net income…………………………………….………………………… $396,200Adjustments to reconcile net income to net cash flow
from operating activities: Depreciation………………………………...……………………… 61,250
Loss on disposal of equipment……………………………..… 27,600
Changes in current operating assets and liabilities:Increase in accounts receivable……………………………… (9,000)
Increase in accounts payable……………………….………… 3,350
Net cash flow from operating activities…………………… $479,400
BASIC EXERCISES
13-2© 2017 Cengage Learning. All Rights Reserved. May not be scanned, copied or duplicated, or posted to a publicly accessible website, in whole or in part.

CHAPTER 13 Statement of Cash Flows
BE 13–5
The gain on the sale of land is subtracted from net income in the Operating Activitiessection.
Gain on sale of land………………………….……………………………………… $ (40,000)
The purchase and sale of land is reported as part of cash flows from investing activities as shown below.
Cash received from sale of land…………………..……………………………… 240,000
Cash paid for purchase of land………………………..………………………… (400,000)
BE 13–6
Cash flows from financing activities:Cash received from issuing common stock $800,000Cash received from issuing bonds 700,000Cash paid for dividends (90,000)
Net cash from financing activities $1,410,000
Appendix 2 BE 13–7
Sales……………………………………………………………………………………… $112,000Decrease in accounts receivable……………………………………………………… 10,500
Cash received from customers……………………………………………………… $122,500
Appendix 2 BE 13–8 Cost of goods sold……………………………………………………………………… $240,000Increase in inventories………………………………………………………………… 19,200Increase in accounts payable………………………………………………………… (12,000)
Cash paid for merchandise…………………………………………………………… $247,200
13-3© 2017 Cengage Learning. All Rights Reserved. May not be scanned, copied or duplicated, or posted to a publicly accessible website, in whole or in part.

CHAPTER 13 Statement of Cash Flows
Ex. 13–1There were net additions to the net loss reported on the income statement to convert the net loss from the accrual basis to the cash basis. For example, depreciation is an expense in determining net income, but it does not result in a cash outflow. Thus, depreciation is added back to the net loss in order to determine net cash flow from operations. A second large item that is added to the net loss is the increase in advanced ticket sales of $246 million. This represents an increase in unused, but paid, tickets (unearned revenue) between the two balance sheet dates. This is asignificant item that is largely unique to the airline industry.
The cash flows from operating activities detail is provided as follows for classdiscussion:
Cash flows from operating activities:Net income (loss) $ (723)Adjustments to reconcile net income (loss) to net cash flow
provided by operating activities:Depreciation and amortization 1,522Special charges 389Debt and lease discount amortization (247)Share based compensation 14Other, net 251
Changes in certain assets and liabilities:Decrease (increase) in accounts receivable (21)Decrease (increase) in other assets (484)Increase (decrease) in accounts payable 285Increase (decrease) in advanced ticket sales 246Increase (decrease) in frequent flyer deferred revenue (712)Increase (decrease) in other liabilities 415
Net cash flows from (used for) operating activities $ 935
(in millions)
EXERCISES
United Continental Holdings, Inc.Cash Flows from Operating Activities
(Selected from Statement of Cash Flows)
13-4© 2017 Cengage Learning. All Rights Reserved. May not be scanned, copied or duplicated, or posted to a publicly accessible website, in whole or in part.

CHAPTER 13 Statement of Cash Flows
Ex. 13–2
A. Cash payment, $411,000 E. Cash payment, $50,000B. Cash receipt, $440,000 F. Cash receipt, $490,000C. Cash receipt, $60,000 G. Cash payment, $332,500D. Cash payment, $650,000 H. Cash payment, $1,320,000
Ex. 13–3
A. operating G. financingB. financing H. investingC. financing I. financingD. financing J. investingE. financing K. investingF. investing
Ex. 13–4
A. added G. addedB. deducted H. addedC. added I. addedD. added J. addedE. added K. deductedF. added
13-5© 2017 Cengage Learning. All Rights Reserved. May not be scanned, copied or duplicated, or posted to a publicly accessible website, in whole or in part.

CHAPTER 13 Statement of Cash Flows
Ex. 13–5
A. Net income……………………………………………………………… $73,600Adjustments to reconcile net income to net cash
flow from operating activities: Depreciation……………………………………………………… 27,400
Changes in current operating assets and liabilities:Increase in accounts receivable……………………………… (8,000)
Decrease in inventories………………………………………… 4,500
Decrease in prepaid expenses……………………………… 2,250
Increase in accounts payable………………………………… 5,000
Decrease in wages payable…………………………………… (900)
Net cash flow from operating activities………………… $103,850
B. Cash flows from operating activities shows the cash inflow or outflow from a company’s day-to-day operations. Net income reports the excess of revenues over expenses for a company using the accrual basis of accounting. Revenues are recorded when they are earned, not necessarily when cash is received. Expenses are recorded when they are incurred and matched against revenue, not necessarily when cash is paid. As a result, the cash flows from operating activities differs from net income because it does not use the accrual basis of accounting.
Ex. 13–6
A. Cash flows from operating activities:
Net income………………………………………………………… $185,000Adjustments to reconcile net income to net cash
flow from operating activities: Depreciation………………………………………………… 96,000
Changes in current operating assets and liabilities:Decrease in accounts receivable………………………… 5,450
Increase in inventories……………………………………… (11,200)
Decrease in prepaid expenses…………………………… 900
Decrease in accounts payable…………………………… (18,500)
Increase in salaries payable……………………………… 3,200
Net cash flow from operating activities……………… $260,850
B. Yes. The amount of cash flows from operating activities reported on the statementof cash flows is not affected by the method of reporting such flows.
13-6© 2017 Cengage Learning. All Rights Reserved. May not be scanned, copied or duplicated, or posted to a publicly accessible website, in whole or in part.

CHAPTER 13 Statement of Cash Flows
Ex. 13–7
A. Cash flows from operating activities:
Net income……………………………………………………… $508,000Adjustments to reconcile net income to net cash
flow from operating activities: Depreciation……………………………………………… 57,600
Gain on disposal of equipment………………………… (33,600)
Changes in current operating assets and liabilities:Increase in accounts receivable……………………… (8,960)
Decrease in inventory…………………………………… 5,120
Decrease in prepaid insurance………………………… 1,920
Decrease in accounts payable………………………… (6,080)
Increase in income taxes payable……………………… 1,410
Net cash flow from operating activities…………… $525,410
Note: The change in dividends payable would be used to adjust the dividends
declared in obtaining the cash paid for dividends in the Financing Activities section of the statement of cash flows.
B. Cash flows from operating activities reports the cash inflow or outflow from a company’s day-to-day operations. Net income reports the excess of revenues over expenses for a company using the accrual basis of accounting. Revenues are recorded when they are earned, not necessarily when cash is received. Expenses are recorded when they are incurred and matched against revenue, not necessarily when cash is paid. As a result, the cash flows from operating activities differs from net income because it does not use the accrual basis of accounting.
Ex. 13–8
Cash flows from investing activities:Cash received from sale of equipment…………………………………………… $101,250
The loss on the sale, $16,875 ($101,250 proceeds from sale less $118,125 book value),would be added to net income in determining the cash flows from operating activities if the indirect method of reporting cash flows from operations is used.
Ex. 13–9
Cash flows from investing activities:Cash received from sale of equipment…………………………………………… $37,200
The loss on the sale, $6,800 ($37,200 proceeds from sale less $44,000 book value),would be added to net income in determining the cash flows from operating activities if the indirect method of reporting cash flows from operations is used.
13-7© 2017 Cengage Learning. All Rights Reserved. May not be scanned, copied or duplicated, or posted to a publicly accessible website, in whole or in part.

CHAPTER 13 Statement of Cash Flows
Ex. 13–10
Cash flows from investing activities:Cash received from sale of land………………………………………………… $ 95,550Cash paid for purchase of land…………………………………………………… (104,300)
The gain on the sale of land, $31,710, would be deducted from net income in determiningthe cash flows from operating activities if the indirect method of reporting cash flows from operations is used.
Ex. 13–11
Dividends declared……………………………………………………………………… $1,200,000Decrease in dividends payable……………………………………………………… 150,000
Dividends paid to stockholders during the year………………………………… $1,350,000
Ex. 13–12
Cash flows from financing activities:Cash received from sale of common stock…………………………………… $1,920,000
Cash paid for dividends…………………………………………………………… (315,000)
Note: The stock dividend is not disclosed on the statement of cash flows.
13-8© 2017 Cengage Learning. All Rights Reserved. May not be scanned, copied or duplicated, or posted to a publicly accessible website, in whole or in part.

CHAPTER 13 Statement of Cash Flows
Ex. 13–13
Cash flows from investing activities:Cash paid for purchase of land…………………………………………………… $(246,000)
A separate schedule of noncash investing and financing activities would report the purchase of $324,000 land with a long-term mortgage note, as follows:
Purchase of land by issuing long-term mortgage note…………………………… $324,000
Ex. 13–14
Cash flows from financing activities:Cash received from issuing bonds payable…………………………………… $ 420,000
Cash paid to redeem bonds payable…………………………………………… (138,000)
Note: The discount amortization of $2,625 would be shown as an adjusting item
(increase) in the Cash Flows from Operating Activities section under the indirect method.
Ex. 13–15
A. Net cash flow from operating activities………………………… $357,500
Increase in accounts receivable………………………………… $ 14,300
Increase in prepaid expenses…………………………………… 2,970
Decrease in income taxes payable……………………………… 7,700
Gain on sale of investments 13,200 38,170
$395,670
Depreciation………………………………………………………… $(29,480)
Decrease in inventories…………………………………………… (19,140)
Increase in accounts payable……………………………………… (5,280) (53,900)
Net income, per income statement……………………………… $341,770
Note to Instructors: The net income must be determined by working backward
through the Cash Flows from Operating Activities section of the statement of cash flows. Hence, those items that were added (deducted) to determine net cash flow from operating activities must be deducted (added) to determine net income.
13-9© 2017 Cengage Learning. All Rights Reserved. May not be scanned, copied or duplicated, or posted to a publicly accessible website, in whole or in part.

CHAPTER 13 Statement of Cash Flows
Ex. 13–15 (Concluded)
B. Curwen’s net income differed from cash flows from operations because of:
● $29,480 of depreciation expense which has no effect on cash flows from operating activities,
● a $13,200 gain on the sale of investments. The proceeds from this sale, which include the gain, are reported in the Investing Activities section of the statement of cash flows.
● Changes in current operating assets and liabilities that are added or deducted, depending on their effect on cash flows:
Increase in accounts receivable, $14,300Increase in prepaid expenses, $2,970Decrease in income taxes payable, $7,700Decrease in inventories, $19,140Increase in accounts payable, $5,280
Ex. 13–16
A.
Cash flows from operating activities:Net income $49,311Adjustments to reconcile net loss to net
cash flow from operating activities:Depreciation 11,580Gain on disposal of property (1,188)Other items involving noncash expenses 1,383
Changes in current operating assets and liabilities:
Increase in accounts receivable (1,746)Decrease in inventory 990Increase in prepaid expenses (605)Decrease in accounts payable (710)Decrease in accrued and other current liabilities (995)
Net cash flow from operating activities $58,020
B. National Beverage is doing well financially. The company has positive earnings and positive net cash flow from operating activities. The company continues to grow, and the trend in recent years has been positive. The increase in accounts receivable is a positive sign, indicating an increase in sales.
(in thousands)
National Beverage Co.Cash Flows from Operating Activities
13-10© 2017 Cengage Learning. All Rights Reserved. May not be scanned, copied or duplicated, or posted to a publicly accessible website, in whole or in part.

CHAPTER 13 Statement of Cash Flows
Ex. 13–17
A.
Cash flows from operating activities:Net income $ 62Adjustments to reconcile net income to net
cash flow from operating activities:Depreciation 26Gain on sale of land (40)
Changes in current operating assets and liabilities:
Increase in accounts receivable (6)Increase in inventories (18)Increase in accounts payable 14
Net cash flow from operating activities $ 38
Cash flows from investing activities:Cash received from sale of land $120Cash paid for purchase of equipment (30)
Net cash flow from investing activities 90
Cash flows from financing activities:Cash received from sale of common stock $ 60Cash paid for dividends* (19)
Net cash flow from financing activities 41
Change in cash $169Cash at the beginning of the year 14Cash at the end of the year $183
* Dividends = $24 – $5 = $19
B. Olson-Jones Industries Inc.’s net income was more than the cash flows from operations because of:
● $26 of depreciation expense, which has no effect on cash.
● A $40 gain on the sale of land. The proceeds from this sale of $120, which include the gain, are reported in the Investing Activities section of the statement of cash flows.
● Changes in current operating assets and liabilities that are added or deducted, depending on their effect on cash flows:
Increase in accounts receivable, $6 deductedIncrease in inventories, $18 deductedIncrease in accounts payable, $14 added
For the Year Ended December 31, 20Y2
Olson-Jones Industries, Inc.Statement of Cash Flows
13-11© 2017 Cengage Learning. All Rights Reserved. May not be scanned, copied or duplicated, or posted to a publicly accessible website, in whole or in part.

CHAPTER 13 Statement of Cash Flows
Ex. 13–18
1. The increase in accounts receivable should be deducted from net income in theCash Flows from Operating Activities section.
2. The gain on the sale of investments should be deducted from net income in the Cash Flows from Operating Activities section.
3. The increase in accounts payable should be added to net income in the Cash Flows from Operating Activities section.
4. The correct amount of cash at the beginning of the year, $240,000, should be added to the increase in cash.
5. The final amount should be the amount of cash at the end of the year, $350,160.
6. The final amount of net cash flow from operating activities is $381,360.
13-12© 2017 Cengage Learning. All Rights Reserved. May not be scanned, copied or duplicated, or posted to a publicly accessible website, in whole or in part.

CHAPTER 13 Statement of Cash Flows
Ex. 13–18 (Concluded)
A correct statement of cash flows would be as follows:
Cash flows from operating activities:Net income $ 360,000Adjustments to reconcile net income to
net cash flow from operating activities:Depreciation 100,800Gain on sale of investments (17,280)
Changes in current operating assets and liabilities:
Increase in accounts receivable (27,360)Increase in inventories (36,000)Increase in accounts payable 3,600Decrease in accrued expenses
payable (2,400)
Net cash flow from operating activities $ 381,360
Cash flows from investing activities:Cash received from sale of investments $ 240,000Cash paid for purchase of land (259,200)Cash paid for purchase of equip. (432,000)
Net cash flow used for investing activities (451,200)
Cash flows from financing activities:Cash received from sale of common stock $ 312,000Cash paid for dividends (132,000)
Net cash flow from financing activities 180,000
Change in cash $ 110,160Cash at the beginning of the year 240,000Cash at the end of the year $ 350,160
For the Year Ended December 31, 20Y9
Shasta Inc.Statement of Cash Flows
13-13© 2017 Cengage Learning. All Rights Reserved. May not be scanned, copied or duplicated, or posted to a publicly accessible website, in whole or in part.

CHAPTER 13 Statement of Cash Flows
Appendix 2 Ex. 13–19
A. Sales………………………………………………………………………………… $753,500Decrease in accounts receivable balance…………………………………… 48,400
Cash received from customers………………………………………………… $801,900
B. Income tax expense……………………………………………………………… $ 50,600Decrease in income tax payable……………………………………………… 5,500
Cash payments for income taxes……………………………………………… $ 56,100
C. Because the customers paid more than the amount of sales for the period,cash received from customers exceeded sales made on account by$48,400 during the current year.
Appendix 2 Ex. 13–20
A. Cost of goods sold……………………………………………………………… $1,031,550Decrease in accounts payable………………………………………………… 9,660
$1,041,210Decrease in inventories………………………………………………………… (15,410)
Cash payments for merchandise……………………………………………… $1,025,800
B. Operating expenses other than depreciation……………………………… $ 179,400Decrease in accrued expenses payable……………………………………… 1,380
$ 180,780Decrease in prepaid expenses………………………………………………… (1,610)
Cash payments for operating expenses…………………………………… $ 179,170
13-14© 2017 Cengage Learning. All Rights Reserved. May not be scanned, copied or duplicated, or posted to a publicly accessible website, in whole or in part.

CHAPTER 13 Statement of Cash Flows
Appendix 2 Ex. 13–21
A. Cash flows from operating activities:
Cash received from customers………………………………… $ 522,760
Cash payments for merchandise……………………………… (302,400)
Cash payments for operatingexpenses…………………………………………………………… (99,960)
Cash payments for income taxes……………………………… (24,360)
Net cash flow from operating activities…………………… $ 96,040
Computations:
1. Sales……………………………………………………………………………… $511,000Decrease in accounts receivable……………………………………………… 11,760
Cash received from customers……………………………………………… $522,760
2. Cost of goods sold……………………………………………………………… $290,500Increase in inventories………………………………………………………… 3,920Decrease in accounts payable………………………………………………… 7,980
Cash payments for merchandise……………………………………………… $302,400
3. Operating expenses other than depreciation……………………………… $105,000Decrease in prepaid expenses………………………………………………… (3,780)Increase in accrued expenses
payable…………………………………………………………………………… (1,260)
Cash payments for operating expenses…………………………………… $ 99,960
4. Income tax expense……………………………………………………………… $ 21,700Add decrease in income tax payable………………………………………… 2,660
Cash payments for income taxes…………………………………………… $ 24,360
B. The direct method directly reports cash receipts and payments. The cash received
less the cash payments is the net cash flow from operating activities. Individual cash receipts and payments are reported in the Cash Flows from Operating Activities section.
The indirect method adjusts accrual-basis net income for revenues and expenses
that do not involve the receipt or payment of cash to arrive at cash flows from operating activities.
1
2
3
4
13-15© 2017 Cengage Learning. All Rights Reserved. May not be scanned, copied or duplicated, or posted to a publicly accessible website, in whole or in part.

CHAPTER 13 Statement of Cash Flows
Appendix 2 Ex. 13–22
Cash flows from operating activities:
Cash received from customers…………………………………… $ 440,440
Cash payments for merchandise………………………………… (161,260)
Cash payments for operating expenses………………………… (115,720)
Cash payments for income taxes………………………………… (39,600)
Net cash flow from operating activities……………………… $123,860
Computations:
1. Sales………………………………………………………………………………… $445,500Increase in accounts receivable………………………………………………… (5,060)
Cash received from customers………………………………………………… $440,440
2. Cost of goods sold………………………………………………………………… $154,000Increase in inventories…………………………………………………………… 12,100Increase in accounts payable…………………………………………………… (4,840)
Cash payments for merchandise……………………………………………… $161,260
3. Operating expenses other than depreciation………………………………… $115,280Decrease in accrued expenses payable……………………………………… 1,760Decrease in prepaid expenses………………………………………………… (1,320)
Cash payments for operating expenses……………………………………… $115,720
1
2
3
13-16© 2017 Cengage Learning. All Rights Reserved. May not be scanned, copied or duplicated, or posted to a publicly accessible website, in whole or in part.

CHAPTER 13 Statement of Cash Flows
Prob. 13–1A
Cash flows from operating activities:Net income $ 500,000Adjustments to reconcile net income to
net cash flow from operating activities:Depreciation 100,000Gain on sale of investments (75,000)
Changes in current operating assets and liabilities:
Increase in accounts receivable (50,000)Increase in inventories (20,000)Increase in accounts payable 40,000Decrease in accrued expenses payable (5,000)
Net cash flow from operating activities $ 490,000
Cash flows from investing activities:Cash received from sale of investments $ 175,000Cash paid for purchase of land (500,000)Cash paid for purchase of equipment (200,000)
Net cash flow used for investing activities (525,000)
Cash flows from financing activities:Cash received from sale of common stock $ 125,000Cash paid for dividends* (85,000)
Net cash flow from financing activities 40,000
Change in cash $ 5,000Cash at the beginning of the year 150,000Cash at the end of the year $ 155,000
Cash paid for dividends = $90,000 + $25,000 – $30,000 = $85,000
For the Year Ended December 31, 20Y3
Livers Inc.Statement of Cash Flows
PROBLEMS
*
13-17© 2017 Cengage Learning. All Rights Reserved. May not be scanned, copied or duplicated, or posted to a publicly accessible website, in whole or in part.

CHAPTER 13 Statement of Cash Flows
Prob. 13–1A (Concluded)
(Optional)
Balance, Balance,
Account Title Dec. 31, 20Y2 Dec. 31, 20Y3
Cash 150,000 (m) 5,000 155,000
Accounts receivable (net) 400,000 (l) 50,000 450,000
Inventories 750,000 (k) 20,000 770,000
Investments 100,000 (j) 100,000 0
Land 0 (i) 500,000 500,000
Equipment 1,200,000 (h) 200,000 1,400,000
Accum. depr.—equipment (500,000) (g) 100,000 (600,000)
Accounts payable (300,000) (f) 40,000 (340,000)
Accrued expenses payable (50,000) (e) 5,000 (45,000)
Dividends payable (25,000) (d) 5,000 (30,000)
Common stock, $4 par (600,000) (c) 100,000 (700,000)
Paid-in capital in excess
of par—common stock (175,000) (c) 25,000 (200,000)Retained earnings (950,000) (b) 90,000 (a) 500,000 (1,360,000)
Totals 0 870,000 870,000 0
Operating activities:
Net income (a) 500,000
Depreciation (g) 100,000
Gain on sale of investments (j) 75,000
Increase in accounts
receivable (l) 50,000
Increase in inventories (k) 20,000
Increase in accounts payable (f) 40,000
Decrease in accrued
expenses payable (e) 5,000
Investing activities:
Purchase of equipment (h) 200,000
Purchase of land (i) 500,000
Sale of investments (j) 175,000
Financing activities:
Declaration of cash dividends (b) 90,000
Sale of common stock (c) 125,000
Increase in dividends payable (d) 5,000Net change in cash (m) 5,000
Totals 945,000 945,000
Note to Instructor: The letters in the debit and credit columns are included for
reference purposes only.
Debit Credit
Livers Inc.
Spreadsheet (Work Sheet) for Statement of Cash Flows
For the Year Ended December 31, 20Y3
Transactions
13-18© 2017 Cengage Learning. All Rights Reserved. May not be scanned, copied or duplicated, or posted to a publicly accessible website, in whole or in part.

CHAPTER 13 Statement of Cash Flows
Prob. 13–2A
Cash flows from operating activities:Net income $ 190,000Adjustments to reconcile net income to
net cash flow from operating activities:Depreciation 115,000
Changes in current operating assetsand liabilities:
Decrease in accounts receivable 25,000Increase in inventory (110,000)Increase in prepaid expenses (5,000)Increase in accounts payable 10,000
Net cash flow from operating activities $ 225,000
Cash flows from investing activities:Cash paid for equipment $(395,000)
Net cash flow used for investing activities (395,000)
Cash flows from financing activities:Cash received from sale of common stock $ 600,000Cash paid for dividends (50,000)Cash paid to retire mortgage note payable (400,000)
Net cash flow used for financing activities 150,000
Change in cash $ (20,000)Cash at the beginning of the year 100,000Cash at the end of the year $ 80,000
Note to Instructors: The disposal of fully depreciated equipment is not included in the
cash flow statement because there is no associated cash flow. This transaction strictly involves the removal of $75,000 from the equipment and accumulated depreciation—equipment accounts.
For the Year Ended December 31, 20Y8
Yellow Dog Enterprises Inc.Statement of Cash Flows
13-19© 2017 Cengage Learning. All Rights Reserved. May not be scanned, copied or duplicated, or posted to a publicly accessible website, in whole or in part.

CHAPTER 13 Statement of Cash Flows
Prob. 13–2A (Concluded)
(Optional)
Balance, Balance,
Account Title Dec. 31, 20Y7 Dec. 31, 20Y8
Cash 100,000 (l) 20,000 80,000
Accounts receivable (net) 300,000 (k) 25,000 275,000
Merchandise inventory 400,000 (j) 110,000 510,000
Prepaid expenses 10,000 (i) 5,000 15,000
Equipment 750,000 (h) 395,000 (g) 75,000 1,070,000
Accum. depr.—equipment (160,000) (g) 75,000 (f) 115,000 (200,000)
Accounts payable (90,000) (e) 10,000 (100,000)
Mortgage note payable (400,000) (d) 400,000 0
Common stock, $10 par (200,000) (c) 400,000 (600,000)
Paid-in capital in excess
of par—common stock (100,000) (c) 200,000 (300,000)Retained earnings (610,000) (b) 50,000 (a) 190,000 (750,000)
Totals 0 1,035,000 1,035,000 0
Operating activities:
Net income (a) 190,000
Depreciation (f) 115,000
Decrease in accts. receivable (k) 25,000
Increase in merchandise
inventory (j) 110,000
Increase in prepaid expenses (i) 5,000
Increase in accounts payable (e) 10,000
Investing activities:
Purchase of equipment (h) 395,000
Financing activities:
Payment of cash dividends (b) 50,000
Sale of common stock (c) 600,000
Payment of mortgage note
payable (d) 400,000Net decrease in cash (l) 20,000
Totals 960,000 960,000
Note to Instructor: The letters in the debit and credit columns are included for reference
purposes only.
Debit Credit
Yellow Dog Enterprises Inc.
Spreadsheet (Work Sheet) for Statement of Cash Flows
For the Year Ended December 31, 20Y8
Transactions
13-20© 2017 Cengage Learning. All Rights Reserved. May not be scanned, copied or duplicated, or posted to a publicly accessible website, in whole or in part.

CHAPTER 13 Statement of Cash Flows
Prob. 13–3A
Cash flows from operating activities:Net loss $ (35,320)Adjustments to reconcile net loss to
net cash flow from operating activities:Depreciation* 55,620Loss on sale of land** 12,600
Changes in current operating assets and liabilities:
Increase in accounts receivable (66,960)Increase in inventories (105,480)Decrease in prepaid expenses 5,760Decrease in accounts payable (35,820)
Net cash flow used for operating activities $(169,600)Cash flows from investing activities:
Cash received from land sold $ 151,200Cash paid for acquisition of building (561,600)Cash paid for purchase of equipment (104,400)
Net cash flow used for investing activities (514,800)Cash flows from financing activities:
Cash received from issuance ofbonds payable $ 270,000
Cash received from issuance ofcommon stock 400,000
Cash paid for dividends (32,400)Net cash flow from financing activities 637,600
Change in cash $ (46,800)Cash at the beginning of the year 964,800Cash at the end of the year $ 918,000
* Depreciation = $26,280 + $29,340
** Loss on sale of land = $151,200 – $163,800
For the Year Ended December 31, 20Y2
Whitman Co.Statement of Cash Flows
13-21© 2017 Cengage Learning. All Rights Reserved. May not be scanned, copied or duplicated, or posted to a publicly accessible website, in whole or in part.

CHAPTER 13 Statement of Cash Flows
Prob. 13–3A (Concluded)
(Optional)
Balance, Balance,
Account Title Dec. 31, 20Y1 Dec. 31, 20Y2
Cash 964,800 (o) 46,800 918,000
Accounts receivable 761,940 (g) 66,960 828,900
Inventories 1,162,980 (h) 105,480 1,268,460
Prepaid expenses 35,100 (f) 5,760 29,340
Land 479,700 (l) 163,800 315,900
Buildings 900,900 (k) 561,600 1,462,500
Accum. depr.—buildings (382,320) (e) 26,280 (408,600)
Equipment 454,680 (i) 104,400 (j) 46,800 512,280
Accum. depr.—equipment (158,760) (j) 46,800 (d) 29,340 (141,300)
Accounts payable (958,320) (c) 35,820 (922,500)
Bonds payable 0 (m) 270,000 (270,000)
Common stock, $25 par (117,000) (n) 200,000 (317,000)
Paid-in capital in excess of
par—common stock (558,000) (n) 200,000 (758,000)
Retained earnings (2,585,700) (a) 35,320 (2,582,780) (b) (32,400)
Totals 0 923,980 988,780 (64,800)
Operating activities:
Net loss (a) 35,320
Depreciation—equipment (d) 29,340
Depreciation—buildings (e) 26,280
Loss on sale of land (l) 12,600
Increase in accts. receivable (g) 66,960
Increase in inventories (h) 105,480
Decrease in prepaid expenses (f) 5,760
Decrease in accounts payable (c) 35,820
Investing activities:
Purchase of equipment (i) 104,400
Acquisition of building (k) 561,600
Sale of land (l) 151,200
Financing activities:
Payment of cash dividends (b) (32,400)
Issuance of bonds payable (m) 270,000
Issuance of common stock (n) 400,000Net decrease in cash (o) 46,800
Totals 941,980 877,180
Debit Credit
Whitman Co.Spreadsheet (Work Sheet) for Statement of Cash Flows
For the Year Ended December 31, 20Y2
Transactions
13-22© 2017 Cengage Learning. All Rights Reserved. May not be scanned, copied or duplicated, or posted to a publicly accessible website, in whole or in part.

CHAPTER 13 Statement of Cash Flows
Appendix 2 Prob. 13–4A
Cash flows from operating activities:
Cash received from customers1 $ 5,960,600
Cash payments for merchandise2 (2,456,800)
Cash payments for operating expenses3 (3,107,400)Cash payments for income taxes (102,800)
Net cash flow from operating activities $ 293,600
Cash flows from investing activities:
Cash received from sale of investments $ 176,000
Cash paid for purchase of land (520,000)Cash paid for purchase of equipment (200,000)
Net cash flow used for investing activities (544,000)
Cash flows from financing activities:
Cash received from sale of common stock $ 240,000Cash paid for dividends* (25,600)
Net cash flow from financing activities 214,400
Change in cash $ (36,000)Cash at the beginning of the year 679,400
Cash at the end of the year $ 643,400
Reconciliation of Net Income with Cash Flows from Operating Activities:
Net income………………………………………………………………………… $217,200Adjustments to reconcile net income to net cash flow
from operating activities:Depreciation………………………………………………………………… 44,000Loss on sale of investments……………………………………………… 64,000
Changes in current operating assets and liabilities:Increase in accounts receivable………………………………………… (19,400)Increase in inventories…………………………………………………… (28,200)Increase in accounts payable…………………………………………… 23,400Decrease in accrued expenses payable………………………………… (7,400)
Net cash flow from operating activities……………………………… $293,600
* Dividends paid: $28,000 + $6,400 – $8,800 = $25,600
For the Year Ended December 31, 20Y6
Canace Products Inc.Statement of Cash Flows
13-23© 2017 Cengage Learning. All Rights Reserved. May not be scanned, copied or duplicated, or posted to a publicly accessible website, in whole or in part.

CHAPTER 13 Statement of Cash Flows
Appendix 2 Prob. 13–4A (Concluded)
Computations:
1. Sales……………………………………………………………………………… $5,980,000Increase in accounts receivable…………………………………………… (19,400)
Cash received from customers……………………………………………… $5,999,400
2. Cost of goods sold…………………………………………………………… $2,452,000
Increase in inventories………………………………………………………… 28,200
Increase in accounts payable………………………………………………… (23,400)
Cash payments for merchandise…………………………………………… $2,456,800
3. Operating expenses other than depreciation…………………………… $3,100,000
Decrease in accrued expenses payable…………………………………… 7,400
Cash payments for operating expenses…………………………………… $3,107,400
13-24© 2017 Cengage Learning. All Rights Reserved. May not be scanned, copied or duplicated, or posted to a publicly accessible website, in whole or in part.

CHAPTER 13 Statement of Cash Flows
Appendix 2 Prob. 13–5A
Cash flows from operating activities:
Cash received from customers1$ 2,950,000
Cash payments for merchandise2(1,380,000)
Cash payments for operating expenses3(955,000)
Cash payments for income taxes (125,000)
Net cash flow from operating activities $ 490,000
Cash flows from investing activities:
Cash received from sale of investments $ 175,000
Cash paid for purchase of land (500,000)
Cash paid for purchase of equipment (200,000)
Net cash flow used for investing activities (525,000)
Cash flows from financing activities:
Cash received from sale of common stock $ 125,000
Cash paid for dividends4(85,000)
Net cash flow from financing activities 40,000
Change in cash $ 5,000
Cash at the beginning of the year 150,000
Cash at the end of the year $ 155,000
Reconciliation of Net Income with Cash Flows from Operating Activities:
Net income…………………………………………………………………………………… $500,000
Adjustments to reconcile net income to net cash flow
from operating activities:
Depreciation…………………………………………………………………………… 100,000
Gain on sale of investments……………………………………………………… (75,000)
Changes in current operating assets and liabilities:
Increase in accounts receivable……………………………………………… (50,000)
Increase in inventories………………………………………………………… (20,000)
Increase in accounts payable………………………………………………… 40,000
Decrease in accrued expenses payable……………………………………… (5,000)
Net cash flow from operating activities………………………………………… $490,000
For the Year Ended December 31, 20Y3
Livers Inc.
Statement of Cash Flows
13-25© 2017 Cengage Learning. All Rights Reserved. May not be scanned, copied or duplicated, or posted to a publicly accessible website, in whole or in part.

CHAPTER 13 Statement of Cash Flows
Appendix 2 Prob. 13–5A (Concluded)
Computations:
1. Sales……………………………………………………………………………… $3,000,000Increase in accounts receivable……………………………………………… (50,000)
Cash received from customers……………………………………………… $2,950,000
2. Cost of goods sold……………………………………………………………… $1,400,000
Increase in inventories………………………………………………………… 20,000
Increase in accounts payable………………………………………………… (40,000)
Cash payments for merchandise……………………………………………… $1,380,000
3. Operating expenses other than depreciation……………………………… $ 950,000
Decrease in accrued expenses payable……………………………………… 5,000
Cash payments for operating expenses…………………………………… $ 955,000
4. Cash dividends declared……………………………………………………… $ 90,000
Increase in dividends payable………………………………………………… (5,000)
Cash payments for dividends………………………………………………… $ 85,000
13-26© 2017 Cengage Learning. All Rights Reserved. May not be scanned, copied or duplicated, or posted to a publicly accessible website, in whole or in part.

CHAPTER 13 Statement of Cash Flows
Prob. 13–1B
Cash flows from operating activities:Net income $ 141,680Adjustments to reconcile net income to
net cash flow from operating activities:Depreciation 14,790Loss on sale of investments 10,200
Changes in current operating assets and liabilities:
Increase in accounts receivable (19,040)Increase in inventories (8,670)Increase in accounts payable 11,560Increase in accrued expenses
payable 3,740
Net cash flow from operating activities $ 154,260
Cash flows from investing activities:Cash received from sale of investments $ 91,800Cash paid for purchase of land (295,800)Cash paid for purchase of equipment (80,580)
Net cash flow used for investing activities (284,580)
Cash flows from financing activities:Cash received from sale of common stock $ 250,000Cash paid for dividends* (96,900)
Net cash flow from financing activities 153,100
Change in cash $ 22,780Cash at the beginning of the year 47,940Cash at the end of the year $ 70,720
$102,000 + $20,400 – $25,500 = $96,900
For the Year Ended December 31, 20Y9
Merrick Equipment Co.Statement of Cash Flows
*
13-27© 2017 Cengage Learning. All Rights Reserved. May not be scanned, copied or duplicated, or posted to a publicly accessible website, in whole or in part.

CHAPTER 13 Statement of Cash Flows
Prob. 13–1B (Concluded)
(Optional)
Balance, Balance,
Account Title Dec. 31, 20Y8 Dec. 31, 20Y9
Cash 47,940 (m) 22,780 70,720
Accounts receivable (net) 188,190 (l) 19,040 207,230
Inventories 289,850 (k) 8,670 298,520
Investments 102,000 (j) 102,000 0
Land 0 (i) 295,800 295,800
Equipment 358,020 (h) 80,580 438,600
Accum. depr.—equipment (84,320) (g) 14,790 (99,110)
Accounts payable (194,140) (f) 11,560 (205,700)
Accrued expenses payable (26,860) (e) 3,740 (30,600)
Dividends payable (20,400) (d) 5,100 (25,500)
Common stock, $1 par (102,000) (c) 100,000 (202,000)
Paid-in capital in excess
of par—common stock (204,000) (c) 150,000 (354,000)Retained earnings (354,280) (b) 102,000 (a) 141,680 (393,960)
Totals 0 528,870 528,870 0
Operating activities:
Net income (a) 141,680
Depreciation (g) 14,790
Loss on sale of investments (j) 10,200
Increase in accounts
receivable (l) 19,040
Increase in inventories (k) 8,670
Increase in accounts payable (f) 11,560
Increase in accrued expenses
payable (e) 3,740
Investing activities:
Purchase of equipment (h) 80,580
Purchase of land (i) 295,800
Sale of investments (j) 91,800
Financing activities:
Declaration of cash dividends (b) 102,000
Sale of common stock (c) 250,000
Increase in dividends payable (d) 5,100Net change in cash (m) 22,780
Totals 528,870 528,870
Note to Instructor: The letters in the debit and credit columns are included for
reference purposes only.
Debit Credit
Merrick Equipment Co.Spreadsheet (Work Sheet) for Statement of Cash Flows
For the Year Ended December 31, 20Y9
Transactions
13-28© 2017 Cengage Learning. All Rights Reserved. May not be scanned, copied or duplicated, or posted to a publicly accessible website, in whole or in part.
CHAPTER 13 Statement of Cash Flows
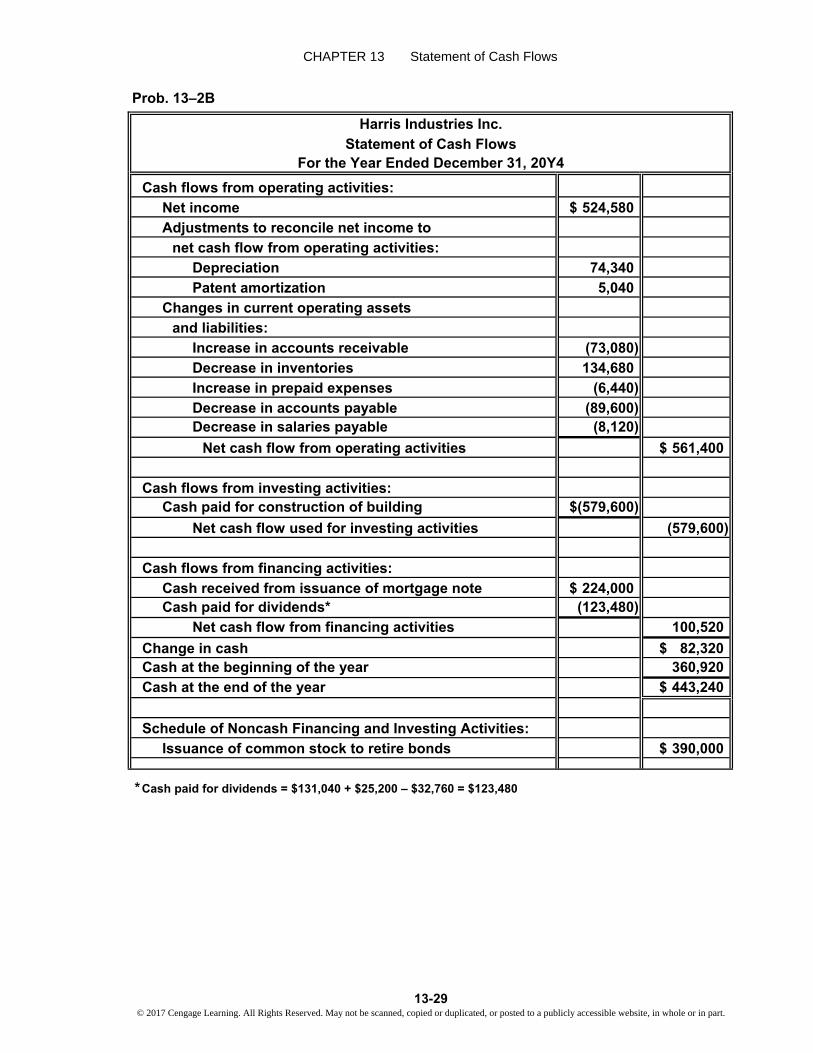
Prob. 13–2B
Cash flows from operating activities:Net income $ 524,580Adjustments to reconcile net income to
net cash flow from operating activities:Depreciation 74,340Patent amortization 5,040
Changes in current operating assetsand liabilities:
Increase in accounts receivable (73,080)Decrease in inventories 134,680Increase in prepaid expenses (6,440)Decrease in accounts payable (89,600)Decrease in salaries payable (8,120)
Net cash flow from operating activities $ 561,400
Cash flows from investing activities:Cash paid for construction of building $(579,600)
Net cash flow used for investing activities (579,600)
Cash flows from financing activities:Cash received from issuance of mortgage note $ 224,000Cash paid for dividends* (123,480)
Net cash flow from financing activities 100,520
Change in cash $ 82,320Cash at the beginning of the year 360,920Cash at the end of the year $ 443,240
Schedule of Noncash Financing and Investing Activities:Issuance of common stock to retire bonds $ 390,000
Cash paid for dividends = $131,040 + $25,200 – $32,760 = $123,480
For the Year Ended December 31, 20Y4
Harris Industries Inc.Statement of Cash Flows
*
13-29© 2017 Cengage Learning. All Rights Reserved. May not be scanned, copied or duplicated, or posted to a publicly accessible website, in whole or in part.

CHAPTER 13 Statement of Cash Flows
Prob. 13–2B (Continued)
(Optional)
Balance, Balance,
Account Title Dec. 31, 20Y3 Dec. 31, 20Y4
Cash 360,920 (p) 82,320 443,240
Accounts receivable (net) 592,200 (o) 73,080 665,280
Inventories 1,022,560 (n) 134,680 887,880
Prepaid expenses 25,200 (m) 6,440 31,640
Land 302,400 302,400
Buildings 1,134,000 (l) 579,600 1,713,600
Accum. depr.—buildings (414,540) (k) 51,660 (466,200)
Machinery and equipment 781,200 781,200
Accum. depr.—machinery
and equipment (191,520) (j) 22,680 (214,200)
Patents 112,000 (i) 5,040 106,960
Accounts payable (927,080) (h) 89,600 (837,480)
Dividends payable (25,200) (g) 7,560 (32,760)
Salaries payable (87,080) (f) 8,120 (78,960)
Mortgage note payable 0 (e) 224,000 (224,000)
Bonds payable (390,000) (d) 390,000 0
Common stock, $5 par (50,400) (c) 150,000 (200,400)
Paid-in capital in excess of
par—common stock (126,000) (c) 240,000 (366,000)Retained earnings (2,118,660) (b) 131,040 (a) 524,580 (2,512,200)
Totals 0 1,360,200 1,360,200 0
Note to Instructor: The letters in the debit and credit columns are included for
reference purposes only.
Debit Credit
Harris Industries Inc.Spreadsheet (Work Sheet) for Statement of Cash Flows
For the Year Ended December 31, 20Y4
Transactions
13-30© 2017 Cengage Learning. All Rights Reserved. May not be scanned, copied or duplicated, or posted to a publicly accessible website, in whole or in part.

CHAPTER 13 Statement of Cash Flows
Prob. 13–2B (Concluded)
Balance, Balance,
Account Title Dec. 31, 20Y3 Dec. 31, 20Y4
Operating activities:
Net income (a) 524,580
Depreciation—buildings (k) 51,660
Depreciation—machinery
and equipment (j) 22,680
Amortization of patents (i) 5,040
Increase in accounts
receivable (o) 73,080
Decrease in inventories (n) 134,680
Increase in prepaid expenses (m) 6,440
Decrease in accounts payable (h) 89,600
Decrease in salaries payable (f) 8,120
Investing activities:
Construction of building (l) 579,600
Financial activities:
Declaration of cash dividends (b) 131,040
Issuance of mortgage note
payable (e) 224,000
Increase in dividends payable (g) 7,560
Schedule of noncash investing
and financing activities:
Issuance of common stock
to retire bonds (c) 390,000 (d) 390,000Net change in cash (p) 82,320
Totals 1,360,200 1,360,200
Debit Credit
Harris Industries Inc.Spreadsheet (Work Sheet) for Statement of Cash Flows
For the Year Ended December 31, 20Y4
Transactions
13-31© 2017 Cengage Learning. All Rights Reserved. May not be scanned, copied or duplicated, or posted to a publicly accessible website, in whole or in part.

CHAPTER 13 Statement of Cash Flows
Prob. 13–3B
Cash flows from operating activities:
Net income $ 326,600
Adjustments to reconcile net income to
net cash flow from operating activities:
Depreciation 68,400
Gain on sale of land (60,000)
Changes in current operating assets
and liabilities:
Increase in accounts receivable (94,800)
Increase in inventories (52,800)
Decrease in prepaid expenses 7,800
Decrease in accounts payable (37,200)
Increase in income taxes payable 4,800
Net cash flow from operating activities $ 162,800
Cash flows from investing activities:
Cash received from sale of land $ 456,000
Cash paid for acquisition of building (990,000)
Cash paid for purchase of equipment (196,800)
Net cash flow used for investing activities (730,800)
Cash flows from financing activities:
Cash received from issuance of bonds payable $ 330,000
Cash received from issuance of common stock 280,000
Cash paid for dividends (79,200)
Net cash flow from financing activities 530,800
Change in cash $ (37,200)
Cash at the beginning of the year 337,800
Cash at the end of the year $ 300,600
For the Year Ended December 31, 20Y2
Coulson Inc.
Statement of Cash Flows
13-32© 2017 Cengage Learning. All Rights Reserved. May not be scanned, copied or duplicated, or posted to a publicly accessible website, in whole or in part.

CHAPTER 13 Statement of Cash Flows
Prob. 13–3B (Concluded)
(Optional)
Balance, Balance,
Account Title Dec. 31, 20Y1 Dec. 31, 20Y2
Cash 337,800 (p) 37,200 300,600
Accounts receivable (net) 609,600 (i) 94,800 704,400
Inventories 865,800 (h) 52,800 918,600
Prepaid expenses 26,400 (g) 7,800 18,600
Land 1,386,000 (m) 396,000 990,000
Buildings 990,000 (l) 990,000 1,980,000
Accum. depr.—buildings (366,000) (f) 31,200 (397,200)
Equipment 529,800 (j) 196,800 (k) 66,000 660,600
Accum. depr.—equipment (162,000) (k) 66,000 (e) 37,200 (133,200)
Accounts payable (631,200) (d) 37,200 (594,000)
Income taxes payable (21,600) (c) 4,800 (26,400)
Bonds payable 0 (n) 330,000 (330,000)
Common stock, $20 par (180,000) (o) 140,000 (320,000)
Paid-in capital in excess of
par—common stock (810,000) (o) 140,000 (950,000)Retained earnings (2,574,600) (b) 79,200 (a) 326,600 (2,822,000)
Totals 0 1,516,800 1,516,800 0
Operating activities:
Net income (a) 326,600
Depreciation—equipment (e) 37,200
Depreciation—buildings (f) 31,200
Gain on sale of land (m) 60,000
Increase in accts. receivable (i) 94,800
Increase in inventories (h) 52,800
Decrease in prepaid expenses (g) 7,800
Decrease in accounts payable (d) 37,200
Increase in income taxes
payable (c) 4,800
Investing activities:
Purchase of equipment (j) 196,800
Acquisition of building (l) 990,000
Sale of land (m) 456,000
Financing activities:
Payment of cash dividends (b) 79,200
Issuance of bonds payable (n) 330,000
Issuance of common stock (o) 280,000Net decrease in cash (p) 37,200
Totals 1,510,800 1,510,800
Debit Credit
Coulson Inc.Spreadsheet (Work Sheet) for Statement of Cash Flows
For the Year Ended December 31, 20Y2
Transactions
13-33© 2017 Cengage Learning. All Rights Reserved. May not be scanned, copied or duplicated, or posted to a publicly accessible website, in whole or in part.
CHAPTER 13 Statement of Cash Flows
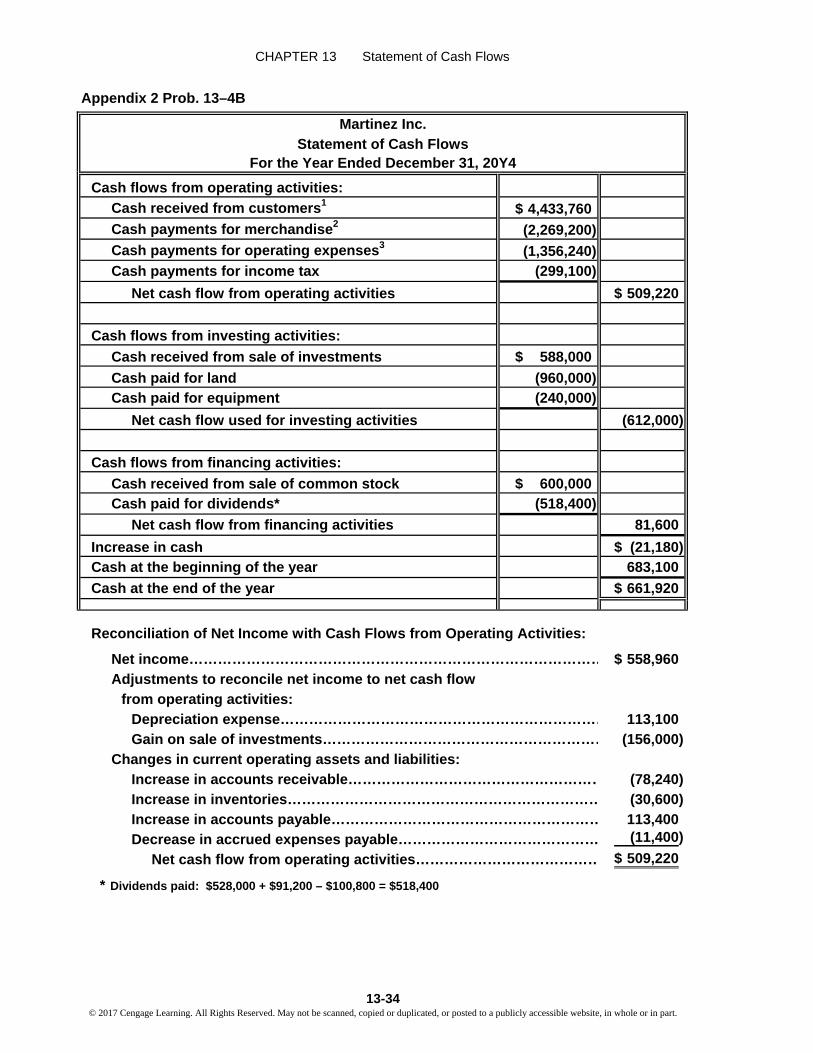
Appendix 2 Prob. 13–4B
Cash flows from operating activities:
Cash received from customers1 $ 4,433,760
Cash payments for merchandise2 (2,269,200)
Cash payments for operating expenses3 (1,356,240)Cash payments for income tax (299,100)
Net cash flow from operating activities $ 509,220
Cash flows from investing activities:
Cash received from sale of investments $ 588,000
Cash paid for land (960,000)Cash paid for equipment (240,000)
Net cash flow used for investing activities (612,000)
Cash flows from financing activities:
Cash received from sale of common stock $ 600,000Cash paid for dividends* (518,400)
Net cash flow from financing activities 81,600
Increase in cash $ (21,180)Cash at the beginning of the year 683,100
Cash at the end of the year $ 661,920
Reconciliation of Net Income with Cash Flows from Operating Activities:
Net income…………………………………………………………………………… $ 558,960Adjustments to reconcile net income to net cash flow
from operating activities:Depreciation expense…………………………………………………………… 113,100Gain on sale of investments…………………………………………………… (156,000)
Changes in current operating assets and liabilities:Increase in accounts receivable……………………………………………… (78,240)Increase in inventories………………………………………………………… (30,600)Increase in accounts payable………………………………………………… 113,400Decrease in accrued expenses payable…………………………………… (11,400)
Net cash flow from operating activities………………………………… $ 509,220
* Dividends paid: $528,000 + $91,200 – $100,800 = $518,400
For the Year Ended December 31, 20Y4
Martinez Inc.Statement of Cash Flows
13-34© 2017 Cengage Learning. All Rights Reserved. May not be scanned, copied or duplicated, or posted to a publicly accessible website, in whole or in part.
CHAPTER 13 Statement of Cash Flows
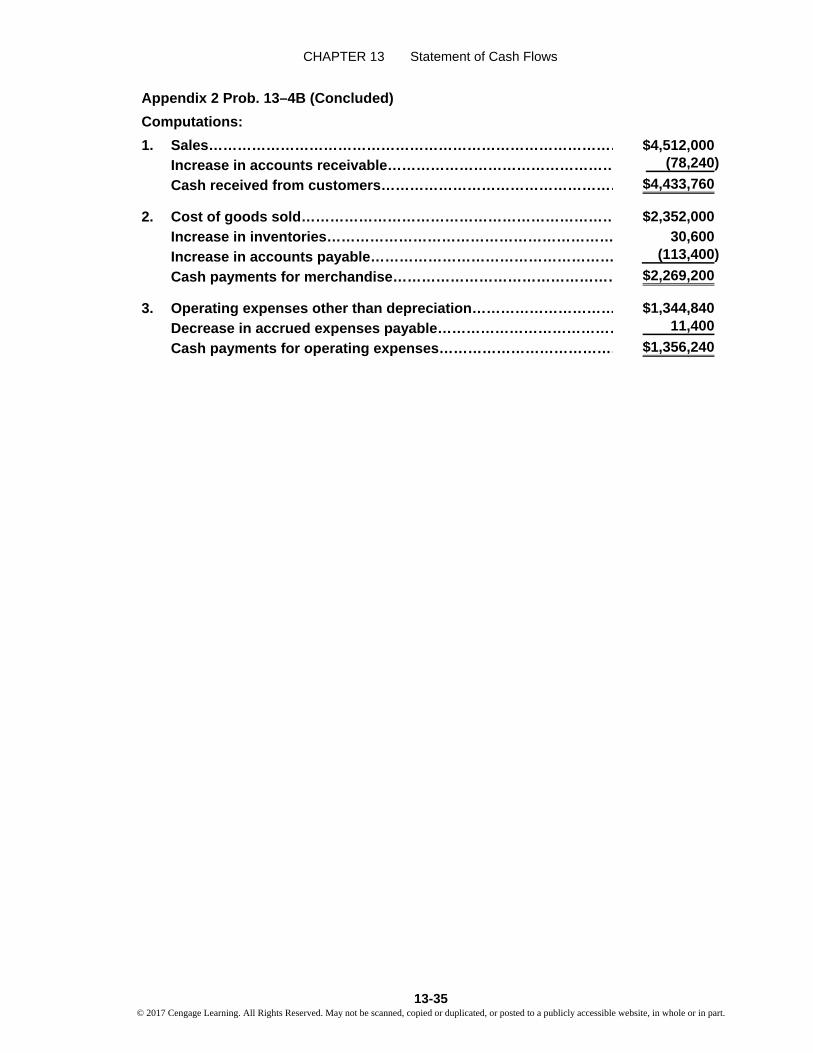
Appendix 2 Prob. 13–4B (Concluded)
Computations:
1. Sales…………………………………………………………………………… $4,512,000Increase in accounts receivable………………………………………… (78,240)
Cash received from customers…………………………………………… $4,433,760
2. Cost of goods sold………………………………………………………… $2,352,000
Increase in inventories…………………………………………………… 30,600
Increase in accounts payable…………………………………………… (113,400)
Cash payments for merchandise………………………………………… $2,269,200
3. Operating expenses other than depreciation………………………… $1,344,840
Decrease in accrued expenses payable………………………………… 11,400
Cash payments for operating expenses………………………………… $1,356,240
13-35© 2017 Cengage Learning. All Rights Reserved. May not be scanned, copied or duplicated, or posted to a publicly accessible website, in whole or in part.

CHAPTER 13 Statement of Cash Flows
Appendix 2 Prob. 13–5B
Cash flows from operating activities:
Cash received from customers1 $ 2,004,858
Cash payments for merchandise2 (1,242,586)
Cash payments for operating expenses3 (513,559)Cash payments for income taxes (94,453)
Net cash flow from operating activities $ 154,260
Cash flows from investing activities:
Cash received from sale of investments $ 91,800
Cash paid for purchase of land (295,800)Cash paid for purchase of equipment (80,580)
Net cash flow used for investing activities (284,580)
Cash flows from financing activities:
Cash received from sale of common stock $ 250,000Cash paid for dividends* (96,900)
Net cash flow from financing activities 153,100
Change in cash $ 22,780Cash at the beginning of the year 47,940
Cash at the end of the year $ 70,720
Reconciliation of Net Income with Cash Flows from Operating Activities:
Net income…………………………………………………………………………… $141,680
Adjustments to reconcile net income to net cash flowfrom operating activities:
Depreciation……………………………………………………………………… 14,790
Loss on sale of investments…………………………………………………… 10,200
Changes in current operating assets and liabilities:Increase in accounts receivable……………………………………………… (19,040)
Increase in inventories………………………………………………………… (8,670)
Increase in accounts payable………………………………………………… 11,560
Increase in accrued expenses payable……………………………………… 3,740
Net cash flow from operating activities………………………………… $154,260
* Dividends paid: $102,000 + $20,400 – $25,500 = $96,900
For the Year Ended December 31, 20Y9
Merrick Equipment Co.Statement of Cash Flows
13-36© 2017 Cengage Learning. All Rights Reserved. May not be scanned, copied or duplicated, or posted to a publicly accessible website, in whole or in part.

CHAPTER 13 Statement of Cash Flows
Appendix 2 Prob. 13–5B (Concluded)
Computations:
1. Sales……………………………………………………………………………… $2,023,898Increase in accounts receivable…………………………………………… (19,040)
Cash received from customers……………………………………………… $2,004,858
2. Cost of goods sold…………………………………………………………… $1,245,476
Increase in inventories……………………………………………………… 8,670
Increase in accounts payable……………………………………………… (11,560)
Cash payments for merchandise…………………………………………… $1,242,586
3. Operating expenses other than depreciation…………………………… $ 517,299
Increase in accrued expenses payable…………………………………… (3,740)
Cash payments for operating expenses…………………………………… $ 513,559
13-37© 2017 Cengage Learning. All Rights Reserved. May not be scanned, copied or duplicated, or posted to a publicly accessible website, in whole or in part.

CHAPTER 13 Statement of Cash Flows
ADM–1
A.Amazon Best Buy Walmart
Cash flows from operating activities $ 6,842 $1,935 $ 28,564Cash used to purchase property,
plant, and equipment (4,893) (561) (12,174)
Free cash flow $ 1,949 $1,374 $ 16,390
B.Amazon Best Buy Walmart
Ratio of free cash flow to sales 2.2% 3.4% 3.4%($1,949 ÷ ($1,374 ÷ ($16,390 ÷
$88,988) $40,339) $485,651)
C. Amazon’s free cash flow is $1,949 million, which is slightly higher than Best Buyand much lower than Walmart. However, these companies vary greatly in size;thus, comparing absolute free cash flow across these companies is not verymeaningful. A relative measure that can be used to compare free cash flow acrossthe three companies is the ratio of free cash flow to sales. Using this measure, itcan be seen that Amazon is weaker at generating free cash flow from sales than are Best Buy and Walmart. Amazon generates free cash flow equal to 2.2% of sales,while Best Buy and Walmart each generate free cash flow equal to 3.4% of sales.
ADM–2
A.Year 3 Year 2 Year 1
Cash flows from operating activities $ 36 $ (43) $218Cash used to purchase property,
plant, and equipment (42) (68) (82)
Free cash flow $ (6) $(111) $136
B.Year 3 Year 2 Year 1
Ratio of free cash flow to sales –0.2% –2.9% 3.4%[$(6) ÷ [$(111) ÷ [$136 ÷
$3,434] $3,831] $4,032)
The free cash flow information does accurately show the financial stress onRadioShack. Free cash flow and ratio of free cash flow to sales were negative in themost recent two years prior to bankruptcy. Moreover, the amount of cash used to purchase property, plant, and equipment declined across the three years. Thus, the free cash flow would have been even more negative if the purchases on property, plant, and equipment had remained at the Year 1 levels. It appears that RadioShack
ANALYSIS FOR DECISION MAKING
13-38© 2017 Cengage Learning. All Rights Reserved. May not be scanned, copied or duplicated, or posted to a publicly accessible website, in whole or in part.

CHAPTER 13 Statement of Cash Flows
attempted to save cash by reducing property, plant, and equipment purchases. Lastly, the sales levels were declining across the three years. This is considered
an unfavorable trend.
A. Total revenue is a good measure for assessing the relative size of the two companies.AT&T is clearly the larger company, with more than ten times the revenue ofFacebook ($132,447 ÷ $12,466) in Year 3. While total assets are not provided, AT&T is also much larger than Facebook by this measure as well (more than seven times as large).
B. Total revenue growth is measured horizontally for each company using Year 1 as the base year as follows:
Year 3 Year 2 Year 1AT&T 104% 101% 100%Facebook 245% 155% 100%
AT&T104% = $132,447 ÷ $127,434101% = $128,752 ÷ $127,434
Facebook245% = $12,446 ÷ $5,089155% = $7,872 ÷ $5,089
It is clear from this data that Facebook is growing much faster than AT&T. This isnot surprising in that Facebook is a young company that is expanding services andregions. AT&T is a more mature company with less opportunity for service or regional expansion. In addition, Facebook is starting from a much smaller revenuebase compared to AT&T. Fast growth is easier from a smaller base than a largerbase of activity.
C. Cash used to purchase PP&E as a percent of the cash flows from operating activities:
Year 3 Year 2 Year 1AT&T 68% 61% 50%Facebook 34% 32% 77%
AT&T68% = $21,433 ÷ $31,33861% = $21,228 ÷ $34,79650% = $19,728 ÷ $39,176
Facebook34% = $1,831 ÷ $5,45732% = $1,362 ÷ $4,22277% = $1,235 ÷ $1,612
ADM–2 (Concluded)
ADM–3
13-39© 2017 Cengage Learning. All Rights Reserved. May not be scanned, copied or duplicated, or posted to a publicly accessible website, in whole or in part.

CHAPTER 13 Statement of Cash Flows
D. The data indicate that AT&T requires more cash to purchase PP&E than does Facebook. In Years 2 and 3, the percent of cash flows from operations that isused to purchase PP&E is nearly double that of Facebook. Year 1 is a start-up year for Facebook and not likely a good indicator of future performance. Acrossall three years, as Facebook grows, the cash used for PP&E as a percent of cash flows from operating activities is declining. In contrast, across these three years, AT&T’s cash used for PP&E as a percent of cash flows from operating activities is increasing. The net impact of cash used to purchase PP&E on free cash flow is more negative for AT&T than it is for Facebook. This is because cash used to purchase PP&E is subtracted from cash flows from operating activities in determining free cash flow.
E.AT&T free cash flow
Year 3 Year 2 Year 1Cash flows from operating activities $ 31,338 $ 34,796 $ 39,176Cash used to purchase property,
plant, and equipment (21,433) (21,228) (19,728)
Free cash flow $ 9,905 $ 13,568 $ 19,448
Ratio of free cash flow to revenues:Year 3 Year 2 Year 1
Ratio of free cash flow to revenues 7.5% 10.5% 15.3%($9,905 ÷ ($13,568 ÷ ($19,448 ÷
$132,447) $128,752) $127,434)
Facebook free cash flow
Year 3 Year 2 Year 1Cash flows from operating activities $ 5,457 $ 4,222 $ 1,612Cash used to purchase property,
plant, and equipment (1,831) (1,362) (1,235)
Free cash flow $ 3,626 $ 2,860 $ 377
Ratio of free cash flow to revenues:Year 3 Year 2 Year 1
Ratio of free cash flow to revenues 29.1% 36.3% 7.4%($3,626 ÷ ($2,860 ÷ ($377 ÷
$12,466) $7,872) $5,089)
ADM–3 (Continued)
13-40© 2017 Cengage Learning. All Rights Reserved. May not be scanned, copied or duplicated, or posted to a publicly accessible website, in whole or in part.

CHAPTER 13 Statement of Cash Flows
F. Facebook appears to have a better free cash flow position than does AT&T. In Years 2 and 3, Facebook’s ratio of free cash flow to revenues is more than three times greater than AT&T’s. The first year was a start-up year, so is not likely to be indicative of Facebook’s free cash flow generating ability. Across the years, Facebook has significantly increased cash flows from operating activities. Thisis a major reason the ratio of free cash flows to revenues has increased. AT&T’s ratio of free cash flows to revenues has steadily declined over these three years.This decline can be explained by the decline in cash flows from operating activities, while the cash needed to purchase PP&E has increased over the three years. The net result is a decline in the ratio.
ADM–4
A.Net change in cash:
Year 3 Year 2 Year 1Net cash provided by operating activities $ 2,914 $ 2,301 $ 1,786Net cash used in investing activities (2,349) (2,162) (1,563)Net cash provided by (used in)
financing activities 1,429 (404) 669
Net change in cash for the year $ 1,994 $ (265) $ 892
B.Free cash flow:
Year 3 Year 2 Year 1Net cash provided by operating activities $2,914 $2,301 $1,786Additions to property, plant, and equipment (132) (84) (55)
Free cash flow $2,782 $2,217 $1,731
ADM–3 (Concluded)
13-41© 2017 Cengage Learning. All Rights Reserved. May not be scanned, copied or duplicated, or posted to a publicly accessible website, in whole or in part.

CHAPTER 13 Statement of Cash Flows
C. The free cash flow is more than $2 billion in Years 2 and 3. Over the three-year period, free cash flow grew from $1,731 million to $2,782 million, or a 61% increase[($2,782 − $1,731) ÷ $1,731]. This is excellent free cash flow performance. The freecash flow has been used to make acquisitions and investments and repurchasecommon stock. The acquisitions and investments help grow the company and provide for flexibility for the future. The repurchase of common stock is a methodof returning cash to stockholders.
D. The cash flow available for investment, dividends, debt repayments, and stock repurchases is best measured by the free cash flow. The change in cash for the period includes all of the sources and uses of cash, and thus does not say anything about the cash remaining for such uses.
ADM–4 (Concluded)
13-42© 2017 Cengage Learning. All Rights Reserved. May not be scanned, copied or duplicated, or posted to a publicly accessible website, in whole or in part.

CHAPTER 13 Statement of Cash Flows
TIF 13–1
Although this situation might seem harmless at first, it is, in fact, a violation of generally accepted accounting principles. The operating cash flow per share figureshould not be shown on the face of the income statement. The income statement isconstructed under accrual accounting concepts, while operating cash flow “undoes” the accounting accruals. Thus, the inclusion of cash flow information on the incomestatement could be confusing to users. Some users might not be able to distinguishbetween earnings and operating cash flow per share—or how to interpret the difference.By agreeing with Polly, Lucas has breached his professional ethics because thedisclosure would violate generally accepted accounting principles. On a more subtle note, Polly is being somewhat disingenuous. Apparently, Polly is not pleased with thisyear’s operating performance and would like to cover the earnings “bad news” with some “good cash flow news.” An interesting question is: Would Polly be as interestedin the dual per-share disclosures in the opposite scenario—with earnings per shareimproving and cash flow per share deteriorating? Probably not.
TIF 13–2
A sample solution based on Nike Inc.'s Form 10-K for the fiscal year ended May 31, 2015,follows:
1. A. $4,680 millionB. $(175) millionC. $(2,790) millionD. $1,632 million
2. The company has a very strong cash position, generating considerably more cash flows from operations than it requires for investing or financing activities.
TAKE IT FURTHER
13-43© 2017 Cengage Learning. All Rights Reserved. May not be scanned, copied or duplicated, or posted to a publicly accessible website, in whole or in part.

CHAPTER 13 Statement of Cash Flows
TIF 13–3
Memo
To: My InstructorFrom: A+ StudentRe: Tidewater Inc. Financial Condition
Tidewater Inc. is a retailer that has been unprofitable in recent years. While the companyhas returned to profitability, there are several “red flags” indicating that the company's future prospects are highly uncertain. These red flags are discussed below:
• The company has initiated a new marketing campaign that significantly increasedthe number of customers who are purchasing merchandise on credit using thecompany's branded credit card. This campaign significantly increased revenue and has helped the company return to profitability. However, it appears that thecompany has done a poor job of screening the creditworthiness of its new creditcard customers. Increases in credit card purchases have resulted in a large accounts receivable balance. It is unlikely that the company will be able to collecta large portion of these accounts receivable, which will likely lead to a cash crisis.
• The purchases of deeply discounted merchandise appear to be backfiring. The company has received some “good deals” on price. However, the merchandise isonly a “good deal” if the company can resell the merchandise at a profit. The large increase in inventory indicates that this is not the case. It appears that the merchandise has little customer appeal, and it is questionable whether the company will be able to sell the merchandise.
• The company has not been able to pay off its accounts payable in a timely manner,resulting in significant overdue accounts payable balances. While the companyreports that most of the past-due payables have been paid, it is concerning thatthe company became overdue on its accounts payable. A retailer cannot afford apoor payment history, or it will be denied future merchandise shipments. This is a signal of a severe cash flow problem.
These red flags suggest that the company is having severe operating cash flow
difficulties, and the company's future prospects are highly uncertain.
13-44© 2017 Cengage Learning. All Rights Reserved. May not be scanned, copied or duplicated, or posted to a publicly accessible website, in whole or in part.

13-1
© 2018 Cengage Learning®. May not be scanned, copied or duplicated, or posted to a publicly accessible website, in whole or in part.
chapter
13
Statement of Cash Flows ______________________________________________
OPENING COMMENTS This chapter demonstrates that the statement of cash flows is necessary for a complete picture of a
company’s financial condition. Both the direct and indirect methods of preparing a statement of cash
flows are presented. Because the indirect method is the most commonly used method for reporting cash
flows, it is the focus of the chapter. The direct method is covered in Appendix 2 of this chapter. If you
choose to cover only the direct method, be aware that you will still need to refer students to the
information on financing and investing activities in the chapter.
The chapter ends with a description and illustration of the value of evaluating a company’s free cash flow.
The first appendix describes how to use an electronic spreadsheet to develop a statement of cash flows
using the indirect method. The second appendix explains the direct method of preparing a statement of
cash flows.
After studying the chapter, your students should be able to:
1. Describe the cash flow activities reported on the statement of cash flows.
2. Prepare the cash flows from operating activities section of the statement of cash flows using the
indirect method.
3. Prepare the cash flows from investing activities section of the statement of cash flows.
4. Prepare the cash flows from financing activities section of the statement of cash flows.
5. Prepare a statement of cash flows.
ADM Describe and illustrate the use of free cash flow in evaluating a company’s cash flow.

13-2 Chapter 13 Statement of Cash Flows
© 2018 Cengage Learning®. May not be scanned, copied or duplicated, or posted to a publicly accessible website, in whole or in part.
KEY TERMS cash flow per share
cash flows from financing activities
cash flows from investing activities
cash flows from operating activities
direct method
free cash flow
indirect method
statement of cash flows
STUDENT FAQS Why do most preparers of cash flow statements prefer the indirect method?
I just don’t see a need for the cash flow statement. Who cares about the cash flow statement since it
tells the reader only where the company’s money came from and where the company’s money was
spent?
Why does the cash flow statement have to equal the change in the cash account?
Why does only the Operating section of the cash flow statement change when preparing the statement
under the two different methods?
If the cash flow statement is so important and helpful, why don’t we prepare all the financial
statements on a cash basis?
Why do we have to prepare a schedule of important noncash items to accompany this statement?
After all, this is the statement that is based on the cash inflows and outflows.
Why are there two methods to prepare the statement of cash flows?
Why are gains and losses on disposals of assets treated as adjustments to the cash flows from
operations but the cash part of the transaction is a source of funds under investing? Shouldn’t it all go
under one section?
Why can’t you assume that a company is financially healthy and liquid if it has a positive cash flow?
OBJECTIVE 1
Describe the cash flow activities reported in the statement of cash flows.
SYNOPSIS
The statement of cash flows reports a company’s cash inflows and outflows. It provides information that
answers questions about how the company generates cash from operations, how it maintains or expands
its operations, how it meets its financial obligations, and whether it has the cash to pay dividends. The
cash flow statement is used by both external and internal users. The cash flow statement is divided into
three sections: the operating activities are the cash flows from transactions that affect the net income of

Chapter 13 Statement of Cash Flows 13-3
© 2018 Cengage Learning®. May not be scanned, copied or duplicated, or posted to a publicly accessible website, in whole or in part.
the company, the investing activities are the cash flows from transactions that affect investment in
noncurrent assets, and the financing activities are the cash flows from transactions that affect the debt and
equity of the company. The ending cash on the statement of the cash flows equals the cash reported on the
balance sheet at the end of the year.
Cash flows from operating activities report the cash inflow and outflow from a company’s day-to-day
operations. In the direct method, the primary operating inflows of cash are received from customers, and
the primary outflows of cash are for merchandise, operating expenses, interest, and tax payments. The
indirect method reports cash flows from operating activities beginning with net income and adjusting it
for revenues and expenses that do not involve the receipt or payment of cash. Both methods result in the
same net cash flow from activities; however, due to the accessibility of the information, the indirect
method is more commonly used. A company may enter into transactions that do not directly affect cash;
they are reported in a separate section at the bottom of the statement of cash flows. The statement of cash
flows format is shown in Exhibit 3.
Key Terms and Definitions
Cash Flow per Share - Normally computed as cash flow from operations per share.
Cash Flows from Financing Activities - The section of the statement of cash flows that reports
cash flows from transactions affecting the equity and debt of the business.
Cash Flows from Investing Activities - The section of the statement of cash flows that reports
cash flows from transactions affecting investments in noncurrent assets.
Cash Flows from Operating Activities - The section of the statement of cash flows that reports
the cash transactions affecting the determination of net income.
Direct Method - A method of reporting the cash flows from operating activities as the difference
between the operating cash receipts and the operating cash payments.
Indirect Method - A method of reporting the cash flows from operating activities as the net
income from operations adjusted for all deferrals of past cash receipts and payments and all
accruals of expected future cash receipts and payments.
Statement of Cash Flows - A summary of the cash receipts and cash payments for a specific
period of time, such as a month or a year.
Relevant Check Up Corner and Exhibits
Exhibit 1 – Sources and Uses of Cash
Exhibit 2 – Cash Flow from Operations: Direct and Indirect Methods—NetSolutions
Exhibit 3 – Order of Reporting Statement of Cash Flows
Check Up Corner 13-1 – Classifications of Cash Flows
SUGGESTED APPROACH
Provided below is a Writing Exercise to introduce the statement of cash flows. The exercise asks students
to evaluate financial data from two companies. The goal is to point out that a firm’s profits do not paint a
total picture of its operations; cash flow data is also needed. Follow the Writing Exercise [Transparency
Master (TM) 13-1] by reviewing TM 13-2, which lists the benefits of a statement of cash flows. A
Lecture Aid is also provided here for reviewing the content of each section of the cash flow statement.

13-4 Chapter 13 Statement of Cash Flows
© 2018 Cengage Learning®. May not be scanned, copied or duplicated, or posted to a publicly accessible website, in whole or in part.
WRITING EXERCISE—Importance of the Statement of Cash Flows
TM 13-1 presents financial information taken from the accounting records of two companies. These
companies have the same net incomes but very different cash flows. Even though both companies have
the same sales, Company B did not collect as much cash from its customers. In addition, Company B did
not invest as much cash in fixed assets; this could inhibit future growth.
Show this data to your students and ask them to comment, in writing, on any strengths or weaknesses they
see in the two companies. After giving them a few minutes to study the information and write their
comments, review their responses.
Possible response: Company B has maintained its cash position by selling fixed assets, while Company
A is investing in fixed assets. This would bring into question the ability of Company B to remain
competitive with Company A for future production. Additionally, the inability to collect from customers
would bring into question the credit decisions Company B has been making, possibly granting credit to
questionable customers to maintain sales. Company A has also been able to invest some surplus cash to
provide returns, from which Company B will not have the same benefits.
LECTURE AID—Statement of Cash Flows
TMs 13-3 and 13-4 list the three sections of the statement of cash flows and the transactions included in
each section. TM 13-5 defines the content of the schedule of noncash investing and financing activities.
After reviewing these TMs, you may want to discuss the treatment of interest on debt and
interest/dividends on investments in the statement of cash flows. These transactions can be called the
“three foolers,” because students typically want to identify them as financing and investing activities
instead of operating activities. Use TM 13-6 for this purpose.
Have students identify cash flows from operating, investing, and financing activities from their personal
experiences. Some examples are listed below:
Operating activities: Cash inflows from a job, cash outflows for food or rent
Financing activities: Cash inflow from a student loan
Investing activities: Cash outflow for an automobile; cash inflow from selling a motorcycle
OBJECTIVE 2
Prepare the cash flows from operating activities section of the statement of cash flows using
the indirect method.
SYNOPSIS
Using the indirect method of reporting cash flows for operating activities, a comparison is made between
the account balances at the beginning and end of the year. By analyzing changes in noncash balance sheet
accounts, changes in the cash account are determined indirectly. The equation, change in cash = change in
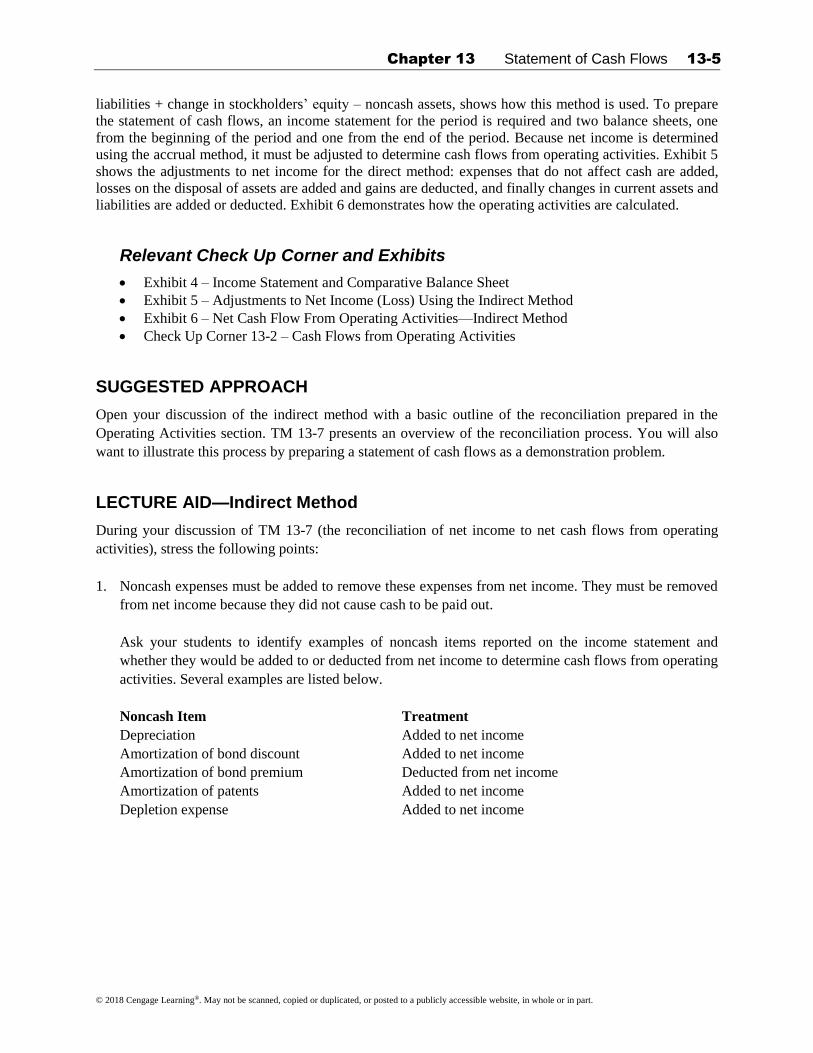
Chapter 13 Statement of Cash Flows 13-5
© 2018 Cengage Learning®. May not be scanned, copied or duplicated, or posted to a publicly accessible website, in whole or in part.
liabilities + change in stockholders’ equity – noncash assets, shows how this method is used. To prepare
the statement of cash flows, an income statement for the period is required and two balance sheets, one
from the beginning of the period and one from the end of the period. Because net income is determined
using the accrual method, it must be adjusted to determine cash flows from operating activities. Exhibit 5
shows the adjustments to net income for the direct method: expenses that do not affect cash are added,
losses on the disposal of assets are added and gains are deducted, and finally changes in current assets and
liabilities are added or deducted. Exhibit 6 demonstrates how the operating activities are calculated.
Relevant Check Up Corner and Exhibits
Exhibit 4 – Income Statement and Comparative Balance Sheet
Exhibit 5 – Adjustments to Net Income (Loss) Using the Indirect Method
Exhibit 6 – Net Cash Flow From Operating Activities—Indirect Method
Check Up Corner 13-2 – Cash Flows from Operating Activities
SUGGESTED APPROACH
Open your discussion of the indirect method with a basic outline of the reconciliation prepared in the
Operating Activities section. TM 13-7 presents an overview of the reconciliation process. You will also
want to illustrate this process by preparing a statement of cash flows as a demonstration problem.
LECTURE AID—Indirect Method
During your discussion of TM 13-7 (the reconciliation of net income to net cash flows from operating
activities), stress the following points:
1. Noncash expenses must be added to remove these expenses from net income. They must be removed
from net income because they did not cause cash to be paid out.
Ask your students to identify examples of noncash items reported on the income statement and
whether they would be added to or deducted from net income to determine cash flows from operating
activities. Several examples are listed below.
Noncash Item Treatment
Depreciation Added to net income
Amortization of bond discount Added to net income
Amortization of bond premium Deducted from net income
Amortization of patents Added to net income
Depletion expense Added to net income

13-6 Chapter 13 Statement of Cash Flows
© 2018 Cengage Learning®. May not be scanned, copied or duplicated, or posted to a publicly accessible website, in whole or in part.
2. Any gains or losses on investing and financing activities affect the amount of cash that was received
from selling investments or the amount of cash paid when settling debts. Because these activities are
reported in the investing and financing sections of the statement of cash flows, the gain or loss
included in the calculation of net income must be removed to isolate operating cash flows.
For example, a building with a $50,000 book value is sold for $125,000—a $75,000 gain. The
$75,000 gain must be removed from net income because it does not represent cash received from
operations (buying and selling merchandise). The entire $125,000 cash proceeds from the building
(which includes the gain) will be disclosed in the investing activities section. Remind students that
losses are added and gains are subtracted to remove them from the net income.
3. Changes in current assets and current liability accounts related to operating activities must be
considered to remove the effects of accrual accounting from net income and return to a cash-basis
measure of operations. Emphasize that net cash flow from operating activities is different from net
income because the income statement is based on the accrual basis of accounting. The statement of
cash flows presents cash basis accounting.
DEMONSTRATION PROBLEM—Preparing a Statement of Cash Flows: Indirect Method
Because of the amount of data required to prepare a statement of cash flows, it is appropriate to use a
problem from the text to demonstrate the preparation of the statement of cash flows. Use Problem 13-1A
or 13-1B to demonstrate the indirect method.
Instruct your students to complete a couple of preparatory steps before attacking a cash flow problem.
First, ask them to calculate the increase or decrease for every account on the balance sheet and write it in
the margin of the text. When working through a demonstration problem, give them a few minutes of class
time to complete this step on their own.
You may want to use the following algebraic proof to demonstrate why students need to calculate the
amount by which each account on the balance sheet has increased or decreased:
Assets = Liabilities + Stockholders’ Equity
Cash + Noncash Assets = Liabilities + Stockholders’ Equity
Change in Change in Change in Change in
Cash + Noncash Assets = Liabilities + Stockholders’ Equity
or
Change in Change in Change in Change in
Cash = Liabilities + Stockholders’ Equity – Noncash Assets
If you can explain what caused your Noncash Assets, Liabilities, and Stockholders’ Equity account
balances to change, you have explained what caused the Cash account balance to change.

Chapter 13 Statement of Cash Flows 13-7
© 2018 Cengage Learning®. May not be scanned, copied or duplicated, or posted to a publicly accessible website, in whole or in part.
The second preparatory step is to go through the balance sheet accounts and note where the change in
each account balance will be reported (“O” for operating activities, “I” for investing activities, and “F” for
financing activities). A few accounts, namely Retained Earnings and Accumulated Depreciation, must be
considered when preparing two sections of the statement of cash flows.
You will probably want to lead students through this step, instructing them to place an O, I, or F by each
account title in the example problem. The accounts in Problem 13-1A or 13-1B would be coded as
follows:
Cash (no code—this is the number we are trying to explain)
Accounts Receivable—O
Inventories—O
Investments—I
Land—I
Equipment—I
Accumulated Depreciation—O and I
Accounts Payable—O
Accrued Expenses—O
Dividends Payable— F
Common Stock—F
Paid-in Capital—F
Retained Earnings—O and F
Now your students are ready to attack the problem, beginning with the Operating Activities section.
Students should be encouraged to use a “check-off” method in completing the statement of cash flows.
The basics of the check-off method are as follows: When the total change in an account has been
explained, check it off. After an account has been checked off, you don’t need to look at it again.
For example, the first step in the Operating Activities section is to show the amount of net income. This
information is obtained from the income statement or, in accounting class, from the “additional
information” accompanying the problem. Net income is closed to the retained earnings account. If a
change in the account balance has not been fully explained, the account cannot be checked off. Students
must look at retained earnings again when preparing the Financing Activities section.
The next step in the Operating Activities section is to add back any depreciation, amortization, or
depletion. What account on the balance sheet would contain the depreciation for the year? (Answer:
Accumulated Depreciation) However, that account is also affected by entries to remove fixed assets when
sold or discarded. If there were no disposals of equipment, the only entry in the accumulated depreciation
account would be the adjusting entry for the year’s depreciation expense. All changes in the account
balance must be fully explained before all accounts can be checked off. Those are the basic steps in the
check-off method.
At this time, instruct your students to review the additional information given with the problem to look
for any gains and losses on investing and financing activities. Remind them that gains and losses occur
only when assets are sold and liabilities settled.

13-8 Chapter 13 Statement of Cash Flows
© 2018 Cengage Learning®. May not be scanned, copied or duplicated, or posted to a publicly accessible website, in whole or in part.
Ask your students to answer the following questions: (1) If there had been a loss of $20,000 on the sale of
investments, how would this be reported in the Operating Activities section of the statement of cash
flows? (Answer: The loss would be added to net income.) (2) If fully depreciated equipment had been
sold for $2,000, how would this be reported in the Operating Activities section of the statement of cash
flows? (Answer: The $2,000 gain would be deducted from net income.)
Now it is time to look at the current assets and current liabilities related to operations. Instruct your
students to go through the accounts coded with “O” and write down whether each account increased or
decreased and by what amount. Then, ask your students to determine whether the change had a positive or
negative effect on cash. Many students want to cling to text Exhibit 4 to assist with this task, so try to give
them a logical approach to determine how account changes affect cash.
The suggested explanations are overly simplified and, therefore, not “totally” accurate. However, most of
your students will find them useful. For example, if accounts receivable went up, did you sell more or less
on credit? More. If you sold more on credit, did you sell more or less for cash? Less. If you sold less on
cash, what was the effect on the Cash account? It decreased. Therefore, the change in accounts receivable
is subtracted. Now, in reality, accounts receivable may have increased because customers are paying more
slowly. Accounts receivable also may have increased simply because total sales increased without a
corresponding increase in cash sales. When insightful students bring up these arguments, agree with them.
Point out that the original explanation is useful because it is simple and tends to make sense to most
students.
When accounts receivable decrease, your explanation is the inverse: The company sold less on credit, so
it sold more for cash and the Cash account is increased. Explanations for changes in other accounts
follow:
1. Increase in Inventory: The company bought more inventory, so it has to pay for more inventory. Cash
is decreased.
2. Decrease in Inventory: The company bought less inventory, so it doesn’t have to pay for as much
inventory. Cash is increased.
3. Increase in Prepaid Expense: The company has prepaid more expenses using its cash. Cash is
decreased.
4. Decrease in Prepaid Expense: The company has prepaid fewer expenses, saving its cash. Cash is
increased.
5. Increase in Accounts Payable: The company has bought more on credit, so it has bought less with
cash. Cash is increased.
6. Decrease in Accounts Payable: The company has bought less on credit, so it is buying more with
cash. Cash is decreased.
After all accounts marked “O” have been checked off, it is time to move on to the investing and financing
accounts.

Chapter 13 Statement of Cash Flows 13-9
© 2018 Cengage Learning®. May not be scanned, copied or duplicated, or posted to a publicly accessible website, in whole or in part.
OBJECTIVE 3
Prepare the cash flows from investing activities section of the statement of cash flows.
SYNOPSIS
Investing activities are cash inflows and outflows related to a company’s long-term assets. It includes
investments in the company such as the purchase and sale of fixed assets. Investments can be made
outside the company as well. For example, buying and selling equity and debt securities, loaning money
to another company, and collecting principal payments from a company that borrowed money.
Relevant Check Up Corner
Check Up Corner 13-3 – Cash Flows from Investing Activities
SUGGESTED APPROACH
Ask students for examples of long-term assets and how their value can be changed. Define effects of the
changes as positive or negative on the company’s financial status.
LECTURE AID—Investing Activities
Use the Cash Flows from Investing Activities from TM 13-3 to categorize the assets as investments in
yourself or others. Discuss the effect of depreciation on investments.
OBJECTIVE 4
Prepare the cash flows from financing activities section of the statement of cash flows.
SYNOPSIS
Financing activities are cash inflows and outflows related to a company’s long-term liabilities and
equities. It includes activities that obtain and repay funds used to finance a company’s operations.
Relevant Check Up Corner
Check Up Corner 13-4 – Cash Flows from Financing Activities
SUGGESTED APPROACH
Ask students for examples of financing activities. Define the effects of the activities on the company’s
financial status.

13-10 Chapter 13 Statement of Cash Flows
© 2018 Cengage Learning®. May not be scanned, copied or duplicated, or posted to a publicly accessible website, in whole or in part.
LECTURE AID—Financing Activities
Use the Cash Flows from Financing Activities from TM 13-4 to categorize the activities as equity
financing or debt financing. Discuss the effect of the financing activities.
OBJECTIVE 5
Prepare a statement of cash flows.
SYNOPSIS
In this section, the pieces come together in a complete statement of cash flows.
Relevant Exhibit
Exhibit 7 – Statement of Cash Flows—Indirect Method
SUGGESTED APPROACH
Use Exhibit 7 to demonstrate the layout of a finished statement of cash flows.
Optional discussion: International Financial Reporting Standards (IFRSs). The statement of cash flows
is required under IFRSs and is similar to that required by GAAP. While there are differences, they are
minor in nature. For more information, consult page 623 of the text.
ADM OBJECTIVE
Describe and illustrate the use of free cash flow in evaluating a company’s cash flow.
SYNOPSIS
Free cash flow measures the operating cash flow available to a company to use after purchasing the
property, plant, and equipment necessary to maintain current productive capacity. It is also used to
measure the financial strength of a company. Calculate free cash flow as: cash flow from operating
activities – investments in PP&E needed to maintain current production = free cash flow. Positive free
cash flow is considered favorable. The company will be able to fund growth, retire debt, pay dividends,
and have financial flexibility.
Key Term and Definition
Free Cash Flow - The amount of operating cash flow remaining after replacing current
productive capacity and maintain current dividends.

Chapter 13 Statement of Cash Flows 13-11
© 2018 Cengage Learning®. May not be scanned, copied or duplicated, or posted to a publicly accessible website, in whole or in part.
SUGGESTED APPROACH
After explaining the concept of free cash flow, use the Make a Decision activity to demonstrate the free
cash flow calculation.
APPENDIX 1: SPREADSHEET (WORK SHEET)
FOR STATEMENT OF CASH FLOWS—THE
INDIRECT METHOD
SYNOPSIS
The appendix explains how to use a worksheet to create a statement of cash flows using the indirect
method. Using Exhibit 8, follow the seven steps to create the worksheet that will display all the
information needed to make a cash flow statement.
Relevant Exhibit
Exhibit 8 – End-of-Period Spreadsheet (Work Sheet) for Statement of Cash Flows—Indirect
Method
SUGGESTED APPROACH
A spreadsheet (work sheet) is a tool that can be used to gather data for preparing a statement of cash
flows.
The spreadsheet also lends itself to an in-class demonstration. Choose one of the cash flow problems at
the end of the text (such as Problem 13-1A or 13-1B), and ask your students to bring the working papers
for that problem to class. The working papers include a cash flow spreadsheet. Demonstrate completion
of that spreadsheet using the steps outlined in the chapter appendix.
Emphasize that entries recorded on a cash flow spreadsheet are not recorded as journal entries or posted
to the ledger. These entries are made to analyze past transactions and provide data for preparing a
statement of cash flows.

13-12 Chapter 13 Statement of Cash Flows
© 2018 Cengage Learning®. May not be scanned, copied or duplicated, or posted to a publicly accessible website, in whole or in part.
APPENDIX 2: PREPARING THE STATEMENT
OF CASH FLOWS—THE DIRECT METHOD
SYNOPSIS
Because the two methods are the same for the Investing and Financing sections, only the Operating
Activities section is calculated differently. The direct operating section starts with cash received from
customers. To determine this number, add the decrease in accounts receivable or subtract the increase in
accounts receivable from sales. These steps are shown in Exhibit 9. Next, determine the cash paid for
merchandise by subtracting or adding the differences in inventories and accounts payable from the cost of
goods sold reported on the income statement; these steps are found in Exhibit 11. Determine the cash paid
for operating expenses by subtracting or adding the differences in expenses payable from the operating
expenses (other than depreciation) reported on the income statement; these steps are found in Exhibit 12.
The format for the cash flows statement in the direct method is shown in its entirety in Exhibit 15.
Relevant Exhibits
Exhibit 9 – Converting Income Statement to Cash Flows from Operating Activities Using the
Direct Method
Exhibit 10 – Determining the Cash Received from Customers
Exhibit 11 – Determining the Cash Payments for Merchandise
Exhibit 12 – Determining the Cash Payments for Operating Expenses
Exhibit 13 – Determining the Cash Payments for Interest
Exhibit 14 – Determining the Cash Payments for Income Taxes
Exhibit 15 – Statement of Cash Flows—Direct Method
SUGGESTED APPROACH
The direct method of preparing a statement of cash flows is another topic that can be presented effectively
through a Demonstration Problem. If you have already covered the indirect method, you need only to
illustrate the Operating Activities section.
Prior to beginning the Demonstration Problem, stress that the Operating Activities section is the only
portion of the statement of cash flows that varies between the direct and indirect methods. The direct and
indirect methods will report the same amount of net cash flows from operating activities, but the
information is presented in a different format.
When a company chooses to prepare the direct statement of cash flows, it must present the reconciliation
of net income to net cash flows from operating activities (the heart of the indirect method) in a supporting
schedule. Thus, preparing a direct statement of cash flows obligates a company to prepare the Operating
Activities section under both methods. So, most companies use the indirect method.

Chapter 13 Statement of Cash Flows 13-13
© 2018 Cengage Learning®. May not be scanned, copied or duplicated, or posted to a publicly accessible website, in whole or in part.
DEMONSTRATION PROBLEM—Preparation of a Statement of Cash Flows: Direct Method
The direct method presents the major classes of cash receipts and payments from operating activities. To
prepare a direct statement of cash flows, an income statement is needed in addition to comparative
balance sheets. Problems 13-5A and 13-5B repeat the information presented in Problems 13-1A and 13-
1B, plus give an income statement.
When completing a direct statement of cash flows, ask your students to complete the same preparatory
steps discussed in Objective 2—computing changes in account balances and coding accounts with an O, I,
or F (for operating, investing, or financing). The check-off method described previously is also
appropriate when preparing a direct statement of cash flows.
TM 13-8 presents the major classes of cash receipts and payments that are typically identified in a direct
statement. The TM also presents formulas for computing each cash flow item. In reality, the formulas on
TM 13-8 are a shortcut approach. Students usually need a complete explanation of the calculations for
cash received from customers and cash paid for purchases in order to understand these shortcuts.
Under the direct method, you must determine the cash collected from customers. The sales reported on
the income statement do not represent cash collections for two reasons: (1) The sales figure includes
credit sales that have not been collected and (2) the sales figure does not include collections on last year’s
credit sales made during the current year. Therefore, sales must be adjusted. Again, discourage your
students from trying to memorize rules on whether to add or subtract changes in accounts receivable.
Give them a methodology to think through the changes.
The methodology presented under Objective 2 will also work in the direct method. The calculation could
be explained as follows:
Accounts receivable increased, so the company is selling more on credit and selling less for cash.
Therefore, the effect on cash receipts is negative.
Or:
Accounts receivable increased, indicating that credit sales on account were more than cash collections.
Therefore, the increase must be subtracted from sales to get cash receipts.

13-14 Chapter 13 Statement of Cash Flows
© 2018 Cengage Learning®. May not be scanned, copied or duplicated, or posted to a publicly accessible website, in whole or in part.
Under the direct method, you must also determine the cash paid for purchases. Before you can determine
cash paid for purchases, you must know the cost of merchandise purchased. The income statement in
Problem 13-5A does not show the detailed calculation of cost of goods sold; therefore, the cost of
merchandise purchased cannot be determined just by looking at the income statement. However, it can be
determined as follows:
Beginning Inventory
+ Cost of Merchandise Purchased
– Ending Inventory
Cost of Goods Sold
Therefore,
Cost of Goods Sold
– Beginning Inventory
+ Ending Inventory
Cost of Merchandise Purchased
The cost of merchandise purchased must be adjusted to determine cash payments for purchase:
Cost of merchandise purchased $ XXX
– Credit purchases not yet paid for (ending balance of
accounts payable) (XXX)
+ Payments on last year’s credit purchases (beginning balance
of accounts payable) XXX
$ XXX
Or (combining both of these calculations into one formula):
Cost of goods sold $ XXX
+ Change in inventories XXX
– Change in accounts payable (XXX)
Cash payments for purchases $ XXX
Explain that the increase in inventories can be interpreted as increasing cash payments because more
inventory was purchased. The increase in accounts payable can be interpreted as decreasing cash
payments because the company made more purchases on account.
Continue with the problem, demonstrating the calculations of cash paid for operating expenses and cash
paid for income taxes. When you have completed the Operating Activities section, remind students that
the net cash flow is the same number as computed under the indirect method.

© 2018 Cengage Learning®. May not be scanned, copied or duplicated, or posted to a publicly accessible website, in whole or in part.
Type Item Description LO(s) Difficulty Time Est BUSPROG AICPA ACBSP - Primary Bloom's Video Excel CLGL ADM Real World Writing Ethics
MC 1 1 Easy 5 min. Analytic FN - Measurement Statement of Cash Flows Remembering
MC 2 1 Easy 5 min. Analytic FN - Measurement Statement of Cash Flows Remembering
MC 3 1 Easy 5 min. Analytic FN - Measurement Statement of Cash Flows Remembering
MC 4 1 Easy 5 min. Analytic FN - Measurement Statement of Cash Flows Remembering
MC 5 2 Easy 5 min. Analytic FN - Measurement Statement of Cash Flows Applying
LREX 1 Classifying cash flows 1 Easy 5 min. Analytic FN - Measurement Statement of Cash Flows Applying x
LREX 2 Adjustments to net income - indirect method 2 Easy 5 min. Analytic FN - Measurement Statement of Cash Flows Applying x
LREX 3 Changes in current operating assets and liabilities - indirect method 2 Easy 5 min. Analytic FN - Measurement Statement of Cash Flows Applying x
LREX 4 Cash flows from operating activities - indirect method 2 Easy 10 min. Analytic FN - Measurement Statement of Cash Flows Applying x
LREX 5 Land transactions on the statement of cash flows 3 Easy 5 min. Analytic FN - Measurement Statement of Cash Flows Applying x
LREX 6 Common stock transactions on the statement of cash flows 4 Easy 5 min. Analytic FN - Measurement Statement of Cash Flows Applying x
PP Problem n/a Challenging 1.5 hour Analytic FN - Measurement Statement of Cash Flows Applying
DQ 1 n/a Easy 5 min. Analytic FN - Measurement Statement of Cash Flows Remembering
DQ 2 n/a Easy 5 min. Analytic FN - Measurement Statement of Cash Flows Remembering
DQ 3 n/a Easy 5 min. Analytic FN - Measurement Statement of Cash Flows Applying
DQ 4 n/a Easy 5 min. Analytic FN - Measurement Statement of Cash Flows Applying
DQ 5 n/a Easy 5 min. Analytic FN - Measurement Statement of Cash Flows Applying
DQ 6 n/a Easy 5 min. Analytic FN - Measurement Statement of Cash Flows Applying
DQ 7 n/a Easy 5 min. Analytic FN - Measurement Statement of Cash Flows Applying
DQ 8 n/a Easy 5 min. Analytic FN - Measurement Statement of Cash Flows Applying
DQ 9 n/a Easy 5 min. Analytic FN - Measurement Statement of Cash Flows Analyzing
DQ 10 n/a Easy 5 min. Analytic FN - Measurement Statement of Cash Flows Remembering
BE 1 Classifying cash flows 1 Easy 5 min. Analytic FN - Measurement Statement of Cash Flows Remembering x
BE 2 Adjustments to net income - indirect method 2 Easy 5 min. Analytic FN - Measurement Statement of Cash Flows Applying x
BE 3 Changes in current operating assets and liabilities - indirect method 2 Easy 5 min. Analytic FN - Measurement Statement of Cash Flows Applying x
BE 4 Cash flows from operating activities - indirect method 2 Easy 10 min. Analytic FN - Measurement Statement of Cash Flows Applying x
BE 5 Land transactions on the statement of cash flows 3 Easy 5 min. Analytic FN - Measurement Statement of Cash Flows Applying x
BE 6 Common stock transactions on the statement of cash flows 4 Easy 5 min. Analytic FN - Measurement Statement of Cash Flows Applying x
BE 7 Cash received from customers - direct method Appendix 2 Easy 5 min. Analytic FN - Measurement Statement of Cash Flows Analyzing x
BE 8 Cash payments for merchandise - direct method Appendix 2 Easy 5 min. Analytic FN - Measurement Statement of Cash Flows Analyzing x
EX 1 Cash flows from operating activities - net loss 1 Easy 5 min. Analytic FN - Measurement Statement of Cash Flows Applying x x
EX 2 Effects of transactions on cash flows 1 Easy 10 min. Analytic FN - Measurement Statement of Cash Flows Applying
EX 3 Classifying cash flows 1 Easy 10 min. Analytic FN - Measurement Statement of Cash Flows Remembering
EX 4 Cash flows from operating activities - indirect method 2 Easy 10 min. Analytic FN - Measurement Statement of Cash Flows Remembering
EX 5 Cash flows from operating activities - indirect method 1,2 Easy 10 min. Analytic FN - Measurement Statement of Cash Flows Applying x x
EX 6 Cash flows from operating activities - indirect method 1,2 Easy 10 min. Analytic FN - Measurement Statement of Cash Flows Applying x x
EX 7 Cash flows from operating activities - indirect method 1,2 Easy 10 min. Analytic FN - Measurement Statement of Cash Flows Applying x x
EX 8 Reporting changes in equipment on statement of cash flows 3 Easy 5 min. Analytic FN - Measurement Statement of Cash Flows Applying
EX 9 Reporting changes in equipment on statement of cash flows 3 Easy 5 min. Analytic FN - Measurement Statement of Cash Flows Applying
EX 10 Reporting land transactions on statement of cash flows 3 Easy 5 min. Analytic FN - Measurement Statement of Cash Flows Applying
EX 11 Determining cash payments to stockholders 4 Easy 5 min. Analytic FN - Measurement Statement of Cash Flows Applying x
EX 12 Reporting stockholders' equity items on statement of cash flows 4 Moderate 10 min. Analytic FN - Measurement Statement of Cash Flows Applying
EX 13 Reporting land acquisition for cash and mortgage note on statement of cash flows 3,4 Easy 5 min. Analytic FN - Measurement Statement of Cash Flows Applying
EX 14 Reporting issuance and retirement of long-term debt 4 Moderate 10 min. Analytic FN - Measurement Statement of Cash Flows Applying
EX 15 Determining net income from net cash flow from operating activities 2,3,4 Moderate 10 min. Analytic FN - Measurement Statement of Cash Flows Applying x x
EX 16 Cash flows from operating activities - indirect method 2 Moderate 15 min. Analytic FN - Measurement Statement of Cash Flows Applying x x x
EX 17 Statement of cash flows - indirect method 2,3,4,5 Moderate 20 min. Analytic FN - Measurement Statement of Cash Flows Applying x x x
EX 18 Statement of cash flows - indirect method 2,3,4,5 Moderate 15 min. Analytic FN - Measurement Statement of Cash Flows Applying
EX 19 Cash flows from operating activities - direct method Appendix 2 Easy 5 min. Analytic FN - Measurement Statement of Cash Flows Applying x
EX 20 Determining selected amounts for cash flows from operating activities - direct method Appendix 2 Easy 10 min. Analytic FN - Measurement Statement of Cash Flows Applying
EX 21 Cash flows from operating activities - direct method Appendix 2 Moderate 15 min. Analytic FN - Measurement Statement of Cash Flows Applying x
EX 22 Cash flows from operating activities - direct method Appendix 2 Moderate 15 min. Analytic FN - Measurement Statement of Cash Flows Applying
PR 1A Statement of cash flows - indirect method 2,3,4,5 Moderate 1.5 hours Analytic FN - Measurement Statement of Cash Flows Applying x x
PR 2A Statement of cash flows - indirect method 2,3,4,5 Moderate 1.5 hours Analytic FN - Measurement Statement of Cash Flows Applying x x
PR 3A Statement of cash flows - indirect method 2,3,4,5 Moderate 1.5 hours Analytic FN - Measurement Statement of Cash Flows Applying x
PR 4A Statement of cash flows - direct method Appendix 2 Moderate 1.5 hours Analytic FN - Measurement Statement of Cash Flows Applying x x x
PR 5A Statement of cash flows - direct method Appendix 2 Moderate 1.5 hours Analytic FN - Measurement Statement of Cash Flows Applying x
PR 1B Statement of cash flows - indirect method 2,3,4,5 Moderate 1.5 hours Analytic FN - Measurement Statement of Cash Flows Applying x x
PR 2B Statement of cash flows - indirect method 2,3,4,5 Moderate 1.5 hours Analytic FN - Measurement Statement of Cash Flows Applying x x
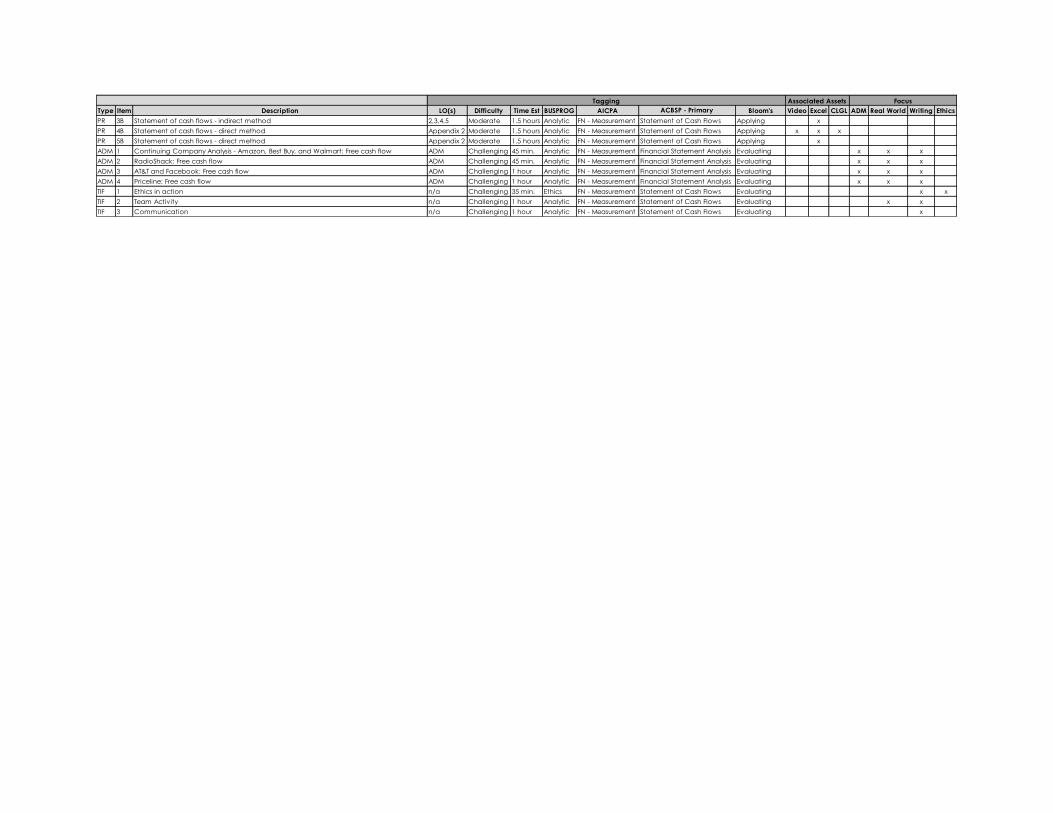
Type Item Description LO(s) Difficulty Time Est BUSPROG AICPA ACBSP - Primary Bloom's Video Excel CLGL ADM Real World Writing Ethics
PR 3B Statement of cash flows - indirect method 2,3,4,5 Moderate 1.5 hours Analytic FN - Measurement Statement of Cash Flows Applying x
PR 4B Statement of cash flows - direct method Appendix 2 Moderate 1.5 hours Analytic FN - Measurement Statement of Cash Flows Applying x x x
PR 5B Statement of cash flows - direct method Appendix 2 Moderate 1.5 hours Analytic FN - Measurement Statement of Cash Flows Applying x
ADM 1 Continuing Company Analysis - Amazon, Best Buy, and Walmart: Free cash flow ADM Challenging 45 min. Analytic FN - Measurement Financial Statement Analysis Evaluating x x x
ADM 2 RadioShack: Free cash flow ADM Challenging 45 min. Analytic FN - Measurement Financial Statement Analysis Evaluating x x x
ADM 3 AT&T and Facebook: Free cash flow ADM Challenging 1 hour Analytic FN - Measurement Financial Statement Analysis Evaluating x x x
ADM 4 Priceline: Free cash flow ADM Challenging 1 hour Analytic FN - Measurement Financial Statement Analysis Evaluating x x x
TIF 1 Ethics in action n/a Challenging 35 min. Ethics FN - Measurement Statement of Cash Flows Evaluating x x
TIF 2 Team Activity n/a Challenging 1 hour Analytic FN - Measurement Statement of Cash Flows Evaluating x x
TIF 3 Communication n/a Challenging 1 hour Analytic FN - Measurement Statement of Cash Flows Evaluating x
Tagging FocusAssociated Assets

Name Chapter 2 23
© 2018 Cengage Learning®. May not be scanned, copied or duplicated, or posted to a publicly accessible website, in whole or in part.
EXERCISE 2-1
A.
B.
C.
D.
E.
EXERCISE 2-2
A. Cost of goods sold:
B. Direct materials cost:
C. Direct labor cost:

24 Name Chapter 2
© 2018 Cengage Learning®. May not be scanned, copied or duplicated, or posted to a publicly accessible website, in whole or in part.
EXERCISE 2-3
A.
RECEIVED ISSUED BALANCE
Receiving Report
Number Quantity Unit Price
Materials Requisition
Number Quantity Amount Date Quantity Unit Price Amount
May 1 285 $30.00 $8,550
40 130 $32.00 May 4
91 365 May 10
44 110 38.00 May 21
97 100 May 27
B.
C.
JOURNAL PAGE
DATE DESCRIPTION
POST.REF.
DEBIT CREDIT
1 1
2 2
3 3
4 4
D.

Name Chapter 2 25
© 2018 Cengage Learning®. May not be scanned, copied or duplicated, or posted to a publicly accessible website, in whole or in part.
EXERCISE 2-4
JOURNAL PAGE
DATE DESCRIPTION
POST.REF.
DEBIT CREDIT
1 1
2 2
3 3
4 4
EXERCISE 2-5
A. and B.
JOURNAL PAGE
DATE DESCRIPTION
POST.REF.
DEBIT CREDIT
1 1
2 2
3 3
4 4
5 5
6 6
7 7
8 8
9 9
10 10
C.
Fabric Polyester Filling Lumber Glue
EXERCISE 2-6
JOURNAL PAGE
DATE DESCRIPTION
POST.REF.
DEBIT CREDIT
1 1
2 2
3 3
4 4

26 Name Chapter 2
© 2018 Cengage Learning®. May not be scanned, copied or duplicated, or posted to a publicly accessible website, in whole or in part.
EXERCISE 2-7
A.
JOURNAL PAGE
DATE DESCRIPTION
POST.REF.
DEBIT CREDIT
1 1
2 2
3 3
4 4
Supporting calculations:
B.

Name Chapter 2 27
© 2018 Cengage Learning®. May not be scanned, copied or duplicated, or posted to a publicly accessible website, in whole or in part.
EXERCISE 2-8
A. and B.
JOURNAL PAGE
DATE DESCRIPTION
POST.REF.
DEBIT CREDIT
1 1
2 2
3 3
4 4
5 5
6 6
7 7
8 8
9 9
10 10
EXERCISE 2-9
A. Factory 1 overhead rate:
B. Factory 2 overhead rate:
C.
JOURNAL PAGE
DATE DESCRIPTION
POST.REF.
DEBIT CREDIT
1 1
2 2
3 3
4 4
5 5
6 6
7 7
8 8
9 9
D. Balance of Factory 1 accounts as of March 31:
Balance of Factory 2 accounts as of March 31:

28 Name Chapter 2
© 2018 Cengage Learning®. May not be scanned, copied or duplicated, or posted to a publicly accessible website, in whole or in part.
EXERCISE 2-10

Name Chapter 2 29
© 2018 Cengage Learning®. May not be scanned, copied or duplicated, or posted to a publicly accessible website, in whole or in part.
EXERCISE 2-11
A.
B.
C.
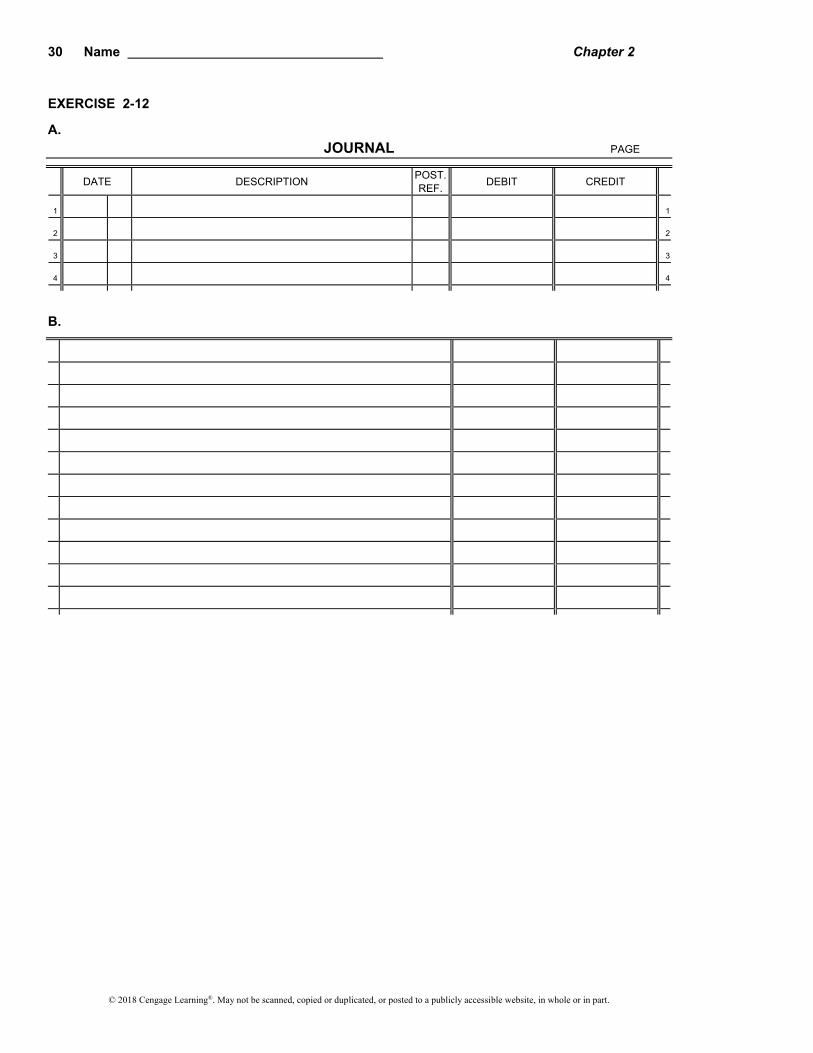
30 Name Chapter 2
© 2018 Cengage Learning®. May not be scanned, copied or duplicated, or posted to a publicly accessible website, in whole or in part.
EXERCISE 2-12
A.
JOURNAL PAGE
DATE DESCRIPTION
POST.REF.
DEBIT CREDIT
1 1
2 2
3 3
4 4
B.

Name Chapter 2 31
© 2018 Cengage Learning®. May not be scanned, copied or duplicated, or posted to a publicly accessible website, in whole or in part.
EXERCISE 2-13
A. through D.
JOURNAL PAGE
DATE DESCRIPTION
POST.REF.
DEBIT CREDIT
1 1
2 2
3 3
4 4
5 5
6 6
7 7
8 8
9 9
10 10
11 11
12 12
13 13
14 14
15 15
16 16
17 17
18 18
19 19
20 20
21 21
22 22
23 23
24 24
25 25
26 26
27 27
28 28

32 Name Chapter 2
© 2018 Cengage Learning®. May not be scanned, copied or duplicated, or posted to a publicly accessible website, in whole or in part.
EXERCISE 2-14
A.
Income Statement
B. Materials inventory:
Work in process inventory:
Finished goods inventory:

Name Chapter 2 33
© 2018 Cengage Learning®. May not be scanned, copied or duplicated, or posted to a publicly accessible website, in whole or in part.
EXERCISE 2-15
A.
JOURNAL PAGE
DATE DESCRIPTION
POST.REF.
DEBIT CREDIT
1 1
2 2
3 3
4 4
5 5
6 6
7 7
8 8
9 9
10 10
11 11
12 12
13 13
14 14
15 15
16 16
17 17
18 18
19 19
20 20
21 21
22 22
23 23
24 24
25 25
26 26
27 27
28 28
29 29
30 30
31 31
32 32
33 33
34 34
35 35

34 Name Chapter 2
© 2018 Cengage Learning®. May not be scanned, copied or duplicated, or posted to a publicly accessible website, in whole or in part.
EXERCISE 2-15, Concluded
B.
C.

Name Chapter 2 35
© 2018 Cengage Learning®. May not be scanned, copied or duplicated, or posted to a publicly accessible website, in whole or in part.
EXERCISE 2-16
A. through D.
JOURNAL PAGE
DATE DESCRIPTION
POST.REF.
DEBIT CREDIT
1 1
2 2
3 3
4 4
5 5
6 6
7 7
8 8
9 9
10 10
11 11
12 12
13 13
14 14
Supporting calculations:

36
© 2018 Cengage Learning®. May not be scanned, copied or duplicated, or posted to a publicly accessible website, in whole or in part.
This Page Not Used.

Name Chapter 2 37
© 2018 Cengage Learning®. May not be scanned, copied or duplicated, or posted to a publicly accessible website, in whole or in part.
PROBLEM 2-1 ___
A. through I.
JOURNAL PAGE
DATE DESCRIPTION
POST.REF.
DEBIT CREDIT
1 1
2 2
3 3
4 4
5 5
6 6
7 7
8 8
9 9
10 10
11 11
12 12
13 13
14 14
15 15
16 16
17 17
18 18
19 19
20 20
21 21
22 22
23 23
24 24
25 25
26 26
27 27
28 28
29 29
30 30
31 31
32 32
33 33
34 34
35 35

38 Name Chapter 2
© 2018 Cengage Learning®. May not be scanned, copied or duplicated, or posted to a publicly accessible website, in whole or in part.
PROBLEM 2-1 ___, Concluded
JOURNAL PAGE
DATE DESCRIPTION
POST.REF.
DEBIT CREDIT
1 1
2 2
3 3
4 4
5 5
6 6
7 7
8 8
9 9
10 10
11 11
12 12
13 13
14 14
15 15
16 16
17 17
18 18
19 19
20 20
21 21
22 22
23 23
24 24
25 25
26 26
27 27
28 28
29 29
30 30
31 31
32 32
33 33
34 34
35 35
36 36

Name Chapter 2 39
© 2018 Cengage Learning®. May not be scanned, copied or duplicated, or posted to a publicly accessible website, in whole or in part.
PROBLEM 2-2 ___
1. A. through G.
JOURNAL PAGE
DATE DESCRIPTION
POST.REF.
DEBIT CREDIT
1 1
2 2
3 3
4 4
5 5
6 6
7 7
8 8
9 9
10 10
11 11
12 12
13 13
14 14
15 15
16 16
17 17
18 18
19 19
20 20
21 21
22 22
23 23
24 24
25 25
26 26
27 27
28 28
29 29
30 30
31 31
32 32
33 33
34 34
35 35

40 Name Chapter 2
© 2018 Cengage Learning®. May not be scanned, copied or duplicated, or posted to a publicly accessible website, in whole or in part.
PROBLEM 2-2 ___, Continued
F. Computation of cost of jobs finished:
G. Computation of cost of jobs sold:
2.
Work in Process
Finished Goods

Name Chapter 2 41
© 2018 Cengage Learning®. May not be scanned, copied or duplicated, or posted to a publicly accessible website, in whole or in part.
PROBLEM 2-2 ___, Concluded
3.
Schedule of Unfinished Jobs
JOB DIRECT
MATERIALS DIRECT LABOR
FACTORY OVERHEAD
TOTAL
4.
Schedule of Completed Jobs
JOB DIRECT
MATERIALS DIRECT LABOR
FACTORY OVERHEAD
TOTAL

42
© 2018 Cengage Learning®. May not be scanned, copied or duplicated, or posted to a publicly accessible website, in whole or in part.
This Page Not Used.

Name Chapter 2 43
© 2018 Cengage Learning®. May not be scanned, copied or duplicated, or posted to a publicly accessible website, in whole or in part.
PROBLEM 2-3 ___
1. and 2.
JOB ORDER COST SHEET
Customer Date
Date wanted
Date completed
Job No.
ESTIMATE
Direct Materials Direct Labor Summary
Amount Amount Amount
____ meters at $_____ ________ ____ hours at $_____ ________ Direct materials ________
____ meters at _____ ________ ____ hours at _____ ________ Direct labor ________
____ meters at _____ ________ ____ hours at _____ ________ Factory overhead ________
____ meters at _____ ____ hours at _____ ________
Total Total Total cost
ACTUAL
Direct Materials Direct Labor Summary
Mat. Req. No.
Description Amount TimeTicket
No. Description Amount Item Amount
_____ ____________ ________ _____ ____________ ________ Direct materials ________
_____ ____________ ________ _____ ____________ ________ Direct labor ________
_____ ____________ ________ _____ ____________ ________ Factory overhead ________
_____ ____________ ________ _____ ____________ ________
Total Total Total cost
Comments:

44
© 2018 Cengage Learning®. May not be scanned, copied or duplicated, or posted to a publicly accessible website, in whole or in part.
This Page Not Used.

Nam
e
Ch
apter 2
© 2018 C
engage Learning
®. May not be scanned, copied or duplicated, or posted to a publicly accessible w
ebsite, in whole or in part.
45
PR
OB
LE
M 2-4 ___
1. S
upporting calculations:
Job
No
. Q
uan
tity
__________ W
ork in
P
rocess
Direct
Materials
Direct
Lab
or
Facto
ry O
verhead
T
otal
Co
st U
nit
Co
st U
nits
So
ld
Co
st of
Go
od
s S
old
A.
B.
C.
D.
E.
F.
G.
H.
46 Name Chapter 2
© 2018 Cengage Learning®. May not be scanned, copied or duplicated, or posted to a publicly accessible website, in whole or in part.
PROBLEM 2-4 ___, Concluded
2.

Name Chapter 2 47
© 2018 Cengage Learning®. May not be scanned, copied or duplicated, or posted to a publicly accessible website, in whole or in part.
PROBLEM 2-5 ___
1.
Income Statement
Supporting calculations:

48 Name Chapter 2
© 2018 Cengage Learning®. May not be scanned, copied or duplicated, or posted to a publicly accessible website, in whole or in part.
PROBLEM 2-5 ___, Concluded
2.
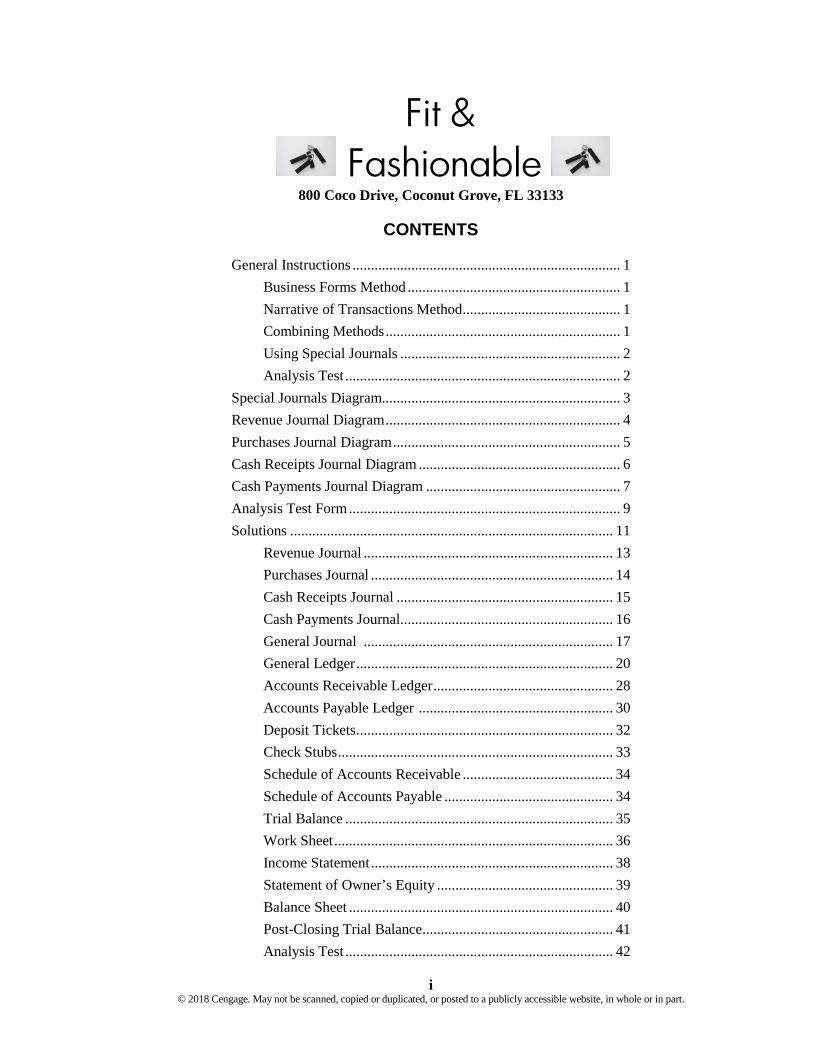
i © 2018 Cengage. May not be scanned, copied or duplicated, or posted to a publicly accessible website, in whole or in part.
Fit & Fashionable
800 Coco Drive, Coconut Grove, FL 33133
CONTENTS
General Instructions ......................................................................... 1 Business Forms Method .......................................................... 1 Narrative of Transactions Method ........................................... 1 Combining Methods ................................................................ 1 Using Special Journals ............................................................ 2 Analysis Test ........................................................................... 2 Special Journals Diagram................................................................. 3 Revenue Journal Diagram ................................................................ 4 Purchases Journal Diagram .............................................................. 5 Cash Receipts Journal Diagram ....................................................... 6 Cash Payments Journal Diagram ..................................................... 7 Analysis Test Form .......................................................................... 9 Solutions ........................................................................................ 11 Revenue Journal .................................................................... 13 Purchases Journal .................................................................. 14 Cash Receipts Journal ........................................................... 15 Cash Payments Journal .......................................................... 16 General Journal .................................................................... 17 General Ledger ...................................................................... 20 Accounts Receivable Ledger ................................................. 28 Accounts Payable Ledger ..................................................... 30 Deposit Tickets ...................................................................... 32 Check Stubs ........................................................................... 33 Schedule of Accounts Receivable ......................................... 34 Schedule of Accounts Payable .............................................. 34 Trial Balance ......................................................................... 35 Work Sheet ............................................................................ 36 Income Statement .................................................................. 38 Statement of Owner’s Equity ................................................ 39 Balance Sheet ........................................................................ 40 Post-Closing Trial Balance .................................................... 41 Analysis Test ......................................................................... 42


1 © 2018 Cengage. May not be scanned, copied or duplicated, or posted to a publicly accessible website, in whole or in part.
Fit & Fashionable
800 Coco Drive, Coconut Grove, FL 33133
INSTRUCTOR’S GUIDE There are two options for using this practice set:
1. Business Forms 2. Narrative of Transactions
Either option or a combination of both options may be used. If you specify that only the business forms be used, you may ask students to hand in the Narrative of Transactions pages from Booklet 3 before they begin the practice set.
Business Forms Method
The Business Forms approach requires the student to analyze various business documents and decide how to enter the transactions in the journal. There are seven types of business forms:
1. Vendor Invoices for Purchases 2. Sales Invoices 3. Credit Memos 4. Checks from Customers 5. Interoffice Memos 6. Bank Deposit Slips 7. Checkbook
The documents are presented in Booklet 3 in order of occurrence, numbered 1 through 61. Some documents have accompanying notes to assist the student in analyzing how to record the transactions.
Narrative of Transactions Method
Using the Narrative of Transactions approach requires the student to enter each business transaction using the same method as the problems presented in the text. Each transaction is listed in order by date with all necessary information given in narrative form. The student analyzes the information given in each transaction and enters it in the appropriate journal.
Combining Methods
Since there are advantages to both methods, using both may be desirable. In this approach, students could use the business forms as the primary source of information and use the Narrative of Transactions to support the accuracy of their entries. This would allow students to experience the paper flow of a business and provide some assurance that entries contain the appropriate amounts.

2 © 2018 Cengage. May not be scanned, copied or duplicated, or posted to a publicly accessible website, in whole or in part.
Using Special Journals
This practice set utilizes special journals to record the daily transactions of the business. The journals are similar to those presented in the special journals online appendix to the text; however, they contain additional columns to accommodate entries for a merchandising operation, such as Cost of Goods Sold and Inventory. There are five types of journals contained in the practice set:
1. Revenue Journal (also called a Sales Journal) 2. Purchases Journal 3. Cash Payments Journal 4. Cash Receipts Journal 5. General (two-column) Journal
Pages 3 through 7 of this guide provide diagrams of the overall process of using these journals in a merchandising enterprise. Pages 4 through 7 diagram each type of special journal. These can be made into transparencies, if desired, and used to help guide the students through the various types of transactions contained in the set.
Analysis Test
A form for recording amounts in the practice set is also included on page 9 of this guide. This form may be copied and distributed to students, and you may instruct students to hand in a completed form with their completed set.

3 © 2018 Cengage. May not be scanned, copied or duplicated, or posted to a publicly accessible website, in whole or in part.
Post
Colum
n Tota
ls to
Gene
ral L
edge
r
Cash
Rec
eipts
Acco
unts
Rece
ivable
Ca
sh S
ales
Othe
r Rev
enue

4 © 2018 Cengage. May not be scanned, copied or duplicated, or posted to a publicly accessible website, in whole or in part.
Ente
r Inv
oice
Tot
al N
et o
f D
isco
unt i
n Sa
les
Jour
nal
Ent
er In
voic
e To
tal N
et o
f D
isco
unt i
n R
even
ue J
ourn
al
Ent
er C
ost o
f Mer
chan
dise
S
old
Tota
l in
Rev
enue
Jou
rnal
Rev
enue
Jou
rnal
Enter
Cos
t of G
oods
Sold
To
tal in
Rev
enue
Jour
nal
Inven
tory C
redit
Co
st of
Good
s Sold
De
bit

5 © 2018 Cengage. May not be scanned, copied or duplicated, or posted to a publicly accessible website, in whole or in part.
Inven
tory P
urch
ases
Inv
entor
y De
bit C
olumn

6 © 2018 Cengage. May not be scanned, copied or duplicated, or posted to a publicly accessible website, in whole or in part.
Ente
r Che
ck T
otal
in Ca
sh
Debit
Colu
mn
Ent
er C
heck
Tot
al
in A
ccou
nts
Rec
eiva
ble
Cre
dit C
olum
n
Enter
Cos
t of M
erch
. in
Cost
of Go
ods S
old
Debit
Colu
mn/In
vento
ry Cr
edit C
olumn

7 © 2018 Cengage. May not be scanned, copied or duplicated, or posted to a publicly accessible website, in whole or in part.
Ente
r Am
ount
of
Che
ck in
C
ash
Cre
dit
Col
umn


9 © 2018 Cengage. May not be scanned, copied or duplicated, or posted to a publicly accessible website, in whole or in part.
1. Total Merchandise Purchases during April $2. Total Cash Sales during April $3. Total Sales on Account for April $4. Total Accounts Payable Credits during April $
5. All Access Fitness Center Balance on April 30 $6. Miami Health Club Balance on April 30 $
7. Alexus Fitness Connection Balance on April 30 $8. Sports Magic Warehouse Balance on April 30 $
9. Sales $10. Cost of Goods Sold $11. Gross Profit $12. Total Operating Expenses $13. Net Income $
14. Change in Owner’s Equity $15. Ending Balance of Owner’s Equity, April 30 $
16. Total Current Assets $17. Total Property, Plant, and Equipment $18. Total Current Liabilities $
19. Adjustment to Office Supplies $20. Adjustment to Prepaid Insurance $21. Adjustment to Unearned Rent $22. Adjustment for Inventory Shrinkage $
23. Amount Closed to Capital from Income Summary $24. Post-Closing Trial Balance Total $25. Amount Closed from Drawing to Capital $
ANALYSIS TEST
Fit & Fashionable
Closing
Adjustments
Balance Sheet
Statement of Owner’s Equity
Income Statement
Accounts Payable Ledger
Accounts Receivable Ledger
Journals

10 © 2018 Cengage. May not be scanned, copied or duplicated, or posted to a publicly accessible website, in whole or in part.

© 2018 Cengage. May not be scanned, copied or duplicated, or posted to a publicly accessible website, in whole or in part.
S O L U T I O N S


13 © 2018 Cengage. May not be scanned, copied or duplicated, or posted to a publicly accessible website, in whole or in part.
PAGE 2ACCOUNTS
RECEIVABLE DEBITCOST OF GOODS
SOLD DEBITSALES CREDIT INVENTORY CREDIT
1 20Y8 1
2 April 1 301 Miami Health Club 5,301.60 3,864.00 2
3 3 302 All Access Fitness Center 9,364.29 6,825.00 3
4 5 303 Westwood Boxing Gym 27,306.48 19,903.68 4
5 8 304 The Sun Set Recreation Center 21,756.88 15,858.00 5
6 10 305 Rockdale Gym 13,373.86 9,412.00 6
7 16 306 Miami Health Club 5,649.80 4,115.20 7
8 23 307 All Access Fitness Center 13,770.64 10,040.00 8
9 25 308 Cory's Gym in the Grove 5,186.36 3,780.00 9
10 26 309 Body Excellence Fitness Club 3,789.17 2,640.00 10
11 30 105,499.08 76,437.88 11
12 (1112) (4100) (5100) (1114) 12
REVENUE JOURNAL
DATE INV.NO. ACCOUNT DEBITED POST.
REF.

14 © 2018 Cengage. May not be scanned, copied or duplicated, or posted to a publicly accessible website, in whole or in part.
POST
. RE
F.PO
ST.
REF.
120
Y81
2Ap
ril1
Alex
us F
itnes
s C
orpo
ratio
n
2
35
Spor
ts M
agic
War
ehou
se
3
48
Fit &
Fab
Hea
lth P
rodu
cts
4
59
Fizz
y-C
al N
etwo
rk
5
616
Alex
us F
itnes
s C
orpo
ratio
n
5290
6
717
Spor
ts M
agic
War
ehou
se
7
820
Fizz
y-C
al N
etwo
rk
8
922
Hea
rtFit
Ente
rpris
es
9
1022
Fizz
y-C
al N
etwo
rk
10
1124
Spor
ts M
agic
War
ehou
se
11
1230
12
1313
675.
00(
)2,
275.
00(1
117)
675
(111
5)
1,80
0.00
250.
00
225.
00
9,18
0.00
16,9
00.0
05,
125.
00
10,8
00.0
02,
400.
0012
5,91
5.15
5,35
0.00
10,8
00.0
02,
400.
0012
8,86
5.15
(210
0)
13,8
65.0
049
,519
.75
5,12
5.40
9,60
0.00
13,8
65.0
049
,519
.75
5,12
5.40
11,4
00.0
010
,105
.00
16,9
00.0
0M
isce
llane
ous
Sellin
g Ex
pens
e
OTH
ER A
CCO
UNTS
DEB
IT
ACCO
UNT
DEBI
TED
AMO
UNT
3,40
0.00
3,40
0.00
PURC
HASE
S JO
URNA
LPA
GE
2
DATE
ACCO
UNT
CRED
ITED
ACCO
UNTS
PAY
ABLE
CRED
ITIN
VENT
ORY
DEBI
TST
ORE
SUP
PLIE
S DE
BIT

15 © 2018 Cengage. May not be scanned, copied or duplicated, or posted to a publicly accessible website, in whole or in part.
PA
GE
120
Y81
2Ap
ril2
Body
Exc
elle
nce
Fitn
ess
Clu
b
2
33
Cor
y's G
ym in
the
Gro
ve
3
44
The
Sun
Set R
ecre
atio
n C
ente
r
4
56
Cas
h Sa
les
5
68
Wes
twoo
d Bo
Gym
6
78
Pine
Bay
Fitn
ess
Clu
b
7
811
Stor
e Su
pplie
s11
178
911
Mia
mi H
ealth
Clu
b
9
1012
All A
cces
s Fi
tnes
s C
ente
r
10
1113
Cas
h Sa
les
11
1215
Wes
twoo
d Bo
Gym
12
1318
The
Sun
Set R
ecre
atio
n C
ente
r
13
1419
Roc
kdal
e G
ym
14
1520
Cas
h Sa
les
15
1630
Not
es R
ecei
vabl
e11
1116
17In
tere
st R
even
ue61
0017
1830
Cas
h Sa
les
18
1930
19
2020
SA
LES
CR
ED
ITA
CC
OU
NTS
RE
CE
IVA
BLE
CR
ED
ITC
AS
HD
EB
IT
CAS
H R
ECEI
PTS
JOU
RN
AL2
DA
TEA
CC
OU
NT
PO
ST.
R
EF.
OTH
ER
A
CC
OU
NTS
C
RE
DIT
18,0
24.0
0
CO
ST
OF
GO
OD
SS
OLD
DE
BIT
INV
EN
TOR
Y C
RE
DIT
300.
00
3,36
0.00
()
60.0
0
(111
4) (5
100)
3,00
0.00
19,2
92.8
0
26,6
00.0
0
19,0
99.2
081
,326
.80
24,9
10.8
0
27,0
20.0
0
36,1
20.0
0
14,4
06.0
012
,348
.00
6,17
4.00
8,23
2.00
10,9
76.0
0 5,
301.
609,
364.
29
(410
0)
28,2
80.0
011
8,02
0.00
128,
415.
91(1
112)27,3
06.4
820
,933
.68
13,3
73.8
6
8,23
2.00
10,9
76.0
030
0.00
5,30
1.60
9,36
4.29
14,4
06.0
012
,348
.00
6,17
4.00
26,6
00.0
0
249,
795.
91(1
110)28,2
80.0
0
3,06
0.00
36,1
20.0
027
,306
.48
20,9
33.6
813
,373
.86
27,0
20.0
0

16 © 2018 Cengage. May not be scanned, copied or duplicated, or posted to a publicly accessible website, in whole or in part.
PA
GE
CK
. N
O.
120
Y81
2Ap
ril1
2201
Alex
us F
itnes
s C
onne
ctio
n
2
32
2202
Prep
aid
Insu
ranc
e11
183
43
2203
Fizz
y-C
al N
etw
ork
4
54
2204
Hea
rtFit
Ente
rpris
es
5
610
2205
Mis
cella
neou
s Se
lling
Expe
nse
5290
6
713
2206
Sale
s Sa
larie
s Ex
pens
e52
007
8O
ffice
Sal
arie
s Ex
pens
e53
008
917
2207
Mar
ty C
have
z, D
raw
ing
3110
9
1017
2208
Adve
rtisi
ng E
xpen
se52
1010
1118
2209
Fit &
Fab
Hea
lth P
rodu
cts
11
1218
2210
Mus
cles
Rx D
istri
buto
rs
12
1318
2211
Adve
rtisi
ng E
xpen
se52
1013
1420
2212
Mis
cella
neou
s Se
lling
Expe
nse
5290
14
1524
2213
Mis
cella
neou
s Ad
min
istra
tive
Expe
nse
5390
15
1626
2214
Sale
s Sa
larie
s Ex
pens
e52
0016
17O
ffice
Sal
arie
s Ex
pens
e53
0017
1827
2215
Mis
cella
neou
s Ad
min
istra
tive
Expe
nse
5390
18
1927
2216
Alex
us F
itnes
s C
onne
ctio
n
19
2027
2217
Mar
ty C
have
z, D
raw
ing
3110
20
2129
2218
Mis
cella
neou
s Ad
min
istra
tive
Expe
nse
5390
21
22M
isce
llane
ous
Sellin
g Ex
pens
e52
9022
2329
2219
Mis
cella
neou
s Ad
min
istra
tive
Expe
nse
5390
23
2430
2220
Inte
rest
Exp
ense
7100
24
2530
25
2626
612.
0036
0.00
13,0
00.0
0
700.
0018
7,81
2.70
(111
0)
2 340.
0013
,865
.00
2,50
0.00
441.
004,
267.
9053
,200
.00
185.
0023
1.00
287.
00
14,0
00.0
0
53,2
00.0
0
175.
00
13,0
00.0
04,
200.
00
146,
081.
70(2
100)13,8
65.0
0
4,26
7.90
700.
0041
,731
.00
()
14,2
68.8
0
46,4
80.0
014
,000
.00
340.
00
2,50
0.00
204.
0040
8.00
360.
00
185.
0023
1.00
287.
008,
000.
005,
000.
00
175.
008,
000.
005,
000.
004,
200.
0044
1.00
CA
SH
CR
ED
IT
5,70
0.00
14,2
68.8
05,
700.
0046
,480
.00
CAS
H P
AYM
ENTS
JO
UR
NAL
DA
TEA
CC
OU
NT
DE
BIT
ED
PO
ST.
R
EF.
OTH
ER
A
CC
OU
NTS
D
EB
IT
AC
CO
UN
TS
PA
YA
BLE
D
EB
IT
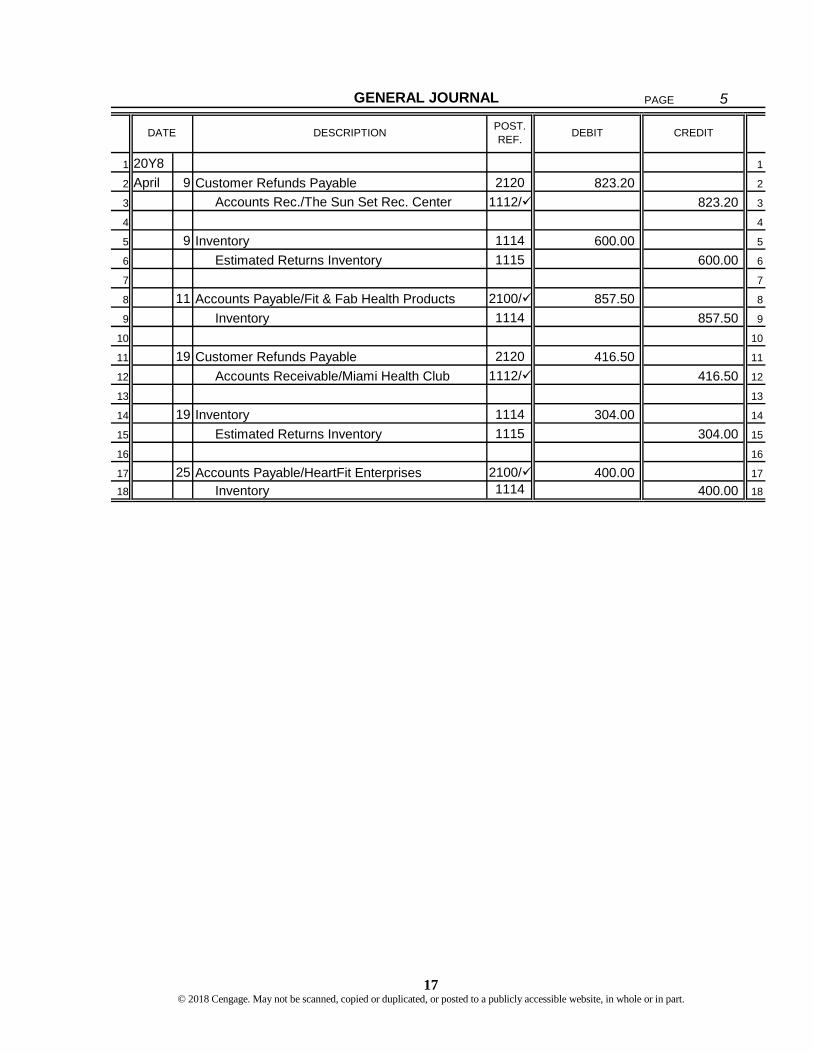
17 © 2018 Cengage. May not be scanned, copied or duplicated, or posted to a publicly accessible website, in whole or in part.
PAGE 5
1 20Y8 1
2 April 9 Customer Refunds Payable 2120 823.20 2
3 Accounts Rec./The Sun Set Rec. Center 1112/ 823.20 3
4 4
5 9 Inventory 1114 600.00 5
6 Estimated Returns Inventory 1115 600.00 6
7 7
8 11 Accounts Payable/Fit & Fab Health Products 2100/ 857.50 8
9 Inventory 1114 857.50 9
10 10
11 19 Customer Refunds Payable 2120 416.50 11
12 Accounts Receivable/Miami Health Club 1112/ 416.50 12
13 13
14 19 Inventory 1114 304.00 14
15 Estimated Returns Inventory 1115 304.00 15
16 16
17 25 Accounts Payable/HeartFit Enterprises 2100/ 400.00 17
18 Inventory 1114 400.00 18
CREDITDATE DESCRIPTION DEBITPOST. REF.
GENERAL JOURNAL

18 © 2018 Cengage. May not be scanned, copied or duplicated, or posted to a publicly accessible website, in whole or in part.
PAGE 6
1 20Y8 1
2 April 30 Cost of Goods Sold 5100 142.22 2
3 Inventory 1114 142.22 3
4 4
5 30 Office Supplies Expense 5340 500.00 5
6 Office Supplies 1116 500.00 6
7 7
8 30 Store Supplies Expense 5220 650.00 8
9 Store Supplies 1117 650.00 9
10 10
11 30 Insurance Expense 5330 475.00 11
12 Prepaid Insurance 1118 475.00 12
13 13
14 30 Depreciation Expense—Equipment 5320 1,250.00 14
15 Accumulated Depreciation—Equipment 1125 1,250.00 15
16 16
17 30 Depreciation Expense—Building 5350 2,475.00 17
18 Accumulated Depreciation—Building 1123 2,475.00 18
19 19
20 30 Interest Receivable 1113 30.00 20
21 Interest Revenue 6100 30.00 21
22 22
23 30 Sales Salaries Expense 5200 1,200.00 23
24 Office Salaries Expense 5300 500.00 24
25 Salaries Payable 2110 1,700.00 25
26 26
27 30 Sales 4100 4,470.00 27
28 Customer Refunds Payable 2120 4,470.00 28
29 29
30 30 Estimated Returns Inventory 1115 3,190.00 30
31 Cost of Goods Sold 5100 3,190.00 31
32 32
33 33
34 34
35 35
GENERAL JOURNAL
Adjusting Entries
CREDITDATE DESCRIPTION DEBITPOST. REF.

19 © 2018 Cengage. May not be scanned, copied or duplicated, or posted to a publicly accessible website, in whole or in part.
PAGE 7
1 20Y8 1
2 Apr. 30 Sales 4100 219,049.08 2
3 Interest Revenue 6100 90.00 3
4 Income Summary 3120 219,139.08 4
5 5
6 30 Income Summary 3120 191,772.90 6
7 Cost of Goods Sold 5100 154,716.90 7
8 Sales Salaries Expense 5200 17,200.00 8
9 Advertising Expense 5210 626.00 9
10 Store Supplies Expense 5220 650.00 10
11 Miscellaneous Selling Expense 5290 1,489.00 11
12 Office Salaries Expense 5300 10,500.00 12
13 Depreciation Expense—Equipment 5320 1,250.00 13
14 Insurance Expense 5330 475.00 14
15 Office Supplies Expense 5340 500.00 15
16 Depreciation Expense—Building 5350 2,475.00 16
17 Miscellaneous Administrative Expense 5390 1,191.00 17
18 Interest Expense 7100 700.00 18
19 19
20 30 Income Summary 3120 27,366.18 20
21 Marty Chavez, Capital 3100 27,366.18 21
22 22
23 30 Marty Chavez, Capital 3100 6,700.00 23
24 Marty Chavez, Drawing 3110 6,700.00 24
25 25
26 26
27 27
28 28
GENERAL JOURNAL
Closing Entries
CREDITDATE DESCRIPTION DEBITPOST. REF.

20 © 2018 Cengage. May not be scanned, copied or duplicated, or posted to a publicly accessible website, in whole or in part.
ACCOUNT Cash ACCOUNT NO. 1110
DEBIT CREDIT
20Y8Apr. 1 Balance 84,147.80
30 CR2 249,795.91 333,943.7130 CP2 187,812.70 146,131.01
ACCOUNT Notes Receivable ACCOUNT NO. 1111
DEBIT CREDIT
20Y8Apr. 1 Balance 9,800.00
30 CR2 3,000.00 6,800.00
ACCOUNT Accounts Receivable ACCOUNT NO. 1112
DEBIT CREDIT
20Y8Apr. 1 Balance 52,136.00
9 J5 823.20 51,312.8019 J5 416.50 50,896.3030 R2 105,499.08 156,395.3830 CR2 128,415.91 27,979.47
ACCOUNT Interest Receivable ACCOUNT NO. 1113
DEBIT CREDIT
20Y8Apr. 30 Adjusting J6 30.00 30.00
ITEM DEBITBALANCE
CREDITBALANCE
CREDITBALANCE
ITEM
GENERAL LEDGER
POST. REF.
CREDITBALANCE
DATE ITEM POST. REF. DEBIT
CREDITDATE
DATE ITEM POST. REF. DEBIT
POST. REF. DEBITDATE

21 © 2018 Cengage. May not be scanned, copied or duplicated, or posted to a publicly accessible website, in whole or in part.
ACCOUNT Inventory ACCOUNT NO. 1114
DEBIT CREDIT
20Y8Apr. 1 Balance 240,900.00
9 J5 600.00 241,500.0011 J5 857.50 240,642.5019 J5 304.00 240,946.5025 J5 400.00 240,546.5030 R2 76,437.88 164,108.6230 P2 125,915.15 290,023.7730 CR2 81,326.80 208,696.9730 Adjusting J6 142.22 208,554.75
ACCOUNT Estimated Returns Inventory ACCOUNT NO. 1115
DEBIT CREDIT
20Y8Apr. 1 Balance 2,357.00
9 J5 600.00 1,757.0019 J5 304.00 1,453.0030 Adjusting J6 3,190.00 4,643.00
ACCOUNT Office Supplies ACCOUNT NO. 1116
DEBIT CREDIT
20Y8Apr. 1 Balance 2,100.00
30 Adjusting J6 500.00 1,600.00
ACCOUNT Store Supplies ACCOUNT NO. 1117
DEBIT CREDIT
20Y8Apr. 1 Balance 1,680.00
11 CR2 300.00 1,380.0030 P2 2,275.00 3,655.0030 Adjusting J6 650.00 3,005.00
DATE
DATE
ITEM POST. REF. DEBIT
ITEM DEBIT
CREDITDATE ITEM DEBIT
DATE ITEM CREDITBALANCE
BALANCEPOST. REF.
BALANCECREDIT
CREDITBALANCE
POST. REF. DEBIT
POST. REF.

22 © 2018 Cengage. May not be scanned, copied or duplicated, or posted to a publicly accessible website, in whole or in part.
ACCOUNT Prepaid Insurance ACCOUNT NO. 1118
DEBIT CREDIT
20Y8Apr. 2 CP2 5,700.00 5,700.00
30 Adjusting J6 475.00 5,225.00
ACCOUNT Land ACCOUNT NO. 1120
DEBIT CREDIT
20Y8Apr. 1 Balance 210,000.00
ACCOUNT Building ACCOUNT NO. 1122
DEBIT CREDIT
20Y8Apr. 1 Balance 439,000.00
ACCOUNT Accumulated Depreciation—Building ACCOUNT NO. 1123
DEBIT CREDIT
20Y8Apr. 1 Balance 140,200.00
30 Adjusting J6 2,475.00 142,675.00
ACCOUNT Equipment ACCOUNT NO. 1124
DEBIT CREDIT
20Y8Apr. 1 Balance 98,350.00
ACCOUNT Accumulated Depreciation—Equipment ACCOUNT NO. 1125
DEBIT CREDIT
20Y8Apr. 1 Balance 34,540.00
30 Adjusting J6 1,250.00 35,790.00
CREDITBALANCE
DEBIT CREDITBALANCE
ITEM POST. REF. DEBIT
DATE ITEM POST. REF. DEBIT
ITEM
DATE
CREDITBALANCE
DATE
CREDIT
POST. REF. DEBIT
BALANCE
DATE ITEM POST. REF.
DATE ITEM POST. REF. DEBIT CREDIT
BALANCE
DATE ITEM POST. REF. DEBIT CREDIT
BALANCE

23 © 2018 Cengage. May not be scanned, copied or duplicated, or posted to a publicly accessible website, in whole or in part.
ACCOUNT Accounts Payable ACCOUNT NO. 2100
DEBIT CREDIT
20Y8Apr. 1 Balance 127,948.80
11 J5 857.50 127,091.3025 J5 400.00 126,691.3030 P2 128,865.15 255,556.4530 CP2 146,081.70 109,474.75
ACCOUNT Salaries Payable ACCOUNT NO. 2110
DEBIT CREDIT
20Y8Apr. 30 Adjusting J6 1,700.00 1,700.00
ACCOUNT Customer Refunds Payable ACCOUNT NO. 2120
DEBIT CREDIT
20Y8Apr. 1 Balance 3,300.00
9 J5 823.20 2,476.8019 J5 416.50 2,060.3030 Adjusting J6 4,470.00 6,530.30
ACCOUNT Notes Payable ACCOUNT NO. 2150
DEBIT CREDIT
20Y8Apr. 1 Balance 168,000.00
ACCOUNT Marty Chavez, Capital ACCOUNT NO. 3100
DEBIT CREDIT
20Y8Apr. 1 Balance 666,482.00
30 Closing J7 27,366.18 693,848.1830 Closing J7 6,700.00 687,148.18
CREDITBALANCE
DATE ITEM POST. REF. DEBIT
DATE ITEM POST. REF. DEBIT CREDIT
BALANCE
CREDITBALANCE
CREDITBALANCE
DATE ITEM POST. REF. DEBIT
CREDITBALANCE
DATE ITEM POST. REF.
DATE ITEM POST. REF. DEBIT
DEBIT

24 © 2018 Cengage. May not be scanned, copied or duplicated, or posted to a publicly accessible website, in whole or in part.
ACCOUNT Marty Chavez, Drawing ACCOUNT NO. 3110
DEBIT CREDIT
20Y8Apr. 17 CP2 4,200.00 4,200.00
27 CP2 2,500.00 6,700.0030 Closing J7 6,700.00 — —
ACCOUNT Income Summary ACCOUNT NO. 3120
DEBIT CREDIT
20Y8Apr. 30 Closing J7 219,139.08 219,139.08
30 Closing J7 191,772.90 27,366.1830 Closing J7 27,366.18 — —
ACCOUNT Sales ACCOUNT NO. 4100
DEBIT CREDIT
20Y8Apr. 30 R2 105,499.08 105,499.08
30 CR2 118,020.00 223,519.0830 Adjusting J6 4,470.00 219,049.0830 Closing J7 219,049.08 — —
ACCOUNT Cost of Goods Sold ACCOUNT NO. 5100
DEBIT CREDIT20Y8Apr. 30 R2 76,437.88 76,437.88
30 CR2 81,326.80 157,764.6830 Adjusting J6 142.22 157,906.9030 Adjusting J6 3,190.00 154,716.9030 Closing J7 154,716.90 — —
BALANCE
DATEBALANCE
ITEM POST. REF. DEBIT
ITEM POST. REF. DEBIT CREDIT
DATE ITEM POST. REF. DEBIT
BALANCE
DATE ITEM POST. REF. DEBIT CREDIT
BALANCE
CREDIT
CREDIT
DATE

25 © 2018 Cengage. May not be scanned, copied or duplicated, or posted to a publicly accessible website, in whole or in part.
ACCOUNT Sales Salaries Expense ACCOUNT NO. 5200
DEBIT CREDIT
20Y8Apr. 13 CP2 8,000.00 8,000.00
26 CP2 8,000.00 16,000.0030 Adjusting J6 1,200.00 17,200.0030 Closing J7 17,200.00 — —
ACCOUNT Advertising Expense ACCOUNT NO. 5210
DEBIT CREDIT
20Y8Apr. 17 CP2 441.00 441.00
18 CP2 185.00 626.0030 Closing J7 626.00 — —
ACCOUNT Store Supplies Expense ACCOUNT NO. 5220
DEBIT CREDIT
20Y8Apr. 30 Adjusting J6 650.00 650.00
30 Closing J7 650.00 — —
ACCOUNT Miscellaneous Selling Expense ACCOUNT NO. 5290
DEBIT CREDIT20Y8Apr. 10 CP2 175.00 175.00
16 P2 675.00 850.0020 CP2 231.00 1,081.0029 CP2 408.00 1,489.0030 Closing J7 1,489.00 — —
POST. REF. DEBIT
BALANCE
BALANCECREDIT
CREDIT
CREDITBALANCE
DATE
DEBIT
DATE
DATE ITEM POST. REF.
ITEM POST. REF. DEBIT
ITEM
CREDITBALANCE
DATE ITEM POST. REF. DEBIT

26 © 2018 Cengage. May not be scanned, copied or duplicated, or posted to a publicly accessible website, in whole or in part.
ACCOUNT Office Salaries Expense ACCOUNT NO. 5300
DEBIT CREDIT
20Y8Apr. 13 CP2 5,000.00 5,000.00
26 CP2 5,000.00 10,000.0030 Adjusting J6 500.00 10,500.0030 Closing J7 10,500.00 — —
ACCOUNT Depreciation Expense—Equipment ACCOUNT NO. 5320
DEBIT CREDIT
20Y8Apr. 30 Adjusting J6 1,250.00 1,250.00
Closing J7 1,250.00 — —
ACCOUNT Insurance Expense ACCOUNT NO. 5330
DEBIT CREDIT
20Y8Apr. 30 Adjusting J6 475.00 475.00
30 Closing J7 475.00 — —
ACCOUNT Office Supplies Expense ACCOUNT NO. 5340
DEBIT CREDIT
20Y8Apr. 30 Adjusting J6 500.00 500.00
30 Closing J7 500.00 — —
CREDITBALANCE
DEBIT
DATE ITEM POST. REF. DEBIT
BALANCEDATE ITEM POST.
REF.
DATE ITEM POST. REF.
CREDIT
CREDITBALANCE
DATE
DEBIT CREDITBALANCE
ITEM POST. REF. DEBIT

27 © 2018 Cengage. May not be scanned, copied or duplicated, or posted to a publicly accessible website, in whole or in part.
ACCOUNT Depreciation Expense—Building ACCOUNT NO. 5350
DEBIT CREDIT
20Y8Apr. 30 Adjusting J6 2,475.00 2,475.00
30 Closing J7 2,475.00 — —
ACCOUNT Miscellaneous Administrative Expense ACCOUNT NO. 5390
DEBIT CREDIT
20Y8Apr. 24 CP2 287.00 287.00
27 CP2 340.00 627.0029 CP2 204.00 831.0029 CP2 360.00 1,191.0030 Closing J7 1,191.00 — —
ACCOUNT Interest Revenue ACCOUNT NO. 6100
DEBIT CREDIT
20Y8Apr. 30 CR2 60.00 60.00
30 Adjusting J6 30.00 90.0030 Closing J7 90.00 — —
ACCOUNT Interest Expense ACCOUNT NO. 7100
DEBIT CREDIT
20Y8Apr. 30 CP2 700.00 700.00
30 Closing J7 700.00 — —
DATE ITEM DEBITBALANCE
DEBITDATE CREDIT
BALANCECREDIT
POST. REF.
ITEM POST. REF.
BALANCE
CREDIT
DEBITBALANCE
DEBIT
DATE ITEM POST. REF. CREDIT
DATE ITEM POST. REF.

28 © 2018 Cengage. May not be scanned, copied or duplicated, or posted to a publicly accessible website, in whole or in part.
NAME All Access Fitness CenterADDRESS 1 South Park Blvd., South Miami, FL 33143
20Y8Apr. 3 R2 9,364.29 9,364.29
12 CR2 9,364.29 — 23 R2 13,770.64 13,770.64
NAME Body Excellence Fitness ClubADDRESS 9 Key Biscayne Ave., Suite 100, Key Biscayne, FL 33149
20Y8Apr. 1 Balance 14,406.00
2 CR2 14,406.00 — 26 R2 3,789.17 3,789.17
NAME Cory's Gym in the GroveADDRESS 20 Main Highway, Coconut Grove, FL 33133
20Y8Apr. 1 Balance 12,348.00
3 CR2 12,348.00 — 25 R2 5,186.36 5,186.36
NAME Miami Health ClubADDRESS 8050 SW 8th Street, Miami, FL 33130
20Y8Apr. 1 R2 5,301.60 5,301.60
11 CR2 5,301.60 — 16 R2 5,649.80 5,649.8019 J5 416.50 5,233.30
DATE ITEM POST. REF. DEBIT CREDIT BALANCE
DATE ITEM POST. REF. DEBIT CREDIT BALANCE
DATE ITEM POST. REF. DEBIT CREDIT BALANCE
ACCOUNTS RECEIVABLE LEDGER
POST. REF. BALANCEITEM CREDITDATE DEBIT

29 © 2018 Cengage. May not be scanned, copied or duplicated, or posted to a publicly accessible website, in whole or in part.
NAME Pine Bay Fitness ClubADDRESS 8 SW 57th Ave., Miami, FL 33156
20Y8Apr. 1 Balance 10,976.00
8 CR2 10,976.00 —
NAME Rockdale GymADDRESS 162 S. Dixie Hwy., Rockdale, FL 33157
20Y8Apr. 10 R2 13,373.86 13,373.86
26 CR2 13,373.86 —
NAME The Sun Set Recreation CenterADDRESS 50 Snapper Creek Dr., Sunset, FL 33173
20Y8Apr. 1 Balance 6,174.00
4 CR2 6,174.00 — 8 R2 21,756.88 21,756.889 J5 823.20 20,933.68
18 CR2 20,933.68 —
NAME Westwood Boxing GymADDRESS 50 Westwood Lake Dr., Miami, FL 33165
20Y8Apr. 1 Balance 8,232.00
11 R2 27,306.48 35,538.4816 CR2 8,232.00 27,306.4819 CR2 27,306.48 —
POST. REF. BALANCEITEM CREDITDATE DEBIT
DATE ITEM POST. REF. DEBIT CREDIT BALANCE
DATE ITEM POST. REF. DEBIT CREDIT BALANCE
DATE ITEM POST. REF. DEBIT CREDIT BALANCE

30 © 2018 Cengage. May not be scanned, copied or duplicated, or posted to a publicly accessible website, in whole or in part.
NAME Alexus Fitness ConnectionADDRESS 100 Coral Way, Miami, FL 33129
20Y8April 1 Balance 14,268.80
1 P2 13,865.00 28,133.801 CP2 14,268.80 13,865.00
16 P2 10,105.00 23,970.0027 CP2 13,865.00 10,105.00
NAME Fit & Fab Health ProductsADDRESS 15 Park Avenue, 115th Floor, New York, NY 10154
20Y8April 8 P2 5,125.40 5,125.40
11 J5 857.50 4,267.9018 CP2 4,267.90 —
NAME Fizzy-Cal NetworkADDRESS 45 Caribbean Avenue, Los Angeles, CA 90001
20Y8April 1 Balance 46,480.00
3 CP2 46,480.00 — 9 P2 11,400.00 11,400.00
20 P2 5,350.00 16,750.0022 P2 10,800.00 27,550.00
CREDITDATE DEBIT
ACCOUNTS PAYABLE LEDGER
POST. REF. BALANCEITEM
DATE ITEM POST. REF. DEBIT CREDIT BALANCE
DATE ITEM POST. REF. DEBIT CREDIT BALANCE

31 © 2018 Cengage. May not be scanned, copied or duplicated, or posted to a publicly accessible website, in whole or in part.
NAME HeartFit EnterprisesADDRESS 15 Brickell Ave. #150, Miami, FL 33129
20Y8April 1 Balance 14,000.00
4 CP2 14,000.00 — 22 P2 3,400.00 3,400.0025 J5 400.00 3,000.00
NAME Muscles R x DistributorsADDRESS 80 Commercial Blvd., Fort Lauderdale, FL 33310
20Y8April 1 Balance 53,200.00
18 CP2 53,200.00 —
NAME Sports Magic WarehouseADDRESS 246 Santa Monica Blvd., Santa Monica, CA 90403
20Y8April 5 P2 49,519.75 49,519.75
17 P2 16,900.00 66,419.7524 P2 2,400.00 68,819.75
ITEM
BALANCE
DATE
DATE ITEM POST. REF. DEBIT CREDIT BALANCE
BALANCEPOST. REF. DEBIT CREDIT
DATE ITEM POST. REF. DEBIT CREDIT

32 © 2018 Cengage. May not be scanned, copied or duplicated, or posted to a publicly accessible website, in whole or in part.
April 6CHECKS: Body Excellence Fitness Club 14,406.00
Cory's Gym in the Grove 12,348.00The Sun Set Recreation Center 6,174.00 TOTAL 32,928.00
April 13CHECKS: Westwood Boxing Gym 8,232.00
Pine Bay Fitness Club 10,976.00SupplyMax 300.00Miami Health Club 5,301.60All Access Fitness Center 9,364.29 TOTAL 34,173.89
April 20CHECKS: Westwood Boxing Gym 27,306.48
The Sun Set Recreation Center 20,933.68Rockdale Gym 13,373.86 TOTAL 61,614.02
April 30CHECKS: Blue Water Enterprises 3,060.00
TOTAL 3,060.00
DEPOSIT TICKETSFit & Fashionable

33 © 2018 Cengage. May not be scanned, copied or duplicated, or posted to a publicly accessible website, in whole or in part.
Check Number Date Check Amount Deposits Balance
84,147.802201 1 14,268.80 69,879.002202 2 5,700.00 64,179.002203 3 46,480.00 17,699.002204 4 14,000.00 3,699.00
6 26,600.00 30,299.00 6 32,928.00 63,227.00
2205 10 175.00 63,052.002206 13 13,000.00 50,052.00
13 36,120.00 86,172.0013 34,173.89 120,345.89
2207 17 4,200.00 116,145.892208 17 441.00 115,704.892209 18 4,267.90 111,436.992210 18 53,200.00 58,236.992211 18 185.00 58,051.992212 20 231.00 57,820.99
20 27,020.00 84,840.9920 61,614.02 146,455.01
2213 24 287.00 146,168.012214 26 13,000.00 133,168.012215 27 340.00 132,828.012216 27 13,865.00 118,963.012217 27 2,500.00 116,463.012218 29 612.00 115,851.012219 29 360.00 115,491.012220 30 700.00 114,791.01
30 28,280.00 143,071.0130 3,060.00 146,131.01
CHECK STUBS FOR APRILFit & Fashionable

34 © 2018 Cengage. May not be scanned, copied or duplicated, or posted to a publicly accessible website, in whole or in part.
All Access Fitness Center 13,770.64$ Body Excellence Fitness Club 3,789.17Cory's Gym in the Grove 5,186.36Miami Health Club 5,233.30
Total Accounts Receivable 27,979.47$
Alexus Fitness Connection 10,105.00$ Fizzy-Cal Network 27,550.00HeartFit Enterprises 3,000.00Sports Magic Warehouse 68,819.75
Total Accounts Payable 109,474.75$
Schedule of Accounts PayableApril 30, 20Y8
Schedule of Accounts ReceivableFit & Fashionable
April 30, 20Y8
Fit & Fashionable

35 © 2018 Cengage. May not be scanned, copied or duplicated, or posted to a publicly accessible website, in whole or in part.
ACCOUNT ACCT. NO. DEBIT BALANCES CREDIT BALANCES
Cash 1110 146,131.01Notes Receivable 1111 6,800.00Accounts Receivable 1112 27,979.47Interest Receivable 1113Inventory 1114 208,696.97Estimated Returns Inventory 1115 1,453.00Office Supplies 1116 2,100.00Store Supplies 1117 3,655.00Prepaid Insurance 1118 5,700.00Land 1120 210,000.00Building 1122 439,000.00Accumulated Depreciation—Building 1123 140,200.00Equipment 1124 98,350.00Accumulated Depreciation—Equipment 1125 34,540.00Accounts Payable 2100 109,474.75Salaries Payable 2110Customer Refunds Payable 2120 2,060.30Notes Payable 2150 168,000.00Marty Chavez, Capital 3100 666,482.00Marty Chavez, Drawing 3110 6,700.00Sales 4100 223,519.08Cost of Goods Sold 5100 157,764.68Sales Salaries Expense 5200 16,000.00Advertising Expense 5210 626.00Store Supplies Expense 5220Miscellaneous Selling Expense 5290 1,489.00Office Salaries Expense 5300 10,000.00Depreciation Expense—Equipment 5320Insurance Expense 5330Office Supplies Expense 5340Depreciation Expense—Building 5350Miscellaneous Administrative Expense 5390 1,191.00Interest Revenue 6100 60.00Interest Expense 7100 700.00
1,344,336.13 1,344,336.13
Fit & Fashionable
April 30, 20Y8Trial Balance (Preadjusting)
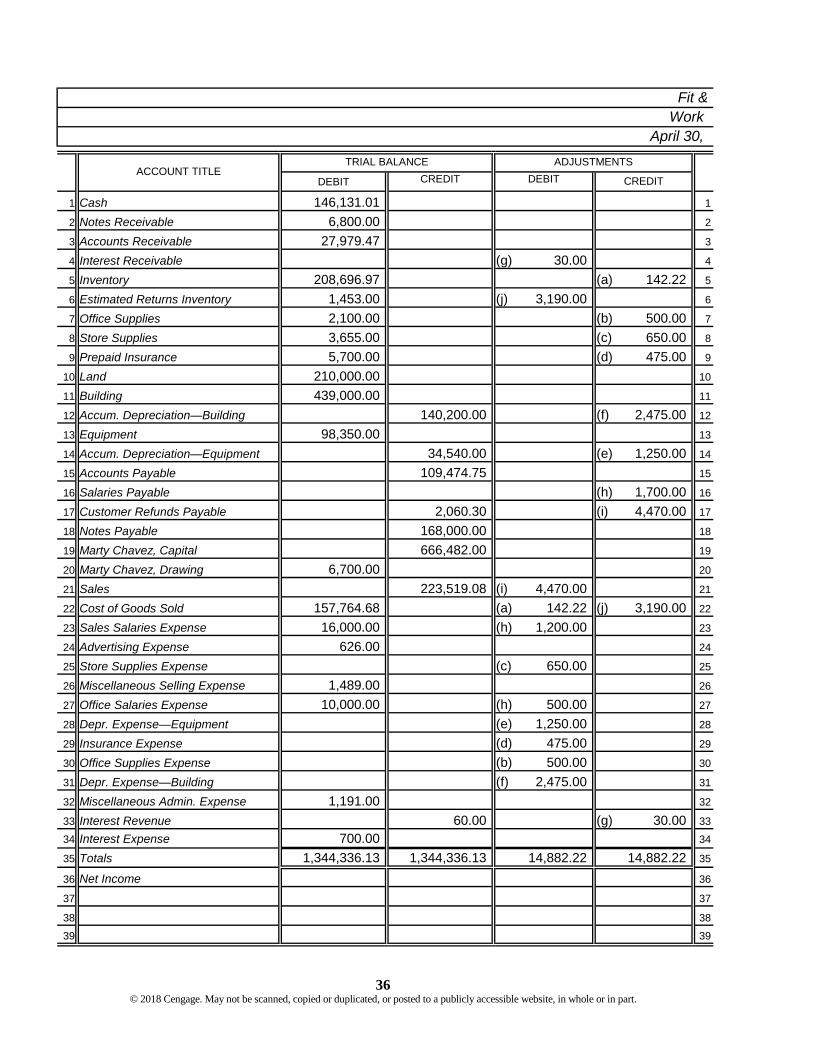
36 © 2018 Cengage. May not be scanned, copied or duplicated, or posted to a publicly accessible website, in whole or in part.
DEBIT CREDIT
1 Cash 146,131.01 1
2 Notes Receivable 6,800.00 2
3 Accounts Receivable 27,979.47 3
4 Interest Receivable (g) 30.00 4
5 Inventory 208,696.97 (a) 142.22 5
6 Estimated Returns Inventory 1,453.00 (j) 3,190.00 6
7 Office Supplies 2,100.00 (b) 500.00 7
8 Store Supplies 3,655.00 (c) 650.00 8
9 Prepaid Insurance 5,700.00 (d) 475.00 9
10 Land 210,000.00 10
11 Building 439,000.00 11
12 Accum. Depreciation—Building 140,200.00 (f) 2,475.00 12
13 Equipment 98,350.00 13
14 Accum. Depreciation—Equipment 34,540.00 (e) 1,250.00 14
15 Accounts Payable 109,474.75 15
16 Salaries Payable (h) 1,700.00 16
17 Customer Refunds Payable 2,060.30 (i) 4,470.00 17
18 Notes Payable 168,000.00 18
19 Marty Chavez, Capital 666,482.00 19
20 Marty Chavez, Drawing 6,700.00 20
21 Sales 223,519.08 (i) 4,470.00 21
22 Cost of Goods Sold 157,764.68 (a) 142.22 (j) 3,190.00 22
23 Sales Salaries Expense 16,000.00 (h) 1,200.00 23
24 Advertising Expense 626.00 24
25 Store Supplies Expense (c) 650.00 25
26 Miscellaneous Selling Expense 1,489.00 26
27 Office Salaries Expense 10,000.00 (h) 500.00 27
28 Depr. Expense—Equipment (e) 1,250.00 28
29 Insurance Expense (d) 475.00 29
30 Office Supplies Expense (b) 500.00 30
31 Depr. Expense—Building (f) 2,475.00 31
32 Miscellaneous Admin. Expense 1,191.00 32
33 Interest Revenue 60.00 (g) 30.00 33
34 Interest Expense 700.00 34
35 Totals 1,344,336.13 1,344,336.13 14,882.22 14,882.22 35
36 Net Income 36
37 37
38 38
39 39
Fit &Work
April 30,
DEBITADJUSTMENTS
CREDIT
TRIAL BALANCEACCOUNT TITLE

37 © 2018 Cengage. May not be scanned, copied or duplicated, or posted to a publicly accessible website, in whole or in part.
DEBIT CREDIT DEBIT CREDIT DEBIT CREDIT
1 146,131.01 146,131.01 1
2 6,800.00 6,800.00 2
3 27,979.47 27,979.47 3
4 30.00 30.00 4
5 208,554.75 208,554.75 5
6 4,643.00 4,643.00 6
7 1,600.00 1,600.00 7
8 3,005.00 3,005.00 8
9 5,225.00 5,225.00 9
10 210,000.00 210,000.00 10
11 439,000.00 439,000.00 11
12 142,675.00 142,675.00 12
13 98,350.00 98,350.00 13
14 35,790.00 35,790.00 14
15 109,474.75 109,474.75 15
16 1,700.00 1,700.00 16
17 6,530.30 6,530.30 17
18 168,000.00 168,000.00 18
19 666,482.00 666,482.00 19
20 6,700.00 6,700.00 20
21 219,049.08 219,049.08 21
22 154,716.90 154,716.90 22
23 17,200.00 17,200.00 23
24 626.00 626.00 24
25 650.00 650.00 25
26 1,489.00 1,489.00 26
27 10,500.00 10,500.00 27
28 1,250.00 1,250.00 28
29 475.00 475.00 29
30 500.00 500.00 30
31 2,475.00 2,475.00 31
32 1,191.00 1,191.00 32
33 90.00 90.00 33
34 700.00 700.00 34
35 1,349,791.13 1,349,791.13 191,772.90 219,139.08 1,158,018.23 1,130,652.05 35
36 27,366.18 27,366.18 36
37 219,139.08 219,139.08 1,158,018.23 1,158,018.23 37
38 3839 39
FashionableSheet
BALANCE SHEET
20Y8
INCOME STATEMENTADJUSTED TRIAL BALANCE

38 © 2018 Cengage. May not be scanned, copied or duplicated, or posted to a publicly accessible website, in whole or in part.
Revenues:Sales 219,049.08$
Cost of goods sold 154,716.90Gross profit 64,332.18$ Operating expenses:
Selling expenses:Sales salaries expense 17,200.00$ Advertising expense 626.00Store supplies expense 650.00Miscellaneous selling expense 1,489.00 Total selling expenses 19,965.00$
Administrative expenses:Office salaries expense 10,500.00$ Depreciation expense—equipment 1,250.00Insurance expense 475.00Office supplies expense 500.00Depreciation expense—building 2,475.00Miscellaneous administrative expense 1,191.00 Total administrative expenses 16,391.00
Total operating expenses 36,356.00Income from operations 27,976.18$ Other revenue and expense:
Interest revenue 90.00$ Interest expense (700.00) (610.00)
Net income 27,366.18$
Fit & FashionableIncome Statement
For the Month Ended April 30, 20Y8

39 © 2018 Cengage. May not be scanned, copied or duplicated, or posted to a publicly accessible website, in whole or in part.
Marty Chavez, capital, March 31, 20Y8 666,482.00$ Net income for the month 27,366.18$ Withdrawals (6,700.00)Change in owner’s equity 20,666.18Marty Chavez, capital, April 30, 20Y8 687,148.18$
For the Month Ended April 30, 20Y8Statement of Owner’s Equity
Fit & Fashionable

40 © 2018 Cengage. May not be scanned, copied or duplicated, or posted to a publicly accessible website, in whole or in part.
Current assets:Cash 146,131.01$ Notes receivable 6,800.00Accounts receivable 27,979.47Interest receivable 30.00Inventory 208,554.75Estimated returns inventory 4,643.00Office supplies 1,600.00Store supplies 3,005.00Prepaid insurance 5,225.00
Total current assets 403,968.23$ Property, plant, and equipment:
Land 210,000.00$ Building 439,000.00$ Accumulated depreciation (142,675.00)
Building, book value 296,325.00Equipment 98,350.00$ Accumulated depreciation (35,790.00)
Equipment, book value 62,560.00 Total property, plant, and equipment 568,885.00
Total assets 972,853.23$
Current liabilities:Accounts payable 109,474.75$ Salaries payable 1,700.00Customer refunds payable 6,530.30
Total current liabilities 117,705.05$ Long-term liabilities:
Notes payable 168,000.00Total liabilities 285,705.05$
Marty Chavez, capital 687,148.18Total liabilities and owner’s equity 972,853.23$
Fit & FashionableBalance SheetApril 30, 20Y8
Liabilities
Assets
Owner's Equity

41 © 2018 Cengage. May not be scanned, copied or duplicated, or posted to a publicly accessible website, in whole or in part.
ACCOUNT ACCT. NO. DEBIT BALANCES CREDIT BALANCES
Cash 1110 146,131.01Notes Receivable 1111 6,800.00Accounts Receivable 1112 27,979.47Interest Receivable 1113 30.00Inventory 1114 208,554.75Estimated Returns Inventory 1115 4,643.00Office Supplies 1116 1,600.00Store Supplies 1117 3,005.00Prepaid Insurance 1118 5,225.00Land 1120 210,000.00Building 1122 439,000.00Accumulated Depreciation—Building 1123 142,675.00Equipment 1124 98,350.00Accumulated Depreciation—Equipment 1125 35,790.00Accounts Payable 2100 109,474.75Salaries Payable 2110 1,700.00Customer Refunds Payable 2120 6,530.30Notes Payable 2150 168,000.00Marty Chavez, Capital 3100 687,148.18
1,151,318.23 1,151,318.23
Fit & Fashionable
April 30, 20Y8Post-Closing Trial Balance

42 © 2018 Cengage. May not be scanned, copied or duplicated, or posted to a publicly accessible website, in whole or in part.
1. Total Merchandise Purchases during April 125,915.15$ 2. Total Cash Sales during April 118,020.00$ 3. Total Sales on Account for April 105,499.08$ 4. Total Accounts Payable Credits during April 128,865.15$
5. All Access Fitness Center Balance on April 30 13,770.64$ 6. Miami Health Club Balance on April 30 5,233.30$
7. Alexus Fitness Center Balance on April 30 10,105.00$ 8. Sports Magic Warehouse Balance on April 30 68,819.75$
9. Sales 219,049.08$ 10. Cost of Goods Sold 154,716.90$ 11. Gross Profit 64,332.18$ 12. Total Operating Expenses 36,356.00$ 13. Net Income 27,366.18$
14. Change in Owner’s Equity 20,666.18$ 15. Ending Balance of Owner’s Equity, April 30 687,148.18$
16. Total Current Assets 403,968.23$ 17. Total Property, Plant, and Equipment 568,885.00$ 18. Total Current Liabilities 117,705.05$
19. Adjustment to Office Supplies 500.00$ 20. Adjustment to Prepaid Insurance 475.00$ 21. Adjustment to Store Supplies 650.00$ 22. Adjustment for Inventory Shrinkage 142.22$
23. Amount Closed to Capital from Income Summary 27,366.18$ 24. Post-Closing Trial Balance Total 1,151,318.23$ 25. Amount Closed from Drawing to Capital 6,700.00$
ANALYSIS TEST
Fit & Fashionable
Closing
Adjustments
Balance Sheet
Statement of Owner’s Equity
Income Statement
Accounts Payable Ledger
Accounts Receivable Ledger
Journals

WarrenReeveDuchac
Managerial Accounting14e
Ch
ap
ter Job Order Costing

© 2018 Cengage Learning®. May not be scanned, copied or duplicated, or posted to a publicly accessible website, in whole or in part.
Learning Objectives
• Obj. 1: Describe cost accounting systems used by manufacturing businesses.
• Obj. 2: Describe and illustrate a job order cost accounting system for a manufacturing business.
• Obj. 3: Describe job order cost accounting systems for service businesses.

© 2018 Cengage Learning®. May not be scanned, copied or duplicated, or posted to a publicly accessible website, in whole or in part.
Cost Accounting Systems Overview (slide 1 of 3)
• Cost accounting systems measure, record, and report product costs.
o Managers use product costs for setting product prices, controlling operations, and developing financial statements.
• The two main types of cost accounting systems for manufacturing are:
o Job order cost systems
o Process cost systems

© 2018 Cengage Learning®. May not be scanned, copied or duplicated, or posted to a publicly accessible website, in whole or in part.
Cost Accounting Systems Overview (slide 2 of 3)
• A job order cost system provides product costs for each quantity of product that is manufactured.
o Each quantity of product that is manufactured is called a job.
• Job order costs systems are often used by companies that manufacture custom products for customers or batches of similar products.
o Manufacturers that use a job order cost system are sometimes called job shops.
Examples of a job shop would be a(n):
– Apparel manufacturer
– Guitar manufacturer

© 2018 Cengage Learning®. May not be scanned, copied or duplicated, or posted to a publicly accessible website, in whole or in part.
Cost Accounting Systems Overview (slide 3 of 3)
• A process cost system provides product costs for each manufacturing department or process.
• Process cost systems are often used by companies that manufacture units of a product that are indistinguishable from each other and are manufactured using a continuous production process.
o Examples would be: Oil refineries, Paper producers, Chemical processers, Food processors

© 2018 Cengage Learning®. May not be scanned, copied or duplicated, or posted to a publicly accessible website, in whole or in part.
Summary of Legend Guitars’ Manufacturing Operations

© 2018 Cengage Learning®. May not be scanned, copied or duplicated, or posted to a publicly accessible website, in whole or in part.
Job Order Cost Systems for Manufacturing Businesses (slide 1 of 2)
• A job order cost system records and summarizes manufacturing costs by jobs.
o While jobs are still in the production process, they are part of Work in Process Inventory.
o As jobs are completed, they become part of Finished Goods Inventory.
o When the finished goods are sold to customers, their costs become part of Cost of Goods Sold.

© 2018 Cengage Learning®. May not be scanned, copied or duplicated, or posted to a publicly accessible website, in whole or in part.
Flow of Manufacturing Costs

© 2018 Cengage Learning®. May not be scanned, copied or duplicated, or posted to a publicly accessible website, in whole or in part.
Job Order Cost Systems for Manufacturing Businesses (slide 2 of 2)
• In a job order cost accounting system, perpetual inventory controlling accounts and subsidiary ledgers are maintained for materials, work in process, and finished goods inventories.

© 2018 Cengage Learning®. May not be scanned, copied or duplicated, or posted to a publicly accessible website, in whole or in part.
Inventory Ledger Accounts

© 2018 Cengage Learning®. May not be scanned, copied or duplicated, or posted to a publicly accessible website, in whole or in part.
Materials(slide 1 of 6)
• The materials account in the general ledger is a controlling account. A separate account for each type of material is maintained in a subsidiary materials ledger:
o Increases (debits) are based on receiving reports, which is supported by the supplier’s invoice.
o Decreases (credits) are based on materials requisitions for particular jobs.

© 2018 Cengage Learning®. May not be scanned, copied or duplicated, or posted to a publicly accessible website, in whole or in part.
Materials Information and Cost Flows

© 2018 Cengage Learning®. May not be scanned, copied or duplicated, or posted to a publicly accessible website, in whole or in part.
Materials(slide 2 of 6)
• A receiving report is prepared when materials that have been ordered are received and inspected.
• The quantity received and the condition of the materials are entered on the receiving report.

© 2018 Cengage Learning®. May not be scanned, copied or duplicated, or posted to a publicly accessible website, in whole or in part.
Materials(slide 3 of 6)
• When the supplier’s invoice is received, it is compared to the receiving report.
• If there are no discrepancies, a journal entry is made to record the purchase.
o This entry increases (debits) Materials and increases (credits) Accounts Payable.
The journal entry to record the supplier’s invoice related to Receiving Report No. 196 (see slide 12) is as follows:

© 2018 Cengage Learning®. May not be scanned, copied or duplicated, or posted to a publicly accessible website, in whole or in part.
Materials(slide 4 of 6)
• The storeroom releases materials to use in a job when a materials requisition is received.
• The materials requisitions for each job serve as the basis for recording materials used.
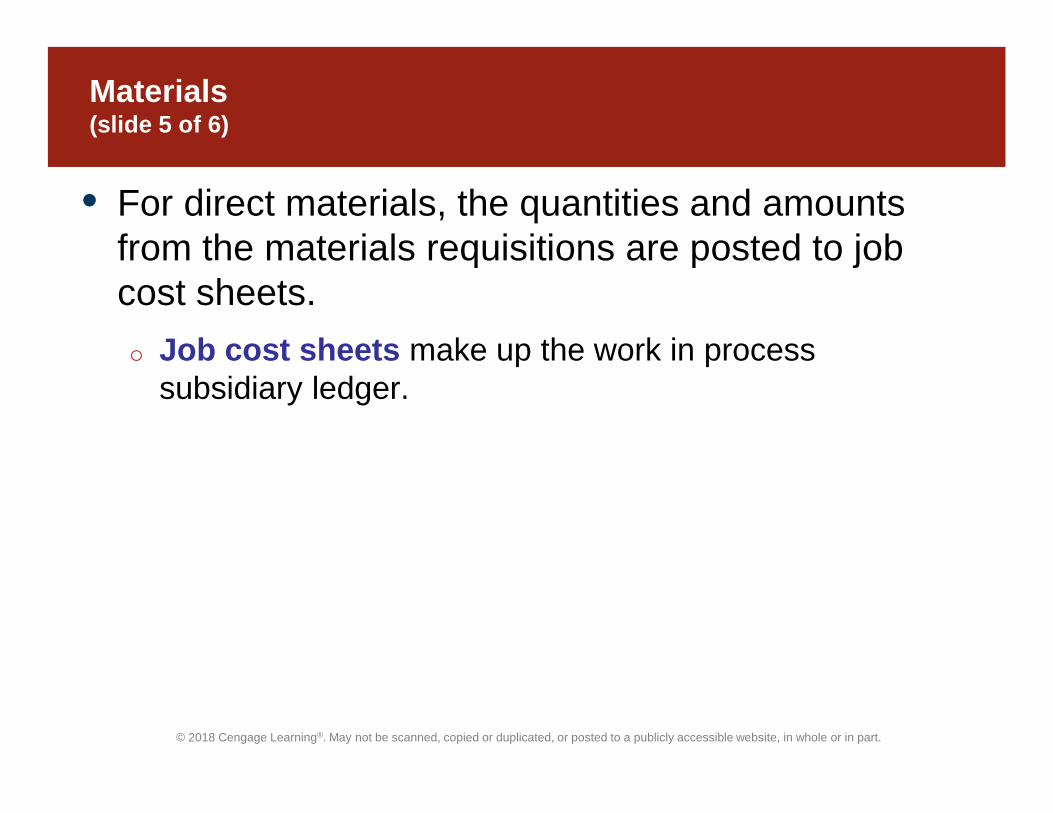
© 2018 Cengage Learning®. May not be scanned, copied or duplicated, or posted to a publicly accessible website, in whole or in part.
Materials(slide 5 of 6)
• For direct materials, the quantities and amounts from the materials requisitions are posted to job cost sheets.
o Job cost sheets make up the work in process subsidiary ledger.

© 2018 Cengage Learning®. May not be scanned, copied or duplicated, or posted to a publicly accessible website, in whole or in part.
Materials(slide 6 of 6)
• A summary of the materials requisitions is used as a basis for the journal entry recording the materials used for the month.
o For direct materials, this entry increases (debits) Work in Process and decreases (credits) Materials.
The journal entry to record the direct materials used for the month for Legend Guitars (see slide 12) is as follows:

© 2018 Cengage Learning®. May not be scanned, copied or duplicated, or posted to a publicly accessible website, in whole or in part.
Factory Labor(slide 1 of 2)
• When employees report for work, they may use electronic badges, clock cards, or in-and-out cards to clock in.
• When employees work on an individual job, they use time tickets to record the amount of time they have worked on a specific job.
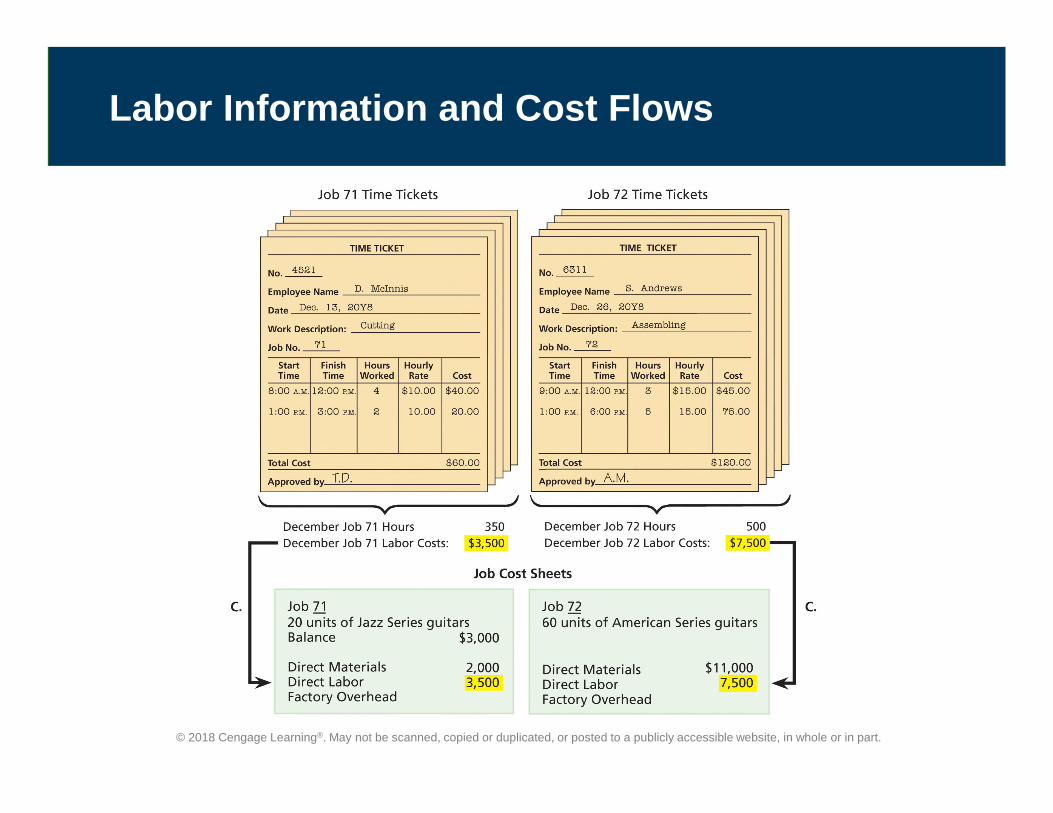
© 2018 Cengage Learning®. May not be scanned, copied or duplicated, or posted to a publicly accessible website, in whole or in part.
Labor Information and Cost Flows

© 2018 Cengage Learning®. May not be scanned, copied or duplicated, or posted to a publicly accessible website, in whole or in part.
Factory Labor(slide 2 of 2)
• A summary of the time tickets is used as the basis for the journal entry recording direct labor for the month.
o This entry increases (debits) Work in Process and increases (credits) Wages Payable.
The journal entry to record direct labor for the month for Legend Guitars (see previous slide) is as follows:

© 2018 Cengage Learning®. May not be scanned, copied or duplicated, or posted to a publicly accessible website, in whole or in part.
Factory Overhead(slide 1 of 2)
• Factory overhead includes all manufacturing costs except direct materials and direct labor.
• Factory overhead costs come from a variety of sources, including the following:o Indirect materials comes from a summary of materials
requisitions.
o Indirect labor comes from the salaries of production supervisors and the wages of other employees such as janitors.
o Factory power comes from utility bills.
o Factory depreciation comes from Accounting Department computation of depreciation.

© 2018 Cengage Learning®. May not be scanned, copied or duplicated, or posted to a publicly accessible website, in whole or in part.
Factory Overhead(slide 2 of 2)
• Assume that Legend Guitars incurred $4,600 of overhead during December, which included $500 of indirect materials, $2,000 of indirect labor, $900 of utilities, and $1,200 of factory depreciation. The $500 of indirect materials consisted of $200 of glue and $300 of sandpaper. The entry to record the factory overhead is as follows:
Factory Overhead 4,600
Materials 500
Wages Payable 2,000
Utilit ies Payable 900
Accumulated Depreciation 1,200
Factory overhead incurred in production.
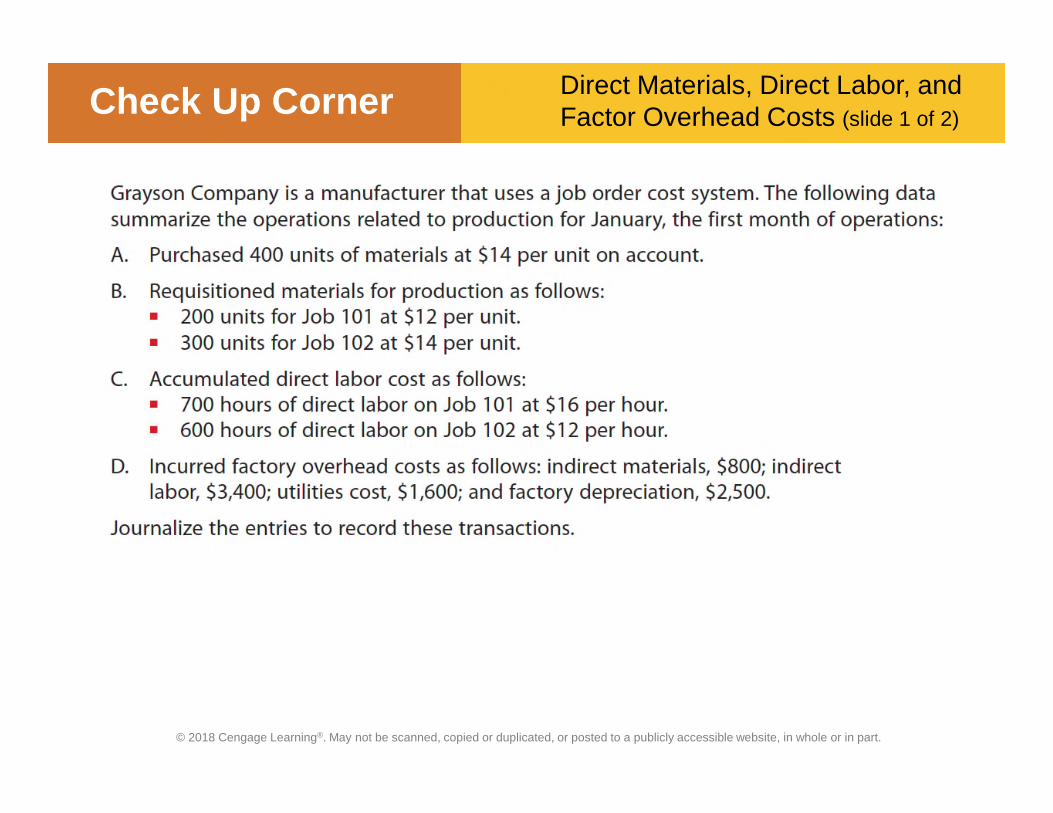
© 2018 Cengage Learning®. May not be scanned, copied or duplicated, or posted to a publicly accessible website, in whole or in part.
Check Up CornerDirect Materials, Direct Labor, andFactor Overhead Costs (slide 1 of 2)
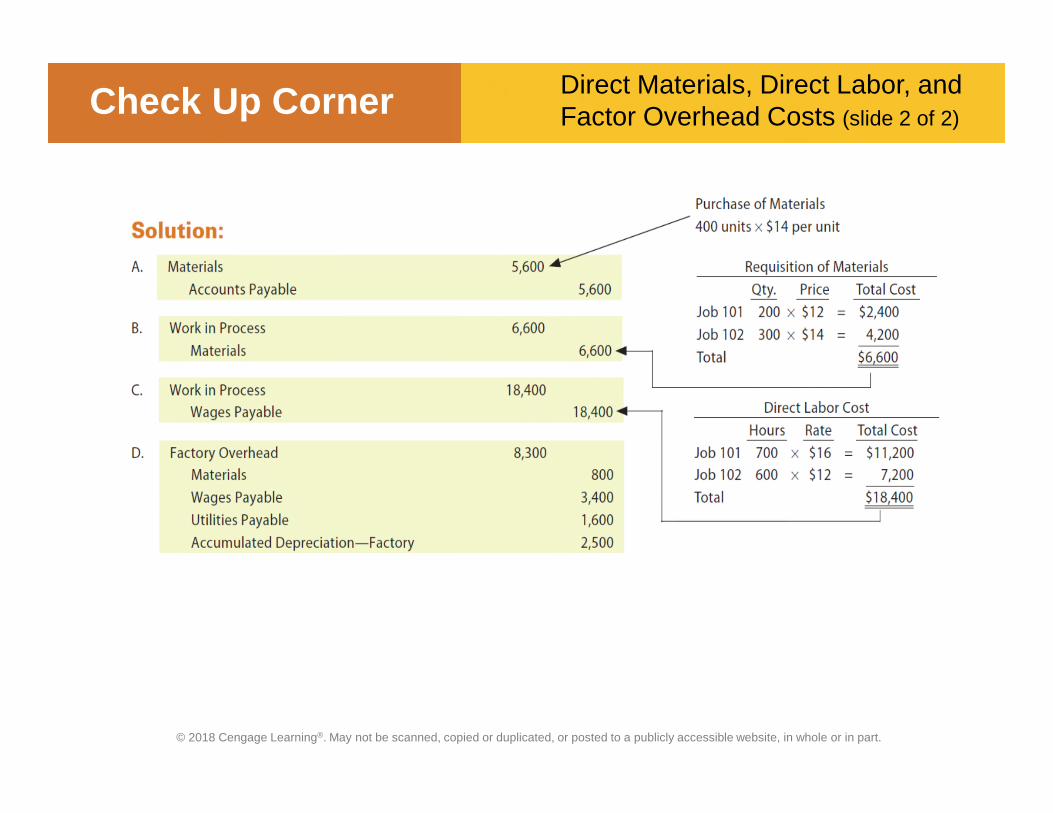
© 2018 Cengage Learning®. May not be scanned, copied or duplicated, or posted to a publicly accessible website, in whole or in part.
Check Up CornerDirect Materials, Direct Labor, andFactor Overhead Costs (slide 2 of 2)

© 2018 Cengage Learning®. May not be scanned, copied or duplicated, or posted to a publicly accessible website, in whole or in part.
Allocating Factory Overhead(slide 1 of 2)
• Factory overhead is different from direct labor and direct materials in that it is indirectly related to the jobs. That is, factory overhead costs cannot be identified with or traced to specific jobs. For this reason, factory overhead costs are allocated to jobs.

© 2018 Cengage Learning®. May not be scanned, copied or duplicated, or posted to a publicly accessible website, in whole or in part.
Allocating Factory Overhead(slide 2 of 2)
• The process by which factory overhead or other costs are assigned to a cost object, such as a job, is called cost allocation.
o The factory overhead costs are allocated to jobs using a common measure related to each job.
This measure is called an activity base, allocation base, or activity driver.
– Three common activity bases used to allocate factory overhead are:
1. Direct labor hours
2. Direct labor cost
3. Machine hours

© 2018 Cengage Learning®. May not be scanned, copied or duplicated, or posted to a publicly accessible website, in whole or in part.
Predetermined Factory Overhead Rate(slide 1 of 3)
• Factory overhead costs are normally allocated or applied to jobs using a predetermined factory overhead rate.
• The predetermined factory overhead rate is computed as:
Predetermined Factory Overhead Rate
Estimated Total Factory Overhead Costs
Estimated Activity Base=

© 2018 Cengage Learning®. May not be scanned, copied or duplicated, or posted to a publicly accessible website, in whole or in part.
Predetermined Factory Overhead Rate(slide 2 of 3)
• Assume that Legend Guitars estimates the total factory overhead cost as $50,000 for the year and the activity base as 10,000 direct labor hours. The predetermined factory overhead rate is computed as follows:

© 2018 Cengage Learning®. May not be scanned, copied or duplicated, or posted to a publicly accessible website, in whole or in part.
Predetermined Factory Overhead Rate(slide 3 of 3)
• Many companies are using a method for accumulating and allocating factory overhead costs. This method, called activity-based costing, uses a different overhead rate for each type of factory overhead activity, such as inspecting, moving, and machining.

© 2018 Cengage Learning®. May not be scanned, copied or duplicated, or posted to a publicly accessible website, in whole or in part.
Applying Factory Overhead to Jobs

© 2018 Cengage Learning®. May not be scanned, copied or duplicated, or posted to a publicly accessible website, in whole or in part.
Applying Factory Overhead to Work In Process(slide 1 of 5)
• Using a factory overhead rate of $5 per direct labor hour, $4,250 of factory overhead is applied as follows:

© 2018 Cengage Learning®. May not be scanned, copied or duplicated, or posted to a publicly accessible website, in whole or in part.
Applying Factory Overhead to Work In Process(slide 2 of 5)
• The journal entry to apply factory overhead increases (debits) Work in Process and credits Factory Overhead.
o The journal entry to apply overhead to Jobs 71 and 72 is as follows:

© 2018 Cengage Learning®. May not be scanned, copied or duplicated, or posted to a publicly accessible website, in whole or in part.
Applying Factory Overhead to Work In Process(slide 3 of 5)
• The factory overhead account is:
o Increased (debited) for the actual overhead costs incurred.
o Decreased (credited) for the applied overhead.
• The actual and applied overhead usually differ because the actual overhead costs are normally different from the estimated overhead costs.

© 2018 Cengage Learning®. May not be scanned, copied or duplicated, or posted to a publicly accessible website, in whole or in part.
Applying Factory Overhead to Work In Process(slide 4 of 5)
• Depending on whether actual overhead is greater or less than applied overhead, the factory overhead account will either have a debit or credit ending balance as follows:
o If the applied overhead is less than the actual overhead incurred, the factory overhead account will have a debit balance.
This debit balance is called underapplied factory overhead or underabsorbed factory overhead.
o If the applied overhead is more than the actual overhead incurred, the factory overhead account will have a credit balance.
This debit balance is called overapplied factory overhead or overabsorbed factory overhead.

© 2018 Cengage Learning®. May not be scanned, copied or duplicated, or posted to a publicly accessible website, in whole or in part.
Applying Factory Overhead to Work In Process(slide 5 of 5)
• The factory overhead account for Legend Guitars, which follows, illustrates both underapplied and overappliedfactory overhead.

© 2018 Cengage Learning®. May not be scanned, copied or duplicated, or posted to a publicly accessible website, in whole or in part.
Check Up CornerApplying Overhead and Determining Job Cost (slide 1 of 3)
Grayson Company estimates that total factory overhead costs will be $100,000 for the year. Direct labor hours are estimated to be 25,000. The company had two completed jobs at the end of January, Jobs 101 and 102. Data on accumulated direct labor hours and units produced for these jobs are as follows:
Direct Labor Hours Units Produced
Job 101 700 500
Job 102 600 1,000
A. Using the information provided, determine: 1. The predetermined factory overhead rate using direct labor hours as the activity base. 2. The amount of factory overhead applied to Jobs 101 and 102 in January.
B. Prepare the journal entry to apply factory overhead to both jobs in January using the predetermined overhead rate from (A).
C. Using the information provided along with the job cost information from Check Up Corner 16-1, determine: 1. The balance on the job cost sheets for Jobs 101 and 102 at the end of the month. 2. The cost per unit for Jobs 101 and 102.

© 2018 Cengage Learning®. May not be scanned, copied or duplicated, or posted to a publicly accessible website, in whole or in part.
Check Up Corner
Solut ion:
A. 1.Predetermined Factory
Overhead Rate=
Estimated Total Factory
Overhead Costs = $100,000 =$4.00 per direct
labor hourEstimated Activity Base 25,000 direct labor hours
2. Direct Labor
Hours
Factory
Overhead Rate
Factory Overhead
Applied
Job 101 700 ´ $4.00 = $2,800
Job 102 600 ´ $4.00 = 2,400
Total $5,200
B. Work in Process 5,200
Factory Overhead 5,200
A predetermined
overhead rate is
used to allocate
overhead costs to
individual jobs.
The factory overhead cost applied to each job is
recorded on the job cost sheet for each job.
Applying Overhead and Determining Job Cost (slide 2 of 3)
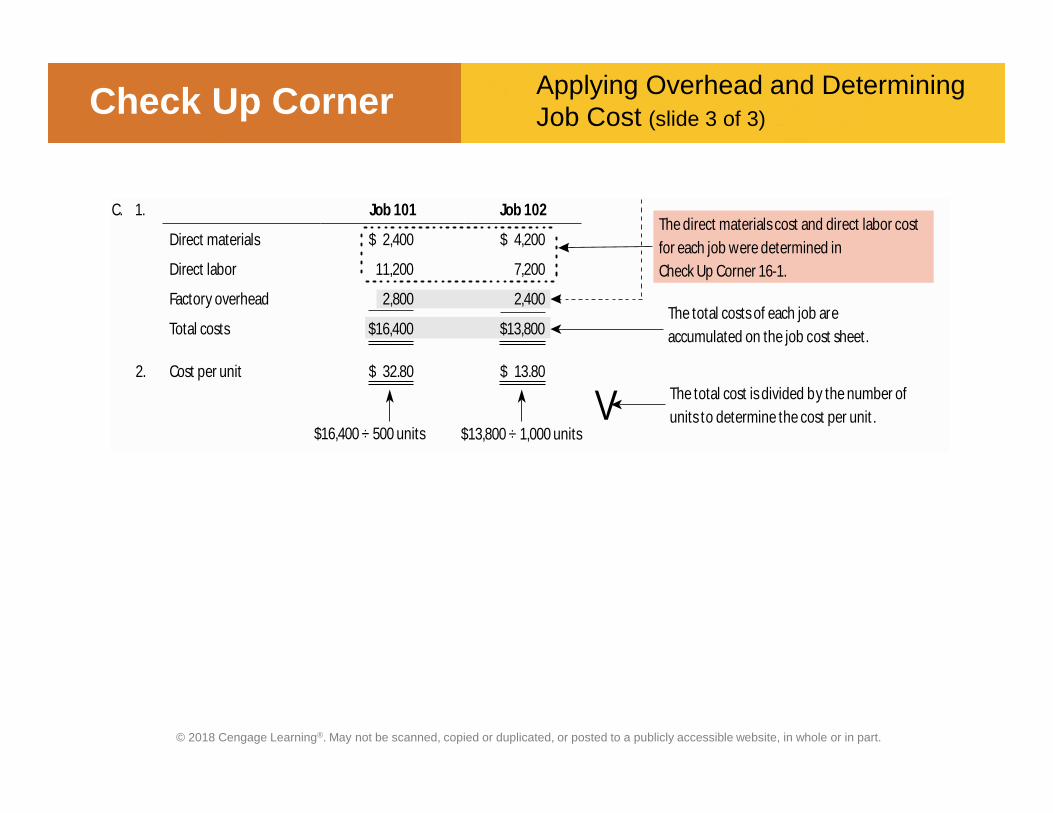
© 2018 Cengage Learning®. May not be scanned, copied or duplicated, or posted to a publicly accessible website, in whole or in part.
Check Up Corner
C. 1. Job 101 Job 102
Direct materials $ 2,400 $ 4,200
Direct labor 11,200 7,200
Factory overhead 2,800 2,400
Total costs $16,400 $13,800
2. Cost per unit $ 32.80 $ 13.80
$16,400 ÷ 500 units $13,800 ÷ 1,000 unitsV The total cost is divided by the number of
units to determine the cost per unit .
The total costs of each job are
accumulated on the job cost sheet.
The direct materials cost and direct labor cost
for each job were determined in
Check Up Corner 16-1.
Applying Overhead and Determining Job Cost (slide 3 of 3)

© 2018 Cengage Learning®. May not be scanned, copied or duplicated, or posted to a publicly accessible website, in whole or in part.
Disposal of Factory Overhead Balance(slide 1 of 3)
• During the year, the balance in the factory overhead account is carried forward and reported as a deferred debit or credit on the monthly (interim) balance sheets.
• However, any balance in the factory overhead account should not be carried over to the next year.
o This is because any such balance applies only to operations of the current year.

© 2018 Cengage Learning®. May not be scanned, copied or duplicated, or posted to a publicly accessible website, in whole or in part.
Disposal of Factory Overhead Balance(slide 2 of 3)
• The balance of Factory Overhead at the end of the year is disposed of by transferring it to the cost of goods sold account as follows:
o If there is an ending debit balance (underapplied overhead) in the factory overhead account, it is disposed of by the entry that follows:
o If there is an ending credit balance (overapplied overhead) in the factory overhead account, it is disposed of by the entry that follows:
Cost of Goods Sold XXX
Factory Overhead XXX
Transfer of underapplied
overhead to cost of goods sold.
Factory Overhead XXX
Cost of Goods Sold XXX
Transfer of overapplied
overhead to cost of goods sold.

© 2018 Cengage Learning®. May not be scanned, copied or duplicated, or posted to a publicly accessible website, in whole or in part.
Disposal of Factory Overhead Balance(slide 3 of 3)
• The journal entry to dispose of Legend Guitars’ December 31, 2016, underapplied overhead balance of $150 is as follows:
Cost of Goods Sold 150
Factory Overhead 150
Closed underapplied factory
overhead to cost of goods sold.

© 2018 Cengage Learning®. May not be scanned, copied or duplicated, or posted to a publicly accessible website, in whole or in part.
Work in Process(slide 1 of 3)
• During the period, Work in Process is increased (debited) for the following:
o Direct materials cost
o Direct labor cost
o Applied factory overhead cost

© 2018 Cengage Learning®. May not be scanned, copied or duplicated, or posted to a publicly accessible website, in whole or in part.
Job Cost Sheets and the Work in Process Controlling Account

© 2018 Cengage Learning®. May not be scanned, copied or duplicated, or posted to a publicly accessible website, in whole or in part.
Work in Process(slide 2 of 3)
• During December, Job 71 was completed. Upon completion, the product costs (direct materials, direct labor, and factory overhead) are totaled. This total is divided by the number of units produced to determine the cost per unit.
o Thus, the 20 Jazz Series guitars produced as Job 71 cost $512.50 ($10,250 ÷ 20) per guitar.
• After completion, Job 71 is transferred from Work in Process to Finished Goods by the following entry:
Finished Goods 10,250
Work in Process 10,250
Job 71 completed in December.

© 2018 Cengage Learning®. May not be scanned, copied or duplicated, or posted to a publicly accessible website, in whole or in part.
Work in Process(slide 3 of 3)
• Job 72 was started in December but was not completed by December 31, 2016. Thus, Job 72 is still part of work in process on December 31, 2016.
o Note that the balance of the job cost sheet for Job 72 ($21,000) is also the December 31, 2016, balance of Work in Process.

© 2018 Cengage Learning®. May not be scanned, copied or duplicated, or posted to a publicly accessible website, in whole or in part.
Finished Goods
• The finished goods account is a controlling account for the subsidiary finished goods ledger or stock ledger:
o Each account in the finished goods ledger contains cost data for the units manufactured, units sold, and units on hand.

© 2018 Cengage Learning®. May not be scanned, copied or duplicated, or posted to a publicly accessible website, in whole or in part.
Finished Goods Ledger Account

© 2018 Cengage Learning®. May not be scanned, copied or duplicated, or posted to a publicly accessible website, in whole or in part.
Sales and Cost of Goods Sold
• During December, Legend Guitars sold 40 Jazz Series guitars for $850 each, generating total sales of $34,000 ($850 × 40 guitars). The cost per guitar sold was $500 or a total cost of $20,000 ($500 ×40). The entries to record the sale and related cost of goods sold are as follows:
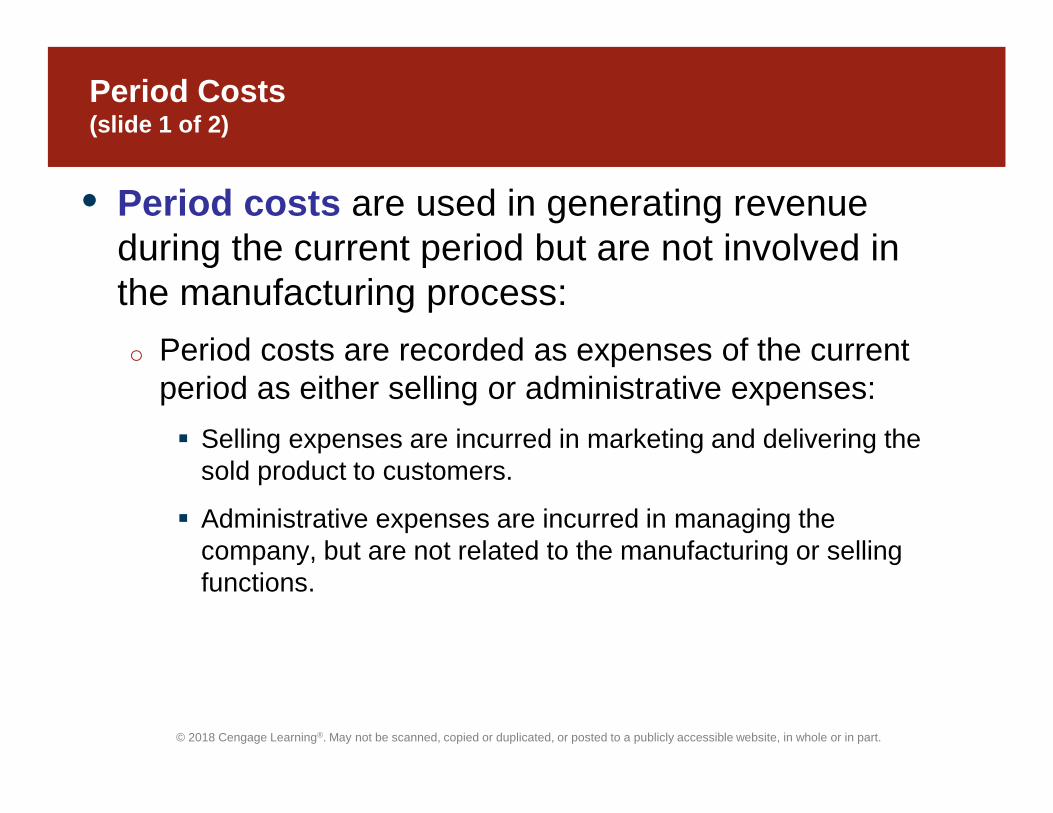
© 2018 Cengage Learning®. May not be scanned, copied or duplicated, or posted to a publicly accessible website, in whole or in part.
Period Costs(slide 1 of 2)
• Period costs are used in generating revenue during the current period but are not involved in the manufacturing process:
o Period costs are recorded as expenses of the current period as either selling or administrative expenses:
Selling expenses are incurred in marketing and delivering the sold product to customers.
Administrative expenses are incurred in managing the company, but are not related to the manufacturing or selling functions.

© 2018 Cengage Learning®. May not be scanned, copied or duplicated, or posted to a publicly accessible website, in whole or in part.
Period Costs(slide 2 of 2)
• During December, Legend Guitars recorded the following selling and administrative expenses:

© 2018 Cengage Learning®. May not be scanned, copied or duplicated, or posted to a publicly accessible website, in whole or in part.
Flow of Manufacturing Costs for Legend Guitars

© 2018 Cengage Learning®. May not be scanned, copied or duplicated, or posted to a publicly accessible website, in whole or in part.
Summary of Cost Flows for Legend Guitars
• The previous slide shows the cost flows through the manufacturing accounts of Legend Guitars for December.
o The balances of Materials, Work in Process, and Finished Goods are supported by their subsidiary ledgers.

© 2018 Cengage Learning®. May not be scanned, copied or duplicated, or posted to a publicly accessible website, in whole or in part.
Income Statement of Legend Guitars

© 2018 Cengage Learning®. May not be scanned, copied or duplicated, or posted to a publicly accessible website, in whole or in part.
• A job order cost accounting system may be used by a professional service business:
o For example, an advertising agency, an attorney, and a physician each provide services to individual customers, clients, or patients. In such cases, the customer, client, or patient can be viewed as a job for which costs are accumulated.
Job Order Cost Systems for Service Businesses (slide 1 of 2)

© 2018 Cengage Learning®. May not be scanned, copied or duplicated, or posted to a publicly accessible website, in whole or in part.
Job Order Cost Systems for Service Businesses (slide 2 of 2)
• The primary product costs for a service business are direct labor and overhead costs. Any materials or supplies are insignificant and are included as part of overhead costs.
• Like a manufacturing business, direct labor and overhead costs of rendering services to clients are accumulated in a work in process account.
• When the job is completed and the client billed, the costs are transferred to a cost of services account.
o Cost of Services is similar to the cost of merchandise sold account for a merchandising business or the cost of goods sold account for a manufacturing business.
• A finished goods account and related finished goods ledger are not necessary.
o This is because the revenues for the services are recorded only after the services are provided.

© 2018 Cengage Learning®. May not be scanned, copied or duplicated, or posted to a publicly accessible website, in whole or in part.
Flow of Costs Through a Service Business

© 2018 Cengage Learning®. May not be scanned, copied or duplicated, or posted to a publicly accessible website, in whole or in part.
Check Up CornerJob Order Costing for a Service Business(slide 1 of 2)

© 2018 Cengage Learning®. May not be scanned, copied or duplicated, or posted to a publicly accessible website, in whole or in part.
Check Up CornerJob Order Costing for a Service Business(slide 2 of 2)

© 2018 Cengage Learning®. May not be scanned, copied or duplicated, or posted to a publicly accessible website, in whole or in part.
Job Order Costing for Decision Making(slide 1 of 2)
• A job order cost accounting system accumulates and records product costs by jobs. The resulting total and unit product costs can be compared to similar jobs, compared over time, or compared to expected costs.
o In this way, a job order cost system can be used by managers for cost evaluation and control.

© 2018 Cengage Learning®. May not be scanned, copied or duplicated, or posted to a publicly accessible website, in whole or in part.
Comparing Data from Job Cost Sheets

© 2018 Cengage Learning®. May not be scanned, copied or duplicated, or posted to a publicly accessible website, in whole or in part.
Job Order Costing for Decision Making(slide 2 of 2)
• The job cost sheets can be analyzed for possible reasons for the increased materials cost for Job 63.
• Because the materials price did not change ($10 per board foot), the increased materials cost must be related to wood consumption.
• Thus, Legend Guitars should conduct an investigation to determine the cause of the extra 100 board feet used for Job 63.
Managerial Accounting 14th Edition Warren Solutions ManualFull Download: http://testbanklive.com/download/managerial-accounting-14th-edition-warren-solutions-manual/
Full download all chapters instantly please go to Solutions Manual, Test Bank site: testbanklive.com