chapter 12 towards displacement-based seismic design … · chapter 12 towards displacement-based...
TRANSCRIPT
Chapter 12
Towards Displacement-Based Seismic Design
of Modern Unreinforced Masonry Structures
Katrin Beyer, S. Petry, M. Tondelli, and A. Paparo
Abstract Unreinforced masonry (URM) structures are known to be rather vulner-
able to seismic loading. Modern URM buildings with reinforced concrete
(RC) slabs might, however, have an acceptable seismic performance for regions
of low to moderate seismicity. In particular in countries of moderate seismicity it is
often difficult to demonstrate the seismic safety of modern URM buildings by
means of force-based design methods. Displacement-based design methods are
known to lead to more realistic and less conservative results, opening up hence
new opportunities for the use of structural masonry. An effective implementation of
displacement-based design approaches requires reliable estimates of the structure’s
force and displacement capacity. This paper contributes to this endeavour by taking
a fresh look at the drift capacity of URM walls with hollow clay bricks and mortar
joints of normal thickness. It discusses in particular the influence of the size of the
test unit and the applied loading history and loading velocity on the drift capacities
of URM walls.
12.1 Introduction
Although unreinforced masonry (URM) construction features excellent properties
with regard to sustainability, durability, indoor climate and fire resistance, in most
regions of moderate seismicity the total amount of structural masonry in new
residential buildings has decreased over the last three decades (Magenes 2006).
One reason for this decrease relates to the conservatism of force-based methods
which often lead to the situation that URM buildings do not satisfy the seismic
K. Beyer (*) • S. Petry • M. Tondelli • A. Paparo
Earthquake Engineering and Structural Dynamics Laboratory (EESD), School of Architecture,
Civil and Environmental Engineering (ENAC), Ecole Polytechnique Federale de Lausanne
(EPFL), EPFL ENAC IIC EESD, GC B2 504, Station 18, CH – 1015 Lausanne, Switzerland
e-mail: [email protected]
A. Ansal (ed.), Perspectives on European Earthquake Engineering and Seismology,Geotechnical, Geological and Earthquake Engineering 34,
DOI 10.1007/978-3-319-07118-3_12, © The Author(s) 2014
401
design check in regions of moderate seismicity. As a result alternative structural
systems such as reinforced concrete (RC) walls and gravity frames are used instead.
Furthermore, for RC structures already several well developed displacement-based
design methods are in place, which yield more realistic and less conservative results
than force-based design methods. In order to regain the URM construction’s
competitiveness with regard to seismic design, displacement-based design methods
for URM buildings are necessary. A number of displacement-based design methods
for URM structures have recently been proposed. These include applications of the
capacity spectrum methods (Fajfar 1999) using inelastic (e.g. Graziotti 2013) or
overdamped (e.g. Norda and Butenweg 2011) response spectra or the direct
displacement-based design method (Priestley et al. 2007). A summary of these
methods can be found in Graziotti (2013).
Displacement-based design methods require the force-displacement response of
the structure up to failure as input. With the development of macro-elements
representing the nonlinear response of URM walls (Braga and Liberatore 1990;
Chen et al. 2008; Belmouden and Lestuzzi 2009; Penna et al. 2013) and their
implementation in software packages (Lagomarsino et al. 2013), nonlinear static
and dynamic analyses of entire URM buildings have become feasible not only in
research but also in engineering practice. Macro-element models are based on
pre-defined failure mechanisms and force-displacement relationships of structural
components. Next to models for strength and stiffness, the drift capacities of URM
walls at horizontal and axial load failure are important input parameters for such
models. For RC structures the structural engineer can control the failure mechanism
by providing appropriate longitudinal, vertical and confinement reinforcement
ratios and layouts. In contrast, most parameters controlling the failure mechanism
of URM walls, such as the geometry of the walls, the axial load carried by the walls
and the boundary conditions provided by the slabs are defined by architectural
considerations or other non-structural requirements (e.g. the thickness of RC slabs
depends often on requirements for sound insulation and heating installation). For
this reason the ability to predict the nonlinear response of URM buildings forming
all kinds of failure mechanisms is a key element towards displacement-based
design of URM structures.
Mechanical models for the stiffness and strength of URM walls have been
proposed and successfully validated (e.g. Magenes and Calvi 1997). For the defor-
mation capacity of URMwalls, comprehensive mechanical models are, however, still
lacking. Furthermore, the prediction of the deformation capacity by means of numer-
ical tools remains a challenge although the numerical analysis of URM structures has
seen significant advances (for a review see Lourenco 2008; Milani 2012). Numerical
models that have been developed for the analysis of URM structures include limit
analysis tools (e.g. Milani et al. 2006a, b) which aim at the prediction of failure load
and failure mechanism; the simplified micro-models where joints are modelled as
interface elements (e.g. Lourenco and Rots 1997; Gambarotta and Lagomarsino
1997a; Snozzi and Molinari 2013); and finite element approaches where masonry is
modelled as continuum (e.g. Gambarotta and Lagomarsino 1997b; Zucchini and
Lourenco 2002; Facconi et al. 2013).While most of these analysis techniques provide
very good approximations of the failure load and often also the failure mechanism,
402 K. Beyer et al.
the deformation capacity associated with horizontal load failure (20 % drop in
strength) or axial load failure (loss of axial load bearing capacity) is often difficult
to predict. Both performance points lie in the post-peak branch where localisation
issues render the numerical analyses particularly difficult. The displacement capacity
of URM structures is therefore typically determined by drift limits established on the
basis of experimental results.
The principal elements in modern URM buildings are URM walls, RC slabs and
sometimes spandrel elements consisting of a masonry spandrel and a strip of the RC
slab (“composite spandrels”). While the stiffness and strength of RC slabs and
composite spandrels are important in order to predict the force-displacement
response of the building, their deformation capacity is typically sufficiently large
to be non-critical (see experimental results in Beyer and Dazio 2012). Research
needs with regard to horizontal elements in URM buildings relate therefore mainly
to the effective width of the slab and the stiffness and strength of composite
spandrels. First attempts to address these issues are reported in Da Pare (2011),
Benaboud (2013) and Marino (2013). The displacement capacity of modern URM
buildings is therefore expected to be limited by the URM walls of the building
rather than the horizontal elements (Salmanpour et al. 2013). Of all URM walls the
first storey walls are expected to be most critical since shear demands are largest for
the first storey.
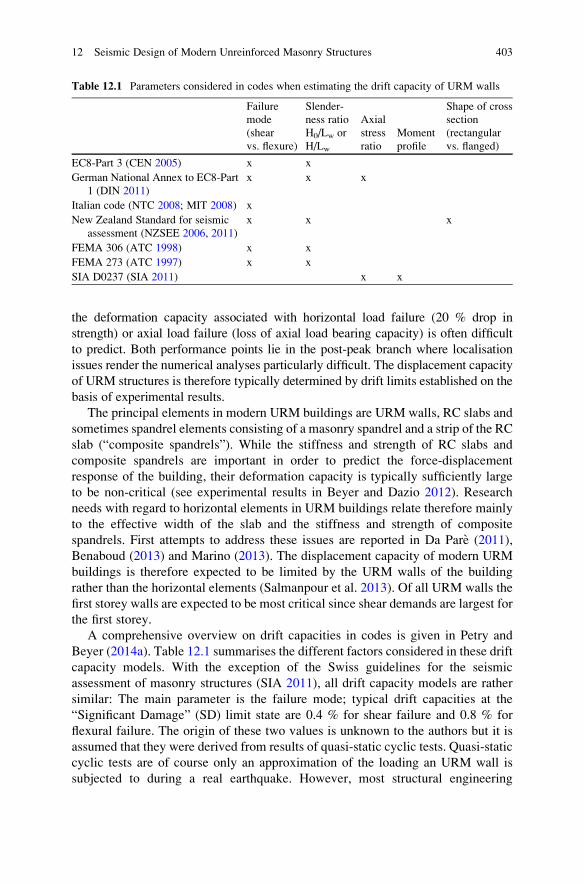
A comprehensive overview on drift capacities in codes is given in Petry and
Beyer (2014a). Table 12.1 summarises the different factors considered in these drift
capacity models. With the exception of the Swiss guidelines for the seismic
assessment of masonry structures (SIA 2011), all drift capacity models are rather
similar: The main parameter is the failure mode; typical drift capacities at the
“Significant Damage” (SD) limit state are 0.4 % for shear failure and 0.8 % for
flexural failure. The origin of these two values is unknown to the authors but it is
assumed that they were derived from results of quasi-static cyclic tests. Quasi-static
cyclic tests are of course only an approximation of the loading an URM wall is
subjected to during a real earthquake. However, most structural engineering
Table 12.1 Parameters considered in codes when estimating the drift capacity of URM walls
Failure
mode
(shear
vs. flexure)
Slender-
ness ratio
H0/Lw or
H/Lw
Axial
stress
ratio
Moment
profile
Shape of cross
section
(rectangular
vs. flanged)
EC8-Part 3 (CEN 2005) x x
German National Annex to EC8-Part
1 (DIN 2011)
x x x
Italian code (NTC 2008; MIT 2008) x
New Zealand Standard for seismic
assessment (NZSEE 2006, 2011)
x x x
FEMA 306 (ATC 1998) x x
FEMA 273 (ATC 1997) x x
SIA D0237 (SIA 2011) x x
12 Seismic Design of Modern Unreinforced Masonry Structures 403
laboratories do not have the capacity of conducting dynamic tests but many are
equipped for quasi-static cyclic tests. As a result, the number of quasi-static tests on
URM walls that has been carried out until today clearly outnumbers dynamic tests
on URM walls or entire URM buildings. Hence, empirical drift capacity models
will have to rely on quasi-static cyclic test results. Using experimental results from
isolated URM walls under quasi-static cyclic loading as the basis for empirical drift
capacity models raises a number of questions; in particular whether the drift
capacity of URM walls is influenced by:
• the size of the test unit?
• the loading history applied to the wall?
• the loading velocity?
This paper attempts to shed some light on these aspects. The paper is limited to
the behaviour of URMwalls with hollow clay bricks and cement mortar for joints of
normal thickness (walls with thin bed joints are not considered).
12.2 Tests on URM Walls: Influence of Wall Height
on Drift Capacity
Many tests on URM walls have been conducted on specimens with heights between
1.2 and 1.8 m, which corresponds roughly to one half to three quarters of typical
storey heights Hs. Apart from restrictions imposed by the test setup, the observation
that walls with reduced free height often fail first might have influenced this choice
(Fig. 12.1a). In modern URM buildings, however, the window units often reach
over the entire storey height and therefore the effective height H of the walls is
equal to the storey height (Fig. 12.1b). In older construction, inner walls correspond
also to storey-high walls. Given the range of effective wall heights in real buildings,
the question whether the size and therefore height of the test unit influences the drift
capacity of URM walls is therefore pertinent.
12.2.1 Database on URM Wall Tests
Figure 12.2 shows the distribution of test unit heights from a recently published
database on URM wall tests (Petry and Beyer 2014a). A large part of this database
stems from the study by Frumento et al. (2009). The database includes walls
constructed with full-size clay brick units and cement mortar for joints of normal
thickness. The smallest test unit in the database had a height of H¼ 1.17 m (�0.5
Hs) and the largest test unit had a height of H¼ 3.00 m. The database covers
therefore well the effective height of walls in real buildings, but it is biased towards
the walls with reduced effective heights: out of the 64 tests, 41 tests were conducted
on walls with heights smaller than three quarters of a storey height (H�2.4 m).
404 K. Beyer et al.

Most of the walls were tested as cantilever walls (H0/H� 1.0) or with fixed-fixed
boundary conditions (H0/H� 0.5, Fig. 12.2b). Apart from the EPFL-campaign,
where the shear span ratio H0/H was the key parameter investigated, three further
tests featured shear span ratios other than 0.5 or 1.0. In these tests the axial force
was applied eccentrically or the height of the top beam was considerable when
compared to the rather small test unit. The walls with larger heights than the EPFL-
walls were all subjected to fixed-fixed boundary conditions. Seventy percent of the
41 walls smaller than 1.8 m (�0.75 Hs) were tested as cantilevers. The database is
therefore dominated by walls that have a height smaller than Hs and were tested as
cantilevers. Deriving drift capacity estimates for codes by averaging the drift
a b
Fig. 12.1 Effective height H of walls in facades with and without masonry spandrels
a b
Fig. 12.2 Database on URM walls (Petry and Beyer 2014a): distribution of height H, axial stress
ratio σ0/fm and shear span ratio H0/H
12 Seismic Design of Modern Unreinforced Masonry Structures 405

capacities of all test units in the database that are displaying, for example, a
particular failure mode, will inevitably lead to drift capacity estimates representa-
tive for this subset. However, it is questionable if short cantilever walls are
representative for walls in modern URM structures.
Before closing this section, some reflections on the testing of walls with H<Hs:
For walls extending only over part of the storey height (Fig. 12.1a), the boundary
conditions at the bottom of the wall require particular attention. In the test stand, the
test unit is typically placed between concrete or steel beams in order to fix the test
unit to the strong floor and apply the horizontal and vertical loads at the top. In a
modern building the URM wall is framed by RC slabs. The boundary conditions in
laboratories seem therefore representative if full storey high walls are tested. Walls
in facades with masonry spandrels (Fig. 12.1a) would be framed by a RC slab at the
top and URM masonry at the bottom. The boundary condition at the bottom should
therefore be given some consideration since the steel or RC foundation in the
laboratory might not be representative. In particular, the confining effect on the
bottom mortar joint provided by the steel or RC foundation might be stronger than
that of the masonry supporting the wall in real buildings. As a result, the lateral
expansion of the brick due to the different Poisson ratios of mortar and brick might
be smaller. If the failure mode includes crushing of the URM wall’s toe, the
confinement provided by the foundation might therefore potentially lead to an
increase of the URM wall’s drift capacity. To avoid this effect one could consider
testing the specimen with an additional brick layer at the base that is fixed to the
foundation by a high performance glue.
12.2.2 A New Empirical Drift Capacity Model for URMWalls
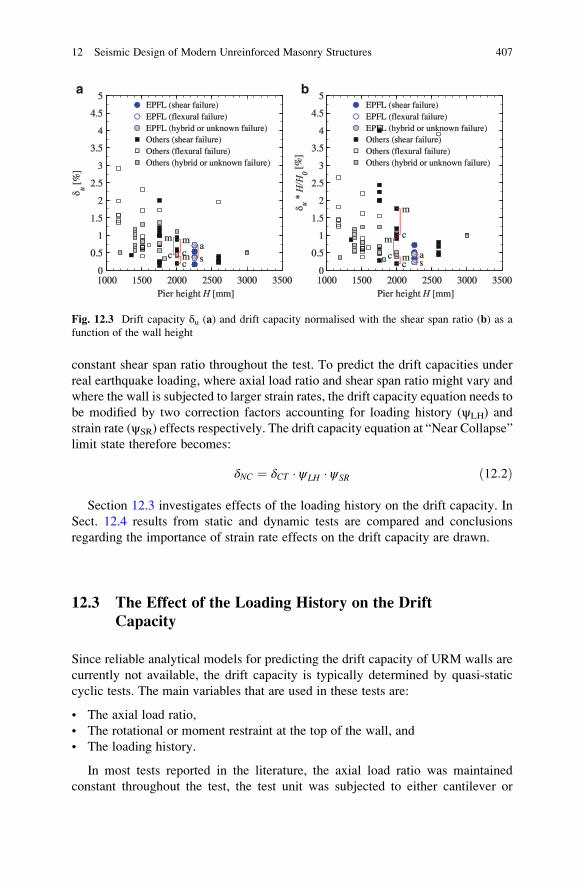
Figure 12.3a shows the experimentally determined drift capacity δu as a function ofthe wall height. The drift capacity is the drift capacity associated with a 20 % drop
in strength. The figure shows a clear decreasing trend of drift capacity with
increasing height. This holds also if the drift capacity is normalised with the
shear span ratio H0/H accounting for the fact that the drift capacity reduces with
reducing shear span ratio (SIA 2011). These plots suggest that the drift capacity of
URM walls is influenced by a size effect, as it has first been proposed by Lourenco
(1997). Accounting for the effect that the drift capacity of walls reduces with
increasing axial load ratio, the following drift capacity equation was recently
proposed by Petry and Beyer (2014a):
δCT ¼ 1:3% � 1� 2:2σ0f u
� �� H0
H� 2400mm
H
� �0:5
ð12:1Þ
The equation aims at predicting a mean drift capacity as obtained for quasi-static
cyclic tests where the test unit is subjected to a constant axial load ratio and a
406 K. Beyer et al.
constant shear span ratio throughout the test. To predict the drift capacities under
real earthquake loading, where axial load ratio and shear span ratio might vary and
where the wall is subjected to larger strain rates, the drift capacity equation needs to
be modified by two correction factors accounting for loading history (ψLH) and
strain rate (ψSR) effects respectively. The drift capacity equation at “Near Collapse”
limit state therefore becomes:
δNC ¼ δCT � ψLH � ψSR ð12:2Þ
Section 12.3 investigates effects of the loading history on the drift capacity. In
Sect. 12.4 results from static and dynamic tests are compared and conclusions
regarding the importance of strain rate effects on the drift capacity are drawn.
12.3 The Effect of the Loading History on the Drift
Capacity
Since reliable analytical models for predicting the drift capacity of URM walls are
currently not available, the drift capacity is typically determined by quasi-static
cyclic tests. The main variables that are used in these tests are:
• The axial load ratio,
• The rotational or moment restraint at the top of the wall, and
• The loading history.
In most tests reported in the literature, the axial load ratio was maintained
constant throughout the test, the test unit was subjected to either cantilever or
a b
Fig. 12.3 Drift capacity δu (a) and drift capacity normalised with the shear span ratio (b) as a
function of the wall height
12 Seismic Design of Modern Unreinforced Masonry Structures 407

fixed-fixed boundary conditions, and a loading history with two or three cycles per
amplitude level was applied. The total number of cycles until failure was often not a
key parameter when defining the loading history. However, for systems susceptible
to cumulative damage demands, the number of cycles can influence the force and/or
displacement capacity obtained from the quasi-static cyclic test. In current testing
practice, in order to capture the evolution of damage limit states, a relatively large
number of cycles is often applied. The questions that arise from such testing
practice are:
• Does the loading history have an influence on the key parameters of interest, i.e.,
the effective stiffness, maximum force capacity and drift capacity?
• If it does, is the number of applied cycles representative of the expected
cumulative seismic damage demand in the region of interest?
• Are the boundary conditions representative for the critical walls in a structure?
To investigate these questions, first the results from pairs of test units are
discussed where one had been subjected to monotonic and one to cyclic loading
(Sect. 12.3.1), then loading protocols for cyclic tests on URM walls are reviewed
(Sect. 12.3.2) and typical axial force and shear force histories of first storey URM
walls are investigated (Sect. 12.3.3).
12.3.1 Monotonic vs. Cyclic Tests
When reviewing the test results on URM walls (Sect. 12.2.1), three pairs of tests on
URM walls were identified where one wall had been subjected to monotonic loading
and the other to cyclic loading. The first two pairs stem from the experimental
campaign by Ganz and Thurlimann (1984), the third from Magenes and Calvi
(1992). Ganz and Thurlimann applied always 10 cycles per amplitude level, which
from today’s point of view is certainly not representative since it exceeds consider-
ably the number of cycles imposed by an earthquake. The total number of cycles
applied until failure was 58 for W6 and 61 for W7. Magenes and Calvi applied a
loading history which corresponds in many respects already to today’s standard for
URM wall testing. Until failure, the cyclic loading history comprised ~6 cycles.
Table 12.2 summarises the three main properties of the envelope curves in
Fig. 12.4, i.e. the effective stiffness, the maximum force and the drift capacity.
The effective stiffness is the secant stiffness at 0.75 Fmax and the drift capacity the
drift at which the force had dropped to 0.8 Fmax. For the cyclic tests, the effective
stiffness KC and the strength Fmax,C are taken as average values obtained for the
positive and negative loading direction. The drift capacity δu,C, on the contrary, is
defined as the minimum of the two values (see Frumento et al. 2009). From the
three parameters, the maximum force is the one which is the least affected by the
loading scheme. The largest influence of the loading history is observed for the drift
capacity, which is in average twice as large for monotonic tests than for quasi-static
cyclic tests. Somewhat surprising is the consistently larger stiffness for cyclic tests
408 K. Beyer et al.

than for monotonic tests. The authors do not have an explanation for this observa-
tion. It must be assumed that it is linked to the alternating loading direction since
mortar strengths and age of the test units at the day of testing were very similar for
all test units by Ganz and Thurlimann; Magenes and Calvi did not report mortar
strengths for the individual walls.
Despite the admittedly very limited data set, this comparison of monotonic
vs. cyclic test results suggests that the loading history is not important if one is
only interested in the force capacity of the URM wall. It becomes, however,
significant if the displacement capacity and possibly also the effective stiffness
are of interest. When results of quasi-static cyclic tests of URM walls are used to
derive drift capacity limits for displacement-based design, attention should there-
fore be paid to the loading history that was applied in the test.
12.3.2 Loading Protocols for Cyclic Tests
For systems susceptible to strength and stiffness degradation, the strength and
deformation obtained from quasi-static cyclic tests will depend on the imposed
loading history. Hence, the obtained capacities are directly related to imposed
demands. For this reason, loading protocols for quasi-static cyclic tests on URM
walls should be given some consideration.
Tomazevic and co-workers (1996, 2000) addressed loading history effects on the
response of reinforced masonry walls displaying a flexural failure mode but until
today no systematic investigation on the influence of different cyclic loading pro-
tocols on the drift capacity of URM walls was carried out. The effect of the number
of cycles on the performance of URM walls can therefore only be inferred indi-
rectly via the comparison of the envelopes of first cycles with envelopes of second
or third cycles. The walls of the EPFL test series were subjected to two cycles per
drift level. Figure 12.5 shows for three of these walls the envelopes of the first and
second cycles. The three walls developed different failure mechanisms: PUP2 a
Table 12.2 Monotonic vs. cyclic loading: comparison of effective stiffness, maximum force and
drift capacity
Cyclic test Monotonic test Cyclic/monotonic
KC
[kN/m]
Fmax,C
[kN]
δu,C[%]
KM
[kN/m]
Fmax,M
[kN]
δu,M[%]
KC/KM
[�]
Fmax,C/
Fmax,M [�]
δu,C/δu,M [�]
W1 & W6 178 256 0.45 127 266 0.94 1.40 0.96 0.48
W2 & W7 218 496 0.20 163 479 0.40 1.34 1.03 0.50
MI1m &
MI1
98 263 0.28 66 258 0.78 1.49 1.02 0.35
Mean
ratio
1.41 1.00 0.44
12 Seismic Design of Modern Unreinforced Masonry Structures 409
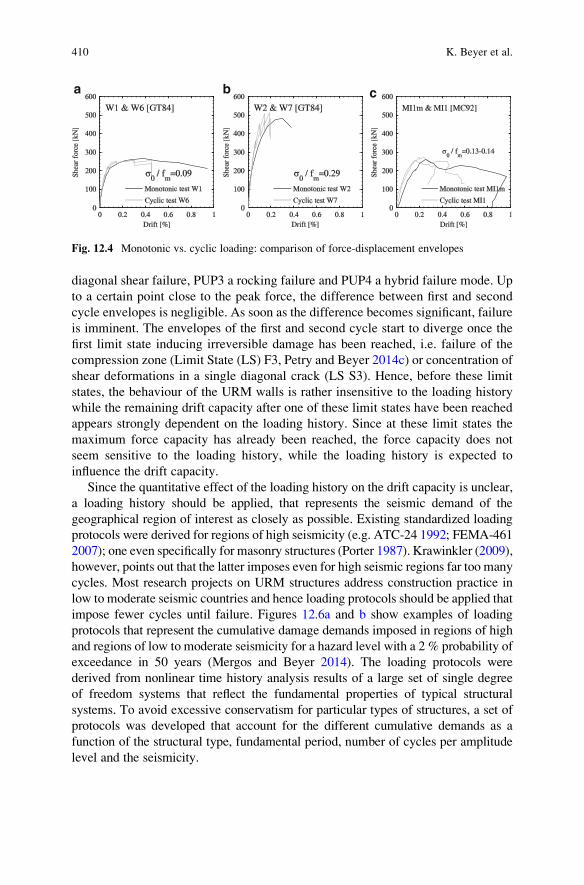
diagonal shear failure, PUP3 a rocking failure and PUP4 a hybrid failure mode. Up
to a certain point close to the peak force, the difference between first and second
cycle envelopes is negligible. As soon as the difference becomes significant, failure
is imminent. The envelopes of the first and second cycle start to diverge once the
first limit state inducing irreversible damage has been reached, i.e. failure of the
compression zone (Limit State (LS) F3, Petry and Beyer 2014c) or concentration of
shear deformations in a single diagonal crack (LS S3). Hence, before these limit
states, the behaviour of the URM walls is rather insensitive to the loading history
while the remaining drift capacity after one of these limit states have been reached
appears strongly dependent on the loading history. Since at these limit states the
maximum force capacity has already been reached, the force capacity does not
seem sensitive to the loading history, while the loading history is expected to
influence the drift capacity.
Since the quantitative effect of the loading history on the drift capacity is unclear,
a loading history should be applied, that represents the seismic demand of the
geographical region of interest as closely as possible. Existing standardized loading
protocols were derived for regions of high seismicity (e.g. ATC-24 1992; FEMA-461
2007); one even specifically for masonry structures (Porter 1987). Krawinkler (2009),
however, points out that the latter imposes even for high seismic regions far too many
cycles. Most research projects on URM structures address construction practice in
low to moderate seismic countries and hence loading protocols should be applied that
impose fewer cycles until failure. Figures 12.6a and b show examples of loading
protocols that represent the cumulative damage demands imposed in regions of high
and regions of low to moderate seismicity for a hazard level with a 2 % probability of
exceedance in 50 years (Mergos and Beyer 2014). The loading protocols were
derived from nonlinear time history analysis results of a large set of single degree
of freedom systems that reflect the fundamental properties of typical structural
systems. To avoid excessive conservatism for particular types of structures, a set of
protocols was developed that account for the different cumulative demands as a
function of the structural type, fundamental period, number of cycles per amplitude
level and the seismicity.
a b c
Fig. 12.4 Monotonic vs. cyclic loading: comparison of force-displacement envelopes
410 K. Beyer et al.
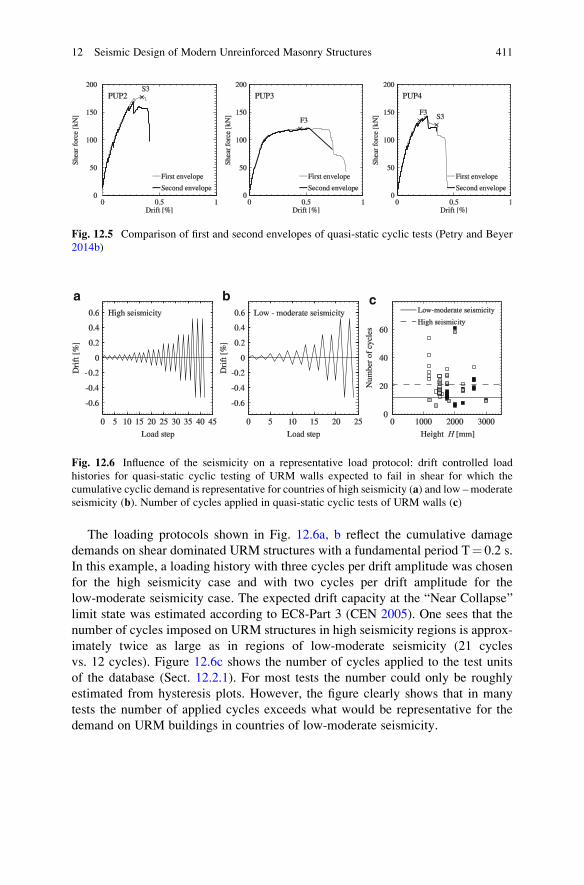
The loading protocols shown in Fig. 12.6a, b reflect the cumulative damage
demands on shear dominated URM structures with a fundamental period T¼ 0.2 s.
In this example, a loading history with three cycles per drift amplitude was chosen
for the high seismicity case and with two cycles per drift amplitude for the
low-moderate seismicity case. The expected drift capacity at the “Near Collapse”
limit state was estimated according to EC8-Part 3 (CEN 2005). One sees that the
number of cycles imposed on URM structures in high seismicity regions is approx-
imately twice as large as in regions of low-moderate seismicity (21 cycles
vs. 12 cycles). Figure 12.6c shows the number of cycles applied to the test units
of the database (Sect. 12.2.1). For most tests the number could only be roughly
estimated from hysteresis plots. However, the figure clearly shows that in many
tests the number of applied cycles exceeds what would be representative for the
demand on URM buildings in countries of low-moderate seismicity.
Fig. 12.5 Comparison of first and second envelopes of quasi-static cyclic tests (Petry and Beyer
2014b)
a b c
Fig. 12.6 Influence of the seismicity on a representative load protocol: drift controlled load
histories for quasi-static cyclic testing of URM walls expected to fail in shear for which the
cumulative cyclic demand is representative for countries of high seismicity (a) and low – moderate
seismicity (b). Number of cycles applied in quasi-static cyclic tests of URM walls (c)
12 Seismic Design of Modern Unreinforced Masonry Structures 411
12.3.3 Inner Walls vs. Outer Walls
In an URM building with strong RC slabs, most of the damage concentrates
typically in the first storey of the building (Paulay and Priestley 1992; Paparo and
Beyer 2014). Quasi-static cyclic tests should therefore represent the boundary
conditions of the first storey walls. Among these, the demands on inner and outer
walls differ significantly with regard to axial forces and shear spans (Petry and
Beyer 2014a).
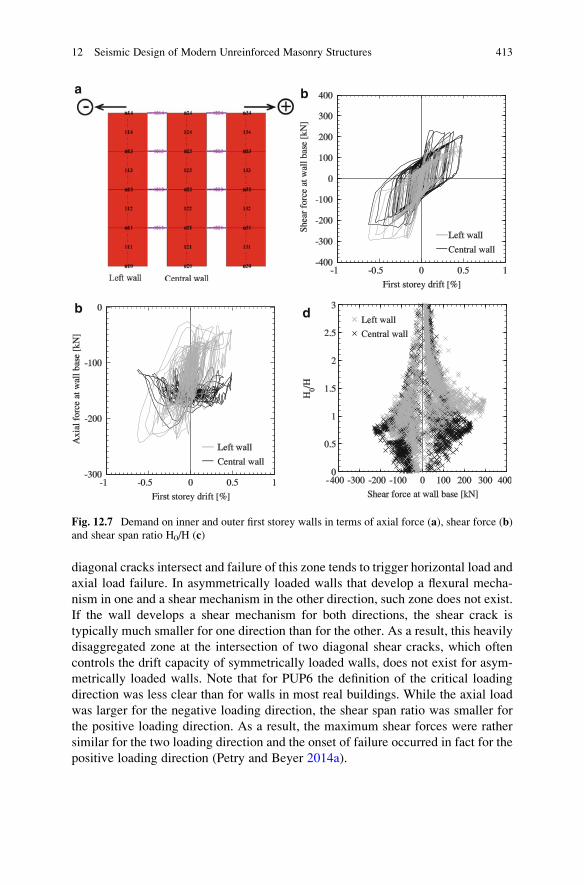
Figure 12.7 shows the axial force and base shear of an outer and an inner wall for
a 4-storey example building. The structure was analysed using the macro element
software Tremuri (Lagomarsino et al. 2013). The input ground motion was an
artificial record from the study by Priestley and Amaris (2002). In the analysis
the walls were not assigned an ultimate drift capacity. The analysis results show that
the inner wall is subjected to an axial force which is relatively constant throughout
the duration of the earthquake and its shear force – drift hysteresis is fairly
symmetric about the origin. The seismic behaviour of such a central wall seems
therefore well represented in quasi-static cyclic tests where a constant axial force
and a constant shear span ratio are applied to the wall.
The picture is different if an outer wall is considered: In the left wall, the axial
force increases when the structure is pushed towards the left while it decreases
when the structure moves towards the right. As a result, the maximum base shear is
larger for the negative loading direction than for the positive loading direction. Due
to the decrease in displacement capacity with increasing axial force (Lang 2002),
outer walls fail therefore typically in the loading direction where the axial force
increases in the wall (see, for example, Beyer et al. 2014). The question arises how
the drift capacity of walls subjected to such asymmetric boundary conditions for the
two loading directions compares to the drift capacity of walls subjected to the same
boundary conditions in the two loading directions.
The behaviour of outer walls is less well represented by standard test configu-
rations for URM walls and the question arises how well their displacement capacity
can be estimated from standard tests. A preliminary attempt to investigate this topic
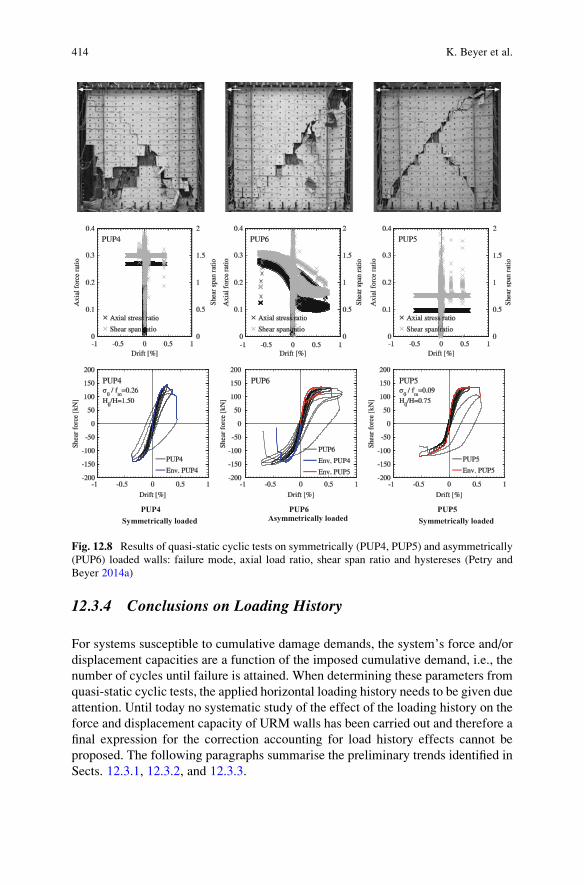
has been carried out within the EPFL-series on URM walls. The sixth test PUP6
represented boundary conditions of an outer wall: It approached for the positive
loading direction those of PUP5 and for the negative loading direction those of
PUP4. Figure 12.8 shows the applied axial load and shear span ratio as function of
the applied horizontal load and drift.
In the negative loading direction PUP6 was subjected to larger axial forces than
in the positive loading direction. Hence, the wall was expected to fail for loading in
the negative direction where the boundary conditions of PUP4 were approached.
For horizontal and vertical load failure, the drift capacities of PUP6 were 2.0 and
1.6 times larger than those of PUP4 (Figure 12.8), i.e., the results suggest that the
displacement capacity of an asymmetrically loaded wall is about twice as large as
the displacement capacity of a symmetrically loaded wall. The weakest zone in
symmetrically loaded walls failing in diagonal shear is the zone where the two
412 K. Beyer et al.
diagonal cracks intersect and failure of this zone tends to trigger horizontal load and
axial load failure. In asymmetrically loaded walls that develop a flexural mecha-
nism in one and a shear mechanism in the other direction, such zone does not exist.
If the wall develops a shear mechanism for both directions, the shear crack is
typically much smaller for one direction than for the other. As a result, this heavily
disaggregated zone at the intersection of two diagonal shear cracks, which often
controls the drift capacity of symmetrically loaded walls, does not exist for asym-
metrically loaded walls. Note that for PUP6 the definition of the critical loading
direction was less clear than for walls in most real buildings. While the axial load
was larger for the negative loading direction, the shear span ratio was smaller for
the positive loading direction. As a result, the maximum shear forces were rather
similar for the two loading direction and the onset of failure occurred in fact for the
positive loading direction (Petry and Beyer 2014a).
a b
b d
Fig. 12.7 Demand on inner and outer first storey walls in terms of axial force (a), shear force (b)
and shear span ratio H0/H (c)
12 Seismic Design of Modern Unreinforced Masonry Structures 413
12.3.4 Conclusions on Loading History
For systems susceptible to cumulative damage demands, the system’s force and/or
displacement capacities are a function of the imposed cumulative demand, i.e., the
number of cycles until failure is attained. When determining these parameters from
quasi-static cyclic tests, the applied horizontal loading history needs to be given due
attention. Until today no systematic study of the effect of the loading history on the
force and displacement capacity of URM walls has been carried out and therefore a
final expression for the correction accounting for load history effects cannot be
proposed. The following paragraphs summarise the preliminary trends identified in
Sects. 12.3.1, 12.3.2, and 12.3.3.
PUP4Symmetrically loaded
PUP6Asymmetrically loaded
PUP5Symmetrically loaded
Fig. 12.8 Results of quasi-static cyclic tests on symmetrically (PUP4, PUP5) and asymmetrically
(PUP6) loaded walls: failure mode, axial load ratio, shear span ratio and hystereses (Petry and
Beyer 2014a)
414 K. Beyer et al.
Cyclic tests resulted in only half the drift capacity as monotonic tests but the
loading regime had no effect on the force capacity. The reduction in drift capacity
under cyclic loading is linked to the cumulative damage induced by the cycles that
are applied after the limit states F3 (failure of the compressed zone) or S3 (con-
centration of shear deformations in a single diagonal crack) have been attained. A
study comparing the behaviour of walls subjected to different cyclic loading
histories could not be found in the literature. To get a first idea of the impact of
the number of cycles on the force-displacement response, envelopes of first and
second cycles were compared. As for the monotonic and cyclic tests, the difference
between these envelopes became only significant once the limit state F3 or S3 have
been passed. Since these limit states are attained after the strength plateau has been
reached, only the drift capacity but not the force capacity is expected to be affected
by the loading history. When determining quantities relevant for force-based design
from quasi-static cyclic tests, the loading history is therefore of lesser importance.
However, when drift capacity estimates are sought, due attention should be given to
the number of cycles applied until failure of the wall.
Since at present the exact effect of the loading history on the drift capacity of
URM walls is unknown, a loading history should be applied which reflects the
expected cyclic demand on the wall during a “Near Collapse” scenario. Attention
should be paid to
• The number of cycles imposed until failure,
• The boundary conditions, i.e. axial load ratio and shear span ratio,
• Whether the boundary conditions are the same for the positive and negative
loading direction.
The number of cycles a system is subjected to depends on its properties (funda-
mental period, hysteretic behavior) and the seismicity of the case study region.
URM structures are mainly constructed in low-moderate seismicity regions and
therefore fewer cycles than for high seismicity regions should be applied.
Quasi-static cyclic tests applying a constant axial force to the specimen that is
tested as cantilever or with fixed-fixed boundary conditions will remain the stan-
dard test since the boundary conditions are well defined and within the capabilities
of many structural engineering laboratories around the world. Boundary conditions
of URM walls in real buildings are, however, more diverse. This applies in
particular to the shear span ratio, which can vary approximately between 0.5 and
~2.0 H for URM buildings with RC slabs and the symmetry of the boundary
condition for the positive and negative loading direction. While symmetric cycles
with constant shear span and axial load ratio approximate the demand on inner walls
typically well, this does not hold for outer walls. For the latter the axial load and shear
span ratios fluctuate with the loading direction. A first investigation into the effect of
such asymmetric loading histories showed that the drift capacity of asymmetrically
loaded walls might be twice as large as that of symmetrically loaded walls, i.e.,
similar to the drift capacities obtained from monotonic load tests. For such walls a
correction factor of ψLH¼ 2 is therefore proposed (Eq. (12.1), Sect. 12.2.2).
12 Seismic Design of Modern Unreinforced Masonry Structures 415
12.4 Quasi-static vs. Dynamic Tests
It is likely that quasi-static cyclic tests will remain the standard tests for determining
drift capacities of URM walls. However, the actual purpose is to find drift capacity
estimates for walls subjected to earthquake loading. During an earthquake, URM
walls are subjected to strain rates that are approximately 1,000 times higher than
during quasi-static tests. To link static to dynamic drift capacities, strain rate effects
on the drift capacity need to be quantified and expressed by means of the correction
factor ψSR (Sect. 12.2, Eq. (12.2)).
Williams and Scrivener (1974) and Tomazevic et al. (1996) investigated strain
rate effects on reinforced masonry. Both reported similar drift capacities for static
and dynamic tests. Abrams (1996) compared the behaviour of unreinforced
masonry structures under static and dynamic loading and concluded that the loading
history affected the cracking pattern. However, he acknowledges that the structures
were tested at different scales with different construction materials and different
restraints provided to the flexible diaphragms, which made it difficult to compare
them one-to-one. Elgawady et al. (2004) compared the results of URM walls with
and without GFRP wrapping under static and dynamic loading. However, the shake
table tests were stopped prematurely and hence no conclusions regarding the drift
capacities at horizontal and vertical load failure under dynamic loads were possible.
A numerical study by Snozzi and Molinari (2013) showed that the strength of URM
walls is larger when subjected to higher strain rates due to a more diffuse cracking
pattern. However, this study did not yield any information regarding the effect of
the strain rate on the deformation capacity since the bricks were modelled as elastic.
This section addresses the effect of strain rates on drift capacities by comparing
the maximum drifts attained in quasi-static cyclic tests on walls to the maximum
drifts attained in a shake table test of a 4-storey building (Beyer et al. 2014; Tondelli
et al. 2014). Both walls and building were constructed at half scale using the same,
special fabricated half-scale bricks (Petry and Beyer 2014d). The walls had similar
but not identical dimensions. The walls tested under quasi-static cyclic loading
were 1.00 m long and 1.11 m high and had a rectangular cross section. The walls of
the building tested on the shake table were 1.55 m long and 1.40 m high and had
small flanges at the wall ends in order to increase the out-of-plane stability of the
walls.
The comparison between shake table test results of an entire building and quasi-
static cyclic tests will always be approximate since the exact boundary conditions
and loading history of the walls in the building are unknown. In addition, the
geometries of the two sets of walls differ slightly. However, in the absence of
tests where only the loading velocity but none of the other parameters was varied,
the comparison of results from a shake table test and quasi-static cyclic tests might
allow to shed some new light on the effect of strain rates on the deformation
capacity of URM walls. The following sections investigate the demand on the
walls in the building on the basis of nonlinear analysis (Sect. 12.4.1), analyse the
drift capacities obtained from quasi-static cyclic tests (Sect. 12.4.2) and compare
416 K. Beyer et al.
drifts attained in the shake table test to the drift capacities from quasi-static cyclic
tests (Sect. 12.4.3). Section 12.4.4 gives recommendations for the choice of the
correction factor ψSR that accounts for strain rate effects (Eq. (12.2)).
12.4.1 Shake Table Test
The building tested on the shake table was a 4-storey structure with URM walls and
RC walls. The building was subjected to uni-directional shaking and tested at the
TREES laboratory in Pavia (Italy). The shaking induced in-plane loading in the
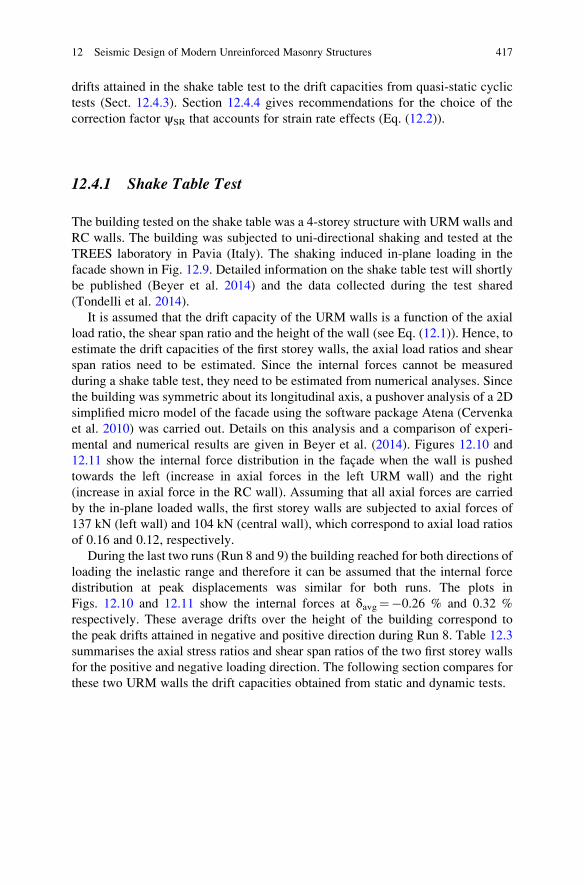
facade shown in Fig. 12.9. Detailed information on the shake table test will shortly
be published (Beyer et al. 2014) and the data collected during the test shared
(Tondelli et al. 2014).
It is assumed that the drift capacity of the URM walls is a function of the axial
load ratio, the shear span ratio and the height of the wall (see Eq. (12.1)). Hence, to
estimate the drift capacities of the first storey walls, the axial load ratios and shear
span ratios need to be estimated. Since the internal forces cannot be measured
during a shake table test, they need to be estimated from numerical analyses. Since
the building was symmetric about its longitudinal axis, a pushover analysis of a 2D
simplified micro model of the facade using the software package Atena (Cervenka
et al. 2010) was carried out. Details on this analysis and a comparison of experi-
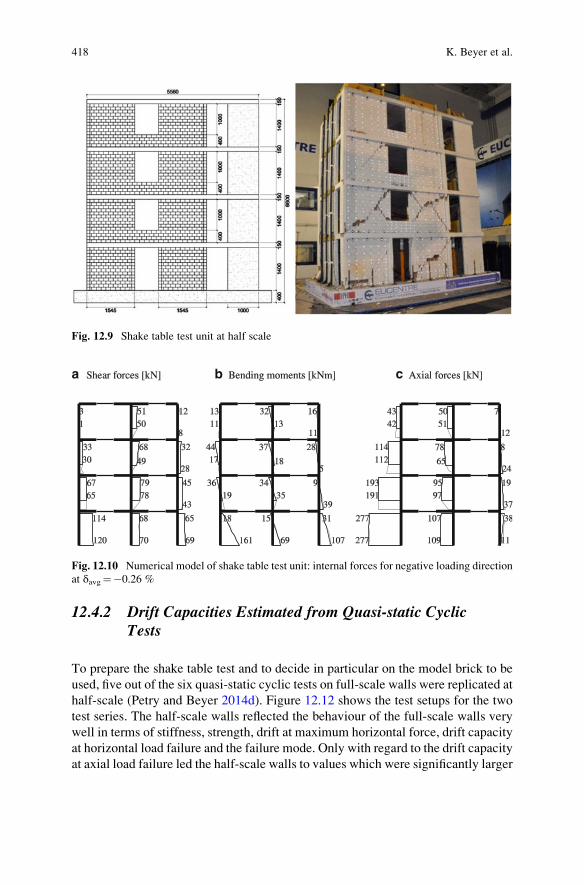
mental and numerical results are given in Beyer et al. (2014). Figures 12.10 and
12.11 show the internal force distribution in the facade when the wall is pushed
towards the left (increase in axial forces in the left URM wall) and the right
(increase in axial force in the RC wall). Assuming that all axial forces are carried
by the in-plane loaded walls, the first storey walls are subjected to axial forces of
137 kN (left wall) and 104 kN (central wall), which correspond to axial load ratios
of 0.16 and 0.12, respectively.
During the last two runs (Run 8 and 9) the building reached for both directions of
loading the inelastic range and therefore it can be assumed that the internal force
distribution at peak displacements was similar for both runs. The plots in
Figs. 12.10 and 12.11 show the internal forces at δavg¼�0.26 % and 0.32 %
respectively. These average drifts over the height of the building correspond to
the peak drifts attained in negative and positive direction during Run 8. Table 12.3
summarises the axial stress ratios and shear span ratios of the two first storey walls
for the positive and negative loading direction. The following section compares for
these two URM walls the drift capacities obtained from static and dynamic tests.
12 Seismic Design of Modern Unreinforced Masonry Structures 417
12.4.2 Drift Capacities Estimated from Quasi-static CyclicTests
To prepare the shake table test and to decide in particular on the model brick to be
used, five out of the six quasi-static cyclic tests on full-scale walls were replicated at
half-scale (Petry and Beyer 2014d). Figure 12.12 shows the test setups for the two
test series. The half-scale walls reflected the behaviour of the full-scale walls very
well in terms of stiffness, strength, drift at maximum horizontal force, drift capacity
at horizontal load failure and the failure mode. Only with regard to the drift capacity
at axial load failure led the half-scale walls to values which were significantly larger
Fig. 12.9 Shake table test unit at half scale
a b c
Fig. 12.10 Numerical model of shake table test unit: internal forces for negative loading direction
at δavg¼�0.26 %
418 K. Beyer et al.

than those of the full-scale walls. Figure 12.13 shows the comparison of the drift
capacities at the three performance limit states including linear trend lines.
The drift capacities of the first storey walls of the building tested on the shake
table are estimated from these linear trend lines in Figure 12.13 for the axial stress
and shear span ratios obtained from the pushover analyses (Table 12.3). In addition,
the following two effects are considered:
• The walls in the building are somewhat larger than the walls tested under quasi-
static cyclic loads. To account for the size effect discussed in Sect. 12.2, the drift
a b c
Fig. 12.11 Numerical model of shake table test unit: internal forces for positive loading direction
at δavg¼ 0.32 %
Table 12.3 Demand on first storey walls based on results of numerical model and estimated drift
capacities based on quasi-static cyclic tests
First storey
Negative
loading
direction
Negative loading direction but drift values
from test unit with max. axial stress ratio
Positive
loading
direction
Outer
wall
Inner
wall Outer wall
Outer
wall
Inner
wall
N [kN] 277 109 277 21 100
σ [MPa] 1.94 0.76 1.94 0.15 0.70
σ/fm 0.34 0.14 0.34 0.03 0.12
H0¼M/V [m] 1.34 0.99 1.34 0.74 1.07
H0/H 0.96 0.70 0.96 0.53 0.76
R 0.85 0.85 0.85 0.85 0.85
ψSR 2.0 1.0 2.0 1.0 1.0
δpeak [%] 0.06 0.24 0.36 0.28 0.29
δu [%] �0.26 0.40 0.59 0.51 0.49
δmax [%] �0.26 0.58 0.76 0.73 0.71
12 Seismic Design of Modern Unreinforced Masonry Structures 419
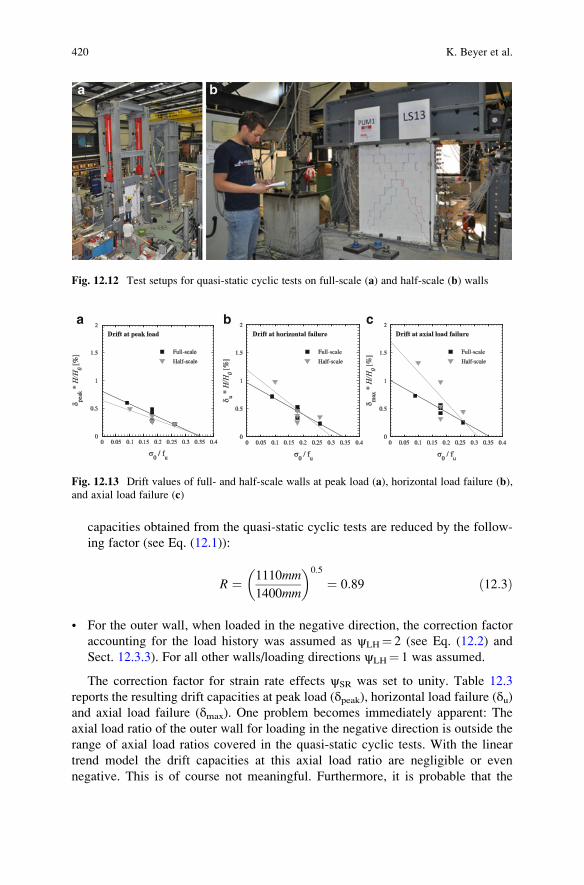
capacities obtained from the quasi-static cyclic tests are reduced by the follow-
ing factor (see Eq. (12.1)):
R ¼ 1110mm
1400mm
� �0:5
¼ 0:89 ð12:3Þ
• For the outer wall, when loaded in the negative direction, the correction factor
accounting for the load history was assumed as ψLH¼ 2 (see Eq. (12.2) and
Sect. 12.3.3). For all other walls/loading directions ψLH¼ 1 was assumed.
The correction factor for strain rate effects ψSR was set to unity. Table 12.3
reports the resulting drift capacities at peak load (δpeak), horizontal load failure (δu)and axial load failure (δmax). One problem becomes immediately apparent: The
axial load ratio of the outer wall for loading in the negative direction is outside the
range of axial load ratios covered in the quasi-static cyclic tests. With the linear
trend model the drift capacities at this axial load ratio are negligible or even
negative. This is of course not meaningful. Furthermore, it is probable that the
Fig. 12.12 Test setups for quasi-static cyclic tests on full-scale (a) and half-scale (b) walls
a b c
Fig. 12.13 Drift values of full- and half-scale walls at peak load (a), horizontal load failure (b),
and axial load failure (c)
420 K. Beyer et al.

axial load ratio in the outer wall was overestimated by the 2D model which neither
included out-of-plane walls nor the flanges of the in-plane loaded walls. For these
reasons the drift capacities obtained for the wall that had been subjected to the
largest axial stress ratio (σ/fm¼ 0.27) will be used to derive the drift capacity of the
outer wall for the negative loading direction. As outlined above, the reduction
factor R¼ 0.89 accounting for the size effect and the correction factor ψLH¼ 2
for the load history effect will be considered. The resulting drift capacity of an outer
wall is therefore computed as follows:
δ ¼ δPUM4 � H0=Hð ÞH0=Hð ÞPUM4
� R � ψLH ð12:3Þ
The drifts of PUM4 at peak load, horizontal load failure and axial load failure
were 0.31 %, 0.52 % and 0.67 % respectively; the shear span ratio was 1.5. The drift
capacities resulting for the outer wall and the negative loading direction are
summarized in the central column of Table 12.3.
12.4.3 Comparison of Drift Histories from Shake Table Testwith Drift Capacities from Quasi-static Cyclic Tests
The shake table test unit was subjected to nine runs; only the last two induced
significant damage. In the following, the drift histories measured at the centre line
of the outer and inner URM walls of the first storey are compared to the drift limits
derived in the previous section from quasi-static cyclic tests (Table 12.3). For
details of the computation of the drift histories from the optical measurements see
Beyer et al. (2014).
After Run 8 the damage in the URM panels started concentrating in one diagonal
crack. From quasi-static cyclic tests on URM walls it is known that this indicates
that the post peak branch has been reached and failure is rather imminent (Petry and
Beyer 2014d). The drift histories of the outer and inner wall exceeded just the drift
limits corresponding to the peak force (Fig. 12.14). Hence, for this limit state, the
drift limits derived from the quasi-static cyclic tests seem to correspond well with
the observed behaviour of the shake table test unit.
In Run 9 all walls of the first and second storey lost their axial load bearing
capacity. Also this observation agrees with the findings when comparing drift
histories from the shake table test with the drift limits obtained from quasi-static
cyclic tests (Fig. 12.15): Both walls exceeded the drift limit for axial load failure for
the negative loading direction. The inner wall touched the same limit also for the
positive loading direction. Figure 12.16 shows the damage of the URM walls after
this final run.
12 Seismic Design of Modern Unreinforced Masonry Structures 421

a
b
Fig. 12.14 Shake table test, Run 8: comparison of drift histories of first storey walls with drift
limits derived from quasi-static cyclic tests
a
b
Fig. 12.15 Shake table test, Run 9: comparison of drift histories of first storey walls with drift
limits derived from quasi-static cyclic tests
422 K. Beyer et al.

12.4.4 Conclusions on Comparison of Drift Capacities fromStatic and Dynamic Tests
The comparison of drift limits derived from quasi-static cyclic tests with drift
histories recorded for a shake table test showed that the former estimate the limit
states of the dynamic test rather well. This suggests that the difference in strain rates
between quasi-static and dynamic tests does not influence significantly the drift
capacities of URM walls associated with different limit states. Hence, the correc-
tion factor ψSR accounting for strain rate effects should be set to unity. In this study,
two limit states could be addressed: The limit state at peak force, which corresponds
typically with the onset of localization of the damage in a single crack or row of
bricks, and the limit state where the walls lost their axial load bearing capacity.
While the comparison has certain advantages over existing studies comparing
the results of static and dynamic tests on URM walls (e.g. same construction
material for static and dynamic tests, testing until axial load failure), it still suffers
from a number of disadvantages: The size and cross section of the walls subjected to
static and dynamic loads was not identical, neither were the boundary conditions
the walls were subjected to. In order to investigate strain rate effects systematically,
tests at different strain rates using the same test setup should be carried out.
12.5 Summary and Outlook
To promote the application of displacement-based approaches for the design of
modern URM buildings, reliable estimates of deformation capacities of key struc-
tural elements inherent in these buildings are of paramount importance. URM
walls, RC slabs and often spandrel elements consisting of a URM spandrel and a
strip of the RC slab (referred to as “composite spandrels”) are the key elements
Fig. 12.16 URM walls of shake table test unit after Run 9 (Beyer et al. 2014)
12 Seismic Design of Modern Unreinforced Masonry Structures 423
determining seismic vulnerability of URM buildings. Although stiffness and
strength of slab and composite spandrels significantly influence the seismic
response of these buildings, their deformation capacity is likely to be sufficiently
large to be non-critical. The displacement capacity of the building is therefore
likely to be controlled by the drift capacity of the first storey URM walls where the
shear demand is largest, which is typically determined from empirical equations
derived from quasi-static cyclic tests on URM walls.
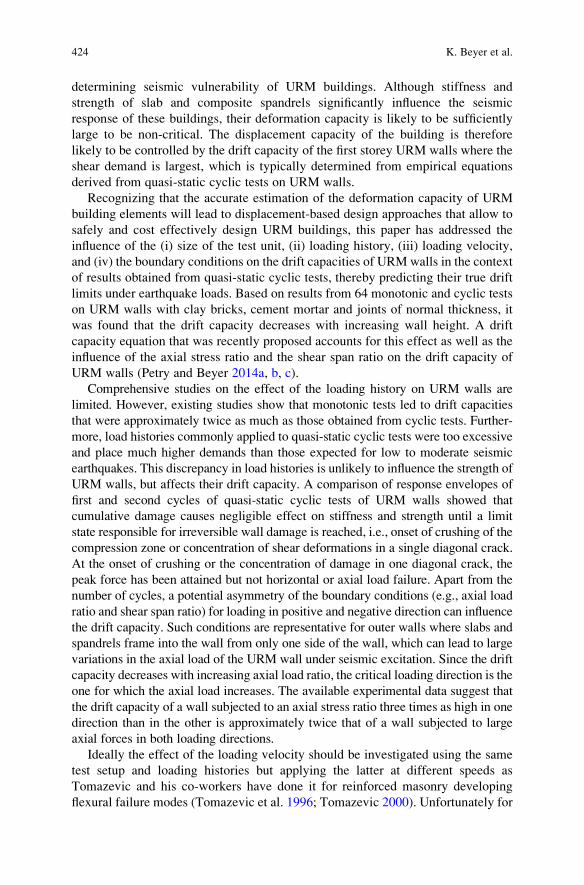
Recognizing that the accurate estimation of the deformation capacity of URM
building elements will lead to displacement-based design approaches that allow to
safely and cost effectively design URM buildings, this paper has addressed the
influence of the (i) size of the test unit, (ii) loading history, (iii) loading velocity,
and (iv) the boundary conditions on the drift capacities of URM walls in the context
of results obtained from quasi-static cyclic tests, thereby predicting their true drift
limits under earthquake loads. Based on results from 64 monotonic and cyclic tests
on URM walls with clay bricks, cement mortar and joints of normal thickness, it
was found that the drift capacity decreases with increasing wall height. A drift
capacity equation that was recently proposed accounts for this effect as well as the
influence of the axial stress ratio and the shear span ratio on the drift capacity of
URM walls (Petry and Beyer 2014a, b, c).
Comprehensive studies on the effect of the loading history on URM walls are
limited. However, existing studies show that monotonic tests led to drift capacities
that were approximately twice as much as those obtained from cyclic tests. Further-
more, load histories commonly applied to quasi-static cyclic tests were too excessive
and place much higher demands than those expected for low to moderate seismic
earthquakes. This discrepancy in load histories is unlikely to influence the strength of
URM walls, but affects their drift capacity. A comparison of response envelopes of
first and second cycles of quasi-static cyclic tests of URM walls showed that
cumulative damage causes negligible effect on stiffness and strength until a limit
state responsible for irreversible wall damage is reached, i.e., onset of crushing of the
compression zone or concentration of shear deformations in a single diagonal crack.
At the onset of crushing or the concentration of damage in one diagonal crack, the
peak force has been attained but not horizontal or axial load failure. Apart from the
number of cycles, a potential asymmetry of the boundary conditions (e.g., axial load
ratio and shear span ratio) for loading in positive and negative direction can influence
the drift capacity. Such conditions are representative for outer walls where slabs and
spandrels frame into the wall from only one side of the wall, which can lead to large
variations in the axial load of the URM wall under seismic excitation. Since the drift
capacity decreases with increasing axial load ratio, the critical loading direction is the
one for which the axial load increases. The available experimental data suggest that
the drift capacity of a wall subjected to an axial stress ratio three times as high in one
direction than in the other is approximately twice that of a wall subjected to large
axial forces in both loading directions.
Ideally the effect of the loading velocity should be investigated using the same
test setup and loading histories but applying the latter at different speeds as
Tomazevic and his co-workers have done it for reinforced masonry developing
flexural failure modes (Tomazevic et al. 1996; Tomazevic 2000). Unfortunately for
424 K. Beyer et al.

URM walls such results are not yet available. To get a first idea, the drift limits
obtained from quasi-static cyclic tests were compared to drifts recorded for a
4-storey building tested on a shake table and in general a good agreement was
found. To apply the drift limits obtained from quasi-static cyclic tests to the walls in
the shake table test unit, a couple of assumptions regarding their axial forces and
shear spans were required, which were derived from nonlinear static analysis.
Furthermore, the cross section and dimensions of the walls in the shake table test
unit and the walls tested quasi-statically were not the same. All walls were,
however, constructed using the same type of half-scale bricks and cement mortar.
The results presented in this paper therefore confirm that empirical drift capacity
models derived from results of quasi-static cyclic tests can be applied to predict the
performance of URM buildings under real earthquake loading—although attention
should be paid to the effect of asymmetric boundary conditions of outer piers
(captured by the correction factor for the loading history). Future research should,
however, also target the development of mechanical drift capacity models as such
models will foster the understanding of the behaviour of URM walls, allow to
extrapolate with confidence to new configurations of parameters and potentially
also allow to develop masonry types with improved performance. For flexural
behaviour modes such models have recently been proposed (Priestley et al. 2007;
Benedetti and Steli 2006; Petry and Beyer 2014e) but models that address walls
developing shear and hybrid modes are currently lacking.
Acknowledgements The shake table test referenced in Sect. 12.4.1 of this paper received funding
from the European Community’s Seventh Framework Programme [FP7/2007-2013] for access to
TREES laboratory of EUCENTRE under the grant agreement n0 227887. Additional financial
support was received from the Office Federal de l’Environnement (OFEV) in Switzerland. The
reduced scale bricks were fabricated and donated by Morandi Freres SA, Switzerland. The authors
appreciate and gratefully acknowledge all contributions.
Open Access This chapter is distributed under the terms of the Creative Commons Attribution
Noncommercial License, which permits any noncommercial use, distribution, and reproduction in
any medium, provided the original author(s) and source are credited.
References
Abrams D (1996) Effects of scale and loading rate with tests on concrete and masonry structures.
Earthq Spectra 12(1):13–28
ATC (1997) FEMA-273: NEHRP Guidelines for the seismic rehabilitation of buildings. Basic
Procedures Manual. Applied Technology Council (ATC), Washington, DC
ATC (1998) FEMA-306: evaluation of earthquake damaged concrete and masonry wall buildings.
Basic Procedures Manual. Applied Technology Council (ATC), Washington, DC
ATC-24 (1992) Guidelines for cyclic seismic testing of components of steel structures for
buildings. Applied Technology Council, California
Belmouden Y, Lestuzzi P (2009) An equivalent frame model for seismic analysis of masonry and
reinforced concrete buildings. Construct Build Mater 23(1):40–53
12 Seismic Design of Modern Unreinforced Masonry Structures 425
Benaboud H (2013) Effective slab width in URM buildings with RC slabs. M.Sc. Dissertation,
EPFL, 2013
Benedetti A, Steli E (2006) Analytical models for shear-displacement curves of unreinforced and
FRP reinforced masonry walls. Construct Build Mater 22:175–785
Beyer K, Dazio A (2012) Quasi-static monotonic and cyclic tests on composite spandrels. Earthq
Spectra 28(3):885–906
Beyer K, Tondelli M, Petry S, Peloso S (2014) Dynamic testing of a 4-storey building with
reinforced concrete and unreinforced masonry walls. Bull Earthquake Eng (submitted)
Braga F, Liberatore D (1990) A finite element for the analysis of the response of masonry
buildings. Proceedings of the 5th North American Masonry conference, University of Illinois
at Urbana-Champaign
CEN (2005) Eurocode 8: design of structures for earthquake resistance – Part 3: General rules,
seismic actions and rules for buildings. Design Code EN 1998–3, European Committee for
Standardisation (CEN), Brussels, Belgium
Cervenka V, Jendele L, Cervenka J (2010) Atena – computer program for nonlinear finite element
analysis of reinforced concrete structures, Theory and User Manual, Prague, Czech Republic
Chen SY, Moon FL, Yi T (2008) A macroelement for the nonlinear analysis of in-plane
unreinforced masonry walls. Eng Struct 30:2242–2252
Da Pare M (2011) The role of spandrel beams on the seismic response of masonry buildings. M.Sc.
dissertation, MEEES-ROSE School, Pavia, Italy
DIN (2011) National annex – nationally determined parameters – Eurocode 8: design of structures
for earthquake resistance – Part 1: General rules, Seismic actions and rules for buildings.
National Annex of Germany, DIN EN 1998-1/NA: 2011–01, Berlin, Germany
Elgawady E, Lestuzzi P, Badoux M (2004) Dynamic versus static cyclic tests of masonry walls
before and after retrofitting with GFRP. Proceedings of the 13th world conference on earth-
quake engineering, Vancouver, Canada
Facconi L, Plizzari G, Vecchio F (2014) Disturbed Stress Field Model for Unreinforced Masonry.
J. Struct. Eng., 140(4), 04013085Fajfar P (1999) Capacity spectrum method based on inelastic demand spectra. Earthquake Eng
Struct Dyn 28:979–993
FEMA-461 (2007) Interim protocols for determining seismic performance characteristics of
structural and non-structural components through laboratory testing. Federal Emergency
Management Agency, Washington, DC
Frumento S, Magenes G, Morandi P, Calvi GM (2009) Interpretation of experimental shear tests
on clay brick masonry walls and evaluation of q-factors for seismic design. Technical report,
IUSS PRESS, Pavia, Italy
Gambarotta L, Lagomarsino S (1997a) Damage models for the seismic response of brick masonry
shear walls. Part I: The mortar joint model and its applications. Earthquake Eng Struct Dyn
26:423–439
Gambarotta L, Lagomarsino S (1997b) Damage models for the seismic response of brick masonry
shear walls. Part II: The continuum model and its applications. Earthquake Eng Struct Dyn
26:441–462
Ganz HR, Thurlimann B (1984) Versuche an Mauerwerksscheiben unter Normalkraft und
Querkraft. Test Report 7502-4, ETH Zurich, Switzerland, (in German)
Graziotti F (2013) Contributions towards a displacement-based seismic assessment of masonry
structures. PhD thesis, Istituto Universitario di Studi Superiori di Pavia, Pavia, Italy
Krawinkler H (2009) Loading histories for cyclic tests in support of performance assessment of
structural components. 3rd international conference on advances in experimental structural
engineering, San Francisco
Lagomarsino S, Penna A, Galasco A, Cattari S (2013) TREMURI program: an equivalent frame
model for the nonlinear seismic analysis of masonry buildings. Eng Struct 56:1787–1799
Lang K (2002) Seismic vulnerability of existing buildings. PhD thesis, ETH Zurich, Zurich,
Switzerland
426 K. Beyer et al.
Lourenco PB (1997) Two aspects related to the analysis of masonry structures: size effect and
parameter sensitivity. Technical report TU-DELFT No 03.21.1.31.25, Faculty of Engineering,
TU Delft, Delft, The Netherlands
Lourenco PB (2008) Structural masonry analysis: recent developments and prospects. Keynote at
the 14th international brick and block masonry conference, Sydney, Australia
Lourenco PB, Rots JG (1997) Multisurface interface model for the analysis of masonry structures.
J Eng Mech ASCE 123(7):660–668
Magenes G (2006) Masonry building design in seismic areas: Recent experiences. Keynote at the
1st European conference on earthquake engineering and seismology, Geneva, Switzerland
Magenes G, Calvi GM (1992) Cyclic behaviour of brick masonry walls. Proceedings of the 10th
world conference on earthquake engineering, Madrid, Spain
Magenes G, Calvi GM (1997) In-plane seismic response of brick masonry walls. Earthquake Eng
Struct Dyn 26:1091–1112
Marino S (2013) Force-deformation characteristics for composite spandrels. M.Sc. Dissertation,
EPFL/University of Bologna, Italy
Mergos P, Beyer K (2014) Loading protocols for European regions of low to moderate seismicity.
Bull Earthquake Eng online
Milani G (2012) Preface Special Issue: New trends in the numerical analysis of masonry struc-
tures. Open Civil Eng J Suppl 1-M1:119–120
Milani G, Lourenco PB, Tralli A (2006a) Homogenised limit analysis of masonry walls, Part I:
Failure surfaces. Comput Struct 84(3):166–180
Milani G, Lourenco PB, Tralli A (2006b) Homogenised limit analysis of masonry walls, Part II:
Structural examples. Comput Struct 84(3):181–195
MIT (2008) Ministry of Infrastructures and Transportation, Circ. C.S.Ll.Pp. No. 617 of 2/2/2009:
Istruzioni per l’applicazione delle nuove norme tecniche per le costruzioni di cui al Decreto
Ministeriale 14 Gennaio 2008, G.U.S.O. n.27 of 26/2/2009, No. 47, 2008 (in Italian)
Norda H, Butenweg C (2011) Moglichkeiten und Grenzen statisch nichtlinearer Verfahren nach
DIN EN 1998–1. Der Bauingenieur 86:S13–S21
NTC (2008) Decreto Ministeriale 14/1/2008: Norme tecniche per le costruzioni. Ministry of
Infrastructures and Transportations. G.U.S.O. n.30 on 4/2/2008, 2008 (in Italian)
NZSEE (2006) Assessment and improvement of the structural performance of buildings in
earthquakes. New Zealand Society of Earthquake Engineering, University of Auckland,
Auckland, New Zealand
NZSEE (2011) Assessment and improvement of unreinforced masonry buildings for earthquake
resistance. New Zealand Society of Earthquake Engineering, supplement to “Assessment and
improvement of the structural performance of buildings in earthquakes”, University of Auck-
land, Auckland, New Zealand
Paparo A, Beyer K (2014) Quasi-static tests of two mixed reinforced concrete – unreinforced
masonry wall structures. Eng Struct online
Paulay T, Priestley MJN (1992) Seismic design of reinforced concrete and masonry buildings.
Wiley, New York
Penna A, Lagomarsino S, Galasco A (2013) A nonlinear macroelement model for the seismic
analysis of masonry buildings. Earthquake Eng Struct Dyn. doi:10.1002/eqe.2335
Petry S, Beyer K (2014b) Cyclic test data of six unreinforced masonry walls with different
boundary conditions. Earthq Spectra (accepted)
Petry S, Beyer K (2014d) Scaling unreinforced masonry for reduced-scale testing. Bull Earthquake
Eng online
Petry S, Beyer K (2014a) Influence of boundary conditions and size effect on the drift capacity of
URM walls. Eng Struct 65:76–88
Petry S, Beyer K (2014c) Limit states of URM piers subjected to seismic in-plane loading. Bull
Earthquake Eng (submitted to VEESD-special issue)
12 Seismic Design of Modern Unreinforced Masonry Structures 427

Petry S, Beyer K (2014e) Review and improvement of simple mechanical models for predicting
the force-displacement response of URM piers subjected to in-plane loading. Proceedings of
the 2nd European conferences on earthquake engineering and seismology, Istanbul, Turkey
Porter ML (1987) Sequential phased displacement (SPD) procedure for TCCMAR testing. Pro-
ceedings of the 3rd meeting of the joint technical coordinating committee on masonry research,
US-Japan Coordinated Research Program
Priestley MJN, Amaris AD (2002) Dynamic amplification of seismic moments and shear forces in
cantilever walls. Research report ROSE 2002/01, Roseschool, Pavia, Italy
Priestley MJN, Calvi GM, Kowalsky MJ (2007) Displacement-based seismic design of structures.
IUSS Press, Pavia, Italy
Salmanpour AH, Mojsilovic N, Schwartz J (2013) Deformation capacity of unreinforced masonry
walls subjected to in-plane loading: a state-of-the-art review. Int J Adv Struct Eng 5(1):1–12
SIA (2011) SIA D0237: Evaluation de la securite parasismique des batiments en maconnerie.
Swiss Society of Engineers and Architects SIA, Zurich, Switzerland (in French)
Snozzi L, Molinari JF (2013) A cohesive element model for mixed mode loading with frictional
contact capability. Int J Numer Meth Eng 93:510–526
Tomazevic M (2000) Some aspects of experimental testing of seismic behaviour of masonry walls
and models of masonry buildings. ISET J Earthquake Tech 37(4):101–117
Tomazevic M, Lutman M, Petkovic L (1996) Seismic behavior of masonry walls: experimental
simulation. J Struct Eng 122:1040–1047
Tondelli M, Petry S, Beyer K, Peloso S (2014) Data set of a shake table test on a four storey
structure with reinforced concrete and unreinforced masonry walls. Bull Earthquake Eng
(submitted)
Williams D, Scrivener JC (1974) Response of reinforced masonry shear walls to static and
dynamic cyclic loading. In: Proceedings of the 5th world conference on earthquake engineer-
ing, Rome, Italy
Zucchini A, Lourenco PB (2002) A micro-mechanical model for the homogenisation of masonry.
Int J Solid Struct 39:3233–3255
428 K. Beyer et al.