chapter 12 protein structure basics. 20 naturally occurring amino acids free amino group (-nh2) free...
TRANSCRIPT

Chapter 12
Protein Structure Basics

•20 naturally occurring amino acids•Free amino group (-NH2)•Free carboxyl group (-COOH)•Both groups linked to a central carbon (C)


Dihedral Angles

Ramachandran plot

Hierarchy
•Primary structure•Linear sequence of amino acids
•Secondary structure•Local conformation of the peptide chain•Stabilized by H-bonds between NH and C=O of different residues
•Tertiary structure•3 dimensional arrangement of all secondary structure elements and connecting regions
•Quaternary structure•Assembly of several polypeptide chains into a protein complex
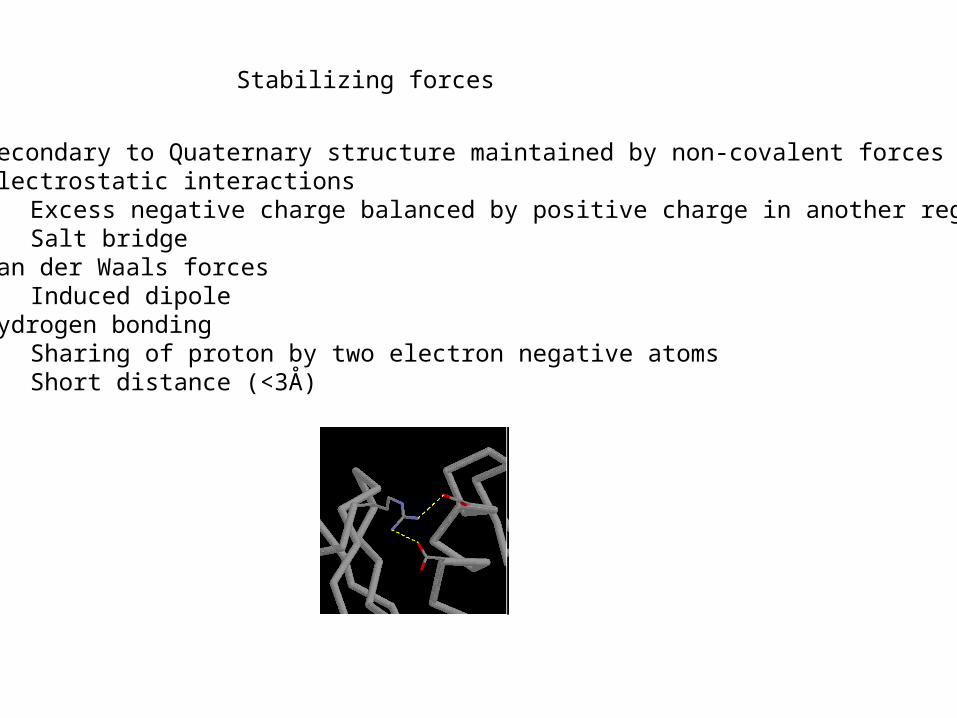
Stabilizing forces
Secondary to Quaternary structure maintained by non-covalent forcesElectrostatic interactions
Excess negative charge balanced by positive charge in another regionSalt bridge
Van der Waals forcesInduced dipole
Hydrogen bondingSharing of proton by two electron negative atomsShort distance (<3Å)

Helices
•3.6 aa per turn=60º=45º•A, Q, L M frequent•P, G, Y scarce

-Sheet
•H-bonded -strands•Parallel•Anti-parallel

Coiled-coil
1KD8

Tertiary Structures
Globular proteins
CompactPolar and hydrophilic aa on the outsideHydrophobic amino acids on the inside
Integral Membrane Proteins
Exist in lipid bilayers Helix segmentsConnecting loopsliein aqueous phase

X-ray crystallography
•Protein crystallized•Illuminated with X-ray beam, and diffraction pattern recorded•Diffraction pattern converted to electron density map by Fourier transformation•To interpret 3D structure from 2D electron density ,map require phase information•Molecular replacement•Use homologous protein structure as template•Multiple isomorphous replacement•Compare e- density changes in protein crystals containing strongly diffracting heavy metals•Model with amino acid residues that best fit the density map

NMR
•Proteins labeled with 13C or 15N•Radiofrequency radiation used to induce nuclear spin state transitions in a magnetic field•Interactions between spinning isotope pairs produce radio signal peaks that correlate with distance between them•Information on distanmces between all pairs allow protein model to be derived•NMR determines structure in solution•Dynamic conformations means that 20-40 structures satisfy distance constrains•Can only solve <200aa proteins

Protein Structure Database
x,y,z position of each atom in crystalhttp://www.rcsb.org/pdb/
0
200
400
600
800
1000
1200
1972 1975 1978 1981 1984 1987 1990 1993 1996 1999 2002 2005 2008
0
10000
20000
30000
40000
50000
60000
1972
1974
1976
1978
1980
1982
1984
1986
1988
1990
1992
1994
1996
1998
2000
2002
2004
2006
2008
Total proteins Total folds
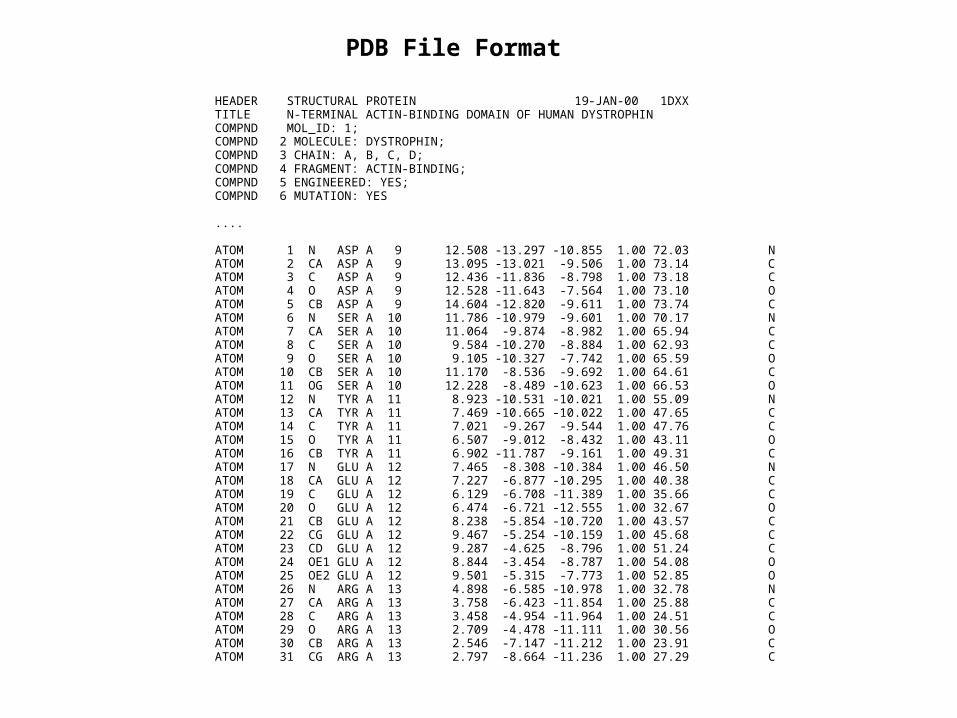
HEADER STRUCTURAL PROTEIN 19-JAN-00 1DXX TITLE N-TERMINAL ACTIN-BINDING DOMAIN OF HUMAN DYSTROPHIN COMPND MOL_ID: 1; COMPND 2 MOLECULE: DYSTROPHIN; COMPND 3 CHAIN: A, B, C, D; COMPND 4 FRAGMENT: ACTIN-BINDING; COMPND 5 ENGINEERED: YES; COMPND 6 MUTATION: YES .... ATOM 1 N ASP A 9 12.508 -13.297 -10.855 1.00 72.03 N ATOM 2 CA ASP A 9 13.095 -13.021 -9.506 1.00 73.14 C ATOM 3 C ASP A 9 12.436 -11.836 -8.798 1.00 73.18 C ATOM 4 O ASP A 9 12.528 -11.643 -7.564 1.00 73.10 O ATOM 5 CB ASP A 9 14.604 -12.820 -9.611 1.00 73.74 C ATOM 6 N SER A 10 11.786 -10.979 -9.601 1.00 70.17 N ATOM 7 CA SER A 10 11.064 -9.874 -8.982 1.00 65.94 C ATOM 8 C SER A 10 9.584 -10.270 -8.884 1.00 62.93 C ATOM 9 O SER A 10 9.105 -10.327 -7.742 1.00 65.59 O ATOM 10 CB SER A 10 11.170 -8.536 -9.692 1.00 64.61 C ATOM 11 OG SER A 10 12.228 -8.489 -10.623 1.00 66.53 O ATOM 12 N TYR A 11 8.923 -10.531 -10.021 1.00 55.09 N ATOM 13 CA TYR A 11 7.469 -10.665 -10.022 1.00 47.65 C ATOM 14 C TYR A 11 7.021 -9.267 -9.544 1.00 47.76 C ATOM 15 O TYR A 11 6.507 -9.012 -8.432 1.00 43.11 O ATOM 16 CB TYR A 11 6.902 -11.787 -9.161 1.00 49.31 C ATOM 17 N GLU A 12 7.465 -8.308 -10.384 1.00 46.50 N ATOM 18 CA GLU A 12 7.227 -6.877 -10.295 1.00 40.38 C ATOM 19 C GLU A 12 6.129 -6.708 -11.389 1.00 35.66 C ATOM 20 O GLU A 12 6.474 -6.721 -12.555 1.00 32.67 O ATOM 21 CB GLU A 12 8.238 -5.854 -10.720 1.00 43.57 C ATOM 22 CG GLU A 12 9.467 -5.254 -10.159 1.00 45.68 C ATOM 23 CD GLU A 12 9.287 -4.625 -8.796 1.00 51.24 C ATOM 24 OE1 GLU A 12 8.844 -3.454 -8.787 1.00 54.08 O ATOM 25 OE2 GLU A 12 9.501 -5.315 -7.773 1.00 52.85 O ATOM 26 N ARG A 13 4.898 -6.585 -10.978 1.00 32.78 N ATOM 27 CA ARG A 13 3.758 -6.423 -11.854 1.00 25.88 C ATOM 28 C ARG A 13 3.458 -4.954 -11.964 1.00 24.51 C ATOM 29 O ARG A 13 2.709 -4.478 -11.111 1.00 30.56 O ATOM 30 CB ARG A 13 2.546 -7.147 -11.212 1.00 23.91 C ATOM 31 CG ARG A 13 2.797 -8.664 -11.236 1.00 27.29 C
PDB File Format

Other structure file formats
mmCIF
•Macromolecular crystallographic information file•Similar to relational database•Each field assigned a tag and linked to another field
MMDB
•Molecular modeling database•ASN.1 format•Nested hierarchy

Chapter 13
Protein structure visualization, comparison and classification

Download and install Jmol
http://jmol.sourceforge.net/
wireframe Ball-and-stick
CPK (Corey, Pauling and Koltan)Cartoon


Protein structure comparisons
Comparing two protein structures is a fundamental technique in protein analysisFinding remote homologsProteins structures can be very similar even if sequence identity is very low (<20%)
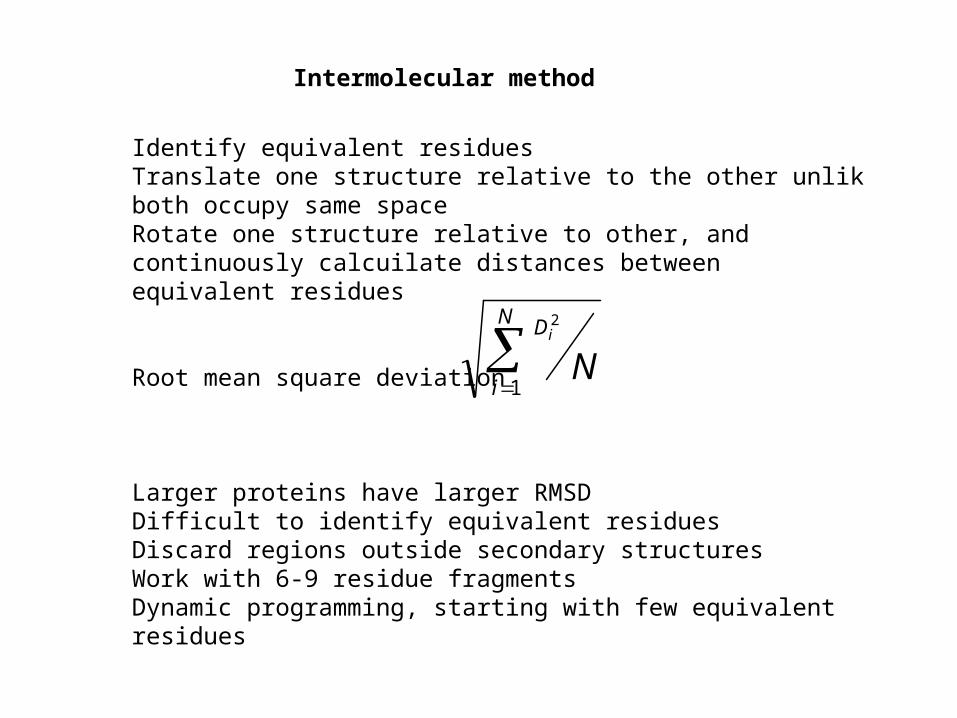
Intermolecular method
Identify equivalent residuesTranslate one structure relative to the other unlik both occupy same spaceRotate one structure relative to other, and continuously calcuilate distances between equivalent residues
Root mean square deviation
Larger proteins have larger RMSDDifficult to identify equivalent residuesDiscard regions outside secondary structuresWork with 6-9 residue fragmentsDynamic programming, starting with few equivalent residues
N
i
D
Ni
1
2

Intramolecular method
•Calculate a distance matrix of all residue distances in two proteins, separately•Translate two matrices until differences are minimal•Good to identify similar secondary structure regions in two proteins

Multiple structure alignment
Compare structures in pairwise fashion, generating matrices based on RSMD scoresConstruct phylogenetic treeTwo must similar structures are realignedMedian structure =created to which other more distant structures are systematically aligned
DALIDistances calculated from intra-molecular C distances matricesMatrices are aligned to find local structural similaritiesCalculate Z-score CE Combinatorial ExtensionLike DALI, but uses every 8th residue
VAST Vector Alignment Search ToolUses intra- and intermolecular approaches
SSAPIntramolecular based methodsDynamic programming to find residue path with optimal score
STAMPIntermolecular approach, using dynamic programming

Protein structure classification
•Classification systems allows identification of relationships between structures•Provide evolutionary view of all structures•Newly solved structures can be fitted into hierarchy, defining possible functions
SCOP (Structural Classification of Proteins)Manual; examination of structuresClasses, folds, families and super familiesFamilies share high sequence homologySuper families may have common ancestral proteinsFolds look at order and connectivity of secondary structures, may not be evolutionary relatedClasses: folds with similar core structures: all-. all-, and , etc.
CATH (Class, architecture, topology and homologs)Uses automatic assignment with SSAP as well as manual comparisonClass similar to SCOPArchitecture intermediate between SCOP fold and class: overall packaging and arrangement of secondary structures without regard for connectivityTopology = SCOP foldHomologous superfamily and homologous family equivalent to SCOP super family and family