chapter 11: the outfall reconnaissance inventory · 2012-09-26 · chapter 11: the outfall...
TRANSCRIPT
Chapter 11: The Outfall Reconnaissance Inventory
Chapter 11: The Outfall Reconnaissance Inventory
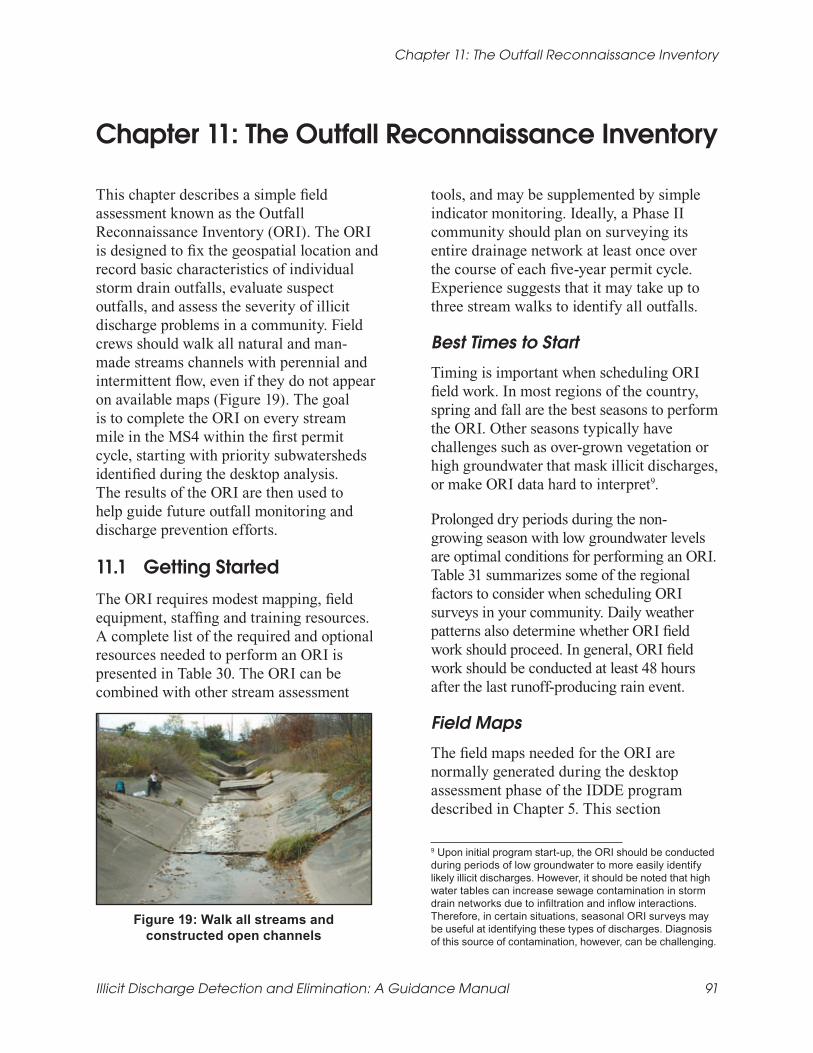
This chapter describes a simple field assessment known as the Outfall Reconnaissance Inventory (ORI). The ORI is designed to fix the geospatial location and record basic characteristics of individual storm drain outfalls, evaluate suspect outfalls, and assess the severity of illicit discharge problems in a community. Field crews should walk all natural and man-made streams channels with perennial and intermittent flow, even if they do not appear on available maps (Figure 19). The goal is to complete the ORI on every stream mile in the MS4 within the first permit cycle, starting with priority subwatersheds identified during the desktop analysis. The results of the ORI are then used to help guide future outfall monitoring and discharge prevention efforts.
11.1 Getting Started
The ORI requires modest mapping, field equipment, staffing and training resources. A complete list of the required and optional resources needed to perform an ORI is presented in Table 30. The ORI can be combined with other stream assessment
Figure 19: Walk all streams and constructed open channels
tools, and may be supplemented by simple indicator monitoring. Ideally, a Phase II community should plan on surveying its entire drainage network at least once over the course of each five-year permit cycle. Experience suggests that it may take up to three stream walks to identify all outfalls.
Best Times to Start
Timing is important when scheduling ORI field work. In most regions of the country, spring and fall are the best seasons to perform the ORI. Other seasons typically have challenges such as over-grown vegetation or high groundwater that mask illicit discharges, or make ORI data hard to interpret9.
Prolonged dry periods during the non-growing season with low groundwater levels are optimal conditions for performing an ORI. Table 31 summarizes some of the regional factors to consider when scheduling ORI surveys in your community. Daily weather patterns also determine whether ORI field work should proceed. In general, ORI field work should be conducted at least 48 hours after the last runoff-producing rain event.
Field Maps
The field maps needed for the ORI are normally generated during the desktop assessment phase of the IDDE program described in Chapter 5. This section
9 Upon initial program start-up, the ORI should be conducted during periods of low groundwater to more easily identify likely illicit discharges. However, it should be noted that high water tables can increase sewage contamination in storm drain networks due to infiltration and inflow interactions. Therefore, in certain situations, seasonal ORI surveys may be useful at identifying these types of discharges. Diagnosis of this source of contamination, however, can be challenging.
Illicit Discharge Detection and Elimination: A Guidance Manual 91

Chapter 11: The Outfall Reconnaissance Inventory
Table 30: Resources Needed to Conduct the ORI
Need Area Minimum Needed Optional but Helpful
Mapping • Roads • Streams
• Known problem areas • Major land uses • Outfalls • Specific industries • Storm drain network • SIC-coded buildings • Septics
Field Equipment
• 5 one-liter sample bottles • Backpack • Camera (preferably digital) • Cell phones or hand-held radios • Clip boards and pencils • Field sheets • First aid kit • Flash light or head lamp • GPS unit • Spray paint (or other marker) • Surgical gloves • Tape measure • Temperature probe • Waders (snake proof where necessary) • Watch with a second hand
• Portable Spectrophotometer and reagents (can be shared among crews)
• Insect repellant • Machete/clippers • Sanitary wipes or biodegradable soap • Wide-mouth container to measure flow • Test strips or probes (e.g., pH and
ammonia)
Staff • Basic training on field methodology • Minimum two staff per crew
• Ability to track discharges up the drainage system
• Knowledge of drainage area, to identify probable sources.
• Knowledge of basic chemistry and biology
Table 31: Preferred Climate/Weather Considerations for Conducting the ORI
Preferred Condition Reason Notes/Regional Factors
Low groundwater (e.g., very few flowing outfalls)
High groundwater can confound results
In cold regions, do not conduct the ORI in the early spring, when the ground is saturated from snowmelt.
No runoff-producing rainfall within 48 hours
Reduces the confounding influence of storm water
The specific time frame may vary depending on the drainage system.
Dry Season Allows for more days of field work
Applies in regions of the country with a “wet/ dry seasonal pattern.” This pattern is most pronounced in states bordering or slightly interior to the Gulf of Mexico or the Pacific Ocean.
Leaf Off Dense vegetation makes finding outfalls difficult
Dense vegetation is most problematic in the southeastern United States. This criterion is helpful but not required.
Illicit Discharge Detection and Elimination: A Guidance Manual 92

Chapter 11: The Outfall Reconnaissance Inventory
provides guidance on the basic requirements for good field maps. First, ORI field maps do not need to be fancy. The scale and level of mapping detail will vary based on preferences and navigational skills of field crews. At a minimum, maps should have labeled streets and hydrologic features (USGS blue line streams, wetlands, and lakes), so field crews can orient themselves and record their findings spatially.
Field maps should delineate the contributing drainage area to major outfalls, but only if they are readily available. Urban landmarks such as land use, property boundaries, and storm drain infrastructure are also quite useful in the field. ORI field maps should be used to check the accuracy and quality of pre-existing mapping information, such as the location of outfalls and stream origins.
Basic street maps offer the advantage of simplicity, availability, and well-labeled road networks and urban landmarks. Supplemental maps such as a 1”: 2000’ scale USGS Quad sheet or finer scale aerial photograph are also recommended for the field. USGS Quad sheets are readily available and display major transportation networks and landmarks, “blue line” streams, wetlands, and topography. Quad maps may be adequate for less developed subwatersheds, but are not always accurate in more urban subwatersheds.
Recent aerial photographs may provide the best opportunity to navigate the subwatershed and assess existing land cover. Aerial photos, however, may lack topography and road names, can be costly, and are hard to record field notes on due to their darkness. GIS-ready aerial photos and USGS Quad sheets can be downloaded from the internet or obtained from local planning, parks, or public works agencies.
Field Sheets
ORI field sheets are used to record descriptive and quantitative information about each outfall inventoried in the field. Data from the field sheets represent the building blocks of an outfall tracking system allowing program managers to improve IDDE monitoring and management. A copy of the ORI field sheet is provided in Appendix D, and is also available as a Microsoft Word™ document. Program managers should modify the field sheet to meet the specific needs and unique conditions in their community.
Field crews should also carry an authorization letter and a list of emergency phone numbers to report any emergency leaks, spills, obvious illicit discharges or other water quality problems to the appropriate local authorities directly from the field. Local law enforcement agencies may also need to be made aware of the field work. Figure 20 shows an example of a water pollution emergency contact list developed by Montgomery County, MD.
Equipment
Basic field equipment needed for the ORI includes waders, a measuring tape, watch, camera, GPS unit, and surgical gloves (see Table 30). GPS units and digital cameras are usually the most expensive equipment items; however, some local agencies may already have them for other applications. Adequate ranging, water-resistant, downloadable GPS units can be purchased for less than $150. Digital cameras are preferred and can cost between $200 and $400, however, conventional or disposable cameras can also work, as long as they have flashes. Hand-held data recorders and customized software can be used to record text, photos, and GPS coordinates electronically in the field. While
Illicit Discharge Detection and Elimination: A Guidance Manual 93

Chapter 11: The Outfall Reconnaissance Inventory
these technologies can eliminate field sheets and data entry procedures, they can be quite expensive. Field crews should always carry basic safety items, such as cell phones, surgical gloves, and first aid kits.
Staffing
The ORI requires at least a two-person crew, for safety and logistics. Three person crews provide greater safety and flexibility, which helps divide tasks, allows one person to assess adjacent land uses, and facilitates tracing outfalls to their source. All crew members should be trained on how to complete the ORI and should have a basic understanding of illicit discharges and their water quality impact. ORI crews can be staffed by trained volunteers, watershed groups and college interns. Experienced crews can normally expect to cover two to three stream miles per day, depending on stream access and outfall density.
Figure 20: Example of a comprehensive emergency contact list for Montgomery County, MD
11.2 Desktop Analysis to Support the ORI
Two tasks need to be done in the office before heading out to the field. The major ORI preparation tasks include estimating the total stream and channel mileage in the subwatershed and generating field maps. The total mileage helps program managers scope out how long the ORI will take and how much it will cost. As discussed before, field maps are an indispensable navigational aid for field crews working in the subwatershed.
Delineating Survey Reaches
ORI field maps should contain a preliminary delineation of survey reaches. The stream network within your subwatershed should be delineated into discrete segments of relatively uniform character. Delineating survey reaches provides good stopping and starting points for field crews, which
Illicit Discharge Detection and Elimination: A Guidance Manual 94

Chapter 11: The Outfall Reconnaissance Inventory
is useful from a data management and logistics standpoint. Each survey reach should have its own unique identifying number to facilitate ORI data analysis and interpretation. Figure 21 illustrates some tips for delineating survey reaches, and additional guidance is offered below:
• Survey reaches should be established above the confluence of streams and between road crossings that serve as a convenient access point.
• Survey reaches should be defined at the transition between major changes in land use in the stream corridor (e.g. forested land to commercial area).
• Survey reaches should generally be limited to a quarter mile or less in length. Survey reaches in lightly
developed subwatersheds can be longer than those in more developed subwatersheds, particularly if uniform stream corridor conditions are expected throughout the survey reach.
• Access through private or public property should be considered when delineating survey reaches as permission may be required.
It should be noted that initial field maps are not always accurate, and changes may need to be made in the field to adjust survey reaches to account for conditions such as underground streams, missing streams or long culverts. Nevertheless, upfront time invested in delineating survey reaches makes it easier for field crews to perform the ORI.
a b
c d
Figure 21: Various physical factors control how survey reaches are delineated. (a) Survey reaches based on the confluence of stream tributaries. (b) A long tributary split into ¼ mile survey reaches.
(c) Based on a major road crossing (include the culvert in the downstream reach). (d) Based on significant changes in land use (significant changes in stream features often occur at road crossings,
and these crossings often define the breakpoints between survey reaches).
Illicit Discharge Detection and Elimination: A Guidance Manual 95

Chapter 11: The Outfall Reconnaissance Inventory
11.3 Completing the ORI
Field crews conduct an ORI by walking all streams and channels to find outfalls, record their location spatially with a GPS unit and physically mark them with spray paint or other permanent marker. Crews also photograph each outfall and characterize its dimensions, shape, and component material, and record observations on basic sensory and physical indicators. If dry weather flow occurs at the outfall, additional flow and water quality data are collected. Field crews may also use field probes or test strips to measure indicators such as temperature, pH, and ammonia at flowing outfalls.
The ORI field sheet is divided into eight sections that address both flowing and non-flowing outfalls (Appendix D). Guidance on completing each section of the ORI field sheet is presented below.
Outfalls to Survey
The ORI applies to all outfalls encountered during the stream walk, regardless of diameter, with a few exceptions noted in Table 32. Common outfall conditions seen in communities are illustrated in Figure 22 As a rule, crews should only omit an outfall if they can definitively conclude it has no potential to contribute to a transitory illicit discharge. While EPA’s Phase I guidance only targeted major outfalls (diameter of 36 inches or greater), documenting all outfalls is recommended, since smaller pipes make up the majority of all outfalls and frequently have illicit discharges (Pitt et al., 1993 and Lalor, 1994). A separate ORI field sheet should be completed for each outfall.
Table 32: Outfalls to Include in the Screening
Outfalls to Record Outfalls to Skip
• Both large and small diameter pipes that appear to be part of the storm drain infrastructure
• Outfalls that appear to be piped headwater streams
• Field connections to culverts
• Submerged or partially submerged outfalls
• Outfalls that are blocked with debris or sediment deposits
• Pipes that appear to be outfalls from storm water treatment practices
• Small diameter ductile iron pipes
• Pipes that appear to only drain roof downspouts but that are subsurface, preventing definitive confirmation
• Drop inlets from roads in culverts (unless evidence of illegal dumping, dumpster leaks, etc.)
• Cross-drainage culverts in transportation right-of-way (i.e., can see daylight at other end)
• Weep holes
• Flexible HDPE pipes that are known to serve as slope drains
• Pipes that are clearly connected to roof downspouts via above-ground connections
Illicit Discharge Detection and Elimination: A Guidance Manual 96

Ductile iron round pipe 4-6” HDPE; Check if roof leader connection (legal)
Field connection to inside of culvert; Always mark and record.
Small diameter (<2”) HDPE; Often a sump pump (legal), or may be used to discharge laundry water (illicit).
Elliptical RCP; Measure both horizontal and vertical diameters.
Double RCP round pipes; Mark as separate outfalls unless known to
connect immediately up-pipe
Culvert (can see to other side); Don’t mark as an outfall
Open channel “chute” from commercial parking lot; Very unlikely
illicit discharge. Mark, but do not return to sample (unless there is an
obvious problem).
Small diameter PVC pipe; Mark, and look up-pipe to find the origin.
CMP outfall; Crews should also note upstream sewer crossing.
Box shaped outfall CMP round pipe with two weep holes at bridge crossing. (Don’t
mark weep holes)
Figure 22: Typical Outfall Types Found in the Field
Chapter 11: The Outfall Reconnaissance Inventory
Illicit Discharge Detection and Elimination: A Guidance Manual 97

Chapter 11: The Outfall Reconnaissance Inventory
Obvious Discharges
Field crews may occasionally encounter an obvious illicit discharge of sewage or other pollutants, typified by high turbidity, odors, floatables and unusual colors. When obvious discharges are encountered, field crews should STOP the ORI survey, track down the source of the discharge and immediately contact the appropriate water pollution agency for enforcement. Crews should photo-document the discharge, estimate its flow volume and collect a sample for water quality analysis (if this can be done safely). All three kinds of evidence are extremely helpful to support subsequent enforcement. Chapter 13 provides details on techniques to track down individual discharges.
11.4 ORI Section 1 - Background Data
The first section of the ORI field sheet is used to record basic data about the survey, including time of day, GPS coordinates for the outfall, field crew members, and current
and past weather conditions (Figure 23). Much of the information in this section is self-explanatory, and is used to create an accurate record of when, where, and under what conditions ORI data were collected.
Every outfall should be photographed and marked by directly writing a unique identifying number on each outfall that serves as its subwatershed “address” (Figure 24). Crews can use spray paint or another temporary marker to mark outfalls, but may decide to replace temporary markings with permanent ones if the ORI is repeated later. Markings help crews confirm outfall locations during future investigations, and gives citizens a better way to report the location of spills or discharges when calling a water pollution hotline. Crews should mark the spatial location of all outfalls they encounter directly on field maps, and record the coordinates with a GPS unit that is accurate to within 10 feet. Crews should take a digital photo of each outfall, and record photo numbers in Section 1 of the field sheet.
Figure 23: Section 1 of the ORI Field Sheet
Illicit Discharge Detection and Elimination: A Guidance Manual 98

Figure 24: Labeling an outfall (a variety of outfall naming conventions can be used)
The land use of the drainage area contributing to the outfall should also be recorded. This may not always be easy to characterize at
Chapter 11: The Outfall Reconnaissance Inventory
large diameter outfalls that drain dozens or even hundreds of acres (unless you have aerial photographs). On the other hand, land use can be easily observed at smaller diameter outfalls, and in some cases, the specific origin can be found (e.g., a roof leader or a parking lot; Figure 25). The specific origin should be recorded in the “notes” portion of Section 1 on the field sheet.
11.5 ORI Section 2 - Outfall Description
This part of the ORI field sheet is where basic outfall characteristics are noted (Figure 26). These include material, and presence of flow at the outfall, as well as the pipe’s dimensions (Figure 27). These measurements are used to confirm and supplement existing storm drain maps (if they are available). Many communities only map storm drain outfalls that exceed a given pipe diameter, and may not contain data on the material and condition of the pipe.
Figure 25: The origin of this corrugated plastic pipe was determined to be a roof leader from the house up the hill.
Illicit Discharge Detection and Elimination: A Guidance Manual 99

Chapter 11: The Outfall Reconnaissance Inventory
Section 2 of the field sheet also asks if the outfall is submerged in water or obstructed by sediment and the amount of flow, if present. Figure 28 provides some photos that illustrate how to characterize relative
submergence, deposition and flow at outfalls. If no flow is observed at the outfall, you can skip the next two sections of the ORI field sheet and continue with Section 5.
Figure 26: Section 2 of the ORI Field Sheet
Figure 27: Measuring Outfall Diameter
Illicit Discharge Detection and Elimination: A Guidance Manual 100

Submerged: More than ½ below water
Partially submerged: Bottom is below water
Fully submerged: Can’t see outfall
Outfall fully submerged by debris Fully submerged from downstream trees trapping debris
Partially submerged by leaf debris “back water”
Trickle Flow: Very narrow stream of water
Moderate Flow: Steady stream, but very shallow depth
Significant flow (Source is a fire hydrant discharge)
Figure 28: Characterizing Submersion and Flow
Chapter 11: The Outfall Reconnaissance Inventory
11.6 ORI Section 3 - Quantitative Characterization for Flowing Outfalls
This section of the ORI records direct measurements of flowing outfalls, such as flow, temperature, pH and ammonia (Figure 29). If desired, additional water quality
parameters can be added to this section. Chapter 12 discusses the range of water quality parameters that can be used.
Field crews measure the rate of flow using one of two techniques. The first technique simply records the time it takes to fill a container of a known volume, such as a one liter sample bottle. In the second technique,
Illicit Discharge Detection and Elimination: A Guidance Manual 101

Chapter 11: The Outfall Reconnaissance Inventory
Figure 29: Section 3 of the ORI Field Sheet
the crew measures the velocity of flow, and multiplies it by the estimated cross sectional area of the flow.
To use the flow volume technique, it may be necessary to use a “homemade” container to capture flow, such as a cut out plastic milk container that is marked to show a one liter volume. The shape and flexibility of plastic containers allows crews to capture relatively flat and shallow flow (Figure 30). The flow volume is determined as the volume of flow captured in the container per unit time.
The second technique measures flow rate based on velocity and cross sectional area, and is preferred for larger discharges where containers are too small to effectively capture the flow (Figure 31). The crew measures and marks off a fixed flow length (usually about five feet), crumbles leaves or other light material, and drops them into the discharge (crews can also carry peanuts or ping pong balls to use). The crew then measures the time it takes the marker to travel across the length. The velocity of flow is computed as the length of the flow path (in feet) divided by the travel time (in seconds). Next, the cross-sectional flow area is measured by taking multiple readings of the depth and width of flow. Lastly, cross-
sectional area (in square feet) is multiplied by flow velocity (feet/second) to calculate the flow rate (in cubic feet/second).
Crews may also want to measure the quality of the discharge using relatively inexpensive probes and test strips (e.g., water tempera-ture, pH, and ammonia). The choice of which indicator parameters to measure is usually governed by the overall IDDE monitoring framework developed by the community. Some communities have used probes or test strips to measure additional indicators such as conductivity, chlorine, and hardness. Research by Pitt (for this project) suggests that probes by Horiba for pH and conductivity are the most reliable and
Figure 30: Measuring flow (as volume per time)
Illicit Discharge Detection and Elimination: A Guidance Manual 102

accurate, and that test strips have limited value.
When probes or test strips are used, measurements should be made from a sample bottle that contains flow captured from the outfall. The exact measurement recorded by the field probe should be recorded in Section 3 of the field sheet. Some interpolation may be required for test strips, but do not interpolate further than the mid-range between two color points.
11.7 ORI Section 4 – Physical Indicators for Flowing Outfalls Only
This section of the ORI field sheet records data about four sensory indicators associated with flowing outfalls — odor, color, turbidity and floatables (Figure 32). Sensory indicators can be detected by smell or sight, and require no measurement equipment. Sensory indicators do not always reliably predict illicit discharge, since the senses can be fooled, and may result in a “false negative” (i.e., sensory indicators fail to detect an illicit discharge when one is actually present). Sensory indicators are important, however, in detecting the most severe or obvious discharges. Section 4 of the field sheet asks whether the sensory indicator is present, and if so, what is its severity, on a scale of one to three.
Chapter 11: The Outfall Reconnaissance Inventory
Step 1: Measure flow depth
Figure 31: Measuring flow (as velocity times cross-sectional area)
Step 2: Measure flow width
Step 3: Time the travel of a light object (e.g., leaves) along a known
distance to calculate velocity
Figure 32: Section 4 of the ORI Field Sheet
Illicit Discharge Detection and Elimination: A Guidance Manual 103

Chapter 11: The Outfall Reconnaissance Inventory
Odor
Section 4 asks for a description of any odors that emanate from the outfall and an associated severity score. Since noses have different sensitivities, the entire field crew should reach consensus about whether an odor is present and how severe it is. A severity score of one means that the odor is faint or the crew cannot agree on its presence or origin. A score of two indicates a moderate odor within the pipe. A score of three is assigned if the odor is so strong that the crew smells it a considerable distance away from the outfall.
TIP Make sure the origin of the odor is the
outfall. Sometimes shrubs, trash or carrion, or even the spray paint used to mark the outfall can confuse the noses
of field crews.
Color
The color of the discharge, which can be clear, slightly tinted, or intense is recorded next. Color can be quantitatively analyzed in the lab, but the ORI only asks for a visual assessment of the discharge color and its intensity. The best way to measure color is to collect the discharge in a clear sample bottle and hold it up to the light (Figure 33). Field crews should also look for downstream plumes of color that appear to be associated with the outfall. Figure 34 illustrates the spectrum of colors that may be encountered during an ORI survey, and offers insight on how to rank the relative intensity or strength of discharge color. Color often helps identify industrial discharges; Appendix K provides guidance on colors often associated with specific industrial operations.
Turbidity
The ORI asks for a visual estimate of the turbidity of the discharge, which is a measure of the cloudiness of the water. Like color, turbidity is best observed in a clear sample bottle, and can be quantitatively measured using field probes. Crews should also look for turbidity in the plunge pool below the outfall, and note any downstream turbidity plumes that appear to be related to the outfall. Field crews can sometimes confuse turbidity with color, which are related but are not the same. Remember, turbidity is a measure of how easily light can penetrate through the sample bottle, whereas color is defined by the tint or intensity of the color observed. Figure 34 provides some examples of how to distinguish turbidity from color, and how to rank its relative severity.
Figure 33: Using a sample bottle to estimate color and turbidity
Illicit Discharge Detection and Elimination: A Guidance Manual 104

Sewage Discharge Color: 3
Turbidity: 3
Color: Brown; Severity: 2 Color: Blue-green; Severity: 3 Highly Turbid DischargeTurbidity Severity: 2 Turbidity Severity: 2 Color: Brown; Severity: 3
Turbidity Severity: 3
Paint Color: White; Severity: 3
Turbidity: 3
Failing Septic System: Turbidity Severity: 3
Iron Floc Color: Reddish Orange; Severity: 3
(Often associated with a natural source)
Slight TurbidityTurbidity: 1
(Difficult to interpret this observation;May be natural or an illicit discharge)
Industrial Discharge Color: Green; Severity: 3
Turbidity Severity: 3
Blood Color: Red; Severity: 3 Turbidity Severity: None
Turbidity in Downstream Plume Turbidity Severity: 2
(also confirm with sample bottle)
High Turbidity in Pool Turbidity Severity: 2
(Confirm with sample bottle)
Figure 34: Interpreting Color and Turbidity
Construction Site Discharge
Turbidity Severity: 3
Discharge of Rinse from Floor Sanding (Found during wet
weather) Turbidity Severity: 3
Chapter 11: The Outfall Reconnaissance Inventory
Illicit Discharge Detection and Elimination: A Guidance Manual 105
Chapter 11: The Outfall Reconnaissance Inventory
Floatables
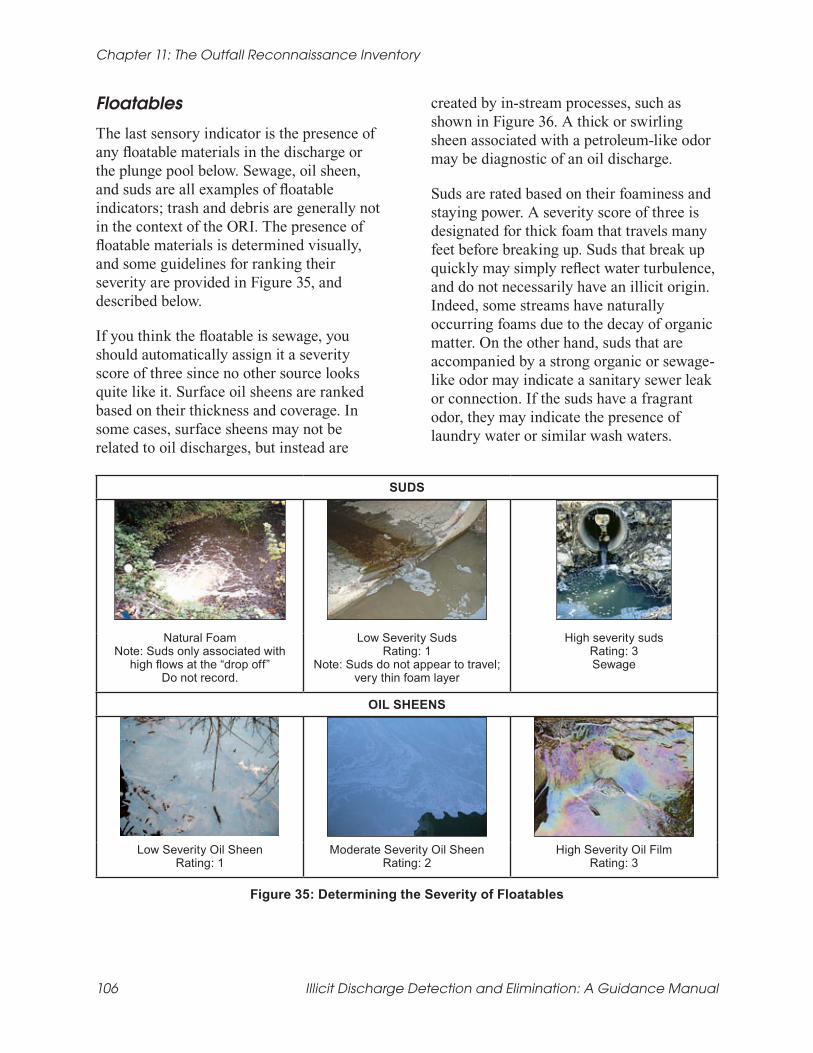
The last sensory indicator is the presence of any floatable materials in the discharge or the plunge pool below. Sewage, oil sheen, and suds are all examples of floatable indicators; trash and debris are generally not in the context of the ORI. The presence of floatable materials is determined visually, and some guidelines for ranking their severity are provided in Figure 35, and described below.
If you think the floatable is sewage, you should automatically assign it a severity score of three since no other source looks quite like it. Surface oil sheens are ranked based on their thickness and coverage. In some cases, surface sheens may not be related to oil discharges, but instead are
created by in-stream processes, such as shown in Figure 36. A thick or swirling sheen associated with a petroleum-like odor may be diagnostic of an oil discharge.
Suds are rated based on their foaminess and staying power. A severity score of three is designated for thick foam that travels many feet before breaking up. Suds that break up quickly may simply reflect water turbulence, and do not necessarily have an illicit origin. Indeed, some streams have naturally occurring foams due to the decay of organic matter. On the other hand, suds that are accompanied by a strong organic or sewage-like odor may indicate a sanitary sewer leak or connection. If the suds have a fragrant odor, they may indicate the presence of laundry water or similar wash waters.
Illicit Discharge Detection and Elimination: A Guidance Manual 106
SUDS
Natural Foam Note: Suds only associated with
high flows at the “drop off” Do not record.
Low Severity Suds Rating: 1
Note: Suds do not appear to travel; very thin foam layer
High severity suds Rating: 3 Sewage
OIL SHEENS
Low Severity Oil Sheen Rating: 1
Moderate Severity Oil Sheen Rating: 2
High Severity Oil Film Rating: 3
Figure 35: Determining the Severity of Floatables

Chapter 11: The Outfall Reconnaissance Inventory
Figure 36: Synthetic versus Natural Sheen (a) Sheen from bacteria such as iron floc forms a sheet-like film that cracks if disturbed (b) Synthetic oil forms a swirling pattern
11.8 ORI Section 5 - Physical Indicators for Both Flowing and Non-Flowing Outfalls
Section 5 of the ORI field sheet examines physical indicators found at both flowing and non-flowing outfalls that can reveal the impact of past discharges (Figure 37). Physical indicators include outfall damage, outfall deposits or stains, abnormal vegetation growth, poor pool quality, and benthic growth on pipe surfaces. Common
examples of physical indicators are portrayed in Figures 38 and 39. Many of these physical conditions can indicate that an intermittent or transitory discharge has occurred in the past, even if the pipe is not currently flowing. Physical indicators are not ranked according to their severity, because they are often subtle, difficult to interpret and could be caused by other sources. Still, physical indicators can provide strong clues about the discharge history of a storm water outfall, particularly if other discharge indicators accompany them.
Illicit Discharge Detection and Elimination: A Guidance Manual 107
Section 5: Physical Indicators for Both Flowing and Non-Flowing Outfalls Are physical indicators that are not related to flow present? Yes No (If No, Skip to Section 6)
Outfall Damage
INDICATOR CHECK if Present
Spalling, Cracking or Chipping Peeling Paint Corrosion
DESCRIPTION COMMENTS
Deposits/Stains Oily Flow Line Paint Other:
Abnormal Vegetation
Poor pool quality
Excessive Inhibited
Odors Colors Floatables Oil Sheen Suds Excessive Algae Other:
Pipe benthic growth Brown Orange Green Other:
Figure 37: Section 5 of the ORI Field Sheet

Bacterial growth at this outfall indicates nutrient enrichment and a
likely sewage source.
This bright red bacterial growth often indicates high manganese and iron concentrations. Surprisingly, it is not typically associated with illicit
discharges.
Sporalitis filamentous bacteria, also known as “sewage fungus” can be used to track down sanitary sewer
leaks.
`
Algal mats on lakes indicate eutrophication. Several sources
can cause this problem. Investigate potential illicit sources.
Illicit discharges or excessive nutrient application can lead to extreme algal growth on stream
beds.
The drainage to this outfall most likely has a high nutrient concentration. The cause may
be an illicit discharge, but may be excessive use of lawn chemicals.
This brownish algae indicates an elevated nutrient level.
Figure 38: Interpreting Benthic and Other Biotic Indicators
Chapter 11: The Outfall Reconnaissance Inventory
Illicit Discharge Detection and Elimination: A Guidance Manual 108

Reddish staining on the rocks below this outfall indicate high iron
concentrations.
Toilet paper directly below the storm drain outlet.
Watershed Protection??
Trash is not an indicator of illicit discharges, but should be noted.
Staining at the base of the outfall may indicate a persistent,
intermittent discharge.
Excessive vegetation may indicate enriched flows associated with
sewage.
Brownish stain of unclear origin. May be from degradation of the
brick infrastructure.
Cracked rock below the outfall may indicate an intermittent discharge.
Poor pool quality. Consider sampling from the pool to determine origin.
Figure 39: Typical Findings at Both Flowing and Non-Flowing Outfalls
Chapter 11: The Outfall Reconnaissance Inventory
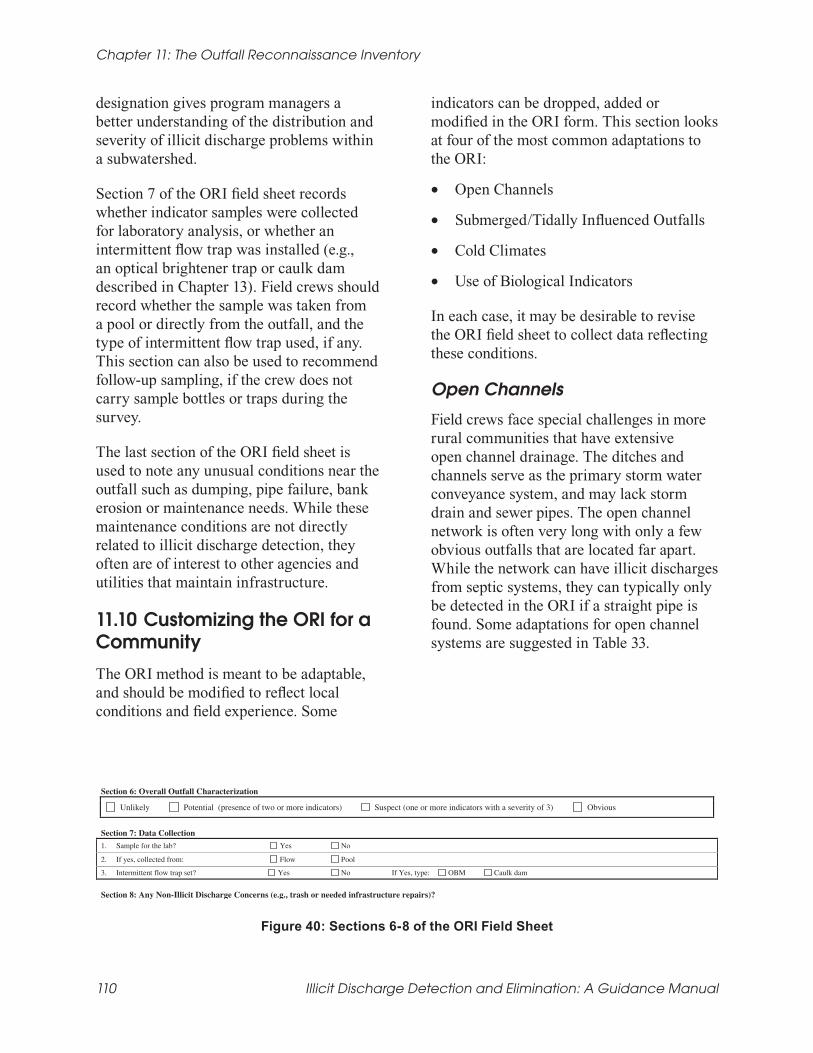
11.9 ORI Sections 6-8 - Initial Outfall Designation and Actions
The last three sections of the ORI field sheet are where the crew designates the illicit discharge severity of the outfall and recommends appropriate management and monitoring actions (Figure 40). A discharge rating is designated as obvious, suspect,
potential or unlikely, depending on the number and severity of discharge indicators checked in preceding sections.
It is important to understand that the ORI designation is only an initial determination of discharge potential. A more certain determination as to whether it actually is an illicit discharge is made using a more sophisticated indicator monitoring method. Nevertheless, the ORI outfall
Illicit Discharge Detection and Elimination: A Guidance Manual 109
Chapter 11: The Outfall Reconnaissance Inventory
designation gives program managers a better understanding of the distribution and severity of illicit discharge problems within a subwatershed.
Section 7 of the ORI field sheet records whether indicator samples were collected for laboratory analysis, or whether an intermittent flow trap was installed (e.g., an optical brightener trap or caulk dam described in Chapter 13). Field crews should record whether the sample was taken from a pool or directly from the outfall, and the type of intermittent flow trap used, if any. This section can also be used to recommend follow-up sampling, if the crew does not carry sample bottles or traps during the survey.
The last section of the ORI field sheet is used to note any unusual conditions near the outfall such as dumping, pipe failure, bank erosion or maintenance needs. While these maintenance conditions are not directly related to illicit discharge detection, they often are of interest to other agencies and utilities that maintain infrastructure.
11.10 Customizing the ORI for a Community
The ORI method is meant to be adaptable, and should be modified to reflect local conditions and field experience. Some
indicators can be dropped, added or modified in the ORI form. This section looks at four of the most common adaptations to the ORI:
• Open Channels
• Submerged/Tidally Influenced Outfalls
• Cold Climates
• Use of Biological Indicators
In each case, it may be desirable to revise the ORI field sheet to collect data reflecting these conditions.
Open Channels
Field crews face special challenges in more rural communities that have extensive open channel drainage. The ditches and channels serve as the primary storm water conveyance system, and may lack storm drain and sewer pipes. The open channel network is often very long with only a few obvious outfalls that are located far apart. While the network can have illicit discharges from septic systems, they can typically only be detected in the ORI if a straight pipe is found. Some adaptations for open channel systems are suggested in Table 33.
Figure 40: Sections 6-8 of the ORI Field Sheet
Illicit Discharge Detection and Elimination: A Guidance Manual 110

Chapter 11: The Outfall Reconnaissance Inventory
Submerged/Tidally Influenced Outfalls
The ORI can be problematic in coastal communities where outfalls are located along the waterfront and may be submerged at high tide. The ORI methods need to be significantly changed to address these constraints. Often, outfalls are initially located from offshore using canoes or boats, and then traced landward to the first manhole that is not tidally influenced. Field crews then access the storm drain pipe at the manhole and measure whatever indicators they can observe in the confined and dimly lit space. Table 33 recommends strategies to sample outfalls in the challenging environment of coastal communities.
Winter and Ice
Ice can be used as a discharge indicator in northern regions when ice forms in streams and pipes during the winter months (Figure 41). Because ice lasts for many weeks, and most illicit discharges are warm, astute field crews can interpret outfall history from ice melting patterns along pipes and streams. For example, exaggerated
melting at a frozen or flowing outfall may indicate warm water from sewage or industrial discharge. Be careful, because groundwater is warm enough to cause some melting at below freezing temperatures. Also, ice acts like an intermittent flow trap, and literally freezes these discharges. Crews should also look for these traps to find any discolored ice within the pipe or below the outfall.
A final winter indicator is “rime ice,” which forms when steam freezes. This beautiful ice formation is actually a good indicator of sewage or other relatively hot discharge that causes steam to form (Figure 41).
Biological Indicators
The diversity and pollution tolerance of various species of aquatic life are widely used as an indicator of overall stream health, and has sometimes been used to detect illicit discharges. One notable example is the presence of the red-eared slider turtle, which is used in Galveston, Texas to find sewage discharges, as they have a propensity for the nutrient rich waters associated with sewage (Figure 42).
Table 33: Special Considerations for Open Channels/Submerged Outfalls
OPEN CHANNELS
Challenge Suggested Modification
Too many miles of channel to walk Stop walking at a given channel size or drainage area Difficulty marking them Mark on concrete or adjacent to earth channel Interpreting physical indicators For open channels with mild physical indicators, progress up
the system to investigate further.
SUBMERGED/TIDALLY INFLUENCED OUTFALLS
Challenge Suggested Modification
Access for ORI – Tidal Influence Access during low tide Access for ORI – Always submerged Access by boat or by shore walking Interpreting physical indicators For outfalls with mild physical indicators, also inspect from the
nearest manhole that is not influenced by tides Sampling (if necessary) Sample “up pipe”
Illicit Discharge Detection and Elimination: A Guidance Manual 111

Chapter 11: The Outfall Reconnaissance Inventory
Figure 41: Cold climate indicators of illicit discharges
Figure 42: One biological indicator is this red-eared
slider turtle
11.11 Interpreting ORI Data
The ORI generates a wealth of information that can provide managers with valuable insights about their illicit discharge problems, if the data are managed and analyzed effectively. The ORI can quickly define whether problems are clustered in a particular area or spread across the community. This section presents a series of methods to compile, organize and interpret ORI data, including:
1. Basic Data Management and Quality Control
2. Outfall Classification
3. Simple Suspect Outfall Counts
4. Mapping ORI Data
5. Subwatershed and Reach Screening
6. Characterizing IDDE Problems at the Community Level
The level of detail for each analysis method should be calibrated to local resources, program goals, and the actual discharge problems discovered in the stream corridor. In general, the most common conditions and problems will shape your initial monitoring strategy, which prioritizes the subwatersheds or reaches that will be targeted for more intensive investigations.
Program managers should analyze ORI data well before every stream mile is walked in the community, and use initial results to modify field methods. For example, if initial results reveal widespread potential problems, program managers may want to add more indicator monitoring to the ORI to track down individual discharge sources (see Chapter 12). Alternatively, if the same kind of discharge problem is repeatedly found, it may be wise to investigate whether there is a common source or activity generating it (e.g., high turbidity observed at many flowing outfalls as a result of equipment washing at active construction sites).
Illicit Discharge Detection and Elimination: A Guidance Manual 112

Chapter 11: The Outfall Reconnaissance Inventory
Basic Data Management and Quality Control
The ORI produces an enormous amount of raw data to characterize outfall conditions. It is not uncommon to compile dozens of individual ORI forms in a single subwatershed. The challenge is to devise a system to organize, process, and translate this data into simpler outputs and formats that can guide illicit discharge elimination efforts. The system starts with effective quality control procedures in the field.
Field sheets should be managed using either a three-ring binder or a clipboard. A small field binder offers the ability to quickly flip back and forth among the outfall forms. Authorization letters, emergency contact lists, and extra forms can also be tucked inside.
At the end of each day, field crews should regroup at a predetermined location to compare notes. The crew leader should confirm that all survey reaches and outfalls of interest have been surveyed, discuss initial findings, and deal with any logistical problems. This is also a good time to check whether field crews are measuring and recording outfall data in the same way, and are consistent in what they are (or are not) recording. Crew leaders should also use this time to review field forms for accuracy and thoroughness. Illegible handwriting should be neatened and details added to notes and any sketches. The crew leader should also organize the forms together into a single master binder or folder for future analysis.
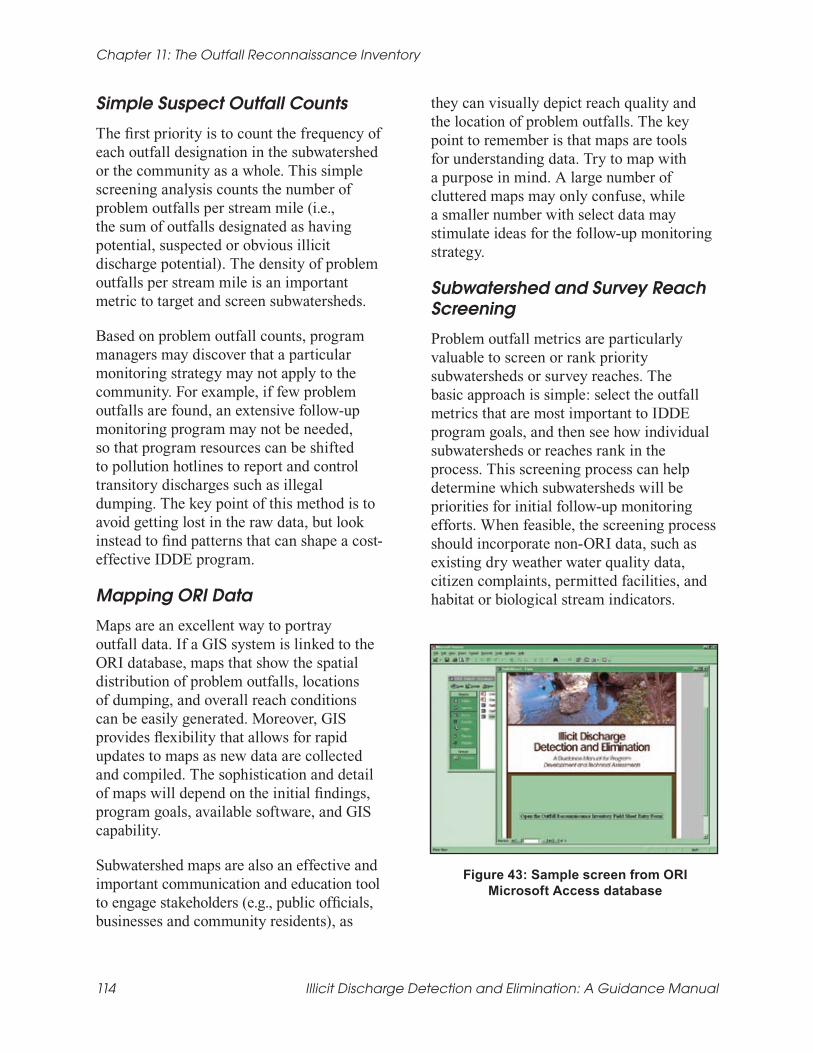
Once crews return from the field, data should be entered into a spreadsheet or database. A Microsoft Access database is provided with this Manual as part of Appendix D (Figure 43), and is supplied
on a compact disc with each hard copy. It can also be downloaded with Appendix D from http://www.stormwatercenter.net. Information stored in this database can easily be imported into a GIS for mapping purposes. The GIS can generate its own database table that allows the user to create subwatershed maps showing outfall characteristics and problem areas.
Once data entry is complete, be sure to check the quality of the data. This can be done quickly by randomly spot-checking 10% of the entered data. For example, if 50 field sheets were completed, check five of the spreadsheet or database entries. When transferring data into GIS, quality control maps that display labeled problem outfalls should be created. Each survey crew is responsible for reviewing the accuracy of these maps.
Outfall Classification
A simple outfall designation system has been developed to summarize the discharge potential for individual ORI field sheets. Table 34 presents the four outfall designations that can be made.
Table 34: Outfall Designation System Using ORI Data
Designation Description
1. Obvious Discharge
Outfalls where there is an illicit discharge that doesn’t even require sample collection for confirmation
2. Suspect Discharge
Flowing outfalls with high severity on one or more physical indicators
3. Potential Discharge
Flowing or non-flowing outfalls with presence of two or more physical indicators
4. Unlikely Discharge
Non-flowing outfalls with no physical indicators of an illicit discharge
Illicit Discharge Detection and Elimination: A Guidance Manual 113
Chapter 11: The Outfall Reconnaissance Inventory
Simple Suspect Outfall Counts
The first priority is to count the frequency of each outfall designation in the subwatershed or the community as a whole. This simple screening analysis counts the number of problem outfalls per stream mile (i.e., the sum of outfalls designated as having potential, suspected or obvious illicit discharge potential). The density of problem outfalls per stream mile is an important metric to target and screen subwatersheds.
Based on problem outfall counts, program managers may discover that a particular monitoring strategy may not apply to the community. For example, if few problem outfalls are found, an extensive follow-up monitoring program may not be needed, so that program resources can be shifted to pollution hotlines to report and control transitory discharges such as illegal dumping. The key point of this method is to avoid getting lost in the raw data, but look instead to find patterns that can shape a cost-effective IDDE program.
Mapping ORI Data
Maps are an excellent way to portray outfall data. If a GIS system is linked to the ORI database, maps that show the spatial distribution of problem outfalls, locations of dumping, and overall reach conditions can be easily generated. Moreover, GIS provides flexibility that allows for rapid updates to maps as new data are collected and compiled. The sophistication and detail of maps will depend on the initial findings, program goals, available software, and GIS capability.
Subwatershed maps are also an effective and important communication and education tool to engage stakeholders (e.g., public officials, businesses and community residents), as
they can visually depict reach quality and the location of problem outfalls. The key point to remember is that maps are tools for understanding data. Try to map with a purpose in mind. A large number of cluttered maps may only confuse, while a smaller number with select data may stimulate ideas for the follow-up monitoring strategy.
Subwatershed and Survey Reach Screening
Problem outfall metrics are particularly valuable to screen or rank priority subwatersheds or survey reaches. The basic approach is simple: select the outfall metrics that are most important to IDDE program goals, and then see how individual subwatersheds or reaches rank in the process. This screening process can help determine which subwatersheds will be priorities for initial follow-up monitoring efforts. When feasible, the screening process should incorporate non-ORI data, such as existing dry weather water quality data, citizen complaints, permitted facilities, and habitat or biological stream indicators.
Figure 43: Sample screen from ORI Microsoft Access database
Illicit Discharge Detection and Elimination: A Guidance Manual 114

An example of how outfall metrics can screen subwatersheds is provided in Table 35. In this hypothetical example, four metrics were used to screen three subwatersheds within a community: number of suspect discharges, subwatershed population as a percent of the total community, number of industrial discharge permits, and number of outfalls per stream mile. Given these screening criteria, subwatershed C was selected for the next phase of detailed investigation.
Characterizing the IDDE Problem at the Community Level
ORI data should be used to continuously revisit and revise the IDDE program as more is learned about the nature and
Chapter 11: The Outfall Reconnaissance Inventory
distribution of illicit discharge problems in the community. For example, ORI discharge designation should be compared against illicit discharge potential (IDP) predictions made during the original desktop analysis (Chapter 5) to refine discharge screening factors, and formulate new monitoring strategies.
In general, community illicit discharge problem can be characterized as minimal, clustered, or severe (Table 36). In the minimal scenario, very few and scattered problems exist; in the clustered scenario, problems are located in isolated subwatersheds; and in the severe scenario, problems are widespread.
Table 35: An Example of ORI Data Being Used to Compare Across Subwatersheds
# of suspect discharges
Population as % of total community
# of industrial discharge permits
# of outfalls per stream/ conveyance mile
Subwatershed A 2 30 4 6
Subwatershed B 1 10 0 3
Subwatershed C 8 60 2 12
Table 36: Using Stream and ORI Data to Categorize IDDE Problems
Extent ORI Support Data
Minimal • Less than 10% of total outfalls are flowing
• Less than 20% of total outfalls with obvious, suspect or potential designation
Clustered • Two thirds of the flowing outfalls are located within one third of the subwatersheds
• More than 20% of the communities subwatersheds have greater than 20% of outfalls with obvious, suspect or potential designation
Severe • More than 10% of total outfalls are flowing
• More than 50% of total outfalls with obvious, suspect or potential designation
• More than 20% of total outfalls with obvious or suspect designation
Illicit Discharge Detection and Elimination: A Guidance Manual 115

Chapter 11: The Outfall Reconnaissance Inventory
11.12 Budgeting and Scoping the ORI
Many different factors come into play when budgeting and scoping an ORI survey: equipment needs, crew size and the stream miles that must be covered. This section presents some simple rules of thumb for ORI budgeting.
Equipment costs for the ORI are relatively minor, with basic equipment to outfit one team of three people totaling about $800 (Table 37). This cost includes one-time expenses to acquire waders, a digital camera and a GPS unit, as well as disposable supplies.
The majority of the budget for an ORI is for staffing the desktop analysis, field crews and data analysis. Field crews can consist of two or three members, and cover about two to three miles of stream (or open channel) per day. Three staff-days should be allocated for pre- and post-field work for each day spent in the field.
Table 38 presents example costs for two hypothetical communities that conduct the ORI. Community A has 10 miles of open channel to investigate, while Community B has 20 miles. In addition, Community A has fewer staff resources available and therefore uses two-person field crews, while Community B uses three-person field crews. Total costs are presented as annual costs, assuming that each community is able to conduct the ORI for all miles in one year.
Table 37: Typical Field Equipment Costs for the ORI
Item Cost
100 Latex Disposable Gloves $25 5 Wide Mouth Sample Bottles (1 Liter) $20 Large Cooler $25 3 Pairs of Waders $150 Digital Camera $200 20 Cans of Spray Paint $50 Test Kits or Probes $100- $500 1 GPS Unit $150 1 Measuring Tape $10 1 First Aid Kit $30 Flashlights, Batteries, Labeling tape, Clipboards $25
Total $785-$1185
Illicit Discharge Detection and Elimination: A Guidance Manual 116

Chapter 11: The Outfall Reconnaissance Inventory
Table 38: Example ORI Costs
Item Community A Community B
Field Equipment1 $700 $785
Staff Field Time2 $2,000 $6,000
Staff Office Time3 $3,000 $6,000
Total $5,700 $12,785 1 From Table 44 2 Assumes $25/hour salary (2 person teams in Community A and three- person teams in
Community B) and two miles of stream per day. 3 Assumes three staff days for each day in field.
Illicit Discharge Detection and Elimination: A Guidance Manual 117

Chapter 11: The Outfall Reconnaissance Inventory
Illicit Discharge Detection and Elimination: A Guidance Manual 118