chapter 1 use of medicines in malaysia - crc · in this chapter, we report an overview of the...
TRANSCRIPT

1
MALAYSIAN STATISTICS ON MEDICINES 2007
CHAPTER 1 USE OF MEDICINES IN MALAYSIALian L.M.1, Faridah A.M.Y.2, Hazimah H.1, Kok L.C.1, Sivasampu S.1
1. Clinical Research Centre, National Institutes of Health, 2. Pharmaceutical Services Division, MOH
In this chapter, we report an overview of the national estimates for the use of medicines in Malaysia for year 2007. The most commonly used
medicines by therapeutic groups and by specific drugs are tabulated below. More detailed statistics and analysis of medicines utilised are given
in other chapters in this report.
As in previous years, the National Medicines Use Survey (NMUS) 2007 was limited to “prescription” medicines only; it excluded Over-the-Counter
(OTC) medicines and Traditional Medicines. Also, utilisation data presented in this chapter included only drugs that have Defined Daily Doses
(DDDs) in the World Health Organisation (WHO) Anatomical Therapeutic Chemical (ATC) classification system,1 and the estimates are expressed as
number of DDDs per 1000 population per day. Hence the discussions in relation to ranking and comparison of usage in this chapter do not include
drugs which do not have WHO assigned DDD and are not prescription medicines.
However, estimates for utilisation of some medicines which do not have WHO assigned DDDs are presented, in terms of weight of active
ingredient/1000 population per day (Antineoplastic drugs) or weight or volume of drug preparations per 1000 population per day (Dermatologicals,
Ophthalmologicals and Otologicals), in other chapters where the utilisation of these drugs within their respective groups are discussed.
Among the therapeutic groups, drugs used in diabetes (ATC code A10) ranked highest in terms of utilisation in Malaysia for the year 2007 (Table
1.1) as was in 2006 (Table 1.2). An estimate of 3.97% of the Malaysian population was on drugs from this therapeutic group. This correlates well
with the national diabetes prevalence of 4.0% in the general population reported in the Third National Health and Morbidity Survey 2006 (NHMS
III).2
The therapeutic groups used for cardiovascular disorders, namely agents acting on the renin-angiotensin system (C09) consumed by 2.67% of
the population, beta blocking agents (C07) consumed by 2.62% of the population, calcium channel blockers (C08) consumed by 2.31% of the
population, diuretics (C03) consumed by 1.40% of the population and lipid-modifying agents (C10) consumed by 1.39% of the population, were
ranked 2nd, 3rd,4th, 5th and 6th respectively (Table 1.1).
Drugs for obstructive airway diseases constituted the next highest ranking group of drugs. However, there was not much difference in total
utilisation between 2007 (12.59 DDD/1000 population/day) and 2006 (11.73 DDD/1000 population/day).
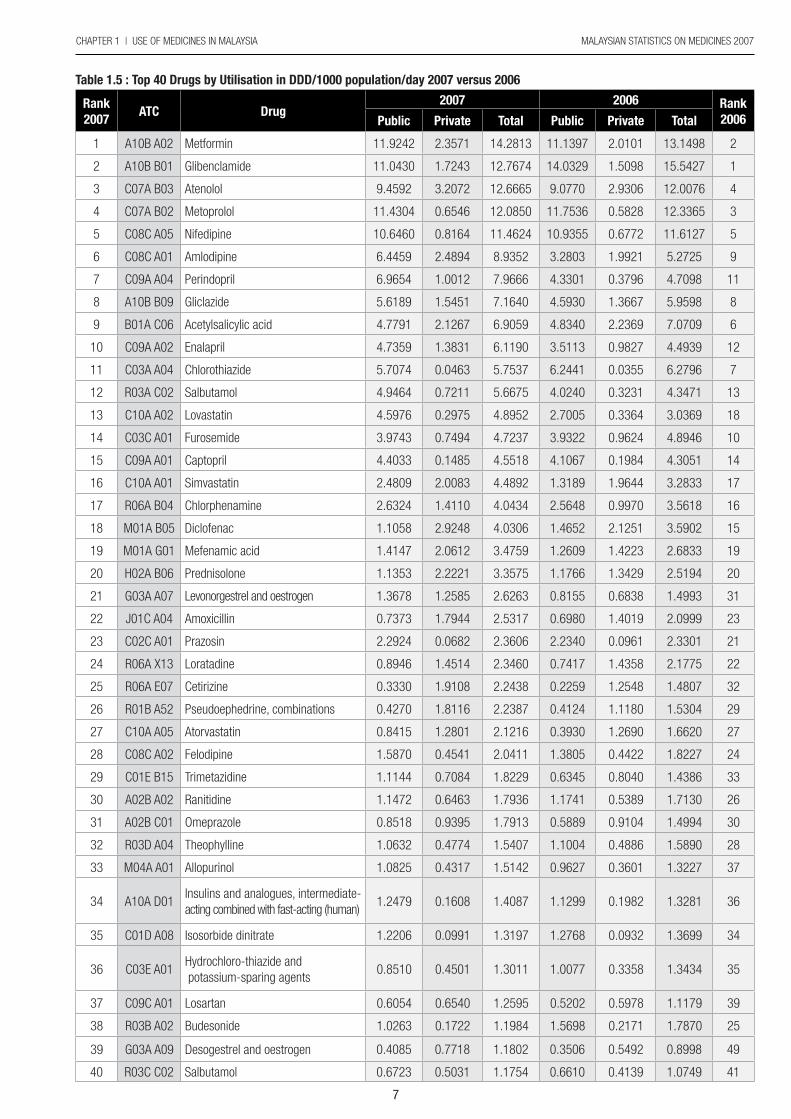
As far as individual drugs were concerned, ranks 1 to 11 by utilisation for 2007 went to drugs for diabetes and cardiovascular disorders (Table
1.3), again reflecting the pattern for prevalence of chronic diseases reported by NHMS III where hypertension, diabetes and heart diseases ranked
1st, 2nd and 4th among the top chronic illnesses. Overall, there was not much difference in ranking for the top 5 drugs by utilisation when compared
to 2006.
Metformin (consumed by 1.43% of the population), followed by glibenclamide (consumed by 1.28% of the population), were the top 2 antidiabetic
drugs as well as the top 2 among all drugs utilised. Metformin was recommended as first-line therapy in the treatment of Type 2 diabetes mellitus
according to the Malaysian Clinical Practice Guidelines (CPG) at that time.3 This may reflect some improvement in terms of adherence to the
guidelines compared to 2006 where usage of glibenclamide superseded metformin.
It is interesting to note that usage of amlodipine had gone up from rank 9th in 2006 to rank 6th in 2007, with almost 70% increase in utilisation.
Usage in the public sector in 2007 was double that of 2006. Perindopril had also climbed up the chart from being only at rank 11th in 2006 to
rank 7th in 2007, again with almost 70% increase in usage. The increase in utilisation of amlodipine and perindopril may possibly be attributed to
the findings of the Anglo Scandinavian Cardiovascular Outcome Trial (ASCOT), which was published in 2005.4 Also, generic versions of amlodipine
became available following expiration of its patent.

2
MALAYSIAN STATISTICS ON MEDICINES 2007
3
Asthma was the 3rd highest ranking chronic disease reported in NHMS III. It is therefore not surprising that inhaled salbutamol (R03A) occupied
12th position in the 2007 utilisation ranking for individual drugs, an improvement from its 13th position in 2006, with approximately 30% increase
in usage. Usage of budesonide, an inhalation steroid, however, dropped from rank 25th in 2006 (1.787 DDD/1000 population/day) to rank 38th
(1.1984 DDD/1000 population/day) in 2007. Although detail statistics in other parts of this report showed general decrease in use of single-
ingredient inhaled glucocorticoids, there was an overall increase in use of inhaled combination glucocorticoids with long-acting beta agonists.
It is also interesting to note the improvement in rankings of oral contraceptives. The combination levonorgestrel and oestrogen which ranked 31st
in 2006 moved up to 21st in 2007, whilst the desogestrel and oestrogen combination, a third generation oral contraceptive, emerged as a new
member in the top 40 drugs by utilisation list at rank 39th (2007), moving up from 49th in the previous year. In terms of utilisation, there were overall
increase of 1.12 DDD/1000 population/day and 0.28 DDD/1000 population/day, respectively, for the 2 combination oral contraceptives (equivalent
to an increase of 75% and 30%, respectively).
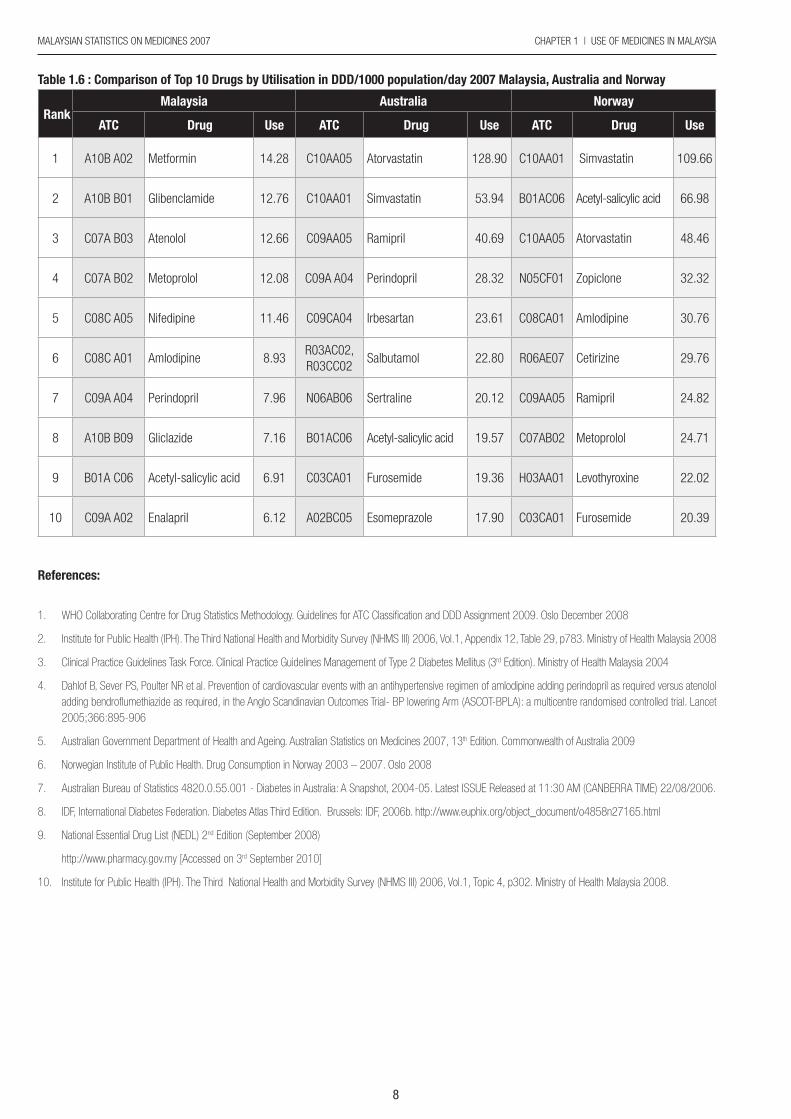
Comparing the Malaysian drug utilisation pattern with that of Australia5 and Norway6, whilst cardiovascular drugs dominated the top 10 drugs by
utilisation in all 3 countries, ranking for individual drugs for Malaysia differed somewhat from that of Australia and Norway as shown in Table 1.6.
The most significant differences are the presence of nervous system drugs in the top 10 drugs for Australia (sertraline (N06AB06) ranked 7th) and
Norway (zopiclone, (N05CF01) ranked 4th); both these drugs are not even in the top 40 drugs in Malaysian ranking. Metformin, the most highly
utilised drug in Malaysia did not feature among the top 10 drugs for both Australia and Norway although the consumptions were comparable -
14.28, 15.65, 11.98/1000 population/day, respectively, for Malaysia, Australia and Norway; in fact, neither did any of the other antidiabetic drugs
make it to the top 10 list for Australia and Norway. Diabetes prevalence in Australia was 3.6% (2005-2006)7 and Norway 4.7% (2007).8 Instead,
the lipid-modifying drugs, atorvastatin and simvastatin topped the Australian and Norwegian list, respectively.
The National Medicines Use Survey (NMUS), amongst other objectives, is designed to support the implementation of the National Medicines Policy
which promotes equitable access to essential medicines. Hence, it is pertinent to note that 10 out of the top 40 drugs used in 2007 are not in
the Malaysian National Essential Drugs List (NEDL) 2008.9 These included amlodipine, an antihypertensive drug (rank 6th), loratadine, a commonly
used non-sedative antihistamine (rank 24th), cetirizine (another antihistamine) which saw a 51% increase in usage and improved ranking from 32nd
(2006) to 25th (2007), and simvastatin (a lipid-modifying drug) which has been consistently in the top 40 drugs used (rank 17th in 2006 and 16th
in 2007). Based on the utilisation patterns established by NMUS, there is an apparent ‘mismatch’ between what is most used and what is listed
in the NEDL in some therapeutic areas. Whilst the NEDL serves only as a guide to drugs which should be available in the country, there is need to
regularly update the medicines selections to reflect new therapeutic options and changing therapeutic needs.
The NMUS showed that the drug utilisation patterns in Malaysia concurred with prevalence of chronic diseases reported in NHMS III. It also showed
that for both 2006 and 2007, the overall drug utilisation in the public sector was twice that of the private sector for the top 30 therapeutic groups.
Twenty of the thirty most utilised classes of drugs were for chronic diseases, and public sector utilisation exceeded that of private sector, indicating
an imbalance in burden borne in the management of these diseases. This also concurred with the NHMS III which found that government health
centres were the most frequently visited by respondents with chronic diseases followed by private clinics.
However, the pattern was reversed for drugs used for short term symptomatic relief such as antihistamines, anti-inflammatory and antirheumatic
drugs, nasal preparations, drugs for gastrointestinal disorders and corticosteroids, where private sector utilisation was higher. Interestingly, the
NHMS III found that among those who used ambulatory services for recent illnesses, 62.1% went to private clinics whilst 37.9% used government
clinics.10
In conclusion, the overall utilisation pattern of medicines in the country for 2006-2007 appeared to be in accordance with the general healthcare
needs.
CHAPTER 1 | USE OF MEDICINES IN MALAYSIA

2 3
MALAYSIAN STATISTICS ON MEDICINES 2007
Table 1.1 : Top 30 Therapeutic Groups by Utilisation in DDD/1000 population/day 2007
Rank ATC Therapeutic Group Public Private Total
1 A10 Drugs used in diabetes 32.1800 7.5439 39.7240
2 C09 Agents acting on the renin-angiotensin system 19.0851 7.5894 26.6745
3 C07 Beta blocking agents 21.5089 4.7520 26.2609
4 C08 Calcium channel blockers 18.9637 4.0964 23.0601
5 C03 Diuretics 11.0801 2.9467 14.0268
6 C10 Lipid modifying agents 8.9122 5.0597 13.9719
7 R03 Drugs for obstructive airway diseases 9.8508 2.7419 12.5928
8 M01 Anti-inflammatory and antirheumatic products 4.1473 8.1637 12.3110
9 R06 Antihistamines for systemic use 4.5773 6.7152 11.2925
10 B01 Antithrombotic agents 6.4576 3.3091 9.7666
11 J01 Antibacterials for systemic use 3.6481 6.0014 9.6494
12 G03 Sex hormones and modulators of the genital system 3.1479 4.9869 8.1348
13 A02 Drugs for acid related disorders 3.1153 3.2156 6.3309
14 C01 Cardiac therapy 3.3976 1.5625 4.9601
15 N05 Psycholeptics 3.4242 1.4548 4.8790
16 H02 Corticosteroids for systemic use 1.9316 2.8135 4.7451
17 R01 Nasal preparations 1.3867 2.9747 4.3614
18 C02 Antihypertensives 3.1665 0.1879 3.3544
19 A03 Drugs for functional gastrointestinal disorders 0.7107 1.4018 2.1125
20 H03 Thyroid therapy 1.4830 0.5282 2.0112
21 N06 Psychoanaleptics 1.2457 0.5596 1.8053
22 M04 Antigout preparations 1.1464 0.6272 1.7736
23 N03 Antiepileptics 1.3751 0.2618 1.6368
24 S01 Ophthalmologicals 1.1529 0.2151 1.3680
25 N07 Other nervous system drugs 0.5723 0.5439 1.1162
26 G04 Urologicals 0.7826 0.2974 1.0800
27 J04 Antimycobacterials 0.8298 0.1292 0.9590
28 N04 Antiparkinson drugs 0.7405 0.0689 0.8094
29 A07 Antidiarrheals, intestinal anti-inflammatory /anti-infective agents 0.2738 0.4677 0.7416
30 J05 Antivirals for systemic use 0.5660 0.0698 0.6358
Total utilisation for top 30 therapeutic groups 170.8597 81.2859 252.1456
CHAPTER 1 | USE OF MEDICINES IN MALAYSIA

4
MALAYSIAN STATISTICS ON MEDICINES 2007
5
Table 1.2 : Top 30 Therapeutic Groups by Utilisation in DDD/1000 population/day 2006
Rank ATC Therapeutic Group Public Private Total
1 A10 Drugs used in diabetes 32.7987 6.5362 39.3349
2 C07 Beta blocking agents 21.3322 4.3809 25.7131
3 C09 Agents acting on the renin-angiotensin system 13.8276 5.7525 19.5801
4 C08 Calcium channel blockers 15.9410 3.4243 19.3653
5 C03 Diuretics 11.7771 2.8941 14.6712
6 R03 Drugs for obstructive airway diseases 9.4693 2.2664 11.7356
7 C10 Lipid modifying agents 5.5117 4.9109 10.4226
8 M01 Anti-inflammatory and antirheumatic products 3.9514 6.0216 9.9729
9 R06 Antihistamines for systemic use 4.4889 5.4258 9.9147
10 B01 Antithrombotic agents 6.0229 3.5854 9.6084
11 J01 Antibacterials for systemic use 3.8151 5.1231 8.9383
12 G03 Sex hormones and modulators of the genital system 2.4879 3.8736 6.3615
13 A02 Drugs for acid related disorders 2.5007 2.6584 5.1590
14 C01 Cardiac therapy 2.7982 1.8947 4.6928
15 H02 Corticosteroids for systemic use 1.9061 2.5400 4.4461
16 N05 Psycholeptics 3.0499 0.9971 4.0470
17 C02 Antihypertensives 2.9987 0.2328 3.2315
18 R01 Nasal preparations 1.1736 1.9592 3.1327
19 A03 Drugs for functional gastrointestinal disorders 0.6813 1.6295 2.3107
20 H03 Thyroid therapy 1.4491 0.5443 1.9934
21 M04 Antigout preparations 1.0294 0.5053 1.5347
22 N03 Antiepileptics 1.3455 0.1569 1.5024
23 N06 Psychoanaleptics 0.8927 0.4193 1.3120
24 S01 Ophthalmologicals 1.0590 0.1936 1.2525
25 J04 Antimycobacterials 0.9993 0.1023 1.1015
26 N07 Other nervous system drugs 0.4346 0.6062 1.0408
27 N04 Antiparkinson drugs 0.8279 0.0524 0.8803
28 G04 Urologicals 0.4062 0.3194 0.7256
29 A08 Antiobesity preparations, excl. diet products 0.0162 0.7057 0.7218
30 R05 Cough and cold preparations 0.0040 0.6973 0.7013
Total utilisation for top 30 therapeutic groups 155.2621 70.1247 225.3862
CHAPTER 1 | USE OF MEDICINES IN MALAYSIA

4 5
MALAYSIAN STATISTICS ON MEDICINES 2007
Table 1.3 : Top 40 Drugs by Utilisation in DDD/1000 population/day 2007
Rank ATC Drug Public Private Total
1 A10B A02 Metformin 11.9242 2.3571 14.2813
2 A10B B01 Glibenclamide 11.0430 1.7243 12.7674
3 C07A B03 Atenolol 9.4592 3.2072 12.6665
4 C07A B02 Metoprolol 11.4304 0.6546 12.0850
5 C08C A05 Nifedipine 10.6460 0.8164 11.4624
6 C08C A01 Amlodipine 6.4459 2.4894 8.9352
7 C09A A04 Perindopril 6.9654 1.0012 7.9666
8 A10B B09 Gliclazide 5.6189 1.5451 7.1640
9 B01A C06 Acetylsalicylic acid 4.7791 2.1267 6.9059
10 C09A A02 Enalapril 4.7359 1.3831 6.1190
11 C03A A04 Chlorothiazide 5.7074 0.0463 5.7537
12 R03A C02 Salbutamol 4.9464 0.7211 5.6675
13 C10A A02 Lovastatin 4.5976 0.2975 4.8952
14 C03C A01 Furosemide 3.9743 0.7494 4.7237
15 C09A A01 Captopril 4.4033 0.1485 4.5518
16 C10A A01 Simvastatin 2.4809 2.0083 4.4892
17 R06A B04 Chlorphenamine 2.6324 1.4110 4.0434
18 M01A B05 Diclofenac 1.1058 2.9248 4.0306
19 M01A G01 Mefenamic acid 1.4147 2.0612 3.4759
20 H02A B06 Prednisolone 1.1353 2.2221 3.3575
21 G03A A07 Levonorgestrel and oestrogen 1.3678 1.2585 2.6263
22 J01C A04 Amoxicillin 0.7373 1.7944 2.5317
23 C02C A01 Prazosin 2.2924 0.0682 2.3606
24 R06A X13 Loratadine 0.8946 1.4514 2.3460
25 R06A E07 Cetirizine 0.3330 1.9108 2.2438
26 R01B A52 Pseudoephedrine, combinations 0.4270 1.8116 2.2387
27 C10A A05 Atorvastatin 0.8415 1.2801 2.1216
28 C08C A02 Felodipine 1.5870 0.4541 2.0411
29 C01E B15 Trimetazidine 1.1144 0.7084 1.8229
30 A02B A02 Ranitidine 1.1472 0.6463 1.7936
31 A02B C01 Omeprazole 0.8518 0.9395 1.7913
32 R03D A04 Theophylline 1.0632 0.4774 1.5407
33 M04A A01 Allopurinol 1.0825 0.4317 1.5142
34 A10A D01 Insulins and analogues, intermediate-acting combined with fast-acting (human) 1.2479 0.1608 1.4087
35 C01D A08 Isosorbide dinitrate 1.2206 0.0991 1.3197
36 C03E A01 Hydrochlorothiazide and potassium-sparing agents 0.8510 0.4501 1.3011
37 C09C A01 Losartan 0.6054 0.6540 1.2595
38 R03B A02 Budesonide 1.0263 0.1722 1.1984
39 G03A A09 Desogestrel and oestrogen 0.4085 0.7718 1.1802
40 R03C C02 Salbutamol 0.6723 0.5031 1.1754
CHAPTER 1 | USE OF MEDICINES IN MALAYSIA
6
MALAYSIAN STATISTICS ON MEDICINES 2007
7
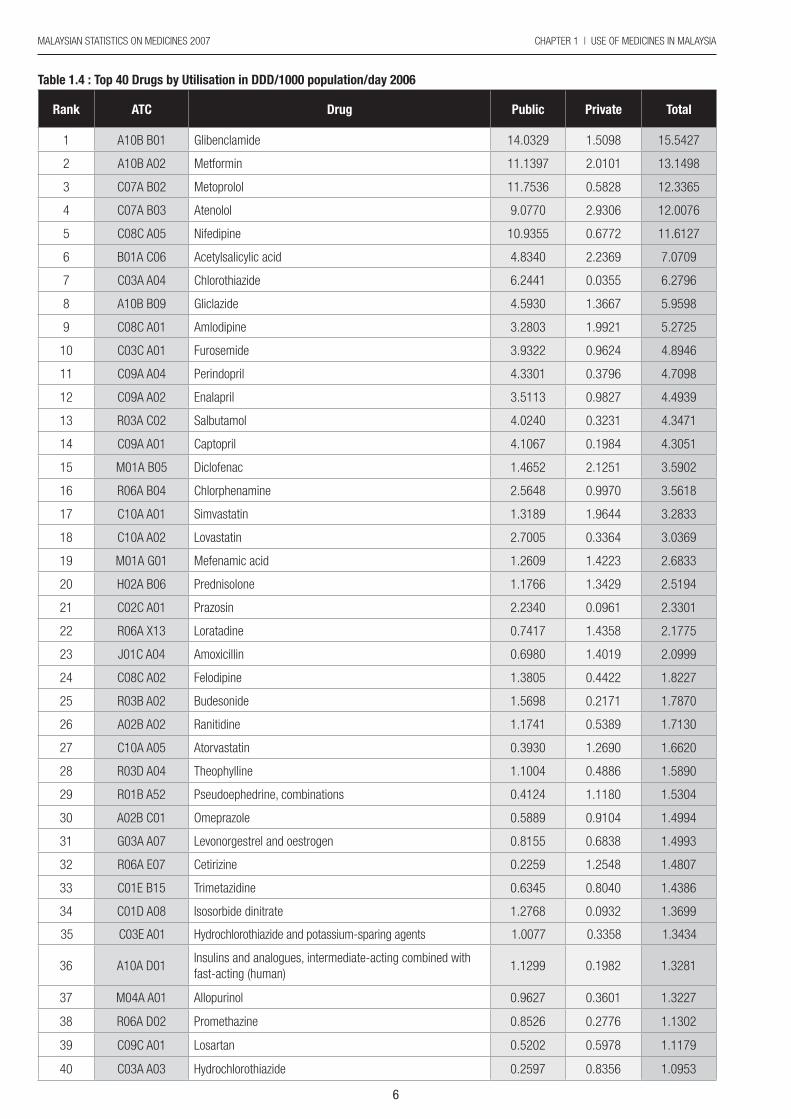
Table 1.4 : Top 40 Drugs by Utilisation in DDD/1000 population/day 2006
Rank ATC Drug Public Private Total
1 A10B B01 Glibenclamide 14.0329 1.5098 15.5427
2 A10B A02 Metformin 11.1397 2.0101 13.1498
3 C07A B02 Metoprolol 11.7536 0.5828 12.3365
4 C07A B03 Atenolol 9.0770 2.9306 12.0076
5 C08C A05 Nifedipine 10.9355 0.6772 11.6127
6 B01A C06 Acetylsalicylic acid 4.8340 2.2369 7.0709
7 C03A A04 Chlorothiazide 6.2441 0.0355 6.2796
8 A10B B09 Gliclazide 4.5930 1.3667 5.9598
9 C08C A01 Amlodipine 3.2803 1.9921 5.2725
10 C03C A01 Furosemide 3.9322 0.9624 4.8946
11 C09A A04 Perindopril 4.3301 0.3796 4.7098
12 C09A A02 Enalapril 3.5113 0.9827 4.4939
13 R03A C02 Salbutamol 4.0240 0.3231 4.3471
14 C09A A01 Captopril 4.1067 0.1984 4.3051
15 M01A B05 Diclofenac 1.4652 2.1251 3.5902
16 R06A B04 Chlorphenamine 2.5648 0.9970 3.5618
17 C10A A01 Simvastatin 1.3189 1.9644 3.2833
18 C10A A02 Lovastatin 2.7005 0.3364 3.0369
19 M01A G01 Mefenamic acid 1.2609 1.4223 2.6833
20 H02A B06 Prednisolone 1.1766 1.3429 2.5194
21 C02C A01 Prazosin 2.2340 0.0961 2.3301
22 R06A X13 Loratadine 0.7417 1.4358 2.1775
23 J01C A04 Amoxicillin 0.6980 1.4019 2.0999
24 C08C A02 Felodipine 1.3805 0.4422 1.8227
25 R03B A02 Budesonide 1.5698 0.2171 1.7870
26 A02B A02 Ranitidine 1.1741 0.5389 1.7130
27 C10A A05 Atorvastatin 0.3930 1.2690 1.6620
28 R03D A04 Theophylline 1.1004 0.4886 1.5890
29 R01B A52 Pseudoephedrine, combinations 0.4124 1.1180 1.5304
30 A02B C01 Omeprazole 0.5889 0.9104 1.4994
31 G03A A07 Levonorgestrel and oestrogen 0.8155 0.6838 1.4993
32 R06A E07 Cetirizine 0.2259 1.2548 1.4807
33 C01E B15 Trimetazidine 0.6345 0.8040 1.4386
34 C01D A08 Isosorbide dinitrate 1.2768 0.0932 1.3699
35 C03E A01 Hydrochlorothiazide and potassium-sparing agents 1.0077 0.3358 1.3434
36 A10A D01Insulins and analogues, intermediate-acting combined with fast-acting (human)
1.1299 0.1982 1.3281
37 M04A A01 Allopurinol 0.9627 0.3601 1.3227
38 R06A D02 Promethazine 0.8526 0.2776 1.1302
39 C09C A01 Losartan 0.5202 0.5978 1.1179
40 C03A A03 Hydrochlorothiazide 0.2597 0.8356 1.0953
CHAPTER 1 | USE OF MEDICINES IN MALAYSIA
6 7
MALAYSIAN STATISTICS ON MEDICINES 2007
Table 1.5 : Top 40 Drugs by Utilisation in DDD/1000 population/day 2007 versus 2006
Rank 2007
ATC Drug2007 2006 Rank
2006Public Private Total Public Private Total
1 A10B A02 Metformin 11.9242 2.3571 14.2813 11.1397 2.0101 13.1498 2
2 A10B B01 Glibenclamide 11.0430 1.7243 12.7674 14.0329 1.5098 15.5427 1
3 C07A B03 Atenolol 9.4592 3.2072 12.6665 9.0770 2.9306 12.0076 4
4 C07A B02 Metoprolol 11.4304 0.6546 12.0850 11.7536 0.5828 12.3365 3
5 C08C A05 Nifedipine 10.6460 0.8164 11.4624 10.9355 0.6772 11.6127 5
6 C08C A01 Amlodipine 6.4459 2.4894 8.9352 3.2803 1.9921 5.2725 9
7 C09A A04 Perindopril 6.9654 1.0012 7.9666 4.3301 0.3796 4.7098 11
8 A10B B09 Gliclazide 5.6189 1.5451 7.1640 4.5930 1.3667 5.9598 8
9 B01A C06 Acetylsalicylic acid 4.7791 2.1267 6.9059 4.8340 2.2369 7.0709 6
10 C09A A02 Enalapril 4.7359 1.3831 6.1190 3.5113 0.9827 4.4939 12
11 C03A A04 Chlorothiazide 5.7074 0.0463 5.7537 6.2441 0.0355 6.2796 7
12 R03A C02 Salbutamol 4.9464 0.7211 5.6675 4.0240 0.3231 4.3471 13
13 C10A A02 Lovastatin 4.5976 0.2975 4.8952 2.7005 0.3364 3.0369 18
14 C03C A01 Furosemide 3.9743 0.7494 4.7237 3.9322 0.9624 4.8946 10
15 C09A A01 Captopril 4.4033 0.1485 4.5518 4.1067 0.1984 4.3051 14
16 C10A A01 Simvastatin 2.4809 2.0083 4.4892 1.3189 1.9644 3.2833 17
17 R06A B04 Chlorphenamine 2.6324 1.4110 4.0434 2.5648 0.9970 3.5618 16
18 M01A B05 Diclofenac 1.1058 2.9248 4.0306 1.4652 2.1251 3.5902 15
19 M01A G01 Mefenamic acid 1.4147 2.0612 3.4759 1.2609 1.4223 2.6833 19
20 H02A B06 Prednisolone 1.1353 2.2221 3.3575 1.1766 1.3429 2.5194 20
21 G03A A07 Levonorgestrel and oestrogen 1.3678 1.2585 2.6263 0.8155 0.6838 1.4993 31
22 J01C A04 Amoxicillin 0.7373 1.7944 2.5317 0.6980 1.4019 2.0999 23
23 C02C A01 Prazosin 2.2924 0.0682 2.3606 2.2340 0.0961 2.3301 21
24 R06A X13 Loratadine 0.8946 1.4514 2.3460 0.7417 1.4358 2.1775 22
25 R06A E07 Cetirizine 0.3330 1.9108 2.2438 0.2259 1.2548 1.4807 32
26 R01B A52 Pseudoephedrine, combinations 0.4270 1.8116 2.2387 0.4124 1.1180 1.5304 29
27 C10A A05 Atorvastatin 0.8415 1.2801 2.1216 0.3930 1.2690 1.6620 27
28 C08C A02 Felodipine 1.5870 0.4541 2.0411 1.3805 0.4422 1.8227 24
29 C01E B15 Trimetazidine 1.1144 0.7084 1.8229 0.6345 0.8040 1.4386 33
30 A02B A02 Ranitidine 1.1472 0.6463 1.7936 1.1741 0.5389 1.7130 26
31 A02B C01 Omeprazole 0.8518 0.9395 1.7913 0.5889 0.9104 1.4994 30
32 R03D A04 Theophylline 1.0632 0.4774 1.5407 1.1004 0.4886 1.5890 28
33 M04A A01 Allopurinol 1.0825 0.4317 1.5142 0.9627 0.3601 1.3227 37
34 A10A D01Insulins and analogues, intermediate-acting combined with fast-acting (human)
1.2479 0.1608 1.4087 1.1299 0.1982 1.3281 36
35 C01D A08 Isosorbide dinitrate 1.2206 0.0991 1.3197 1.2768 0.0932 1.3699 34
36 C03E A01Hydrochloro-thiazide and potassium-sparing agents
0.8510 0.4501 1.3011 1.0077 0.3358 1.3434 35
37 C09C A01 Losartan 0.6054 0.6540 1.2595 0.5202 0.5978 1.1179 39
38 R03B A02 Budesonide 1.0263 0.1722 1.1984 1.5698 0.2171 1.7870 25
39 G03A A09 Desogestrel and oestrogen 0.4085 0.7718 1.1802 0.3506 0.5492 0.8998 49
40 R03C C02 Salbutamol 0.6723 0.5031 1.1754 0.6610 0.4139 1.0749 41
CHAPTER 1 | USE OF MEDICINES IN MALAYSIA
8
MALAYSIAN STATISTICS ON MEDICINES 2007
9
Table 1.6 : Comparison of Top 10 Drugs by Utilisation in DDD/1000 population/day 2007 Malaysia, Australia and Norway
RankMalaysia Australia Norway
ATC Drug Use ATC Drug Use ATC Drug Use
1 A10B A02 Metformin 14.28 C10AA05 Atorvastatin 128.90 C10AA01 Simvastatin 109.66
2 A10B B01 Glibenclamide 12.76 C10AA01 Simvastatin 53.94 B01AC06 Acetyl-salicylic acid 66.98
3 C07A B03 Atenolol 12.66 C09AA05 Ramipril 40.69 C10AA05 Atorvastatin 48.46
4 C07A B02 Metoprolol 12.08 C09A A04 Perindopril 28.32 N05CF01 Zopiclone 32.32
5 C08C A05 Nifedipine 11.46 C09CA04 Irbesartan 23.61 C08CA01 Amlodipine 30.76
6 C08C A01 Amlodipine 8.93R03AC02, R03CC02
Salbutamol 22.80 R06AE07 Cetirizine 29.76
7 C09A A04 Perindopril 7.96 N06AB06 Sertraline 20.12 C09AA05 Ramipril 24.82
8 A10B B09 Gliclazide 7.16 B01AC06 Acetyl-salicylic acid 19.57 C07AB02 Metoprolol 24.71
9 B01A C06 Acetyl-salicylic acid 6.91 C03CA01 Furosemide 19.36 H03AA01 Levothyroxine 22.02
10 C09A A02 Enalapril 6.12 A02BC05 Esomeprazole 17.90 C03CA01 Furosemide 20.39
References:
1. WHO Collaborating Centre for Drug Statistics Methodology. Guidelines for ATC Classification and DDD Assignment 2009. Oslo December 2008
2. Institute for Public Health (IPH). The Third National Health and Morbidity Survey (NHMS III) 2006, Vol.1, Appendix 12, Table 29, p783. Ministry of Health Malaysia 2008
3. Clinical Practice Guidelines Task Force. Clinical Practice Guidelines Management of Type 2 Diabetes Mellitus (3rd Edition). Ministry of Health Malaysia 2004
4. Dahlof B, Sever PS, Poulter NR et al. Prevention of cardiovascular events with an antihypertensive regimen of amlodipine adding perindopril as required versus atenolol adding bendroflumethiazide as required, in the Anglo Scandinavian Outcomes Trial- BP lowering Arm (ASCOT-BPLA): a multicentre randomised controlled trial. Lancet 2005;366:895-906
5. Australian Government Department of Health and Ageing. Australian Statistics on Medicines 2007, 13th Edition. Commonwealth of Australia 2009
6. Norwegian Institute of Public Health. Drug Consumption in Norway 2003 – 2007. Oslo 2008
7. Australian Bureau of Statistics 4820.0.55.001 - Diabetes in Australia: A Snapshot, 2004-05. Latest ISSUE Released at 11:30 AM (CANBERRA TIME) 22/08/2006.
8. IDF, International Diabetes Federation. Diabetes Atlas Third Edition. Brussels: IDF, 2006b. http://www.euphix.org/object_document/o4858n27165.html
9. National Essential Drug List (NEDL) 2nd Edition (September 2008)
http://www.pharmacy.gov.my [Accessed on 3rd September 2010]
10. Institute for Public Health (IPH). The Third National Health and Morbidity Survey (NHMS III) 2006, Vol.1, Topic 4, p302. Ministry of Health Malaysia 2008.
CHAPTER 1 | USE OF MEDICINES IN MALAYSIA