economic development plan for puerto rico …gis.jp.pr.gov/externo_econ/pde2014/chapter01...
TRANSCRIPT

ECONOMIC DEVELOPMENT PLAN FOR PUERTO RICO 2015
1
First Draft
ECONOMIC DEVELOPMENT PLANFOR PUERTO RICO 2015
Economic & Social Planning ProgramPuerto Rico Planning Board
Commonwealth of Puerto RicoOffi ce of the Governor
october 2014

ECONOMIC DEVELOPMENT PLAN FOR PUERTO RICO 2015
2
ECONOMIC DEVELOPMENT PLAN FOR PUERTO RICO 2015
3
First Draft
INTRODUCTION ECONOMIC DEVELOPMENT PLAN
FOR PUERTO RICO2015
Luis García PelattiChairman
Pedro M. Cardona RoigVice-chairman
Juan C. Santiago ColónAssociate member
Norma I. Peña RiveraAssociate member
Sylvia Rivera DíazAlternate member
Commonwealth of Puerto RicoOffi ce of the Governor
Planning Boardoctober 2014

ECONOMIC DEVELOPMENT PLAN FOR PUERTO RICO 2015
4
Economic Analisis SubprogramJuan Cruz Urbina
Director
Offi ce System AdministratorCarmen Carrasquillo Cuesta
Lester Álvarez TorresKatherine Chacón RiveraAlejandro Díaz MarreroWilliam Galindo Irizarry
Carmen Jiménez FrancoFrank Matos Ramos
Glorimar Morales RiveraIvonne Narváez RiveraWanda Rivera Montes
Maribel Santiago TorresYajaira Soliveras Morales
René J. Reyes MedinaAlejandro Guerrero Rodríguez
Ángel D. Suárez RiveraSandra Blas Rivera
Héctor R. Crespo CorderoJoel Olmedo Álvarez
Yahaira I. Rosario MoralesNorberto Pizarro CaballeroJesús M. Salgado Carreras
Joel Viera PedrozaWilkins Roman Samot
Federal Proposals Offi ceRoberto González Navarro
Director
Offi ce System Auxiliary Ileana Andino Pagán
Social Analisis, Models & Projections Subprogram
Nelson López EsquerdoDirector
Offi ce System AdministratorOneida Cruz González
Luis Avilés RiveraMiriam Cardona de JesúsAntonio de Jesús LópezVivecalyn Díaz OcañaBetty González RiveraLeena Khan Khanam
Evelyn Ortiz MaldonadoElda Parés RosadoMarta Rosa Bauzá
Giselle Sánchez Franco
Estadistics SubprogramJosé Vélez Quiñones
Director
Offi ce System AdministratorCarmen Santos Marrero
Marielí Álvarez UlloaMiriam García VelázquezMaggie Pérez GuzmánDaisy Rodríguez Nieves
Census Offi ceGerardo Sánchez Duvergé
Director
Economic & Social Planning ProgramDr. Julio César Hernández Correa
DirectorOffi ce System Administrators
Carmen Ferrer PérezMaría P. Bonano Villareal
Editing BoardEvelyn Ortiz Maldonado Maribel Santiago TorresMaggie Pérez GuzmánLeena F. Khan Khanam
Roberto González Navarro
Graphic ArtistsJosé Fernández Salicrup
Nancy Más Marrero

ECONOMIC DEVELOPMENT PLAN FOR PUERTO RICO 2015
5
Chapter
First Draft
INTRODUCTION FOR THEECONOMIC DEVELOPMENT PLAN 2015
Julio César Hernández, Ph.D.*Sandra Blas, M.S. **Héctor Crespo, M.A. **Jorge González, MBA **Elda Parés, M.A. **
* Affi liation: Puerto Rico Planning Board & University of Turabo
** Affi liation: Puerto Rico Planning Board
1
ECONOMIC DEVELOPMENT PLAN FOR PUERTO RICO 2015
6
TABLE OF CONTENTS
CHAPTER Page PREFACE .................................................................................................................................................. 1 Introduction ................................................................................................................................................ 1 I DESCRIPTION OF THE PLAN AND METODOLOGY OF THE PLAN II ECONOMY OF PUERTO RICO FOR THE FISCAL YEARS 1950 TO 2013 AND ECONOMIC OUTLOOK FOR FISCAL YEARS 2014 AND 2015 Gross National Product: What Happened in the 1970s? ........................................................................... 3 Population and Construction of Private Companies: the Engines of the Economy ................................... 7 Population: Fewer People, Fewer Births, Less Economic Activity ............................................................ 8 Domestic Demand: We Continue Consuming More ................................................................................ 12 Gross Domestic Fixed Investment: Two Bubbles, Two Recessions ........................................................ 14 Personal Consumption: Puerto Rico will Remain to be a Service Economy? ......................................... 16 Government Expenditures and Gross Public Debt: Continues to Increase Municipality Expenditures ... 18 Exports and Imports: Trade Defi cit Continues to Expand? ..................................................................... 20 Gross Domestic Product .......................................................................................................................... 22 III ECONOMY OF PUERTO RICO BY SECTOR Agriculture and Mining Sectors ................................................................................................................ 27 Construction and, Real Estate and Rental Sectors ................................................................................. 28 Trade Sector: Wholesale and Retail ........................................................................................................ 29 Transportation and Warehousing Sectors ............................................................................................... 30 The Manufacturing Sector ....................................................................................................................... 31 The Information Sector ............................................................................................................................ 32 The Finance and Insurance Sector .......................................................................................................... 33 The Educational Services Sector ............................................................................................................. 35 Health Care and Social Assistance Sector .............................................................................................. 36 The Arts, Entertainment and Recreation, and Accommodation and Food Services Sectors ................... 37 Utilities Sector .......................................................................................................................................... 38 Economic Development Plans and Comprehensive Studies for the Economy of Puerto Rico from 1970 to 2015 .................................................................................................................................... 39 Strategies by Industrial Sector ................................................................................................................. 42 Strengths and opportunities in industrial sectors ..................................................................................... 66

ECONOMIC DEVELOPMENT PLAN FOR PUERTO RICO 2015
1
ECONOMIC DEVELOPMENT PLAN FOR PUERTO RICO
PREFACE
Act No. 75 of June 24, 1975, as amended, mandates the Planning Board (PB) to prepare a Comprehensive Development Plan for Puerto Rico. Consequently, the PB has designed an Economic Development Plan 2015. This document is a valuable tool to make decisions on public policy, and is a useful instrument for those interested on economic issues. The Introduction of this Plan covers fi ve sections. The fi rst section presents a description of the design of the Plan and the methodology used. The second section includes an investigative diagnosis of the most important macroeconomic statistics in Puerto Rico for the fi scal years 1950 to 2013. The third section provides an analysis by industrial sector. The fourth section evaluates economic development plans realized previously in the past decades. Finally, the fi fth section analyzes the strengths and opportunities found in each industrial sector.
We want to thank the public and private entities that provided the data used to prepare this publication.
Introduction
On April 1, 2013, Planner Luis García Pelatti, President of the PB, assigned the Economic and Social Planning Program of the PB to design and prepare an Economic Development Plan for Puerto Rico which must focus on the following accountabilities:
• Identify market failures in industries. • Identify niches that maximize investment.• Identify strategies to increase production capacity.• Propose strategies based on evidence.• Conduct a cost-effective assessment of the strategies.• Propose evaluation mechanisms and control of strategies.• Propose cost effective public policy.
In order to fulfi ll the above objectives, the PB has hired 13 economists (ie, doctor of economics and economic consultants) with experience in the development of the sectors. The Plan has been designed to attend all the economic sectors of Puerto Rico. Table 1 shows all the sectors and the person responsible for investigating the assigned sector for the development of the said Plan.

ECONOMIC DEVELOPMENT PLAN FOR PUERTO RICO 2015
2
Section 1: Description of the Design and Methodology of the Plan
The Plan focuses on, identifying the condition of the sectors, develop strategies to promote the sectors, and create mechanisms to implement the changes effectively and effi ciently. The chapters are as follows:
• Chapter 1: Diagnostic Assessment• Chapter 2: SWOT Analysis • Chapter 3: Mission, goals and objectives• Chapter 4: Specifi c strategies• Chapter 5: Evaluation mechanisms
Chapter 1 of the Plan consists of a diagnostic evaluation of different industries or sectors. For this purpose, the Scriven logic has been used for diagnostic evaluation. The steps are: selection of performance criteria; establish the standards of expected performance; identify and report measurement instruments or metrics for each criterion; compare the performance based on the instrument or metric standards; and, synthesize results or pass judgment.
Table 1: Industrial sector grouping and person responsible of develop the sector:
Industry NAICS Consultant
Agriculture and Mining 11 Dr. Alexandra Gregory and Dr. Gladys González
Construction Real Estate and Rental and Leasing
23 & 53 Prof. Joaquin Villamil
Wholesale Trade, Retail Trade Transportation and Warehousing
42 44-45 48-49
Dr. José Alameda and Dr. Carlos del Valle
Finance and Insurance 52 Dr. Juan Lara Information 51 Lcda. Heidie Calero Manufacturing 31-33 Dr. Wilfredo Toledo Professional, Scientific, and Technical Services; Management of Companies and Enterprises; Administrative and Support, and Waste Management and Remediation
54-56 Dr. Julio César Hernández
Health Care and Social Assistance 62 Dr. José Laborde and Dr. Jaime del Valle
Educational Services 61 Dr. Julio César Hernández Art, Entertainment and Recreation Accommodation and Food Services
71 & 72 Dr. Julio César Hernández
Tourism Special theme Dr. Juan Lara
Energy Special theme Prof. Joaquin Villamil

ECONOMIC DEVELOPMENT PLAN FOR PUERTO RICO 2015
3
Also, the Chapter 2 includes a SWOT analysis for each sector. The SWOT analysis evaluates four components: strengths, weaknesses, opportunities and threats. A matrix for these four components is created to allow the development of a macro view of the condition of each of the sectors.
In Chapter 3 mission, goals and objectives are defi ned for each sector. The mission presents a statement that provides an explicit philosophical perspective of the contribution of this component to the economy. The goals are an overall results or purpose to be achieved in the sector and subsectors. The objectives are the specifi c outcomes that must be achieved in the short term (0-3 years), medium term (3-7 years) and, long term (7-20 years). The objectives are in accordance with SMART properties (Specifi c, Measurable, Attainable, Relevant, and Timely).
The Chapter 4 specifi es the strategies or activities needed to achieve the objectives for each sector. The strategies for the subsector are short term, medium term and long term. Those strategies must receive the input of the concerning organizations. Each strategy includes an assessment of the expected costs and benefi ts. They are supported by theory and empirical evidence.
In Chapter 5 specifi c metrics are established for formative and summative evaluation of each proposed strategy for the three terms (short, medium and long run). Also, a recommendation is issued in terms of the government agency in charge of conduct and specifi es the metrics technics to be used. Also, continuing investigations and surveys are also identifi ed to analyze the effectiveness of the measures.
Section 2: Economy of Puerto Rico for Fiscal Years 1950 to 2013 and Economic Outlook for Fiscal Years 2014 and 2015
This section presents an analysis of the historical behavior of key macroeconomic variables of Puerto Rico for fi scal years 1950 to 2013. During this period the economy of Puerto Rico has faced major challenges which have caused a reduced growth in recent fi scal years.
Gross National Product: What Happened in the 1970s?
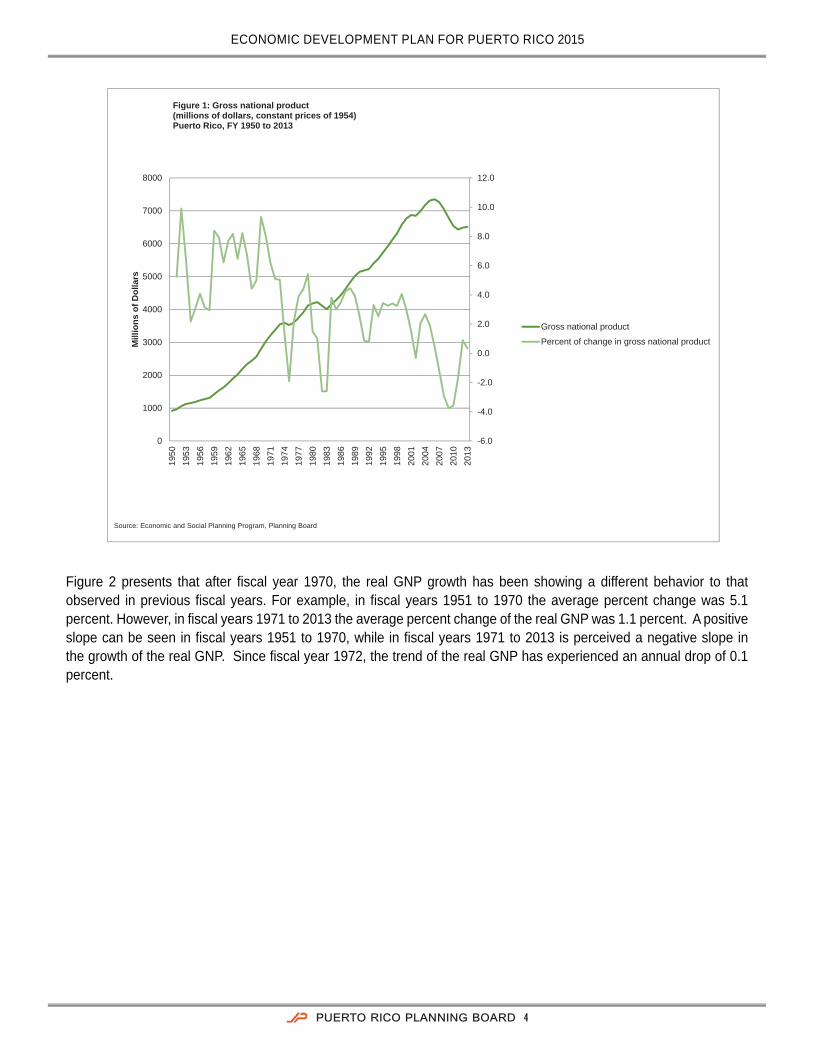
The gross national product (GNP) represents the total market value of all final goods and services produced in an economy by residents of the country. This is the leading indicator of economic activity in Puerto Rico. In fiscal year 2013, the GNP registered $6,511.5 million at constant prices (real means without the effect of price changes), representing an increase of 0.3 percent with respect to $6,489.5 million estimated for fiscal year 2012. During fiscal years 2009 to 2011, this variable showed declines of 3.8, 3.6 and 1.7 percent, respectively. Figure 1 presents the historical trajectory and the percent change of the real GNP. This graph shows three drastic reductions in the economy of Puerto Rico. These falls reached their lowest points during the fiscal years 1975, 1982 and 2009.
ECONOMIC DEVELOPMENT PLAN FOR PUERTO RICO 2015
4
Figure 2 presents that after fi scal year 1970, the real GNP growth has been showing a different behavior to that observed in previous fi scal years. For example, in fi scal years 1951 to 1970 the average percent change was 5.1 percent. However, in fi scal years 1971 to 2013 the average percent change of the real GNP was 1.1 percent. A positive slope can be seen in fi scal years 1951 to 1970, while in fi scal years 1971 to 2013 is perceived a negative slope in the growth of the real GNP. Since fi scal year 1972, the trend of the real GNP has experienced an annual drop of 0.1 percent.
-6.0
-4.0
-2.0
0.0
2.0
4.0
6.0
8.0
10.0
12.0
0
1000
2000
3000
4000
5000
6000
7000
800019
5019
5319
5619
5919
6219
6519
6819
7119
7419
7719
8019
8319
8619
8919
9219
9519
9820
0120
0420
0720
1020
13
Mill
ions
of D
olla
rs
Figure 1: Gross national product (millions of dollars, constant prices of 1954)Puerto Rico, FY 1950 to 2013
Gross national productPercent of change in gross national product
Source: Economic and Social Planning Program, Planning Board

ECONOMIC DEVELOPMENT PLAN FOR PUERTO RICO 2015
5
In per capita basis, the real GNP reached $19,428 in fi scal year 2013. This represented an increase of $763 per person, or 4.1 percent compared with the previous year. In the 2012 fi scal year the GNP per capita totaled $18,665. In Figure 3, similar to what is observed in Figure 2; there are two periods in the economy of Puerto Rico that can be identifi ed: one before and one after fi scal year 1970. Also, in per capita terms, it shows that the shrinkage occurred in early 1970’s was less deep and extensive than the one observed in early 1980 and the mid-2000. This change in the economy during the 1970’s decade has been attributed to several factors such as: bursting of real estate bubbles; (i.e., excessive growth in price levels that do not support the real value) in the construction sector and the mortgages for the year 1971 (Economic Report to the Governor, 1976); the rise in the price of oil of almost 170 percent in 1974; the increase in government transfers from the United States to Puerto Rico in social assistance programs for education (1973), housing (1974), and food (1975); an inadequate transition from an industrial system that was labor intensive, cheap, and non-skilled to another intensive in physical and human capital; the implementation in 1976 of the Section 936 of the United States Internal Revenue Code; and, the increase in the role of government in job creation (for 1980 the Government absorbed about a quarter of the jobs) (Dietz 1989; Catalá Olivieras, 1998).
-6
-4
-2
0
2
4
6
8
10
1958
1960
1962
1964
1966
1968
1970
1972
1974
1976
1978
1980
1982
1984
1986
1988
1990
1992
1994
1996
1998
2000
2002
2004
2006
2008
2010
2012
Perc
ent
Figure 2: Growth and trend of real gross national product (constant prices of 1954)Puerto Rico, FY 1958 to 2013
Percentage of growth of real gross nationalproductGrowth trend of real gross national product
Source: Economic and Social Planning Program, Planning Board

ECONOMIC DEVELOPMENT PLAN FOR PUERTO RICO 2015
6
The reduction in the real GNP growth at the beginning of 1980 has also been attributed to the increase in oil prices and to the policies of the United States Federal Reserve to reduce infl ation. For example in 1980 the price of oil increased by approximately 67.0 percent. It important to highlight that in per capita basis the reduction in the real GNP growth in early 1980s was slightly deeper than the decreases experienced in fi scal years 1970 and 2000. After fi scal year 1985 a stable GNP growth both in levels and in per capita basis, prevailed.
In the middle of the 2000s, the GNP growth experienced another drastic reduction. This crisis experienced was preceded by two main events: the elimination of Section 936 and 30A in year 2005 (although permanently repealed in August of 1996); and, the bursting of the second real estate bubble in 2000. Other events such as, the government shutdown of 2006; the implementation of a new tax system in 2006; and, the global recession of 2008, caused by the subprime mortgage market crisis, have been mentioned as events that exacerbated the contraction from the middle of the 2000s. It is important to note that the slowdown of the economy began in fi scal year 2004, although it was not until the fi scal year 2006, which takes place a reduction in the real GNP levels.
The PB projected the real GNP at $6,517.0 million for the fi scal year 2015. This would represent an increase of 0.1 percent compared to the fi scal year 2013. In fi scal year 2015, it is expected that the real GNP to reach $6,530.0 million, a rise of 0.2 percent.
-6.0
-4.0
-2.0
0.0
2.0
4.0
6.0
8.0
10.0
12.0
0
500
1000
1500
2000
2500
1950
1953
1956
1959
1962
1965
1968
1971
1974
1977
1980
1983
1986
1989
1992
1995
1998
2001
2004
2007
2010
2013
Mill
ions
of d
olla
rs
Figure 3: Gross national product per capita (millions of dollars, constant prices of 1954)Puerto Rico, FY 1950 to 2013
Gross national product per capita
Percentage of change in gross nationalproduct per capita
Source: Economic and Social Planning Program, Planning Board

ECONOMIC DEVELOPMENT PLAN FOR PUERTO RICO 2015
7
Population and Construction of Private Companies: the Engines of the Economy
The population and the construction carried out by private companies are two factors that both, the press and academic studies have associated with the growth of the real GNP. This theory has been emphasized by the Press, and the academic studies conducted by the Economic and Social Planning Program of the PB have found a positive relationship between these two variables and hence the growth of the real GNP. These studies indicate that the population growth explains up to 39.0 percent the changes in the real GNP. On the other hand, the growth of the construction of private enterprises explains up to 24.0 percent the changes in the real GNP. This means that only these two variables may explain up to 63.0 percent of the changes in the economy over the last 60 years. Figures 4 and 5 compare the growth of the population and the construction of private companies with the growth of the real GNP.
-6
-4
-2
0
2
4
6
8
10
12
-40
-30
-20
-10
0
10
20
30
40
50
60
70
Perc
enta
ge o
f cha
nge
Figure 4: Change in gross national product and change in private construction enterprises (millions of dollars, constant prices of 1954)Puerto Rico, FY 1950 to 2013
Percentage of change in private constructionenterprises
Percentage of change in gross nationalproduct
Source: Economic and Social Planning Program, Planning Board

ECONOMIC DEVELOPMENT PLAN FOR PUERTO RICO 2015
8
Population: Fewer People, Fewer Births, Less Economic Activity
The total population of Puerto Rico on April 1, 2010 was 3,725,789 inhabitants, according to data from the United States Census Bureau. This fi gure represents a reduction of 82,821 inhabitants, compared with the population in the 2000 Census. In addition, it is the fi rst time in more than a hundred years that the population shows a reduction from one census to another. The annual population growth rate has been undergoing a reduction since the 1980 Census. This rate was 1.0 percent for the period from 1980 to 1990; 0.8 percent for 1990-2000; and, -0.2 percent for 2000 to 2010. Figure 6 presents the changes in the population and the trajectory of the population during the period between 1950 and the 2013.
-1.5
-1
-0.5
0
0.5
1
1.5
2
2.5
3
-6
-4
-2
0
2
4
6
8
10
12
Perc
enta
ge o
f cha
nge
Figure 5: Percentage of change in real gross national product and population Puerto Rico, FY 1950 to 2013
Percentage of change in real gross nationalproductPopulation percentage of change
Source: Economic and Social Planning Program, Planning Board

ECONOMIC DEVELOPMENT PLAN FOR PUERTO RICO 2015
9
Changes in the population respond directly to changes in three factors: births, mortality and net migration (i.e., the balance between those who immigrate and those who migrate). Due to the fact that since the 1990s, mortality has remained stable, with approximately 29 thousand deaths per year, this variable has not been a determining factor in population changes. On the other hand, the birth and net migration have undergone drastic changes in recent decades. Since the 1950’s, Puerto Rico experienced a rapid reduction in the number of live births. These registered a reduction from approximately 60 thousand in the calendar year 2000 to approximately 42 thousand during the calendar year 2010. This represented a decrease of approximately 30.0 percent or about 1,700 live births on average per year. Studies conducted by the Economic and Social Planning Program of the PB suggests that the introduction of contraceptive technologies and the reduction of employment in the manufacturing sector explains approximately 50.0 percent of the changes in the number of live births. Also, it has been found that the birth rate was affected by the emigration of young people in reproductive ages. For example, as reflected in the 2010 Census, Puerto Rico experienced a decline in all age groups under than 43 years.
Figure 7 presents the historical series of birth rate and the percent change of the real GNP. This graph shows that the long term trend of births has had a negative slope since 1950. Studies conducted by the Economic and Social Planning Program of the PB found a positive association between live births and the growth of the real GNP. These studies indicate that the growth of births explained up to 15.0 percent of the changes in the real GNP.
-60
-40
-20
0
20
40
60
80
0
500
1000
1500
2000
2500
3000
3500
4000
4500
1950
1953
1956
1959
1962
1965
1968
1971
1974
1977
1980
1983
1986
1989
1992
1995
1998
2001
2004
2007
2010
2013
Thou
sand
s
Figure 6: Total population and population percentage of changePuerto Rico, Calendar Years 1950 to 2013
Total Population
Population percentage of change
Source: Economic and Social Planning Program, Planning Board

ECONOMIC DEVELOPMENT PLAN FOR PUERTO RICO 2015
10
Figure 8 shows three periods of high emigration and two high return migrations. These three periods of high migration reached its minimum approximately in 1953, 1985 and 2008. On the other hand, return migration peaked approximately in 1976 and 1994. The average separation between the ends of cycles mentioned before was approximately 14 years. These cycles of migration could be explained by factors such as, employment, income, crime, and working lifespan of migrants. Economic and Social Planning Program of the Puerto Rico PB has found that net migration explains up to 11.0 percent of the changes in the real GNP.
6
4
2
0
2
4
6
8
10
12
0
10000
20000
30000
40000
50000
60000
70000
80000
900001950
1953
1956
1959
1962
1965
1968
1971
1974
1977
1980
1983
1986
1989
1992
1995
1998
2001
2004
2007
2010
2013
Figure 7: Live biths and percentage of change in real gross national productPuerto Rico, FY 1950 to 2013
Live births
Percentage of change in real gross nationalproduct
Source: Economic and Social Planning Program, Planning Board

ECONOMIC DEVELOPMENT PLAN FOR PUERTO RICO 2015
11
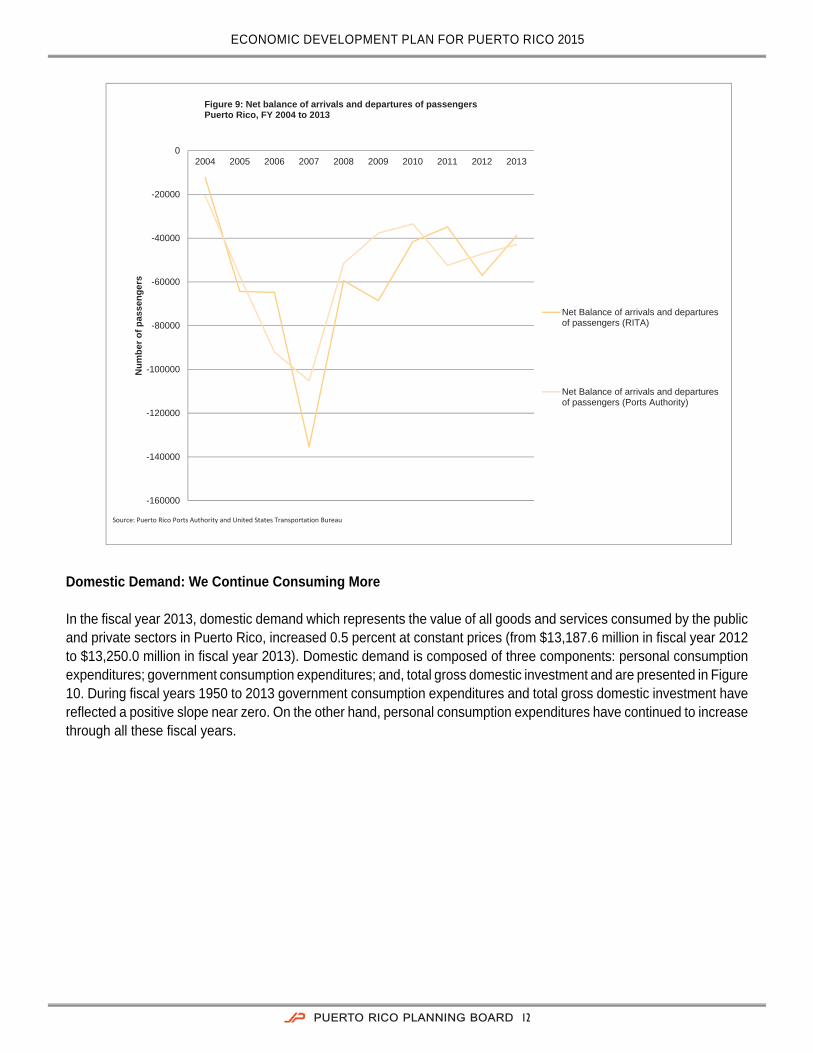
Figure 9 presents the balance of inputs and outputs of passengers, according to the Puerto Rico Ports Authority and the United States Department of Transportation - Research and Innovative Technology Administration (RITA). Both data series shows that the balance of arrivals and departures of passengers reached its minimum in fi scal year 2007 and after this date the departures have been reduced in net terms.
6
4
2
0
2
4
6
8
10
12
80000
60000
40000
20000
0
20000
40000
1951
1954
1957
1960
1963
1966
1969
1972
1975
1978
1981
1984
1987
1990
1993
1996
1999
2002
2005
2008
2011
Thou
sand
sofp
erson
Figure 8: Percentage of change in gross national product and net migration(millions of dollars, constant prices of 1954)Puerto Rico, FY 1950 to 2013
Net migration
Percentage of change in gross national product
Source: Economic and Social Planning Program, Planning Board
ECONOMIC DEVELOPMENT PLAN FOR PUERTO RICO 2015
12
Domestic Demand: We Continue Consuming More
In the fi scal year 2013, domestic demand which represents the value of all goods and services consumed by the public and private sectors in Puerto Rico, increased 0.5 percent at constant prices (from $13,187.6 million in fi scal year 2012 to $13,250.0 million in fi scal year 2013). Domestic demand is composed of three components: personal consumption expenditures; government consumption expenditures; and, total gross domestic investment and are presented in Figure 10. During fi scal years 1950 to 2013 government consumption expenditures and total gross domestic investment have refl ected a positive slope near zero. On the other hand, personal consumption expenditures have continued to increase through all these fi scal years.
-160000
-140000
-120000
-100000
-80000
-60000
-40000
-20000
02004 2005 2006 2007 2008 2009 2010 2011 2012 2013
Num
ber o
f pas
seng
ers
Figure 9: Net balance of arrivals and departures of passengersPuerto Rico, FY 2004 to 2013
Net Balance of arrivals and departuresof passengers (RITA)
Net Balance of arrivals and departuresof passengers (Ports Authority)
Source: Puerto Rico Ports Authority and United States Transportation Bureau

ECONOMIC DEVELOPMENT PLAN FOR PUERTO RICO 2015
13
The relative contribution of personal consumption expenditures in fi scal year 2013 was 75.6 percent, compared with the contribution of 74.2 percent in fi scal year 2012. In fi scal year 2013 the personal consumption expenditure, main component of domestic demand, totaled $10,023.3 million at constant prices. This represented an increase of 2.4 percent related to the previous fi scal year. Similarly, the participation related to government consumption expenditures within the gross domestic demand reached 13.4 percent compared to the fi scal year 2012 when it accounted for 13.5 percent.
The amount of the consumption expenditure of central government and municipalities in fi scal year 2013 was $1,772.8 million at constant prices, representing a decline of 0.7 percent when compared with the fi scal year 2012. The relative share of gross domestic investment in domestic demand fell to 10.9 percent in fi scal year 2013 compared with fi scal year 2012 when it was 12.2 percent. Within the total of gross domestic investment in fi scal year 2013, construction investment reached $446.5 million at constant prices, refl ecting a decline of 11.3 percent compared to the fi scal year of 2012 whose value was $503.1 million.
Figure 11 presents personal consumption expenditure, government consumption expenditure, and total gross domestic investment relative to the real GNP from fi scal years 1950 to 2013. In this period, government consumption expenditure and total gross domestic investment were approximately 20 percent of the real GNP. In 1950, personal consumption spending represented approximately 88.0 percent of the real GNP in the fi scal year 1950. In contrast, for fi scal year 2013 the personal consumption expenditure represented 154.0 percent of the real GNP.
0.00
2000.00
4000.00
6000.00
8000.00
10000.00
12000.00
1950
1953
1956
1959
1962
1965
1968
1971
1974
1977
1980
1983
1986
1989
1992
1995
1998
2001
2004
2007
2010
2013
Mill
ions
of d
olla
rs
Figure 10: Components of domestic demand(millions of dollars, constant prices of 1954)Puerto Rico, FY 1950 to 2013
Personal consumption spending
Government expenditure
Gross domestic investment
Source: Economic and Social Planning Program, Planning Board

ECONOMIC DEVELOPMENT PLAN FOR PUERTO RICO 2015
14
Gross Domestic Fixed Investment: Two Bubbles, Two Recessions
The construction activity plays a key role in the economy, both in job creation and the development of infrastructure in Puerto Rico. Construction investment refers to the new construction made by private companies and the state government. The construction activity includes the construction, expansion, repair and remodeling of buildings or structures such as residential, commercial, industrial buildings, roads, bridges, ports and other works made by construction companies.
In the fi scal year 2013, construction investment at nominal prices reached $4,115.9 million and at constant prices, $446.5 million. At constant prices, the investment in machinery and equipment in fi scal year 2013, Puerto Rico totaled $994.4 million, refl ecting a decrease of 4.3 percent. Similarly, at nominal prices, investment in machinery and equipment in fi scal year 2013 recorded a decrease of 1.9 percent reaching a total value of $5,694.7 million.
Figure 12 presents the behavior of the components of gross domestic fi xed investment during the fi scal years 1950 and 2013. By defi nition, gross domestic fi xed investment consists of investment in construction and, machinery and equipment. In the case of construction, the fi gure 12 shows two reductions of great magnitude in the series in the fi scal years 1972 and 2001. After these fi scal years the construction sector experienced drastic reductions. However, in all these years, machinery and equipment investment has remained relatively stable, even in periods of contraction of the real GNP.
0.0
20.0
40.0
60.0
80.0
100.0
120.0
140.0
160.0
180.0
1950
1953
1956
1959
1962
1965
1968
1971
1974
1977
1980
1983
1986
1989
1992
1995
1998
2001
2004
2007
2010
2013
Mill
ions
of d
olla
rs
Figure 11: Components of domestic demand as a share of gross national productPuerto Rico, FY 1950 to 2013
Total personal consumption expenditure
Total government expenditure
Gross domestic investment
Source: Economic and Social Planning Program, Planning Board
ECONOMIC DEVELOPMENT PLAN FOR PUERTO RICO 2015
15
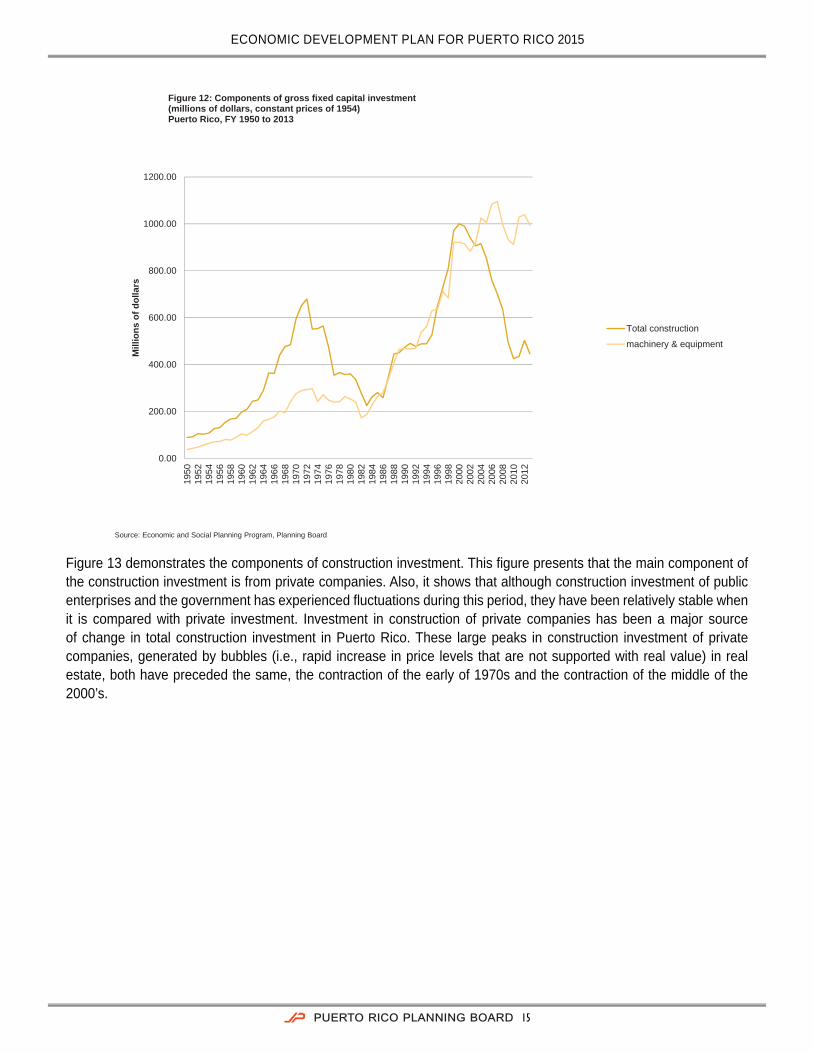
Figure 13 demonstrates the components of construction investment. This fi gure presents that the main component of the construction investment is from private companies. Also, it shows that although construction investment of public enterprises and the government has experienced fl uctuations during this period, they have been relatively stable when it is compared with private investment. Investment in construction of private companies has been a major source of change in total construction investment in Puerto Rico. These large peaks in construction investment of private companies, generated by bubbles (i.e., rapid increase in price levels that are not supported with real value) in real estate, both have preceded the same, the contraction of the early of 1970s and the contraction of the middle of the 2000’s.
0.00
200.00
400.00
600.00
800.00
1000.00
1200.0019
5019
5219
5419
5619
5819
6019
6219
6419
6619
6819
7019
7219
7419
7619
7819
8019
8219
8419
8619
8819
9019
9219
9419
9619
9820
0020
0220
0420
0620
0820
1020
12
Mill
ions
of d
olla
rs
Figure 12: Components of gross fixed capital investment (millions of dollars, constant prices of 1954)Puerto Rico, FY 1950 to 2013
Total constructionmachinery & equipment
Source: Economic and Social Planning Program, Planning Board

ECONOMIC DEVELOPMENT PLAN FOR PUERTO RICO 2015
16
The projections of the Economic and Social Planning Program of the PB indicates that for fi scal year 2015 the construction investment at constant prices will reach $391.0 million, a decrease of 12.4 percent. Also, in fi scal year 2015 it’s expected a decrease of 5.6 percent, which represents a value of $369.0 million. On the other hand, the forecast for investment in machinery and equipment at constant prices indicates a value of $945.0 million in fi scal year 2015 and $893.0 million in fi scal year 2015.
Personal Consumption: Puerto Rico will Remain to be a Service Economy?
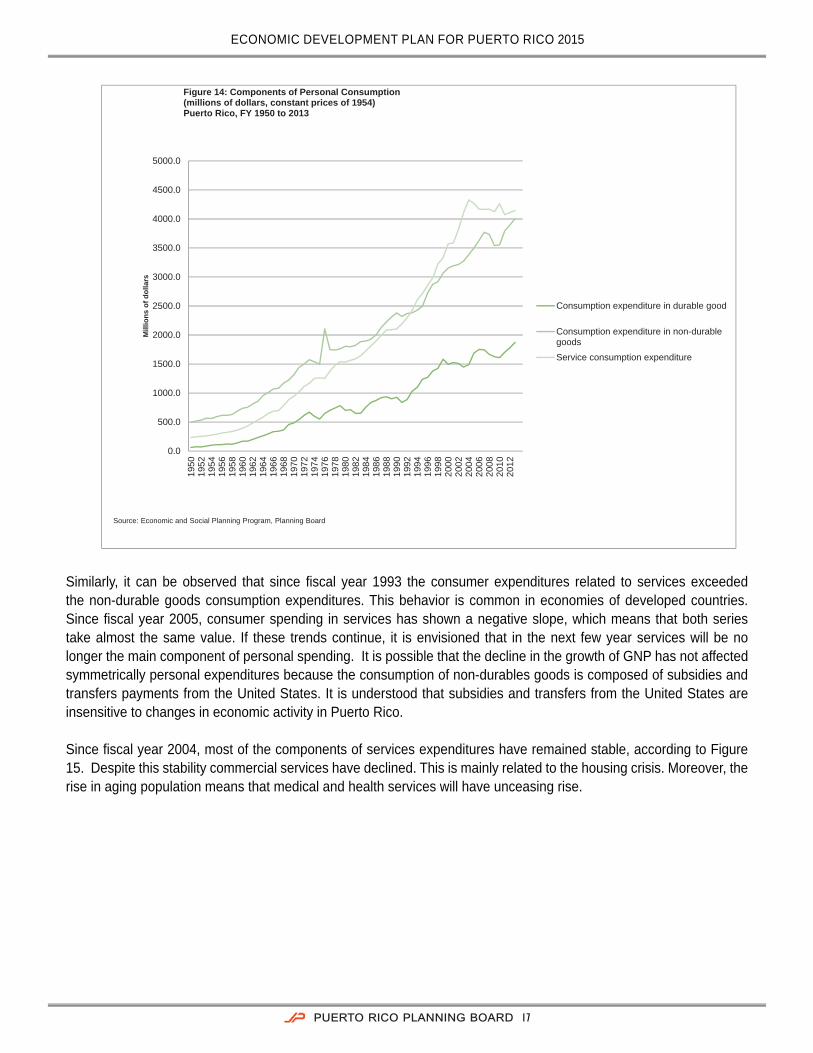
The personal consumption expenditures are the main component of the GNP. Real personal consumption expenditures totaled $10,023.3 billion in fi scal year 2013, representing an increase of 2.4 percent when compared with the fi scal year 2012. This performance was sustained by a rise of 5.3 percent in durable consumption expenditures, 2.8 percent in non-durable goods consumption expenditures, and 0.8 percent in consumption expenditures related to services. Figure 14 presents the time series of the components of personal consumption expenditures.
0.0
100.0
200.0
300.0
400.0
500.0
600.0
700.0
1950
1952
1954
1956
1958
1960
1962
1964
1966
1968
1970
1972
1974
1976
1978
1980
1982
1984
1986
1988
1990
1992
1994
1996
1998
2000
2002
2004
2006
2008
2010
2012
Mill
ions
of d
olla
rs
Figure 13: Components of invetment in construction(millions of dollars, constant prices of 1954)Puerto Rico, FY 1950 to 2013
Construction of private enterprises
Construction of public enterprises
Construction of government
Source: Economic and Social Planning Program, Planning Board
ECONOMIC DEVELOPMENT PLAN FOR PUERTO RICO 2015
17
Similarly, it can be observed that since fi scal year 1993 the consumer expenditures related to services exceeded the non-durable goods consumption expenditures. This behavior is common in economies of developed countries. Since fi scal year 2005, consumer spending in services has shown a negative slope, which means that both series take almost the same value. If these trends continue, it is envisioned that in the next few year services will be no longer the main component of personal spending. It is possible that the decline in the growth of GNP has not affected symmetrically personal expenditures because the consumption of non-durables goods is composed of subsidies and transfers payments from the United States. It is understood that subsidies and transfers from the United States are insensitive to changes in economic activity in Puerto Rico.
Since fi scal year 2004, most of the components of services expenditures have remained stable, according to Figure 15. Despite this stability commercial services have declined. This is mainly related to the housing crisis. Moreover, the rise in aging population means that medical and health services will have unceasing rise.
0.0
500.0
1000.0
1500.0
2000.0
2500.0
3000.0
3500.0
4000.0
4500.0
5000.0
1950
1952
1954
1956
1958
1960
1962
1964
1966
1968
1970
1972
1974
1976
1978
1980
1982
1984
1986
1988
1990
1992
1994
1996
1998
2000
2002
2004
2006
2008
2010
2012
Mill
ions
of d
olla
rs
Figure 14: Components of Personal Consumption(millions of dollars, constant prices of 1954)Puerto Rico, FY 1950 to 2013
Consumption expenditure in durable good
Consumption expenditure in non-durablegoodsService consumption expenditure
Source: Economic and Social Planning Program, Planning Board

ECONOMIC DEVELOPMENT PLAN FOR PUERTO RICO 2015
18
In per capita terms, personal consumption expenditures in fi scal year 2013 totaled $17,168. This represented an increase of $604 per person or a 3.6 percent, compared with the previous fi scal year. For the fi scal year 2012, personal consumption expenditures per capita totaled $16,564. On the other hand, disposable personal income per capita in fi scal year 2013 amounted to $16,776. This refl ected an increase of $464 per person or a 2.8 percent compared with the previous fi scal year. It is possible that the discrepancy between disposable personal income per capita and personal consumption expenditures per capita can be explained by factors, such as: the underground economy, the generation of personal debt, and infl ow of remittances by Puerto Ricans in the United States.
The personal consumption expenditures estimated for fi scal year 2015 is $10,156.0 million, representing a growth of 1.3 percent; and for fi scal year 2015 is $10,273.0 million, a rise of 1.2 percent. At nominal prices, the projected fi gures for those years are $63,789.0 million and $64,934.0 million, respectively. This results in respected increases of 2.0 and 1.8 percent
Government Expenditures and Gross Public Debt: Continues to Increase Municipality Expenditures
The total government expenditures accounted for 27.2 percent of real GNP in fi scal year 2013. Consistently, not seasonally adjusted data from the Current Employment Survey, known as Establishment Survey of the Department of Labor and Human Resources, indicates that the proportion of government employment as part of total employment in the economy was a 29.4 percent in the same fi scal year. In fi scal year 2013 total government expenditures at nominal prices reached $10,716.0 million and at constant prices, $1,772.8 million. Similarly, the spending of the government of the Commonwealth of Puerto Rico amounted $1,229.6 million at constant prices, refl ecting a decrease of 2.3 percent
0
200
400
600
800
1000
1200
1400
2004 2005 2006 2007 2008 2009 2010 2011r 2012r 2013p
Mill
ions
of d
olla
rs
Figure 15: Components of services consumption(millions of dollars, constant prices of 1954)Puerto Rico, FY 2004 a 2013
Housing
Commercial services
Household utilities
Medical and health services
Transportation
Recreation
Education
Source: Economic and Social Planning Program, Planning Board
ECONOMIC DEVELOPMENT PLAN FOR PUERTO RICO 2015
19
compared with previous fi scal year. On the other hand, at constant prices, the expenditures of the Municipalities of Puerto Rico registered an increase of 2.9 percent, reaching a total value of $543.2 million.
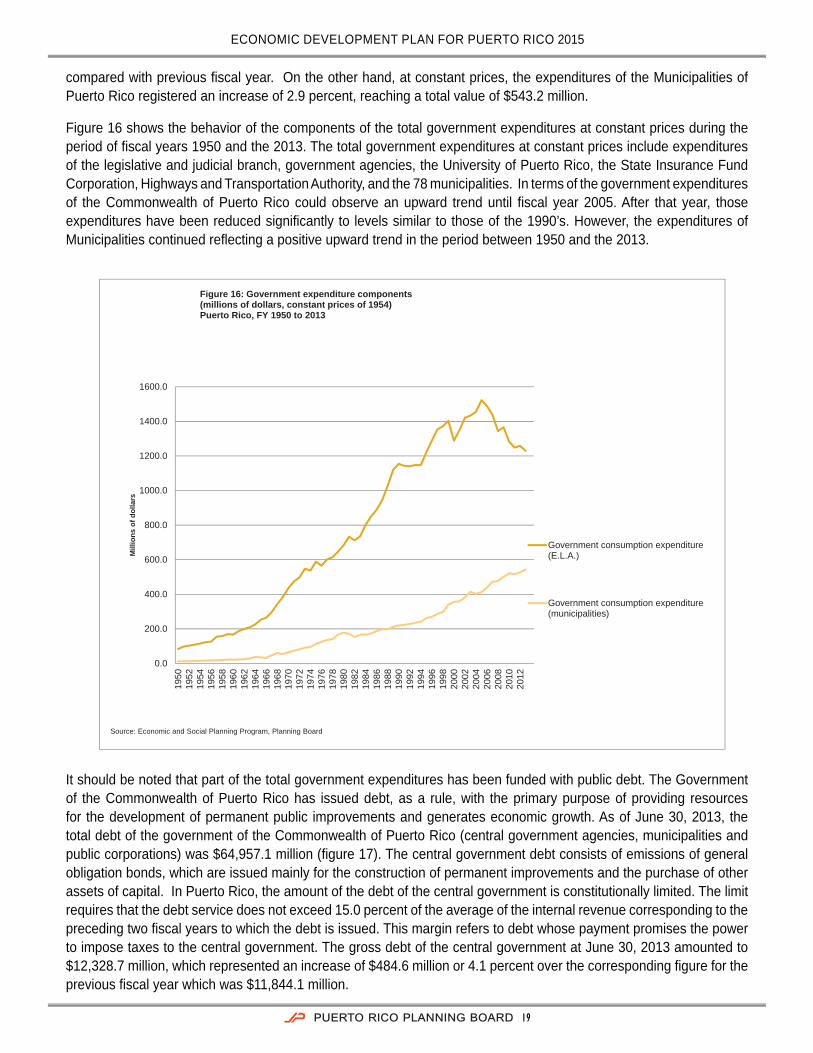
Figure 16 shows the behavior of the components of the total government expenditures at constant prices during the period of fi scal years 1950 and the 2013. The total government expenditures at constant prices include expenditures of the legislative and judicial branch, government agencies, the University of Puerto Rico, the State Insurance Fund Corporation, Highways and Transportation Authority, and the 78 municipalities. In terms of the government expenditures of the Commonwealth of Puerto Rico could observe an upward trend until fi scal year 2005. After that year, those expenditures have been reduced signifi cantly to levels similar to those of the 1990’s. However, the expenditures of Municipalities continued refl ecting a positive upward trend in the period between 1950 and the 2013.
It should be noted that part of the total government expenditures has been funded with public debt. The Government of the Commonwealth of Puerto Rico has issued debt, as a rule, with the primary purpose of providing resources for the development of permanent public improvements and generates economic growth. As of June 30, 2013, the total debt of the government of the Commonwealth of Puerto Rico (central government agencies, municipalities and public corporations) was $64,957.1 million (fi gure 17). The central government debt consists of emissions of general obligation bonds, which are issued mainly for the construction of permanent improvements and the purchase of other assets of capital. In Puerto Rico, the amount of the debt of the central government is constitutionally limited. The limit requires that the debt service does not exceed 15.0 percent of the average of the internal revenue corresponding to the preceding two fi scal years to which the debt is issued. This margin refers to debt whose payment promises the power to impose taxes to the central government. The gross debt of the central government at June 30, 2013 amounted to $12,328.7 million, which represented an increase of $484.6 million or 4.1 percent over the corresponding fi gure for the previous fi scal year which was $11,844.1 million.
0.0
200.0
400.0
600.0
800.0
1000.0
1200.0
1400.0
1600.0
1950
1952
1954
1956
1958
1960
1962
1964
1966
1968
1970
1972
1974
1976
1978
1980
1982
1984
1986
1988
1990
1992
1994
1996
1998
2000
2002
2004
2006
2008
2010
2012
Mill
ions
of d
olla
rs
Figure 16: Government expenditure components(millions of dollars, constant prices of 1954)Puerto Rico, FY 1950 to 2013
Government consumption expenditure(E.L.A.)
Government consumption expenditure(municipalities)
Source: Economic and Social Planning Program, Planning Board

ECONOMIC DEVELOPMENT PLAN FOR PUERTO RICO 2015
20
The debt of the public corporations that are payable from their own incomes are defi ned by trusts agreements that each public corporations underwrite with investors through one or more trustees. Each of these agreements establishes, among other aspects, the amount of income required to the service of the current debt and that which is required to issue new debt. At June 30, 2013, the amount of the debt of the public corporations amounted to $48,746.4 million. Meanwhile the gross debt of the Municipios of Puerto Rico on June 30, 2013, totaled $3,882.0 million. This fi gure exceeded by $10.5 million the outstanding debt at June 30, 2012, which amounted to $3,871.5 million. That is, the Municipal debt registered an increase of 0.3 percent.
Exports and Imports: Trade Defi cit Continues to Expand?
Exports of goods and services totaled $5,752.5 million at constant prices in the fi scal year 2013. This represented a decrease of 2.5 percent compared to $5,900.8 million for fi scal year 2012. Industries that exported more were those of chemical products, and medical materials. On the other hand, total imports of goods and services totaled $12,490.9 million at constant prices in fi scal year 2013. This represented a decrease of a 0.9 percent compared to fi scal year 2012.
Figure 18 presents the historical series of exports and imports at constant prices. The fi gure shows that both series have turned away over time. Also, it highlights that between fi scal years 1950 and 2007 exports and imports had an upward trend. After 2007, both series have begun to decrease. However, real exports appear to have decreased with a negative slope, which could imply for Puerto Rico a higher commercial trade defi cit in the future. It is important to note that an increase in the commercial trade defi cit implies loss of wealth. Since we do not sell more to foreign countries, internal wealth of Puerto Rico is used to cover purchases abroad. Two alternatives to reduce the trade defi cit are, that the Government encourage the linkages (i.e., which industries buy and sell intermediate products to local industries) with local industries, and import substitution.
0.00
10,000.00
20,000.00
30,000.00
40,000.00
50,000.00
60,000.00
Mill
ions
of d
olla
rsFigure 17: Components of total public debt (millions of dollars, constant prices of 1954)Puerto Rico, FY 1980 to 2013
Central government
Municipalities
Public corporations
Source: Government Development Bank

ECONOMIC DEVELOPMENT PLAN FOR PUERTO RICO 2015
21
Regarding transactions with the rest of the world at nominal prices, an increase in sales of goods and services of 0.5 percent was registered for fi scal year 2013. The amount reached was $75,092.7 million. The adjusted merchandise1
represented 90.9 percent of total sales of goods and services. This refl ected an increase of 0.4 percent reaching $68,269.1 million. However, purchases of goods and services refl ected a 0.9 percent reduction to record the amount of $87,562.4 million in fi scal year 2013. In fi scal year 2012, sales and purchases of goods and services showed a decrease of 2.4 and 1.4 percent, respectively.
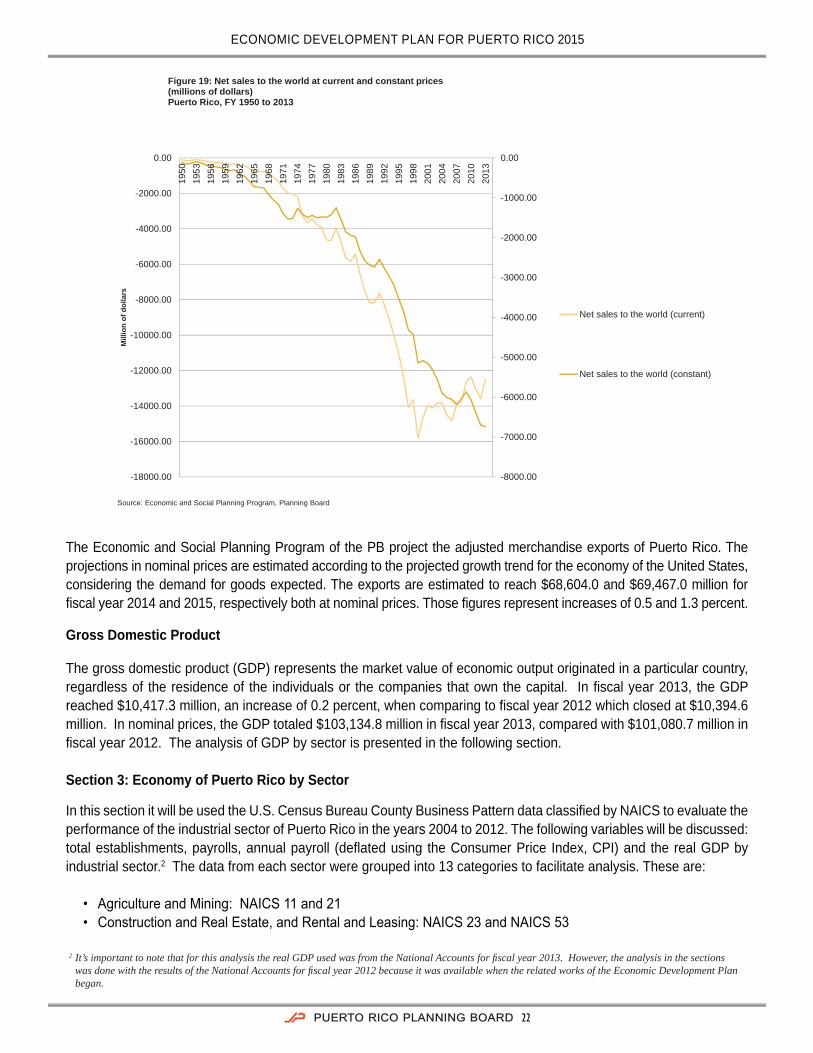
Figure 19 shows the net sales (i.e., net exports) in nominal and constant prices. This series presents four periods that coincide with contractions experienced in the economy of Puerto Rico. The fi rst period occurs between fi scal years 1950 and 1970, the second from fi scal years 1971 to 1982, the third in fi scal years 1983 to 2000, and the fourth quarter of 2001 to the present.
0.0
2000.0
4000.0
6000.0
8000.0
10000.0
12000.0
14000.0
16000.019
5019
5219
5419
5619
5819
6019
6219
6419
6619
6819
7019
7219
7419
7619
7819
8019
8219
8419
8619
8819
9019
9219
9419
9619
9820
0020
0220
0420
0620
0820
1020
12
Mill
ions
of d
olla
rs
Figure 18: Components of domerstic demand in per capita terms(millions of dollars, constant prices of 1954)Puerto Rico, FY 1950 a 2013
Total purchases to the world
Total sales to the world
Source: Economic and Social Planning Program, Planning Board
1 Some adjustment items are subtracted (-) and other add (+). Among them: unregistered goods (+); excise taxes on rum shipments (+); parcels (+); and re-exports (-).
ECONOMIC DEVELOPMENT PLAN FOR PUERTO RICO 2015
22
The Economic and Social Planning Program of the PB project the adjusted merchandise exports of Puerto Rico. The projections in nominal prices are estimated according to the projected growth trend for the economy of the United States, considering the demand for goods expected. The exports are estimated to reach $68,604.0 and $69,467.0 million for fi scal year 2014 and 2015, respectively both at nominal prices. Those fi gures represent increases of 0.5 and 1.3 percent.
Gross Domestic Product
The gross domestic product (GDP) represents the market value of economic output originated in a particular country, regardless of the residence of the individuals or the companies that own the capital. In fi scal year 2013, the GDP reached $10,417.3 million, an increase of 0.2 percent, when comparing to fi scal year 2012 which closed at $10,394.6 million. In nominal prices, the GDP totaled $103,134.8 million in fi scal year 2013, compared with $101,080.7 million in fi scal year 2012. The analysis of GDP by sector is presented in the following section.
Section 3: Economy of Puerto Rico by Sector
In this section it will be used the U.S. Census Bureau County Business Pattern data classifi ed by NAICS to evaluate the performance of the industrial sector of Puerto Rico in the years 2004 to 2012. The following variables will be discussed: total establishments, payrolls, annual payroll (defl ated using the Consumer Price Index, CPI) and the real GDP by industrial sector.2 The data from each sector were grouped into 13 categories to facilitate analysis. These are:
• Agriculture and Mining: NAICS 11 and 21• Construction and Real Estate, and Rental and Leasing: NAICS 23 and NAICS 53
-8000.00
-7000.00
-6000.00
-5000.00
-4000.00
-3000.00
-2000.00
-1000.00
0.00
-18000.00
-16000.00
-14000.00
-12000.00
-10000.00
-8000.00
-6000.00
-4000.00
-2000.00
0.00
1950
1953
1956
1959
1962
1965
1968
1971
1974
1977
1980
1983
1986
1989
1992
1995
1998
2001
2004
2007
2010
2013
Mill
ion
of d
olla
rs
Figure 19: Net sales to the world at current and constant prices(millions of dollars)Puerto Rico, FY 1950 to 2013
Net sales to the world (current)
Net sales to the world (constant)
Source: Economic and Social Planning Program, Planning Board
2 It’s important to note that for this analysis the real GDP used was from the National Accounts for fi scal year 2013. However, the analysis in the sections was done with the results of the National Accounts for fi scal year 2012 because it was available when the related works of the Economic Development Plan began.

ECONOMIC DEVELOPMENT PLAN FOR PUERTO RICO 2015
23
• Manufacturing: NAICS 31-33• Trade: NAICS 42, 44 and 45• Transportation and Warehousing: NAICS 48 and 49• Information: NAICS 51• Finance and Insurance: NAICS 52• Professional, Scientifi c, and Technical Services: NAICS 54• Management of Companies and Enterprises: NAICS 55• Administrative and Support and Waste Management and Remediation Services: NAICS 56• Other Services: NAICS 81• Educational Services: NAICS 61• Health Care and Social Assistance: NAICS 62• Arts, Entertainment, and Recreation: NAICS 71• Accommodation and Food Services: NAICS 72• Utilities: NAICS 22
In order to analyze the economic benefi ts of employees by industry at per capita level, the annual payroll per employee was calculated with the data of total annual payroll and number of employees. The annual payroll per employees is presented at nominal and constant prices. The annual payroll per employee at constant prices facilitates comparison between the time series of 2004 to 2012, eliminating the price effect.
Figure 20 shows the number of employees by sector for the years 2004 to 2012. The service, trade, and manufacturing sector recorded reductions. Meanwhile, the industries that experienced growth during the mentioned period were education, and health and social services. In 2012, the number of employees for all the sectors was 690,597. This represented an increase of 16,920 jobs or 2.5 percent compared to 2011 which reached 673,677. In 2004 the number of employees totaled 722,529 refl ecting a reduction of 31,932 or 4.4 percent when compared to 2012.
0
50000
100000
150000
200000
250000
300000
2004 2005 2006 2007 2008 2009 2010 2011 2012
Num
ber o
f em
ploy
ees
Figure 20: Number of employees by sector Puerto Rico, Calendar Year 2004 al 2012
Other services
Trade
Education, health and social services
Construction, mining and real estate
Manufacturing
Others
Agriculture
Source: Economic and Social Planning Program, Planning Board

ECONOMIC DEVELOPMENT PLAN FOR PUERTO RICO 2015
24
Figure 21 presents the fl uctuation in the number of establishments by sector of the economy of Puerto Rico for the period 2004 to 2012. It can be observed that trade, professional, scientifi c and technical services, management of companies and enterprises; administrative and support services, other services, and health care and social assistance contain about 6,000 establishments. On the other hand, sectors with less than 1,000 establishments were information and educational services. Sectors with less than 100 establishments were agriculture, mining, and utilities.
The total number of establishments in Puerto Rico in 2012 was 44,767. This represented an increase of 711 or 1.6 percent compared to 2011 when the total of establishments reached 44,056. In 2004 the total was 46,595 establishments. In 2012 the number of establishment decreased by 1,828, or 3.92 percent compared to 2004. The sectors that showed growth in the number of establishment when comparing with the period between 2004 and 2012 were as follows: utilities, information, professional, scientifi c, and technical services; management of companies and enterprises, administrative and support services, other services, educational services, and health care and social assistance. It should be noted that the number of establishments in the unclassifi ed sector decreased by 1,859 when comparing the period between 2004 and 2012.
Figure 22 presents the annual payroll per employee by industrial sector for the period of 2004 to 2012, at constant prices of the year 2013. In order to make comparable the annual payroll per employee eliminating the infl ation effect on the purchasing power of money, the data is presented at constant prices. The annual payroll per employee totaled $24,698 in 2012. This represented a decrease at constant prices of $364 or 1.5 percent with respect to 2011 when reported $25,062. In 2004 annual payroll per employee was $ 28,076. Comparing with 2012 and 2004 a reduction of $3,377 or 12.0 percent is observed
0
2000
4000
6000
8000
10000
12000
14000
16000
18000
20000
2004 2005 2006 2007 2008 2009 2010 2011 2012
Figure 21: Number of establishments by sectorPuerto Rico, Calendar Year 2004 al 2012
Other services
Trade
Education, health and social services
Construction, mining and real estate
Manufacturing
Others
Agriculture
Source: Economic and Social Planning Program, Planning Board

ECONOMIC DEVELOPMENT PLAN FOR PUERTO RICO 2015
25
Analyzing the real GDP by industrial sector, the manufacturing and real estate contributed to total GDP with approximately 62.3 and 23.5 percent, respectively, in the fiscal year 2012 (Figure 23). In terms of absolute values the real GDP for fiscal years 2004, 2011 and 2012 totaled $11,609.9, $10,597.3 and, $10,394.6 million, respectively.

ECONOMIC DEVELOPMENT PLAN FOR PUERTO RICO 2015
26
In this section it will be presented a spatial analysis using choropleth maps about the number of total establishments by industrial sector in Puerto Rico for 2012. A choropleth map is a type of thematic map whose regions are tinged with different colors in order to highlight statistical information such as population density, income per capita, among others. The map is divided into several categories that were calculated using “natural break”, method which classifi es the data to determine the best arrangement of values. In this particular case, the choropleth maps highlight the number of establishments by economic sector per municipality. It should be noted that various maps present discrepancy between the total number of establishments registered by the U.S. Census Bureau County Business Pattern and the total sum of establishments by municipality. This discrepancy is because there is a category called “Statewide” which is not comparable to any particular Municipio of Puerto Rico. Because according to the Census Bureau, Puerto Rico is considered a County. A total of 14 maps are presented for each different industrial sector.
Figure 24 presents the total number of establishments for all industrial sectors in Puerto Rico and its 78 municipalities. The spatial analysis shows a total of 44,727 establishments divided into 5 categories. These are:
• First category: 19 to 205 establishments• Second category: 206 to 391 establishments• Third category: 392 to 721 establishments• Fourth category: 722 to 1,615 establishments• Fifth category: 1,616 to 3,220 establishments
The discrepancy in the total number of establishments for Puerto Rico is 40.
The following shows the performance of every industrial sector.

ECONOMIC DEVELOPMENT PLAN FOR PUERTO RICO 2015
27
Agriculture and Mining Sectors
In the Agriculture and Mining sectors the total number of employees was 815 in year 2012. This represented an increase of 33 more jobs or 4.4 percent when comparing with year 2011 which totaled 782. In 2004 the employment for these sectors reached 952. When comparing between 2012 and 2004, there was a decrease of 137 jobs or 85.6 percent.
The annual payroll per employee in constant prices (real terms) in these sectors in 2012 was $20,634, an increase of 3.0 percent compared with 2011. In 2004 the real annual payroll per employee was $27,560, refl ecting a decrease of $6,926 or 25.1 percent when compared to the year 2012. Certainly the Agriculture and Mining sectors have maintained a downward trend in annual payroll per employee at constant prices of 2013.
In fi scal year 2012 the GDP at constant prices from Agriculture and Mining sectors fell 1.4 percent, when compared to fi scal year 2011. However, when comparing fi scal years 2012 and 2004, it rose 12.5 percent. This increase was driven by the agricultural sector which refl ected an upturn of 15.3 percent in fi scal year 2012 compared to fi scal year 2004.
The total number of establishments in the Agriculture and Mining sectors in 2012 was 54, representing a decrease of 3.6 percent compared to the year 2011. The number of establishments in 2012 compared to 2004 refl ected a reduction of 6.9 percent. Figure 25 presents the total number of establishments for Agriculture and Mining sectors in Puerto Rico and its 78 Municipalities. In general, this map shows three principal pathways in terms of the mentioned sectors: (1) between the municipalities of Vega Baja and San Juan, (2) Aguadilla and Arecibo, (3) Cabo Rojo and Aguadilla and (4) Caguas and Humacao: Concentrations around the municipality of Ponce is also observed.

ECONOMIC DEVELOPMENT PLAN FOR PUERTO RICO 2015
28
Construction and, Real Estate and Rental Sectors
The Construction and, Real Estate and Rental sectors provide dynamism to the economy of Puerto Rico. In these sectors, in year 2012 the employment was 43,824. This represented a rise of 3,030 jobs or 7.4 percent in relation to 2011 that totaled 40,794. In 2004, employment in the Construction and, Real Estate and Rental sectors reached 75,777 compared with 2012. This represents a reduction of 42.2 percent. These sectors grew from 2004 to 2005, and then for the rest of the period until 2011 remained decreasing with a downward slope.
In 2012 the real annual payroll per employee of these sectors was $21,591. This represented a reduction of $433 or 2.0 percent from the year 2011. Comparing year 2012 with 2004 represented an increase in absolute terms of $1,297.
The growth rate of real GDP from Construction and, Real Estate and Rental sectors in fi scal year 2012 increased 2.4 percent, compared to fi scal 2011. When comparing to fi scal 2004, it rose 23.3 percent. It must be emphasized that the second largest contribution to GDP came from Real Estate and Rental sector. Conversely, the Construction sector in the time series from 2004 to 2012 has declined consistently. In summary, in the fi scal year 2012 the contribution to real GDP from the construction, real estate and rental sectors was $2,440.4 million.
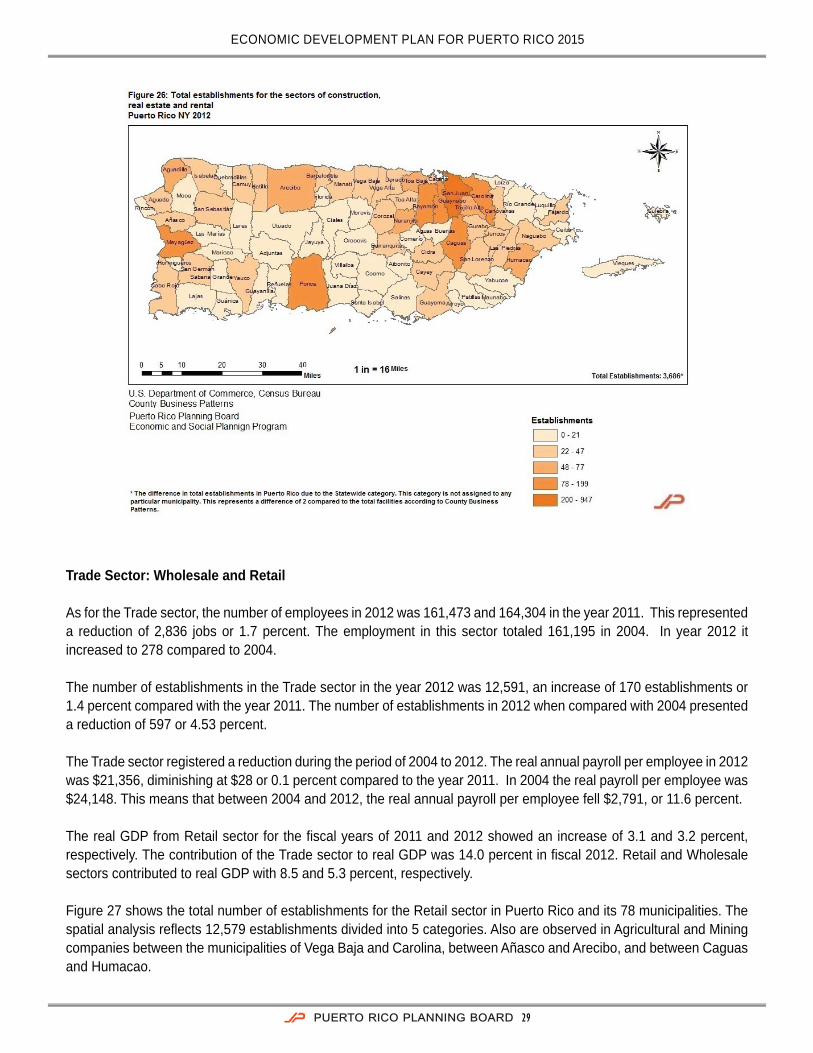
The Construction, Real Estate and Rental sectors experienced reductions in the number of establishments during the period of 2004 to 2015. The number of establishments in these sectors was 3,688 in 2012. This represented a rise of 0.1 per cent compared to the year 2011. In year 2004 the number of establishments in these sectors was 4,523. Comparing the year 2012 with 2004, the number of establishments decreased 18.5 percent. Figure 26 shows the total number of establishments for Construction, Real Estate and Rental sectors in Puerto Rico and its 78 municipalities. The spatial analysis refl ects 3,686 establishments divided into 5 categories. The concentrations of the sectors in San Juan, Carolina, Mayaguez and Ponce can be seen in the following map.
ECONOMIC DEVELOPMENT PLAN FOR PUERTO RICO 2015
29
Trade Sector: Wholesale and Retail
As for the Trade sector, the number of employees in 2012 was 161,473 and 164,304 in the year 2011. This represented a reduction of 2,836 jobs or 1.7 percent. The employment in this sector totaled 161,195 in 2004. In year 2012 it increased to 278 compared to 2004.
The number of establishments in the Trade sector in the year 2012 was 12,591, an increase of 170 establishments or 1.4 percent compared with the year 2011. The number of establishments in 2012 when compared with 2004 presented a reduction of 597 or 4.53 percent.
The Trade sector registered a reduction during the period of 2004 to 2012. The real annual payroll per employee in 2012 was $21,356, diminishing at $28 or 0.1 percent compared to the year 2011. In 2004 the real payroll per employee was $24,148. This means that between 2004 and 2012, the real annual payroll per employee fell $2,791, or 11.6 percent.
The real GDP from Retail sector for the fi scal years of 2011 and 2012 showed an increase of 3.1 and 3.2 percent, respectively. The contribution of the Trade sector to real GDP was 14.0 percent in fi scal 2012. Retail and Wholesale sectors contributed to real GDP with 8.5 and 5.3 percent, respectively.
Figure 27 shows the total number of establishments for the Retail sector in Puerto Rico and its 78 municipalities. The spatial analysis refl ects 12,579 establishments divided into 5 categories. Also are observed in Agricultural and Mining companies between the municipalities of Vega Baja and Carolina, between Añasco and Arecibo, and between Caguas and Humacao.

ECONOMIC DEVELOPMENT PLAN FOR PUERTO RICO 2015
30
Transportation and Warehousing Sectors
The number of employees in the sectors of Transportation and Warehousing has remained basically unchanged over the period from 2004 to 2012. The employment for these sectors in 2012 was 15,242. This represented a decrease of 134 jobs or 0.87 percent, from the year 2011. In year 2004, employment in the sector totaled 14,219. Comparing 2012 with 2004 showed a growth of 7.2 percent.
The annual payroll per employee at constant prices (real prices) has declined in approximately $7,000 in the period under consideration. In 2012 the real annual payroll per employee in this sector was $28,643, a decrease of 2.4 percent when compared with the year 2011. In 2004 the real annual payroll per employee was $35,552.
The GDP at constant prices from this sector in fi scal year 2004 totaled $107.5 million and $94.0 million in fi scal year 2012. Between fi scal years 2012 and 2011 refl ected a decrease of 4.6 percent. However, the change in fi scal year 2012 over fi scal year 2004 showed a decrease of 12.5 percent.
The number of establishments for the Transportation and Warehousing sector in 2012 was 1,013. This represented a rise of 12 establishments compared to the year 2011. The number of establishments in 2004 totaled 1,046. Comparing years 2012 and 2004 it can be noted that the number of establishments declined by 3.2 percent. On the other hand, the Figure 28 presents the total number of establishments for the Transportation and Warehousing sector in Puerto Rico and its 78 municipalities and shows a very high concentration around the Metropolitan area, and, Ponce and Mayaguez.

ECONOMIC DEVELOPMENT PLAN FOR PUERTO RICO 2015
31
The Manufacturing Sector
One of the sectors that experienced greater reduction in the number of employees was the Manufacturing sector. The number of employees in 2012 was 8,422 representing a reduction of 290 jobs, or 0.35 percent when compared to the year 2011. In 2004 employment in this sector was 114,998. According to the data from U.S. Census Bureau County Business Pattern, between years 2004 and 2012, this sector lost 31,576 jobs meaning a decrease of 27.5 percent.
The real annual payroll per employee for the Manufacturing sector in 2012 was $35,309, a reduction of $1,031 from year 2011. In 2004 the real payroll per employee was $37,960.
In fi scal year 2012 the real GDP from the Manufacturing sector rose 2.4 percent, while in fi scal 2011 fell 0.5 percent. When comparing fi scal 2012 with fi scal year 2004, it increased 31.9 percent. The real GDP from manufacturing sector was the largest contributor to total GDP in fi scal year 2012.
The number of establishments for the Manufacturing sector in 2012 was 1,776. These represented 53 establishments less or 2.9 percent compared with the year 2011 which totaled 1,829. In 2004 the number of establishments in this sector was 2,111. The total registered in 2012 showed a reduction of 335 establishments compared to 2004. Figure 29 shows fi ve principal pathways in terms of manufacturing companies and those are: between Aguadilla to San Juan; San Juan and Fajardo; Caguas and Humacao, Caguas and Ponce, and Cabo Rojo and Aguadilla.

ECONOMIC DEVELOPMENT PLAN FOR PUERTO RICO 2015
32
The Information Sector
The Information sector showed a reduction in the number of employees during the years of 2004 and 2012. The total employment in this sector in 2012 was 17,880. Comparing with year 2011 represented a decrease of 859 jobs, or 4.58 percent. In 2004, the level of employment in the sector was 20,676. Comparing the years 2012 and 2004 there was a reduction of 2,796 jobs.
The real GDP from Information sector recorded the highest growth in fi scal year 2012, compared to fi scal year 2004. The increase was 52.7 percent or, in absolute terms $343.0 million. Between fi scal years 2012 and 2011 grew by 2.5 percent. In fi scal year 2012, the Information sector contributed to real GDP with 9.6 percent, and in fi scal year 2004 contributed with 5.6 percent.
The annual payroll per employee in the Information sector was $41,110 in 2012, representing an increase of 5.6 percent when compared with the year 2011. In year 2004 the real annual payroll per employee was $49,274; and compared to 2012 decreased 16.57 percent.
The total number of establishments in this sector in 2012 was 598, representing a rise of 7.8 percent compared to the year 2011. In 2004 the number of establishments in this sector reached 517. The number of establishments in 2012 compared to 2004 increased by 2.8 percent. Figure 30 shows concentrations around the municipalities of San Juan, Ponce, Mayaguez and Arecibo.

ECONOMIC DEVELOPMENT PLAN FOR PUERTO RICO 2015
33
The Finance and Insurance Sector
In the Finance and Insurance sector, the number of employees was 33,902 in 2012. This represented a reduction of 731 jobs or 2.1 percent when compared with the year 2011. In 2004 the employment in this sector totaled 37,924; and comparing with 2012 decreased by 4,022.
The real annual payroll per employee in this sector was $44,328 in 2012; representing an increase of 2.8 percent over the year 2011. In year 2004 the real annual payroll per employee was $48,828. Comparing the year 2012 with 2004 refl ected a decrease of 9.2 percent.
The real GDP from Finance and Insurance sector was $524.8 million in fi scal year 2012. This represented an increase of 0.2 percent compared to fi scal year 2011, and a decrease of 67.6 percent compared to fi scal year 2004 (Figure 23).
The number of establishments in the Finance and Insurance sector reached 1,921 in 2012, representing an increase of 1.3 percent compared to the year 2011. In 2004 the number of establishments in this sector was 1,977. Comparing 2012 with 2004, the number of establishments fell by 2.8 percent. In Figure 31 fi ve principal pathways in terms of fi nance and insurance establishments are presented: between the municipalities of San Juan to Hatillo, San Juan and Fajardo, San Juan and Fajardo, Ponce and Caguas, and Cabo Rojo and Isabela.

ECONOMIC DEVELOPMENT PLAN FOR PUERTO RICO 2015
34
The Professional, Scientifi c, and Technical Services Sector; Management of Companies and Enterprises Sector; Administrative and Support Services Sector; and, Other Services Sector
The Professional, Scientifi c, and Technical Services sector; Management of Companies and Enterprises sector; Administrative and Support Services sector; and, Other Services sector reached together 133,900 employees in 2012. This was an increase of 11,013 jobs or 9.0 percent over the year 2011. In the year 2004 the employment in these sectors totaled 117,101 representing a rise of 14.3 percent in 2012 compared with 2004.
On the other hand, the real annual payroll per employee in those sectors registered $23,167 in 2012. With respect to year 2011 the payroll diminished by 2.4 percent; and 12.6 percent in 2004.
The real GDP from Professional, Scientifi c, and Technical Services sector; Management of Companies and Enterprises sector; Administrative and Support Services sector; and, Other Services in fi scal year 2012 was $613.2 million. This represented an increase of 3.1 percent over the year 2011. In the fi scal year 2004, real GDP from those sectors totaled $692.0 million. There was a reduction of $78.8 million in 2012 compared to 2004.
The number of establishments in these sectors was 9,677 in 2012; an increase of 2.1 percent compared with the year 2011. Similar results occurred in year 2004 the number of establishments in this sector was 9,522. Comparing 2012 with 2004, the number of establishments increased 1.6 percent. Figure 32 shows establishments for the mentioned sectors for Puerto Rico and its 78 municipalities. In this map can be seen four principal pathways. Those are: between Aguadilla and Cabo Rojo; Aguadilla and San Juan; San Juan and Fajardo, and Caguas and Ponce:

ECONOMIC DEVELOPMENT PLAN FOR PUERTO RICO 2015
35
The Educational Services Sector
The Education sector registered growth during the period from 2004 to 2012, according to the data from the U.S. Census Bureau County Business Pattern. The employment in this sector was 39,116 in 2012, representing a rise of 2.56 percent compared to the year 2011. In 2004 the employment for educational services sector was 33,716. When compared with years 2012 and 2004, an increase of 16.0 percent was recorded in the employment level in this sector.
In terms of the Education sector, although increases were observed in the number of employees for the period of study, the real annual payroll per employee has been reduced. In 2012, the annual payroll per employee in this sector was $21,611, a decrease of 1.9 percent when compared with the year 2011. The real annual payroll per employee was $22,946 in 2004. The growth rate of 2012 compared to 2004 refl ected a reduction of 5.8 percent.
Also the GDP at constant price from Educational services sector decreased to 6.9 percent in fi scal year 2012 when compared with fi scal year 2011. In fi scal year 2004 the real GDP in this sector totaled $133.6 million. The contribution of this sector to total GDP was 0.9 percent in the fi scal year 2012.
For the education sector, the number of establishments for the year 2012 was 839. When compared with year 2011, this represented an increase of 1.0 percent, and with year 2004, a rise of 16.4 percent. Figure 33 shows that there are fi ve principal pathways in terms of educational services establishments: between Aguadilla and Cabo Rojo; Aguadilla and San Juan; San Juan and Fajardo; Caguas and Guayama; Caguas and Humacao. Also there is a clear concentration near Ponce.

ECONOMIC DEVELOPMENT PLAN FOR PUERTO RICO 2015
36
Health Care and Social Assistance Sector
The total number of employees in the Health Care and Social Assistance sector was 81,634 in the year 2012, refl ecting an increase of 1.6 percent over the year 2011. In the year 2004, the employment in this sector reached 69,697. When compared years 2012 and 2004, employment grew by 17.1 percent. For 2012, the real annual payroll per employee in this sector was $23,649, a reduction of 0.6 percent compared with the year 2011, and a decline of 4.5 percent when compared with year 2004.
The real GDP from Health Care and Social Assistance services sector reached $295.1 million in fi scal year2012. This represented a reduction of 2.5 percent when compared to fi scal year 2011. In fi scal year 2004, the real GDP from this sector was $332.3 million. When compared fi scal years 2012 and 2004, it can be seen that the GDP of this sector decreased by $37.3 million or 11.2 percent.
The health care and social assistance services sector recorded a total of 7,528 establishments; this means 235 more establishments than previous year (2011). In 2004 the number of establishments in this sector was 6,419. The number of establishments in 2012 relative to 2004 showed an increase of 17.3 percent. Figure 34 present fi ve principal pathways of establishment for this sector: between Aguadilla and Cabo Rojo; Aguadilla and San Juan; San Juan and Fajardo; Caguas Ponce, and, Caguas and Humacao.
ECONOMIC DEVELOPMENT PLAN FOR PUERTO RICO 2015
37
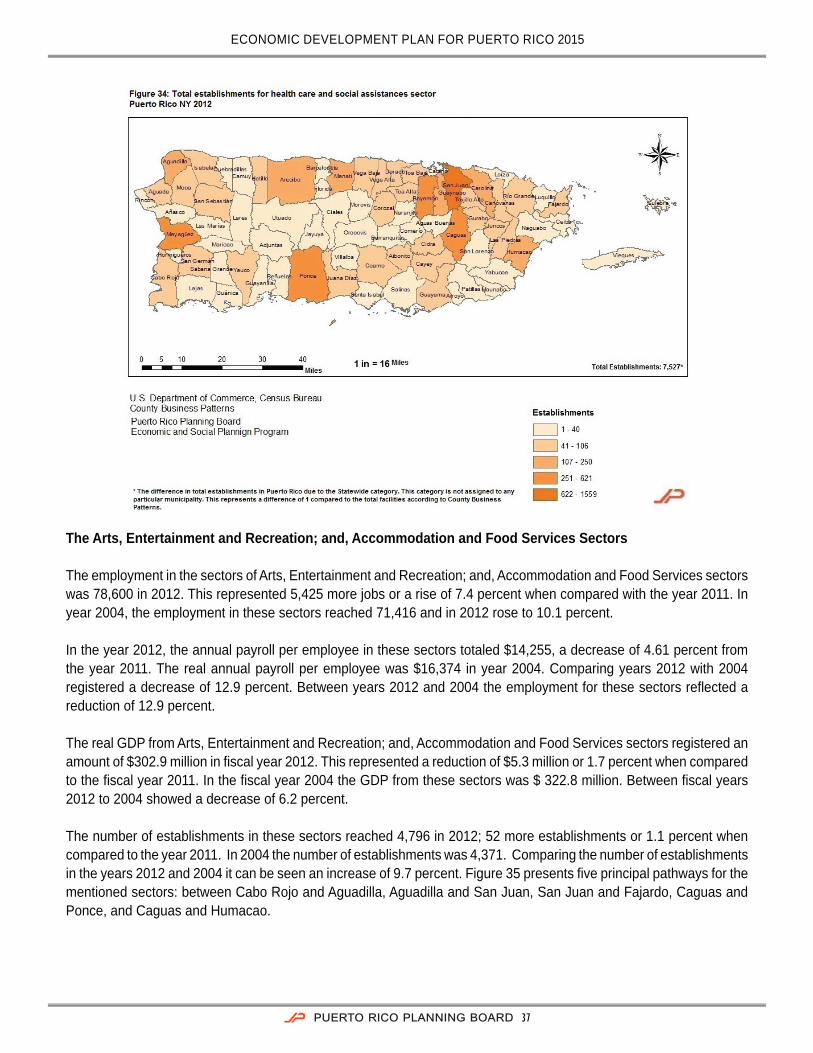
The Arts, Entertainment and Recreation; and, Accommodation and Food Services Sectors
The employment in the sectors of Arts, Entertainment and Recreation; and, Accommodation and Food Services sectors was 78,600 in 2012. This represented 5,425 more jobs or a rise of 7.4 percent when compared with the year 2011. In year 2004, the employment in these sectors reached 71,416 and in 2012 rose to 10.1 percent.
In the year 2012, the annual payroll per employee in these sectors totaled $14,255, a decrease of 4.61 percent from the year 2011. The real annual payroll per employee was $16,374 in year 2004. Comparing years 2012 with 2004 registered a decrease of 12.9 percent. Between years 2012 and 2004 the employment for these sectors refl ected a reduction of 12.9 percent.
The real GDP from Arts, Entertainment and Recreation; and, Accommodation and Food Services sectors registered an amount of $302.9 million in fi scal year 2012. This represented a reduction of $5.3 million or 1.7 percent when compared to the fi scal year 2011. In the fi scal year 2004 the GDP from these sectors was $ 322.8 million. Between fi scal years 2012 to 2004 showed a decrease of 6.2 percent.
The number of establishments in these sectors reached 4,796 in 2012; 52 more establishments or 1.1 percent when compared to the year 2011. In 2004 the number of establishments was 4,371. Comparing the number of establishments in the years 2012 and 2004 it can be seen an increase of 9.7 percent. Figure 35 presents fi ve principal pathways for the mentioned sectors: between Cabo Rojo and Aguadilla, Aguadilla and San Juan, San Juan and Fajardo, Caguas and Ponce, and Caguas and Humacao.

ECONOMIC DEVELOPMENT PLAN FOR PUERTO RICO 2015
38
Utilities Sector
The number of employees in the Utilities sector in the year 2012 was 374. This refl ected a rise of 41 jobs or 12.3 percent over the year 2011. In 2004, employment in this sector reached 316. This means that the change in 2012 compared to 2004 resulted in an increase of 18.4 percent.
The annual payroll per employee in real terms in this sector was $53,346 in 2012, a decrease of 5.1 percent when compared with the year 2011. In 2004 the real annual payroll per employee reached $66,617. Between years 2012 and 2004 a decrease of 19.9 percent was observed.
During the fi scal years 2004 to 2012 real GDP from Utilities sector gradually decreased. In the fi scal year 2012 refl ected a reduction of 12.4 percent was observed when compared to fi scal 2011. Also the GDP from this sector decreased by $168.9 million or 53.1 percent when compared fi scal years 2012 and 2004.
The number of establishments in this sector was 24 in 2012, a decrease of 4.0 percent when compared with the year 2011. In 2004 the number of establishments in this sector was 21. Comparing the number of establishments in 2012 with respect to 2004 it can be seen an increase of 14.3 percent. Figure 36 shows the total establishments in the Utilities sector in Puerto Rico and its 78 municipalities. This map shows that the activities around this sector are concentrated in the municipalities of San Juan, Arecibo, Peñuelas and Caguas.

ECONOMIC DEVELOPMENT PLAN FOR PUERTO RICO 2015
39
Section 4: Economic Development Plans and Comprehensive Studies for the Economy of Puerto Rico from 1970 to 2015
In Puerto Rico from the decade of 1970 to the present have been more than 10 economic development plans and more than 13 comprehensive studies containing recommendations and strategies on how to stimulate the economy of Puerto Rico. Although these documents were formulated various decades ago, many of the recommendations identifi ed in these economic development plans and in comprehensive studies remain valid. These documents are a must for future economic plans. Understanding the strengths and weaknesses of these proposals is important for the success of future economic plans.
The purpose of this section is to evaluate the strategies proposed by the economic development plans and the comprehensive economic studies from the 1970s to the present.3 Table 2 presents a list of the economic development plans outlined in Puerto Rico from the decade of 1930 to the present and the entities that generated them. In this table it can be observed the different organizations that have led the development of proposals. From the decade of 1950 to the 1990s the PB drafted a total of six economic development plans. In the decade of 2000s the Governor’s Offi ce played a leading role in the generation of these plans, producing about four plans. In recent times, the PB and the Department of Economic Development and Commerce (DDEC, for its acronym in Spanish) have made new proposals about economic development plans.
3 Discussion of strategies for the sector of public administration is outside the scope of study of this work. Despite this, the strategies to the fi eld of public administration affecting the competitiveness of other sectors of the economy will be discussed.
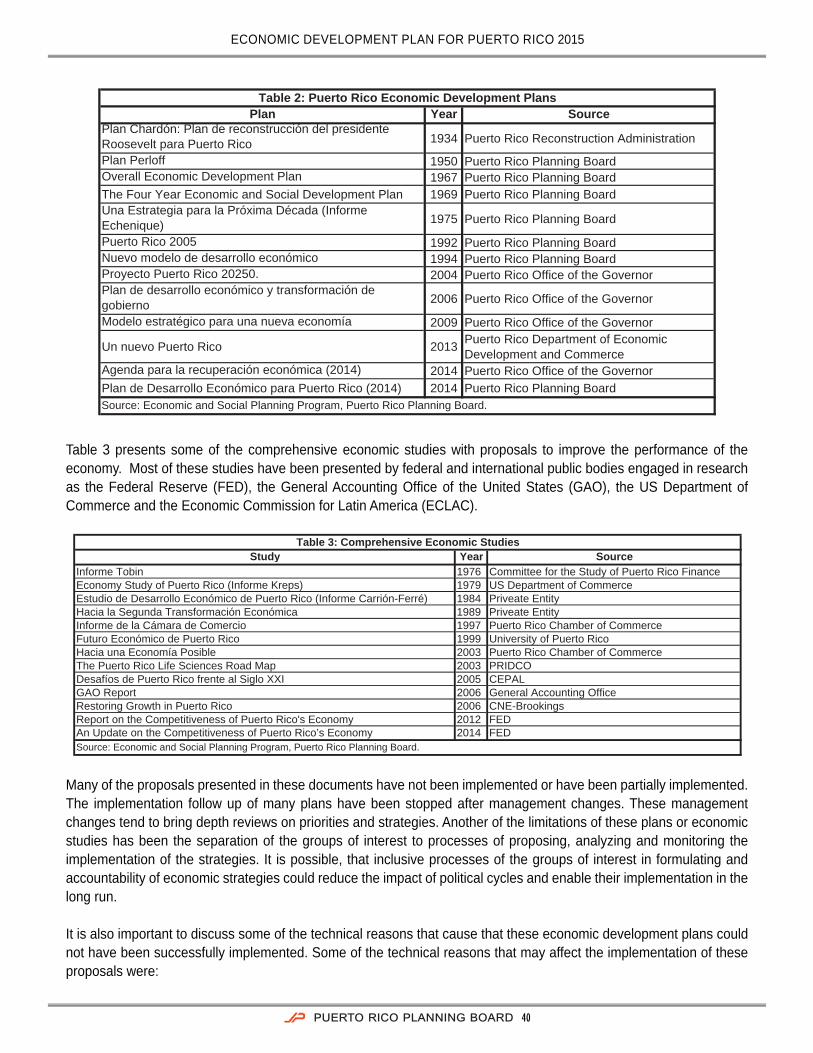
ECONOMIC DEVELOPMENT PLAN FOR PUERTO RICO 2015
40
Table 3 presents some of the comprehensive economic studies with proposals to improve the performance of the economy. Most of these studies have been presented by federal and international public bodies engaged in research as the Federal Reserve (FED), the General Accounting Offi ce of the United States (GAO), the US Department of Commerce and the Economic Commission for Latin America (ECLAC).
Many of the proposals presented in these documents have not been implemented or have been partially implemented. The implementation follow up of many plans have been stopped after management changes. These management changes tend to bring depth reviews on priorities and strategies. Another of the limitations of these plans or economic studies has been the separation of the groups of interest to processes of proposing, analyzing and monitoring the implementation of the strategies. It is possible, that inclusive processes of the groups of interest in formulating and accountability of economic strategies could reduce the impact of political cycles and enable their implementation in the long run.
It is also important to discuss some of the technical reasons that cause that these economic development plans could not have been successfully implemented. Some of the technical reasons that may affect the implementation of these proposals were:
Plan Year SourcePlan Chardón: Plan de reconstrucción del presidente Roosevelt para Puerto Rico 1934 Puerto Rico Reconstruction Administration
Plan Perloff 1950 Puerto Rico Planning BoardOverall Economic Development Plan 1967 Puerto Rico Planning BoardThe Four Year Economic and Social Development Plan 1969 Puerto Rico Planning BoardUna Estrategia para la Próxima Década (Informe Echenique) 1975 Puerto Rico Planning Board
Puerto Rico 2005 1992 Puerto Rico Planning BoardNuevo modelo de desarrollo económico 1994 Puerto Rico Planning BoardProyecto Puerto Rico 20250. 2004 Puerto Rico Office of the GovernorPlan de desarrollo económico y transformación de gobierno 2006 Puerto Rico Office of the Governor
Modelo estratégico para una nueva economía 2009 Puerto Rico Office of the Governor
Un nuevo Puerto Rico 2013 Puerto Rico Department of Economic Development and Commerce
Agenda para la recuperación económica (2014) 2014 Puerto Rico Office of the GovernorPlan de Desarrollo Económico para Puerto Rico (2014) 2014 Puerto Rico Planning BoardSource: Economic and Social Planning Program, Puerto Rico Planning Board.
Table 2: Puerto Rico Economic Development Plans
Study Year SourceInforme Tobin 1976 Committee for the Study of Puerto Rico FinanceEconomy Study of Puerto Rico (Informe Kreps) 1979 US Department of CommerceEstudio de Desarrollo Económico de Puerto Rico (Informe Carrión-Ferré) 1984 Priveate EntityHacia la Segunda Transformación Económica 1989 Priveate EntityInforme de la Cámara de Comercio 1997 Puerto Rico Chamber of CommerceFuturo Económico de Puerto Rico 1999 University of Puerto RicoHacia una Economía Posible 2003 Puerto Rico Chamber of CommerceThe Puerto Rico Life Sciences Road Map 2003 PRIDCODesafíos de Puerto Rico frente al Siglo XXI 2005 CEPALGAO Report 2006 General Accounting OfficeRestoring Growth in Puerto Rico 2006 CNE-Brookings Report on the Competitiveness of Puerto Rico's Economy 2012 FEDAn Update on the Competitiveness of Puerto Rico’s Economy 2014 FEDSource: Economic and Social Planning Program, Puerto Rico Planning Board.
Table 3: Comprehensive Economic Studies

ECONOMIC DEVELOPMENT PLAN FOR PUERTO RICO 2015
41
1. The origins of the defi ciencies which are intended to correct are not identifi ed.2. The vision, mission, goals and objectives were not clearly defi ned. 3. Lack of criteria and performance standards for strategies.4. Lack of appropriate evaluation mechanisms. 5. Lack of creation of programs responsible for implementing the strategies.6. The benefi ts and costs of strategies are not evaluated. 7. The plans omit strategies for relevant industrial sectors.
One of the possible limitations of these plans is that they did not offer a detailed analysis of the condition of the economy or the niche of the economy looking for improves. In order to convince citizens and public policy makers that there is a problem it is essential to provide evidence based on descriptive and inferential analysis to justify actions. Identify problems and its magnitude is essential before outlining the vision, mission, goals and objectives.
Defi ne vision, mission, goals and objectives should be the preface to the strategies. Vision is an image of the future. Usually it is a statement of how the country is imagined in the long run. For example, in Puerto Rico 2025 (2004) one of the economic visions was as following: “In 2025, Puerto Rico will be a prosperous, productive and innovative society able to generate knowledge”. On the other hand, in the New Model (1994) that vision provided was: “That Puerto Rico achieve and maintain levels of economic welfare comparable with the United States”.
The mission, however, presents a statement that provides the philosophical perspective of the company. An example of this is provided by the Economic Development and Government Transformation Plan (2006): “A competitive economy is a prerequisite that will allow fi nance the social, cultural and physical infrastructure that all Puerto Ricans want.”
Furthermore, goals are the overall results or purpose to be achieved. A New Puerto Rico Plan (2013): one of the goals was: “reinventing, promote and expand tourism”. Another example is provided by the Strategic Model for a New Economy (2009). In this plan one of the goals was “converting government in facilitator agent of the healthy development of the private sector”.
Meanwhile the objectives are specifi c outcomes that must be achieved in different terms, usually in the short, medium and long run. For the Strategic Model for a New Economy (2009) one of the objectives was to increase the growth rate of real GDP to 3.0 percent by 2017. For the Economic Development Plan (2015) one of its objectives is: “that the economy of Puerto Rico generates 1.5 million full-time jobs by 2020”. Most of the plans do not have goals and criteria defi ned or performance standards for the strategies. As hypothetical example, the training program for young entrepreneurs has the potential to generate 1,000 jobs and contribute to the objective of generating new jobs full time at 2.0 percent. A second example (also hypothetical) is as follow: an investment of $1,000 million on a cluster of high technology has the potential to increase GDP by 0.3 percent. To determine if the proposed measures are suffi cient to achieve the objectives is important to have an idea of what will be the contribution of each of the strategies.
Table 4 illustrates an analysis of the presence of statements of vision, mission, goals and objectives in previous plans. Although in all plans the goals were identifi ed, most of them did not contain vision, mission and objectives. For plans evaluated (eight in total), only four had a general vision, three had a mission, and two had objectives. Without clear vision, mission and objectives it is diffi cult to measure the success of initiatives.

ECONOMIC DEVELOPMENT PLAN FOR PUERTO RICO 2015
42
In most of the plans the evaluation mechanisms for strategies were not identifi ed. For example, many of these plans do not provided general guidelines about the instruments, indicators or metrics needed to evaluate the effectiveness of the strategies. Theoretically, a strategy could be understood effective, but once implanted have no effect. Therefore, to have the instruments, indicators or metrics needed to evaluate the performance minimizes the loss of resources and facilitates clever public policy decisions.
Although most of these plans proposed strategies, they do not identify the organisms (ie, programs, agencies, or other private entities) in charge of implement it. The fi rst step to implement strategies is to assign responsibilities to existing programs or propose the creation of programs to charge of these tasks. The absence of a responsible entity does not allow the measurement and accountability process. Likewise, plans that do not present an assessment of the expected benefi ts and costs of strategies or of a group of strategies may present problems in its implementation.
Consider in an economic development plan the different strategic sectors are also important. One of the limitations of previous plans is that they do not consider relevant industrial sectors. Most plans focus on improving government performance and paid attention to productive sectors such as agriculture and manufacturing. Not consider emerging sectors could generate strategic weaknesses for the country in the future.
In an effort to enable the public to assess these plans and economic studies the PB has digitized and published most of these documents on its website http://www.jp.gobierno.pr/ (Economia>>Planes de Desarrollo Económico). The next section presents an analysis by industrial sector of different strategies proposed, classifi ed by 2012 NAICS.
Strategies by Industrial Sector
This section describes the different strategies of economic development plans that were analyzed and classifi ed by 20 industry sectors.4 Some of the sectors were combined in order to simplify the analysis. These strategies were compiled independently by two groups of economists and the strategies that both groups agreed in 92.0 percent were included.
Among the plans evaluated were identifi ed fi ve plans that included strategies to incentivize agricultural activity. Table 5 details the strategies for the Agricultural sector (NAICS 11) with the plans evaluated. The Agriculture, Forestry, Fishing and Hunting (NAICS 11) include the following 3 digit NAICS level (subsectors): Forestry and Logging and, Support Activities for Agriculture and Forestry. Related to these subsectors some of the strategies proposed were: the establishment of cooperatives and family farms, the regulation of agricultural land, protection of natural resources and environment, the creation of distribution systems and market intelligence that allows the identifi cation of potential markets and agricultural products for export, establishment of support mechanisms to increase effi ciency and quality of agricultural production, including the provision of production inputs and technical advice to farmers and, implement mechanisms to ensure food security for the population. It is also important when creating intelligence systems and
Plan Vision Mission Goals ObjetivesThe Four Year Economic and Social Development Plan (1969) Unidentified Unidentified Identified UnidentifiedPuerto Rico 2005 (1992) Unidentified Unidentified Identified UnidentifiedUn nuevo modelo (1994) Identified Unidentified Identified UnidentifiedPuerto Rico 2025 (2004) Identified Unidentified Identified UnidentifiedPlan desarrollo económico y transformación de gobierno (2006) Identified Identified Identified UnidentifiedModelo estratégico para una nueva economía (2009) Identified Unidentified Identified IdentifiedUn nuevo Puerto Rico (2013) Identified Unidentified Identified UnidentifiedAgenda para la recuperación económica (2014) Identified Identified Identified UnidentifiedPDE - Plan de Desarrollo para Económico para Puerto Rico (2014) Identified Identified Identified Identified
Table 4: Vision, Mission, Goals and Objetives by Econcomic Development Plans
Source: Economic and Social Planning Program, Puerto Rico Planning Board.
4 Among those: Agriculture, Forestry, Fishing and Hunting (NAICS 11), Utilities (NAICS 22), Construction (NAICS 23), Manufacturing (NAICS 31-33), Wholesale Trade (NAICS 42), Retail Trade (NAICS 44-45) , Transportation and Warehousing (48-49), Information (51), Finance and Insurance (NAICS 52), Real State and Rental and Leasing (NAICS 53), Professional, Scientifi c, and Technical Services (NAICS 54), Management of Companies and Enterprises (NAICS 55), Administrative and Support and Waste Management and Remediation Services (NAICS 56), Educational Services (NAICS 61), Health Care and Social Assistance (NAICS 62), Arts, Entertainment and Recreation (NAICS 71), Accommodation and Food Services (72), Other Services (except Public Administration) (NAICS 81) and, Public Administration (NAICS 92).

ECONOMIC DEVELOPMENT PLAN FOR PUERTO RICO 2015
43
distribution markets, consider particularly promote the marketing of agricultural products abroad. This, in a context in which technical assistance to farmers for creating business plans is offered to them. Another point to focus ought to be to incorporate farmers from the informal sector into the formal sector. One possible mechanism to encourage this addition is promoting alternative ways of fi nancing conditional on the formalization of agricultural business.
Strategy or Recommendation Paper Page/Slide
Establish cooperatives in rural areas with training programs and productive economic activities focused on agriculture and manufacturing.
125 y 127
Preserve natural resources and the environment. 12
No tariff regulations over product imports with environmental benefits. 68
Develop a system of family owned farms. 93, 127
Complete a regulated land use plan accompanied by effective controls. 113
Reevaluate the use of natural resource terrains to establish new industrial plants, and establish a penalty system for contamination.
115
Production and Productivity - Identify, produce, and market those commodities which have the greatest economic comparative advantage for mainland and export markets and domestic consumption.
290
Production and Productivity - Provide fertilizers, seeds or plant materials, machinery services, operating supplies, and technical assistance consistent with efficient production patterns.
290
Marketing Efficiency and Product Quality - Develop handling, processing, and storage facilities and systems for consistent high-quality products produced by Puerto Rican farmers.
290
Food Prices and Nutrition - Food and nutrition goals similar to those in the United States for eliminating hunger and malnutrition.
291
Food Prices and Nutrition - Improving island food production and marketing efficiency to competitively provide cheaper and more nutritious diets.
291
Expand the environmental quality concept and make it applicable to physical infrastructure 71
Invest in education to foster consciousness of environmental responsibility 71
Reduce environmental risks to health 55Establish environmental market-based systems to encourage self-administration by businesses and households
71
Strengthen or modify current environmental laws, and explore new regulation schemes to ensure environmental conservation
72
Define community compliance goals for environment safekeeping 72
Harmonize government support mechanisms applied to agriculture with restrictions and agreements of free commerce.
2005 - Cepal Study - Globalization and Development 231
Maximize production on high value agricultural soils. 2009 - Strategies of a Strategic Model 26Reinvent traditional industries 2013 - A New Puerto Rico 28
Source: Economic and Social Planning Program, Puerto Rico Planning Board.
Table 5: Agriculture, Forestry, Fishing and Hunting Sector (NAICS - 11)
1975 - Puerto Rico’s Economic Development: A Strategy for the Next Decade (Informe Echenique)
1979 - Economic Study of Puerto Rico (Informe Kreps)
2004 - Project Puerto Rico 2025

ECONOMIC DEVELOPMENT PLAN FOR PUERTO RICO 2015
44
Table 6 includes the strategies for the Utilities sector, mainly those concerning to public corporations such as the Puerto Rico Electric Power Authority (AEE, for its acronym in Spanish) and the Puerto Rico Aqueduct and Sewer Authority (AAA, for its acronym in Spanish). This sector includes the following 4 digit NAICS level (subsectors): Power Generation, Transmission and Distribution of Natural Gas and Water and, Sewage and other Systems. At least six different plans have presented strategies for Utilities sector (NAICS 22). Table 5 includes proposals aimed at the energy sector. In the case of the AAA the proposals focused on: study the consumption needs and water management, promote the reduction of water consumption, increase investment in water supply infrastructure and systems to improve effi ciency and, open the market to competition at all levels of water and wastewater. In the case of AEE these plans proposed: to evaluate the implementation of power subsidies, establish an independent regulatory body for the power sector, diversify energy sources and promote the use of sources renewable energy, promote the reduction of energy consumption, open the power market to competition in all areas (generation, transmission and distribution) and, increase investment in electrical infrastructure and systems to improve effi ciency. In both cases, the strategies were directed in offering technical and cost effi ciency, for both the public corporations. For example, studies conducted by the Economic and Social Planning Program of the PB show that energy costs have a negative impact on the economy of Puerto Rico (Hernández, 2015).

ECONOMIC DEVELOPMENT PLAN FOR PUERTO RICO 2015
45
The Construction sector (NAICS 23) has been spearheading of the economic development plans from Manos a la Obra Plan in the decade of 1940. Given its high linkages with other sectors, the construction sector has been one of the main mechanisms to revitalize the economy in the short term. At least seven plans proposing strategies to encourage the construction sector were identifi ed. Table 7 shows the strategies for the Construction sector (NAICS 23) sector and Real Estate and Rental and Leasing (NAICS 53). The Construction sector includes the following three digits NAICS level
Strategy or Recommendation Paper Page/Slide
Cease electric subsidies to low consumption families. 111
Establish a solar energy research program with government funding. 111
Analyze and investigate alternatives to resolve water shortages. 112
Establish the fabrication of copper and petroleum products in Puerto Rico and limit their contribution exemptions. 81
Increase gasoline taxes to reduce consumption. 110, 139Review and update the long-term water and sewage management plan 73
Increase investment in water and sewage infrastructure and systems to improve efficiency and reliability and reduce pollution
74
Establish a truly independent regulatory body for the electricity sector 75
Promote use of renewable energy sources 75Promote reduced water-usage 75Reduce waste generation by reducing usage of materials and maximizing recycling 75
Promote reduced energy-usage 76Diversify fuel sources for electric power generation 76Promote cleaner use of fossil fuels for electric power generation 76
Redefine water and sewage pricing structure 76Redefine electricity pricing structure 76Strengthen the water and sewage regulatory body so that it becomes truly independent 77
Open the electric power market to competition in all areas (generation, transmission and distribution) 77
Open the water and sewage market to competition at all levels 77
Increase investment in electricity infrastructure and systems to improve efficiency and 76
Energy reform to lower costs and eliminate barriers of entry. 580
Create independent regulatory board to provide oversight of generation and distribution of electricity. 580
Improve quality of transportation and water and sewer systems. 581
Diversify energy sources to reduce dependency on petroleum fuel by half.
2006 -Economic Development And Government Transformation Plan For Puerto Rico
9
Reduce the cost of energy and the dependency on petroleum. 2013 - A New Puerto Rico 25
Source: Economic and Social Planning Program, Puerto Rico Planning Board.
Table 6: Utilities (NAICS - 22) and Energy Sectors
1975 - Puerto Rico’s Economic Development: A Strategy for the Next Decade (Informe Echenique)
2004 - Project Puerto Rico 2025
2006 - Restoring Growth

ECONOMIC DEVELOPMENT PLAN FOR PUERTO RICO 2015
46
subsectors: Construction of Buildings, Heavy and Civil Engineering Construction, and, Specialty Trade Contractors. The Real Estate sector and Rental at three digits NAICS level (subsectors) includes: Real Estate, Rental and, Leasing services and, Lessors of Nonfi nancial Intangible Assets (except Copyrighted Works). The proposed strategies can be grouped into the following: establish a land use and zoning plan to establish a healthy balance between natural resources and economic activity related to the construction sector, construction of housing on a self-help basis, generate effi ciency and agility in the fi nancial sector to improve infrastructure and housing, promote investment in public construction projects and, encourage the creation of industrial clusters that encourage the construction of new facilities. In order to promote this sector a strategy to consider is encourage exporting our skills in design, construction and real estate to foreigners and niches among Hispanics in the United States. Also one should be consider the densifi cation of urban areas and restoration of existing buildings as possible strategies to revive this sector.
The Manufacturing sector (NAICS 31) has been the sector that has shaped the economic development of Puerto Rico. All plans evaluated considered strategies for the Manufacturing sector (Table 8). This sector includes the following three digits NAICS level subsectors: Food Manufacturing, Beverage and Tobacco Product, Textiles Mills, Textiles Product Mills, Apparel Manufacturing, Leather and Allied Product Manufacturing, Wood Product Manufacturing,
Strategy or Recommendation Paper Page/SlideReevaluate the use of natural resource terrains to establish new industrial plants, and establish a penalty system for contamination.
115
Increase contribution incomes through property reappraisals. 139
Complete a regulated land use plan accompanied by effective controls. 113
Rural Living - Construct homes on a self-help basis. 1979 - Economic Study of Puerto Rico (Informe Kreps) 291
Create and enact an integrated and detailed land-use master plan 69
Communicate the new land-use plan and permitting process to the community 70
Strengthen mechanisms for enforcing compliance with the new land-use plan 70
Restructure the functions of government agencies to carry out the land-use planning and permitting process 71
Improve mechanisms for community participation in the land-use planning and permitting process 71
Redefine and ensure compliance with environmental agencies' processes 71
Expand the environmental quality concept and make it applicable to physical infrastructure 71
Ensure that the land-use plan reduces the need for transport 81
Form strategic clusters for high technology manufacturing and service industries.
2005 - Cepal Study - Globalization and Development 230
Industrial clusters 2006 - Restoring Growth 578
Advance and upgrade infrastructure, facilitate private investments with a new financial method focused on efficiency and agility.
2006 -Economic Development And Government Transformation Plan For Puerto Rico
8
Construction development projects from government investment 2013 - A New Puerto Rico 24
Table 7: Construction (NAICS - 23) and Real Estate and Rental (NAICS - 53) Sectors
1975 - Puerto Rico’s Economic Development: A Strategy for the Next Decade (Informe Echenique)
2004 - Project Puerto Rico 2025
Source: Economic and Social Planning Program, Puerto Rico Planning Board.

ECONOMIC DEVELOPMENT PLAN FOR PUERTO RICO 2015
47
Paper Manufacturing, Printing and Related Support Activities, Petroleum and Coal Products Manufacturing, Chemical Manufacturing, Plastics and Rubber Products Manufacturing, Nonmetallic Mineral Product Manufacturing, Primary Metal Manufacturing, Fabricated Metal Product Manufacturing, Machinery Manufacturing, Computer and Electronic Product Manufacturing, Electrical Equipment, Appliance, and Component Manufacturing, Transportation Equipment and Manufacturing, Furniture and Related Product Manufacturing and, Miscellaneous Manufacturing. Strategies for the manufacturing sector can be summarized in: establish industrial cooperatives, evaluate the tax exemptions and tariff policy, evaluate subsidy incentives and fi nancing policies, encourage establishment of high-tech industries, improve the measurement of productivity and costs, establish an effective regulatory framework, promote a skilled labor force to meet industry skills demand mainly associated with high-tech, review of the export promotion system, expand the capital stock and, import substitution. Recent studies have identifi ed that the manufacturing sector in Puerto Rico has a decreased level of horizontal and vertical linkages with other sectors of the economy (Rosa Polanco, 2015). It is vital that new strategies consider incentives to industries to achieve integration with other industries or sectors of the economy. To accomplish this, the policy of subsidies that government provides should be changed to conditioned subsidies for purchasing local products.

ECONOMIC DEVELOPMENT PLAN FOR PUERTO RICO 2015
48
Strategy or Recommendation Paper Page/SlideOffer incentives to businesses in order to establish offices in Puerto Rico. 23, 81
Develop policies directed to retain labor intensive industries. 27
Grant the autonomy to impose tariffs over imports and use the income as subsidies for the local production. 33, 68
Replace exemptions for contribution credit over investment that allows businesses to reduce their future contributions. 35, 37
Implement a salaries subsidy program directed to slow the closing turnover of labor intensive industries. 36
Promote and develop industries that are less sensitive to the costs of labor. 43
Measure the changes in total productivity. 53Reevaluate the use of natural resource terrains to establish new industrial plants, and establish a penalty system for contamination.
115
Establish cooperatives in rural areas with training programs and productive economic activities focused on agriculture and manufacturing.
125 y 127
Selective policy for bank regulation in favor of industry loan exempting them from contributions. 148
Promote high technology industries. 23Establish the fabrication of copper and petroleum products in Puerto Rico and limit their contribution exemptions. 81
Increase gasoline taxes to reduce consumption. 110, 139Improving the Product - Endow Puerto Rico with the best physical, technological, and human capital that will provide a competitive advantage in the global economy.
24-25
Puerto Rico Destination and Global Bridge - Adopt strategies that enable and promote a competitive environment at a global scale.
19-20
Government Facilitator - An effective Regulatory framework that promotes coherent visions on economic development and business development.
21
Promoting our people - Promote economic sectors with a trained work force and the ability of adapting to frequent changes in technology and other occupational requirements.
26
Design a future workforce learning resource center 2003 - The Puerto Rico Life Sciences Road Map 9, 109
Recognize the importance of supply chains, promote technology transfers, and the migration from exogenous to endogenous models.
2003 - Towards a Feasible Economy 49
Expand the environmental quality concept and make it applicable to physical infrastructure 71
Increase the productivity of local human capital through increasing use of technology 33
Overhaul the systems for promoting exports from Puerto Rico 35
Form strategic clusters for high technology manufacturing and service industries. 230
Strengthen the local capital industry and project it to external markets. 230
Industrial development policy that translates widely and has a context and object based national innovation system. 230
Export promotion for high technology and particularly sectors that have not had international market exposure and can have competitive advantages.
231
Lowering Dependence on a Shrinking Industry2012 - Report on the Competitiveness of Puerto Rico's Economy
12
Reinvent traditional industries 2013 - A New Puerto Rico 28Source: Economic and Social Planning Program, Puerto Rico Planning Board.
Table 8: Manufacturing Sector (NAICS - 31)
1975 - Puerto Rico’s Economic Development: A Strategy for the Next Decade (Informe Echenique)
1994 - New Model of Economic Development
2004 - Project Puerto Rico 2025
2005 - Cepal Study - Globalization and Development

ECONOMIC DEVELOPMENT PLAN FOR PUERTO RICO 2015
49
The strategies for the sectors of Retail and Wholesale are compiled in Table 9. Over 10 plans have submitted different strategies for these sectors. The Wholesale Trade sector (NAICS 42) includes the following three digits NAICS level subsectors: Merchant Wholesalers Durable Goods, Merchant Wholesalers Nondurable Goods and, Wholesale Electronic Markets and Agents and Brokers. On the other hand, Retail Trade sector (NAICS 44-45) includes the following three digits NAICS level subsectors: Motor Vehicles and Parts Dealers, Furniture and Home Furnishings Stores, Electronics and Appliance Stores, Building Material and Garden Equipment and Supplies Dealers, Food and Beverage Stores, Health and Personal Care Stores, Gasoline Stations, Clothing and Clothing Accessories Stores, Sporting Goods, Hobby, Book, and Music Stores, General Merchandise Stores, Miscellaneous Store Retailers and, Nonstore Retailers. Some of the strategies proposed for this sector are: increase the marketing of companies, provide assistance for the development of business plans, promote effi ciency in the commercial sector, market those product abroad those products with greater comparative advantage, use tourism as commercial recovery mechanism, improve the supply chains intelligence, incorporate the informal traders to the formal sector, promote alternative fi nancing methods and, reduce the costs of establishing a business. Although many of these strategies indicate that commercial sector is an important one for economic development, most of these strategies are not intended to propose specifi c mechanisms for the development of these sectors.

ECONOMIC DEVELOPMENT PLAN FOR PUERTO RICO 2015
50
Strategy or Recommendation Paper Page/SlideImport substitution to create more opportunities for industrial investment and agricultural production. 12
Increase private savings and expand the financial flow to local businesses. 141
Intensify the efforts of local market promotions. 69Evaluate the faculties of the Commercial Administration and prioritize their improvement plans. 78
Increase tariffs over automobiles, durable goods, and luxury products. 139 y 146
Grant the autonomy to impose tariffs over imports and use the income as subsidies for the local production. 33, 68
Replace exemptions for contribution credit over investment that allows businesses to reduce their future contributions. 35, 37
Increase gasoline taxes to reduce consumption. 110, 139Urban Concentration of Tourism - Increased demand has facilitated private refurbishing of many tourism facilities and the opening of closed retail establishments and hotels
343
Production and Productivity - Identify, produce, and market those commodities which have the greatest economic comparative advantage for mainland and export markets and domestic consumption.
290
Food Prices and Nutrition - Improving island food production and marketing efficiency to competitively provide cheaper and more nutritious diets.
291
Redefining Responsibilities - Obtain the fiscal resources that will stimulate business activities, and productivity with efficiency. 23
Government Facilitator - An effective Regulatory framework that promotes coherent visions on economic development and business development.
21
Recognize the importance of supply chains, promote technology transfers, and the migration from exogenous to endogenous models.
2003 - Towards a Feasible Economy 49
Promote deeper linkages between multinational firms and local firms, and develop an entrepreneurial environment in large firms 2004 - Project Puerto Rico 2025 24
Move as many productive units from the informal sector and black markets to the formal economic sector. 232
Harmonize government support mechanisms applied to agriculture with restrictions and agreements of free commerce. 231
Create and sustain a comprehensive program to promote the development of island-based businesses. 576
Reform regulatory environment surrounding the entry of new business firms and development. 576
Combine broad tax base with low rates. 583
Promote local businesses by providing support to local business owners in the form of financing alternatives, and access to internal and external markets.
2006 -Economic Development And Government Transformation Plan For Puerto Rico
8
Promote entrepreneurship and improve value offers for consumers with a focus on diversification and competition.
2009 - Strategies of a Strategic Model 26
Reducing the Costs of Doing Business2012 - Report on the Competitiveness of Puerto Rico's Economy
21
Source: Economic and Social Planning Program, Puerto Rico Planning Board.
Table 9: Wholesale Trade (NAICS - 42) and Retail Trade (NAICS -44) Sectors
1975 - Puerto Rico’s Economic Development: A Strategy for the Next Decade (Informe Echenique)
1979 - Economic Study of Puerto Rico (Informe Kreps)
1994 - New Model of Economic Development
2005 - Cepal Study - Globalization and Development
2006 - Restoring Growth

ECONOMIC DEVELOPMENT PLAN FOR PUERTO RICO 2015
51
The Transportation and Warehousing sector (NAICS 48) includes the following three digits NAICS level subsectors: Air Transportation, Rail Transportation, Water Transportation, Truck Transportation, Transit and Ground Passenger Transportation, Pipeline Transportation, Scenic and Sightseeing Transportation, Support Activities for Transportation, Postal Services, Couriers and Messengers and, Warehousing and Storage. Some of the strategies for this sector are described as follow: establish a policy for the naval fl eet traffi c that travels to Puerto Rico, establish an effi cient and sustainable transport system for the metropolitan area, establish nonstop air transportation between San Juan and its main markets, expand the load capacity and terminals and, improve ports and airports productivity. For individual transportation some of the proposed strategies were: establish a land use plan and zoning to reduce transportation costs, encourage reduction in car use, promote the use of cleaner fuels and, encourage the use of effi cient mass transportation (Table 10).
Strategy or Recommendation Paper Page/SlideEstablish a fleet policy for naval traffic traveling to Puerto Rico. 68
Establish an efficient and viable transportation system for the metropolitan area and explore a underground system.
113
Reduce tariffs and costs associated to air travel and accommodations. 102
Increase gasoline taxes to reduce consumption. 110, 139
Air Transportation - New gateways to the U.S. mainland providing additional nonstop service between San Juan and its major U.S. markets.
1979 - Economic Study of Puerto Rico (Informe Kreps) 343
Expand the capacity of passenger air terminals 82
Expand capacity of existing air cargo facilities 82Encourage reduction in car use 82Expand the capacity of existing sea ports for cargo services 83
Increase the number and frequency of air connections for passengers 83
Increase the number and frequency of maritime connections for passengers 83
Expand capacity of passenger sea terminals 83
Improve the productivity of land freight services 83
Invest in new land freight systems 84Transform small and military airports into new airports for cargo services 84
Transform small and military sea ports into new ports for shipping services 84
Create and promote efficient and reliable collective transport 79
Complete the road and highway network 80Improve the productivity and competitiveness of existing ports and airports 80
Ensure that the land-use plan reduces the need for transport 81
Increase the efficiency and capacity of existing roads 81
Promote clean fuels and advanced technology for transportation 82
Create new mechanisms to incorporate the community in transportation planning and communication process
83
Improve quality of transportation and water and sewer systems. 2006 - Restoring Growth 581
Table 10: Transportation and Warehousing Sector (NAICS - 48)
1975 - Puerto Rico’s Economic Development: A Strategy for the Next Decade (Informe Echenique)
2004 - Project Puerto Rico 2025
Source: Economic and Social Planning Program, Puerto Rico Planning Board.
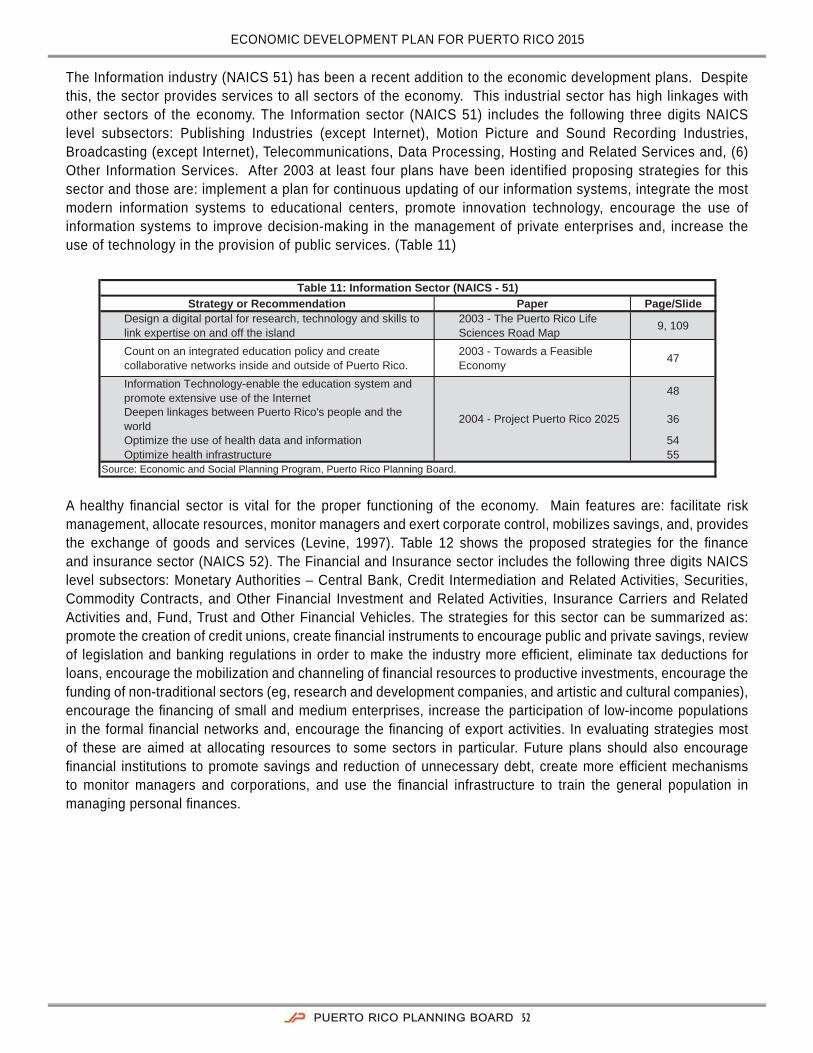
ECONOMIC DEVELOPMENT PLAN FOR PUERTO RICO 2015
52
The Information industry (NAICS 51) has been a recent addition to the economic development plans. Despite this, the sector provides services to all sectors of the economy. This industrial sector has high linkages with other sectors of the economy. The Information sector (NAICS 51) includes the following three digits NAICS level subsectors: Publishing Industries (except Internet), Motion Picture and Sound Recording Industries, Broadcasting (except Internet), Telecommunications, Data Processing, Hosting and Related Services and, (6) Other Information Services. After 2003 at least four plans have been identified proposing strategies for this sector and those are: implement a plan for continuous updating of our information systems, integrate the most modern information systems to educational centers, promote innovation technology, encourage the use of information systems to improve decision-making in the management of private enterprises and, increase the use of technology in the provision of public services. (Table 11)
A healthy fi nancial sector is vital for the proper functioning of the economy. Main features are: facilitate risk management, allocate resources, monitor managers and exert corporate control, mobilizes savings, and, provides the exchange of goods and services (Levine, 1997). Table 12 shows the proposed strategies for the fi nance and insurance sector (NAICS 52). The Financial and Insurance sector includes the following three digits NAICS level subsectors: Monetary Authorities – Central Bank, Credit Intermediation and Related Activities, Securities, Commodity Contracts, and Other Financial Investment and Related Activities, Insurance Carriers and Related Activities and, Fund, Trust and Other Financial Vehicles. The strategies for this sector can be summarized as: promote the creation of credit unions, create fi nancial instruments to encourage public and private savings, review of legislation and banking regulations in order to make the industry more effi cient, eliminate tax deductions for loans, encourage the mobilization and channeling of fi nancial resources to productive investments, encourage the funding of non-traditional sectors (eg, research and development companies, and artistic and cultural companies), encourage the fi nancing of small and medium enterprises, increase the participation of low-income populations in the formal fi nancial networks and, encourage the fi nancing of export activities. In evaluating strategies most of these are aimed at allocating resources to some sectors in particular. Future plans should also encourage fi nancial institutions to promote savings and reduction of unnecessary debt, create more effi cient mechanisms to monitor managers and corporations, and use the fi nancial infrastructure to train the general population in managing personal fi nances.
Strategy or Recommendation Paper Page/SlideDesign a digital portal for research, technology and skills to link expertise on and off the island
2003 - The Puerto Rico Life Sciences Road Map 9, 109
Count on an integrated education policy and create collaborative networks inside and outside of Puerto Rico.
2003 - Towards a Feasible Economy 47
Information Technology-enable the education system and promote extensive use of the Internet 48
Deepen linkages between Puerto Rico's people and the world 36
Optimize the use of health data and information 54Optimize health infrastructure 55
Table 11: Information Sector (NAICS - 51)
2004 - Project Puerto Rico 2025
Source: Economic and Social Planning Program, Puerto Rico Planning Board.

ECONOMIC DEVELOPMENT PLAN FOR PUERTO RICO 2015
53
Table 13 presents the different proposed strategies for the sector of Professional, Scientifi c and Technical (NAICS 54). These include the following three digits NAICS level subsectors: Legal Services, Accounting, Tax preparation, Bookkeeping and Payroll Services, Architectural, Engineering and Related Services, Specialized Design Services,
Strategy or Recommendation Paper Page/SlideIncrease public and private savings to increase national equity. 12
Create a private retirement plan complementary to the Social Security. 144
Issue new savings bonds with low denominations available to the public. 144 y 146
Fix maximum interests on saving deposits for commercial banks and credit unions. 146
Eliminate contribution deductions over personal loans. 146Revise law regulations for investment companies. 147Consider grants over guaranteed loans by the Government Development Bank. 147
Selective policy for bank regulation in favor of industry loan exempting them from contributions. 148
Allow wholesale banking to participate with international banks. 158Establish cooperatives in rural areas with training programs and productive economic activities focused on agriculture and manufacturing.
125 y 127
Capital to Work - Propitiate the mobilization and channeling of financial resources towards productive investments through efficient capital markets.
22
Redefining Responsibilities - Obtain the fiscal resources that will stimulate business activities, and productivity with efficiency. 23
Improve financing for cultural activities in Puerto Rico 64Reform University budget and incentive structure to promote research and development and technology transfer 28
Increase funding for laboratories, research centers and other research and development infrastructure at universities 28
Improve financial management of the education system 45Expand direct government funding for independent research and development centers and initiatives 23
Enhance and expand indirect government support and incentives for private sector research and development 24
Expand the availability and effectiveness of private equity funding for start-up businesses and small and medium enterprises 26
Increase support to small and medium enterprises in accessing federal and other external funding sources 26
Fund major scientific infrastructure projects needed to attract more private sector research and development 29
Reduce the tax burden and other financial costs that government imposes on small and medium enterprises 29
Improve the effectiveness of existing entities designed to promote the growth and formation 29
Enhance use of public equity funding for local enterprises 29Increase the agility and reduce the financial cost of government 32Overhaul the systems for promoting investment in Puerto Rico 35Raise participation of low-income populations in formal financial networks 42
Guarantee the effectiveness of programs that receive public funding through external assessment 62
Increase investment in electricity infrastructure and systems to improve efficiency and 76
Optimize the use of financial resources in promotion and prevention activities 52
Optimize the use of financial resources for health treatment 55Invest in new land freight systems 84Promote job creation by small and medium enterprises, community businesses and cooperatives 39
Redefine water and sewage pricing structure 76Redefine electricity pricing structure 76Enhance debt financing options available to small and medium enterprises 29
Public funds to provide financial assistance directly to students 2006 - Restoring Growth 580
Promote local businesses by providing support to local business owners in the form of financing alternatives, and access to internal and external markets.
8
Advance and upgrade infrastructure, facilitate private investments with a new financial method focused on efficiency and agility. 8
Promote a strong and healthy financial system to facilitate the efficient flow of capital to the economy and develop exporting capacities. 2009 - Strategies of a Strategic Model 26
Reducing the Costs of Doing Business 21Streamline Business Regulation - Mobilizing Finance for Business Development and Growth 11
Promote and formalize a high quality entrepreneur and investor community that resides locally in Puerto Rico. 17
Promote change in the business and investment paradigm. 18Allow cooperatives to be the motor of economic development. 23
2013 - A New Puerto Rico
Source: Economic and Social Planning Program, Puerto Rico Planning Board.
Table 12: Finance and Insurance Sector (NAICS - 52)
1975 - Puerto Rico’s Economic Development: A Strategy for the Next Decade (Informe Echenique)
1994 - New Model of Economic Development
2004 - Project Puerto Rico 2025
2006 -Economic Development And Government Transformation Plan For Puerto Rico
2012 - Report on the Competitiveness of Puerto Rico's Economy

ECONOMIC DEVELOPMENT PLAN FOR PUERTO RICO 2015
54
Computer Systems Design and Related Services, Management, Scientifi c and Technical Consulting Services, Scientifi c Research and Development Services, Advertising, and Related Services, and Other Professional, Scientifi c and Technical Services. For this sector the main developed strategies are focused on the area of technology and these are: design a digital website for research, technology and skills to link knowledge within and outside Puerto Rico, integrate into the global network of science and technology, build a research and marketing center, identify geographic areas of innovation and development, fi nance projects of scientifi c infrastructure needed to attract more private research and development, extend funding to research and development projects, simplify the patenting process of local technological innovations, encourage the export of high technology products, improve the regulatory environment to encourage the development of new businesses, and attract global talent to conduct research and development in universities. In addition, it is important the integration of universities and industries.
Strategy or Recommendation Paper Page/SlidePromote high technology industries. 23Evaluate education facilities, specifically for chemical engineering, industrial engineering, metalworking, mining, and others. 78
Improving the Product - Endow Puerto Rico with the best physical, technological, and human capital that will provide a competitive advantage in the global economy.
1994 - New Model of Economic Development 24-25
Design a digital portal for research, technology and skills to link expertise on and off the island 9, 109
Create a Puerto Rico science and technology global network 9, 109Build a research and commercialization center (technology transfer for Puerto Rico) and incubator 9, 109
Build a physical and virtual innovation zone around Puerto Rican hubs and nodes 9, 109
Target the marketing and branding of Puerto Rican technology capabilities 9, 109
Focus on the development of new knowledge technologies and the capacity to innovate. 2003 - Towards a Feasible Economy 46
Inventory current research and development skills and launch accelerated programs to fill gaps 22
Attract more global talent to conduct research and development at universities 28
Develop research and development at universities in collaboration with industry 49
Launch a coordinated campaign to attract more federal and external research and development projects to Puerto Rico 22
Create government research centers to pursue high-priority research needs 29
Define and implement a coordinated Innovation Agenda to prioritize action and policy across government, business and academia 23
Increase funding for laboratories, research centers and other research and development infrastructure at universities 28
Expand direct government funding for independent research and development centers and initiatives 23
Enhance and expand indirect government support and incentives for private sector research and development 24
Fund major scientific infrastructure projects needed to attract more private sector research and development 29
Develop industrial linkages and technology transfers. 230Export promotion for high technology and particularly sectors that have not had international market exposure and can have competitive advantages.
231
Educational programs in the area of business and entrepreneurial skills. 577
Regional center for finance and business services. 578Reform regulatory environment surrounding the entry of new business firms and development. 576
Move Puerto Rico towards an economy of knowledge with excellence in Biotechnology, Engineering, and Informatics.
2006 -Economic Development And Government Transformation Plan For Puerto Rico
8
Retain, expand, and diversify the current industrial base, and attract high value product manufacturing based on technologies and Research and Development.
2009 - Strategies of a Strategic Model 26
Boost the Service Industry. 21Position Puerto Rico into the economy of knowledge through the Science and Technology Trust. 26
2013 - A New Puerto Rico
Source: Economic and Social Planning Program, Puerto Rico Planning Board.
Table 13: Professional, Scientific and Technical Services Sector (NAICS - 54)
1975 - Puerto Rico’s Economic Development: A Strategy for the Next Decade (Informe Echenique)
2003 - The Puerto Rico Life Sciences Road Map
2004 - Project Puerto Rico 2025
2005 - Cepal Study - Globalization and Development
2006 - Restoring Growth

ECONOMIC DEVELOPMENT PLAN FOR PUERTO RICO 2015
55
Table 14 presents the Management of Companies and Enterprises sector (NAICS 55), and Administrative and Support and Waste Management and Remediation Services (NAICS 56) sector. The Management of Companies and Enterprises sector includes following three digits NAICS level subsectors: Support Services to Business and, Waste Management and Remediation Services. For the Waste Management subsector the strategies proposed are: implement and update the solid waste management plan and, decrease waste generation by reducing the use of materials and increase recycling. As part of this strategy linkages between manufacturing and waste management should be created to use recycled material as raw materials. On the other hand, for the subsector Travel Agencies and Reservation services, proposals have been aimed to encourage tourism in general. For example, it has been proposed: encourage domestic tourism, increase local tourism, and compete locally with foreign tourist offer. These travel agencies should be focus in create domestic tourism packages that can be sell both locally and in foreign markets.
In terms of the Education Services sector, 11 plans proposing with related strategies were identifi ed. Table 15 detail the strategies for the Education Services sector (NAICS 61) based on the plans evaluated. This sector includes the following three digits NAICS level subsectors: Elementary and Secondary Schools, Junior Colleges, Colleges, Universities and Professional Schools, Business Schools and Computer and Management Training, Technical and Trade Schools, Other Schools and Instructions, Educational and Support Services. Some of the strategies proposed for this sector of education K-12 (ie, the three levels of education, elementary, intermediate and secondary) are: establish cooperatives in rural areas with training programs, establish a local evaluation system of education services, improve teaching in terms of entrepreneurial skills, business management and personal fi nances, improve skills in math, science and technology, promote multilingual education and, increase retention and graduation rates in middle and high school. In order to implement these measures is important to begin to see the school system as a tool for economic development. The schools and colleges are the ideal places to transfer human capital and those skills needed to impart dynamism to the economy. For postsecondary education sector, some strategies have been proposed: establishing an incentive structure to promote research and development and technology transfer, encourage the development of research and development at universities in collaboration with industries and government, optimize retention and graduation rates at universities and, create programs to increase human capital acquisition of vulnerable groups (eg, illiterate adults, seniors, people with special needs, among others). For universities is essential ensure the integration of the production sectors and academia for the generation of new knowledge applied to create patents and products. Both the lack of funding and linkages with other sectors has generated limited the growth of university institutions.
Strategy or Recommendation Paper Page/SlideFluctuating Demand - Growth in secondary U.S. market areas, foreign origins, and internal Puerto Rican tourism provide enhanced opportunities for tourism growth and diversification
1979 - Economic Study of Puerto Rico (Kreps Report) 343
Provide support and incentives to non-profit organizations to create more job opportunities 41
Implement and update the solid-waste management plan 74
Reduce waste generation by reducing usage of materials and maximizing recycling 75
Export promotion for high technology and particularly sectors that have not had international market exposure and can have competitive advantages.
2005 - Cepal Study - Globalization and Development 231
Transform the tourism industry into the economic development motor that drives Puerto Rico.
2006 -Economic Development And Government Transformation Plan For Puerto Rico
9
Create and promote the mechanisms for investing in tourism projects. 16
Reinvest, boost, and enlarge tourism options. 20
Table 14: Administrative and Support and Waste Management and Remediation Services (NAICS - 55-56)
2004 - Project Puerto Rico 2025
2013 - A New Puerto Rico
Source: Economic and Social Planning Program, Puerto Rico Planning Board.

ECONOMIC DEVELOPMENT PLAN FOR PUERTO RICO 2015
56
Strategy or Recommendation Paper Page/SlideEstablish cooperatives in rural areas with training programs and productive economic activities focused on agriculture and manufacturing.
125 y 127
Evaluate education facilities, specifically for chemical engineering, industrial engineering, metalworking, mining, and others.
78
Policy Options - Increase spending for adult education 733
Policy Options - Greater use of the Right to Read Program 733
Policy Options - Bilingual education 733Improving the Product - Endow Puerto Rico with the best physical, technological, and human capital that will provide a competitive advantage in the global economy.
24-25
Promoting our people - Transform how education and vocational training is perceived. 26
Promoting our people - Promote economic sectors with a trained work force and the ability of adapting to frequent changes in technology and other occupational requirements.
26
Design a future workforce learning resource center 2003 - The Puerto Rico Life Sciences Road Map 9, 109
Focus on the development of new knowledge technologies and the capacity to innovate. 46
Count on an integrated education policy and create collaborative networks inside and outside of Puerto Rico. 47
Improve teaching of entrepreneurial and business skills in the education system 27
Reform University budget and incentive structure to promote research and development and technology transfer 28
Attract more global talent to conduct research and development at universities 28
Increase funding for laboratories, research centers and other research and development infrastructure at universities 28
Achieve universal primary education 44Improve financial management of the education system 45Introduce metrics and incentives to improve performance in the education system 45
Improve the quality of resources for primary and secondary education 46
Improve the quality of resources for post-secondary education 46
Promote total quality in the operation of the public and private education system 47
Optimize academic results and promote the search for excellence 47
Information Technology-enable the education system and promote extensive use of the Internet 48
Promote ethical and civic content in curricula and education professionals 48
Develop research and development at universities in collaboration with industry 49
Promote community and family participation in the pre-K-to-12 learning process 49
Optimize retention and graduation rates in schools and universities 50
Table 15: Educational Services Sector (NAICS - 61)
1975 - Puerto Rico’s Economic Development: A Strategy for the Next Decade (Informe Echenique)
1979 - Economic Study of Puerto Rico (Informe Kreps)
1994 - New Model of Economic Development
2003 - Towards a Feasible Economy
2004 - Project Puerto Rico 2025
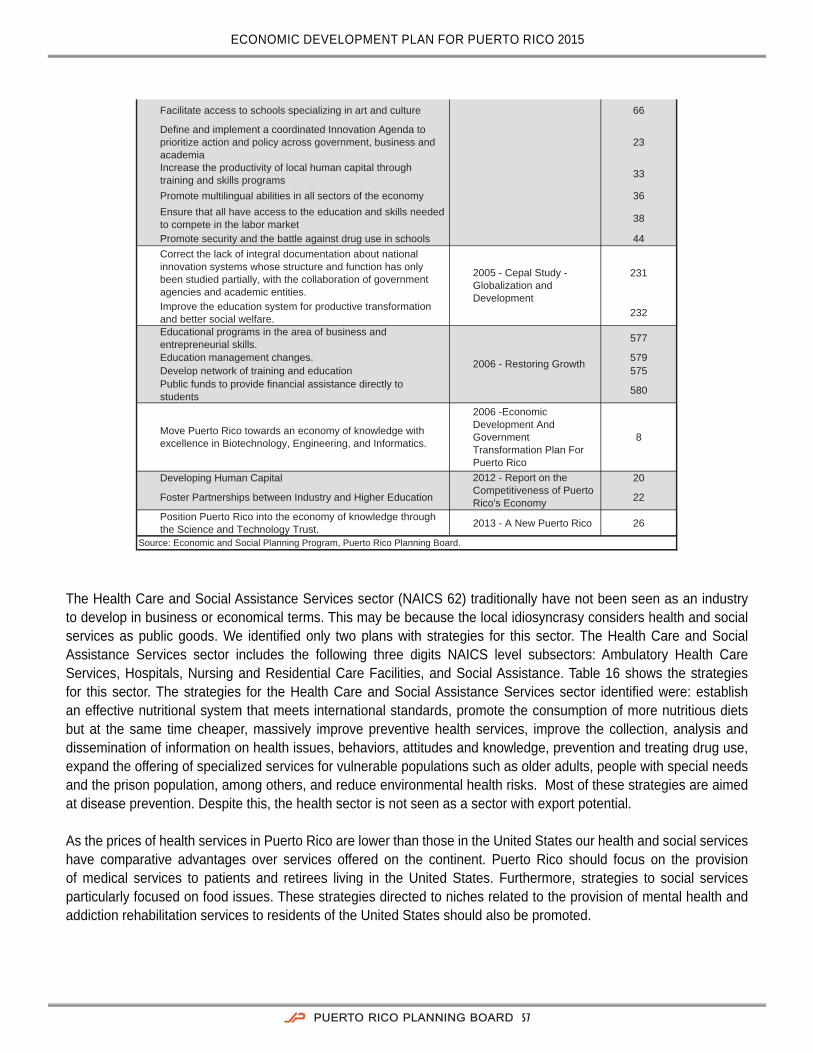
ECONOMIC DEVELOPMENT PLAN FOR PUERTO RICO 2015
57
The Health Care and Social Assistance Services sector (NAICS 62) traditionally have not been seen as an industry to develop in business or economical terms. This may be because the local idiosyncrasy considers health and social services as public goods. We identifi ed only two plans with strategies for this sector. The Health Care and Social Assistance Services sector includes the following three digits NAICS level subsectors: Ambulatory Health Care Services, Hospitals, Nursing and Residential Care Facilities, and Social Assistance. Table 16 shows the strategies for this sector. The strategies for the Health Care and Social Assistance Services sector identifi ed were: establish an effective nutritional system that meets international standards, promote the consumption of more nutritious diets but at the same time cheaper, massively improve preventive health services, improve the collection, analysis and dissemination of information on health issues, behaviors, attitudes and knowledge, prevention and treating drug use, expand the offering of specialized services for vulnerable populations such as older adults, people with special needs and the prison population, among others, and reduce environmental health risks. Most of these strategies are aimed at disease prevention. Despite this, the health sector is not seen as a sector with export potential.
As the prices of health services in Puerto Rico are lower than those in the United States our health and social services have comparative advantages over services offered on the continent. Puerto Rico should focus on the provision of medical services to patients and retirees living in the United States. Furthermore, strategies to social services particularly focused on food issues. These strategies directed to niches related to the provision of mental health and addiction rehabilitation services to residents of the United States should also be promoted.
Facilitate access to schools specializing in art and culture 66
Define and implement a coordinated Innovation Agenda to prioritize action and policy across government, business and academia
23
Increase the productivity of local human capital through training and skills programs 33
Promote multilingual abilities in all sectors of the economy 36Ensure that all have access to the education and skills needed to compete in the labor market 38
Promote security and the battle against drug use in schools 44Correct the lack of integral documentation about national innovation systems whose structure and function has only been studied partially, with the collaboration of government agencies and academic entities.
231
Improve the education system for productive transformation and better social welfare. 232
Educational programs in the area of business and entrepreneurial skills. 577
Education management changes. 579Develop network of training and education 575Public funds to provide financial assistance directly to students 580
Move Puerto Rico towards an economy of knowledge with excellence in Biotechnology, Engineering, and Informatics.
2006 -Economic Development And Government Transformation Plan For Puerto Rico
8
Developing Human Capital 20
Foster Partnerships between Industry and Higher Education 22
Position Puerto Rico into the economy of knowledge through the Science and Technology Trust. 2013 - A New Puerto Rico 26
2005 - Cepal Study - Globalization and Development
2006 - Restoring Growth
2012 - Report on the Competitiveness of Puerto Rico's Economy
Source: Economic and Social Planning Program, Puerto Rico Planning Board.

ECONOMIC DEVELOPMENT PLAN FOR PUERTO RICO 2015
58
The inclusion of strategies to promote Arts, Entertainment and Recreation (NAICS 71) has been included recently in economic development plans. For example, it is not until the Puerto Rico 2025 plan that 18 strategies dedicated to this sector were proposed. Three plans proposing strategies to encourage activity in this industrial sector were identifi ed. The Arts, Entertainment and Recreation include the following three digits NAICS level subsectors: Performing Arts, Spectator Sports and Related Industries, Museums, Historical sites, and Similar Institutions, Amusement, Gambling, and Recreation Industries. Table 17 shows the strategies the sector. These strategies focus on, promotion, development, management and coordination of cultural, artistic, sporting, and recreational activities and, promotion of human capital and entrepreneur skills in cultural, arts, sports and recreational areas. It is important for future plans to consider the insertion of this sector in tourism. This insertion should look primarily to integrate small and medium businesses in offering a diversifi ed visit. Other strategies to consider are: creation of distribution system and market intelligence that allows the identifi cation of potential export markets and, establishment of support mechanisms to increase effi ciency and quality of local production. Perhaps one of the great challenges of this sector is that we should begin to see this sector from the point of view of business and commerce rather than a folk activity separated from the economy.
Strategy or Recommendation Paper Page/SlideFood Prices and Nutrition - Food and nutrition goals similar to those in the United States for eliminating hunger and malnutrition. 291
Food Prices and Nutrition - Improving island food production and marketing efficiency to competitively provide cheaper and more nutritious diets.
291
Incorporate preventive services into routine medical care, both public and private 53
Improve collection, analysis and dissemination of information about health problems, behaviors, attitudes and knowledge 53
Optimize the use of health data and information 54Establish and publicize quality standards for healthcare providers 54Promote illness prevention in target population groups 54Optimize health infrastructure 55Optimize the use of financial resources for health treatment 55Guarantee food assistance for higher risk groups and strengthen nutritional food surveillance systems 55
Promote recreation and sports among the physically and mentally disabled 67
Promote and reinforce human resource skills in the health system 55Promote coordination between diverse public and private organizations for the achievement of health objectives 55
Optimize treatment of drug addiction in Puerto Rico 58Promote the habilitation and rehabilitation of the prison population 62Reduce environmental risks to health 55Promote security and the battle against drug use in schools 44
Table 16: Health Care and Social Assistance Sector (NAICS - 62)
1979 - Economic Study of Puerto Rico (Informe Kreps)
2004 - Project Puerto Rico 2025
Source: Economic and Social Planning Program, Puerto Rico Planning Board.

ECONOMIC DEVELOPMENT PLAN FOR PUERTO RICO 2015
59
Table 18 shows some of the strategies for the Accommodation and Food Services (NAICS 72). The sector includes the following three digits NAICS level subsectors: Accommodation and, Food Services and Drinking Places. Most strategies aimed this sector have been focused to encourage tourism by nonresidents. We have identifi ed three main areas of proposed strategies to encourage the Accommodation and Food Services sector as follows: cost reduction to tourists, improving tourism infrastructure and, strategic marketing of Puerto Rico in United States and European markets. While these strategies are still valid and should be part of an ongoing review process, today we should consider adding the following strategies: provide a diversifi ed tourism experience from other tropical regions and is important to identify and consolidate a design for our tourism system that makes us unique, integrate small and medium businesses (including folklore, arts and sports) in offering a diversifi ed visit, create a dynamic process linking the commercial and business tourist with the Puerto Rico beyond the period and purpose of visit.
Strategy or Recommendation Paper Page/Slide
Develop arts and culture 50Protect Puerto Rico's historic and archaeological heritage and patrimony 63
Improve financing for cultural activities in Puerto Rico 64Promote and develop the musical arts 64Develop and strengthen culture and recreation centers in municipalities and communities 65
Provide incentives for professional and competitive sports 65Promote recreation and sport among children and youth in schools and universities 65
Develop human capital for cultural production 65Facilitate access to schools specializing in art and culture 66Establish a coordinated organizational model for cultural activities in Puerto Rico, that improves coordination, resource-allocation and continuity, while maintaining autonomy
66
Promote the development, management and coordination of museums 66
Promote Puerto Rican festivities and traditions 66Promote and develop the plastic arts 66Promote and develop the representational arts 66Promote the development of literature and its diffusion within and outside Puerto Rico 66
Promote Puerto Rican cultural production in the international environment 67
Promote recreation and sports among seniors 67Promote recreation and sports among the physically and mentally disabled 67
Develop the movie, cinematography, and creative service industry, and help transform it into an economically viable industry for the long run.
2009 - Strategies of a Strategic Model 26
Table 17: Arts, Entertainment and Recreation Sector (NAICS - 71)
2004 - Project Puerto Rico 2025
Source: Economic and Social Planning Program, Puerto Rico Planning Board.

ECONOMIC DEVELOPMENT PLAN FOR PUERTO RICO 2015
60
Table 19 contains strategies for Other Services (except Public Administration) (NAICS 81). This industry includes the following three digits NAICS level subsectors: Repair and Maintenance, Personal and Laundry Services, Religious, Grantmaking, Civic, Professional, and Similar Organizations and, Private Households. These strategies were not necessarily designed for the industry of Other Services. Despite this, strategies that may be applicable to the industry were compiled and these are: eliminate or reduce government regulations that create ineffi ciencies for small and medium businesses, encouraging small and medium businesses in government contracting, promote coordinated business support networks to help small and medium businesses, expand the sources of funding for the creation of new small and medium businesses and, reduce the tax burden and other fi nancial expenses imposed by government to small and medium businesses. For this industry can be adopted strategies proposed for the Retail Trade sector such as: increase marketing services companies, provide assistance for the development of business plans, promote effi ciency in other services sector, using tourism as a mechanism for reactivation of other services, improve the supply chain intelligence in services, incorporate the informal traders into the formal sector, and reduces the costs of establishing a business.
Strategy or Recommendation Paper Page/SlideDevelop tourism outside of San Juan and the metro area. 102-104
Reduce tariffs and costs associated to air travel and accommodations. 102
Fluctuating Demand - Growth in secondary U.S. market areas, foreign origins, and internal Puerto Rican tourism provide enhanced opportunities for tourism growth and diversification
343
Urban Concentration of Tourism - Increased demand has facilitated private refurbishing of many tourism facilities and the opening of closed retail establishments and hotels
343
Air Transportation - New gateways to the U.S. mainland providing additional nonstop service between San Juan and its major U.S. markets.
343
Transform the tourism industry into the economic development motor that drives Puerto Rico.
2006 -Economic Development And Government Transformation Plan For Puerto Rico
9
Design new offers to retain and attract and develop new tourist segments.
2009 - Strategies of a Strategic Model 26
Create and promote the mechanisms for investing in tourism projects. 16
Reinvest, boost, and enlarge tourism options. 20
Table 18: Accommodation and Food Services (NAICS - 72) and Tourism Sectors
1975 - Puerto Rico’s Economic Development: A Strategy for the Next Decade (Informe Echenique)
1979 - Economic Study of Puerto Rico (Informe Kreps)
2013 - A New Puerto Rico
Source: Economic and Social Planning Program, Puerto Rico Planning Board.

ECONOMIC DEVELOPMENT PLAN FOR PUERTO RICO 2015
61
Table 20 presents strategies to be implemented in the Public Administration sector because this is a crucial one that affects the competitiveness of other sectors of the economy. Discussion of strategies for this sector is outside the scope of study of this plan. Strategies are summarized in three broad categories: strategies to eliminate market failures, strategies to create incentives and, strategies for improving business intelligence locally. For example, The New Model of Economic Development (1994) proposed eliminate market failure by promoting the mobilization and channeling of financial resources into productive investments through efficient capital markets. On the other hand, the Economic Development of Puerto Rico, A Strategy for the Next Decade (Echenique Report, 1975) suggests promoting incentives to companies in order to establish offices in Puerto Rico. Finally, Puerto Rico 2025 (2004) aims to improve the business intelligent at local level through a coordinated innovation agenda to prioritize action and policy through government, business and academia.
Strategy or Recommendation Paper Page/SlideReview and adjust government regulations and inefficiencies that unnecessarily hinder the growth of small and medium enterprises
25
Make government procurement processes more favorable to local small and medium enterprises 25
Establish coordinated entrepreneurial support networks to help small and medium enterprises get organized and leverage capabilities
28
Promote job creation by small and medium enterprises, community businesses and cooperatives 39
Expand job-search and placement assistance programs 40Expand the availability and effectiveness of private equity funding for start-up businesses and small and medium enterprises
26
Increase support to small and medium enterprises in accessing federal and other external funding sources 26
Reduce the tax burden and other financial costs that government imposes on small and medium enterprises 29
Create and sustain a comprehensive program to promote the development of island-based businesses. 576
Reform regulatory environment surrounding the entry of new business firms and development. 576
Boost the Service Industry. 2013 - A New Puerto Rico 21
Table 19: Other Services Sector (NAICS - 81)
2004 - Project Puerto Rico 2025
2006 - Restoring Growth
Source: Economic and Social Planning Program, Puerto Rico Planning Board.

ECONOMIC DEVELOPMENT PLAN FOR PUERTO RICO 2015
62
Strategy or Recommendation Paper Page/SlideOffer incentives to businesses in order to establish offices in Puerto Rico. 23, 81Develop policies directed to retain labor intensive industries. 27Explore opportunities to import without paying tariffs. 32Grant the autonomy to impose tariffs over imports and use the income as subsidies for the local production. 33, 68Replace exemptions for contribution credit over investment that allows businesses to reduce their future contributions. 35, 37Implement a salaries subsidy program directed to slow the closing turnover of labor intensive industries. 36
Promote and develop industries that are less sensitive to the costs of labor. 43Measure the changes in total productivity. 53Create an agency responsible to investigate and promote opportunities on import substitution. 68
Establish a fleet policy for naval traffic traveling to Puerto Rico. 68No tariff regulations over product imports with environmental benefits. 68Intensify the efforts of local market promotions. 69Evaluate education facilities, specifically for chemical engineering, industrial engineering, metalworking, mining, and others. 78Evaluate the faculties of the Commercial Administration and prioritize their improvement plans. 78
Establish the fabrication of copper and petroleum products in Puerto Rico and limit their contribution exemptions. 81
Develop a system of family owned farms. 93, 127
Reduce tariffs and costs associated to air travel and accommodations. 102Increase gasoline taxes to reduce consumption. 110, 139Cease electric subsidies to low consumption families. 111Establish a solar energy research program with government funding. 111Analyze and investigate alternatives to resolve water shortages. 112Complete a regulated land use plan accompanied by effective controls. 113Establish an efficient and viable transportation system for the metropolitan area and explore a underground system. 113
Reevaluate the use of natural resource terrains to establish new industrial plants, and establish a penalty system for contamination. 115
Reduce the public sector deficit through increases on income and reduction in costs. 135
Develop new incomes through nontraditional sources. 139Increase contribution incomes through property reappraisals. 139Increase tariffs over automobiles, durable goods, and luxury products. 139 y 146Terminate contribution exemptions over public corporations and authorities. 140No increases over individual and corporate contributions. 140Create a private retirement plan complementary to the Social Security. 144Issue new savings bonds with low denominations available to the public. 144 y 146Fix maximum interests on saving deposits for commercial banks and credit unions. 146
Eliminate contribution deductions over personal loans. 146Revise law regulations for investment companies. 147Consider grants over guaranteed loans by the Government Development Bank. 147
Selective policy for bank regulation in favor of industry loan exempting them from contributions. 148
Allow wholesale banking to participate with international banks. 158Import substitution to create more opportunities for industrial investment and agricultural production. 12
Production and Productivity - Identify, produce, and market those commodities which have the greatest economic comparative advantage for mainland and export markets and domestic consumption.
290
Production and Productivity - Provide fertilizers, seeds or plant materials, machinery services, operating supplies, and technical assistance consistent with efficient production patterns.
290
Table 20: Government (NAICS - 92) and Competitiveness Sectors
1975 - Puerto Rico’s Economic Development: A Strategy for the Next Decade (Informe Echenique)

ECONOMIC DEVELOPMENT PLAN FOR PUERTO RICO 2015
63
Marketing Efficiency and Product Quality - Develop handling, processing, and storage facilities and systems for consistent high-quality products produced by Puerto Rican farmers.
290
Food Prices and Nutrition - Food and nutrition goals similar to those in the United States for eliminating hunger and malnutrition. 291
Food Prices and Nutrition - Improving island food production and marketing efficiency to competitively provide cheaper and more nutritious diets. 291
Rural Living - Construct homes on a self-help basis. 291Income Security - Modify existing income security programs while promoting job creation and training opportunities 734
Puerto Rico Destination and Global Bridge - Adopt strategies that enable and promote a competitive environment at a global scale. 19-20
Government Facilitator - An effective Regulatory framework that promotes coherent visions on economic development and business development. 21
Capital to Work - Propitiate the mobilization and channeling of financial resources towards productive investments through efficient capital markets. 22
Redefining Responsibilities - Obtain the fiscal resources that will stimulate business activities, and productivity with efficiency. 23
Promoting our people - Promote economic sectors with a trained work force and the ability of adapting to frequent changes in technology and other occupational requirements.
26
Promoting our people - Transform how education and vocational training is perceived. 26
New Social Contract - Social stability and security that provides an attractive environment for the location of new economic activities in Puerto Rico. 27-28
Reinventing the Government - Promote the restructuring of agencies and institutions to adapt them to new requirements and context by eliminate those that are unnecessary and unresponsive, and create new entities for key activities or necessary interactions that are not yet met in the actual organizational scheme.
29
Build a physical and virtual innovation zone around Puerto Rican hubs and nodes 9, 109
Target the marketing and branding of Puerto Rican technology capabilities 9, 109Redefine Government functions through institutional reform created by a broad consensus. 44
Create the Puerto Rico brand, segment promotional strategies, and change the focus of "achieving" to "exceeding". 45
Focus on the development of new knowledge technologies and the capacity to innovate. 46
Count on an integrated education policy and create collaborative networks inside and outside of Puerto Rico. 47
Analysis on budget subsidies, implement zero based budgeting and zero based organization, and coordinate municipal, agency, and private sector efforts.
48
Recognize the importance of supply chains, promote technology transfers, and the migration from exogenous to endogenous models. 49
Launch a coordinated campaign to attract more federal and external research and development projects to Puerto Rico 22
Define and implement a coordinated Innovation Agenda to prioritize action and policy across government, business and academia 23
Expand direct government funding for independent research and development centers and initiatives 23
Enhance and expand indirect government support and incentives for private sector research and development 24
Review and adjust government regulations and inefficiencies that unnecessarily hinder the growth of small and medium enterprises 25
Make government procurement processes more favorable to local small and medium enterprises 25
Expand the availability and effectiveness of private equity funding for start-up businesses and small and medium enterprises 26
Increase support to small and medium enterprises in accessing federal and other external funding sources 26
Launch a broader campaign to cultivate a widely-held entrepreneurial culture 27
Establish coordinated entrepreneurial support networks to help small and medium enterprises get organized and leverage capabilities 28
Fund major scientific infrastructure projects needed to attract more private sector research and development 29
Create government research centers to pursue high-priority research needs 29Reduce the tax burden and other financial costs that government imposes on small and medium enterprises 29
2003 - Towards a Feasible Economy
1979 - Economic Study of Puerto Rico (Informe Kreps)
1994 - New Model of Economic Development
2003 - The Puerto Rico Life Sciences Road Map

ECONOMIC DEVELOPMENT PLAN FOR PUERTO RICO 2015
64
Improve the effectiveness of existing entities designed to promote the growth and formation 29
Enhance use of public equity funding for local enterprises 29
Increase the agility and reduce the financial cost of government 32Increase the productivity of local human capital through increasing use of technology 33
Increase the productivity of local human capital through training and skills programs 33
Reduce regulatory inefficiencies impacting the economy 34Overhaul the positioning and branding of Puerto Rico 34Overhaul the systems for promoting investment in Puerto Rico 35Overhaul the systems for promoting exports from Puerto Rico 35Institute programs to attract more global talent to Puerto Rico 36Deepen linkages between Puerto Rico's people and the world 36Promote multilingual abilities in all sectors of the economy 36Rationalize unproductive subsidies distorting competition and resource allocation in key economic sectors 36
Improve the ongoing process for defining the overall economic strategy of Puerto Rico 36
Reduce the total effective cost of human resources in Puerto Rico 36Remove protections and other impediments limiting competition in key economic sectors 36
Ensure that all have access to the education and skills needed to compete in the labor market 38
Promote self-sufficiency and individual and community responsibility as priorities for all Puerto Ricans 38
Provide incentives for job creation in the private sector 39Promote job creation by small and medium enterprises, community businesses and cooperatives 39
Use direct government funding to stimulate job creation 40Expand job-search and placement assistance programs 40Provide support and incentives to non-profit organizations to create more job opportunities 41
Reform social assistance programs to encourage employment 41Use fiscal mechanisms to increase the incentives for seeking employment 41Provide practical services that make it easier to access and stay in employment 41
Rationalize regulations in order to stimulate more job creation 41Raise participation of low-income populations in formal financial networks 42Optimize the distribution of jobs in the public sector 42Increase the role of employers in keeping employees motivated and in the workforce 42
Promote security and the battle against drug use in schools 44Promote and reinforce human resource skills in the health system 55Promote coordination between diverse public and private organizations for the achievement of health objectives 55
Reduce environmental risks to health 55Promote citizen participation in crime prevention 57Optimize treatment of drug addiction in Puerto Rico 58Develop a plan for the ongoing study of violence 58Provide assistance and protection to the victim of crimes and violence 59Guarantee the independence of the legal justice system and the continuity of key policies 59
Guarantee compliance with international human rights norms 60Coordinate crime fighting efforts at local, regional and international levels 60Guarantee access to justice for all citizens 61Substantially reduce corruption 61Develop a juvenile criminal justice plan 62Intervene to prevent domestic violence and sexual aggression, and eliminate recurrence 62
Expedite penal procedures 62Promote the habilitation and rehabilitation of the prison population 62Guarantee the effectiveness of programs that receive public funding through external assessment 62
Create and enact an integrated and detailed land-use master plan 69
Communicate the new land-use plan and permitting process to the community 70
Strengthen mechanisms for enforcing compliance with the new land-use plan 70
Restructure the adjudication, permitting and approval process 70Restructure the functions of government agencies to carry out the land-use planning and permitting process 71
Improve mechanisms for community participation in the land-use planning and permitting process 71
Redefine and ensure compliance with environmental agencies' processes 71
2004 - Project Puerto Rico 2025
ECONOMIC DEVELOPMENT PLAN FOR PUERTO RICO 2015
65
Establish environmental market-based systems to encourage self-administration by businesses and households 71
Strengthen or modify current environmental laws, and explore new regulation schemes to ensure environmental conservation 72
Promote environmental consciousness among individuals through regulation and incentives 72
Define community compliance goals for environment safekeeping 72Review and update the long-term water and sewage management plan 73Implement and update the solid-waste management plan 74Increase investment in water and sewage infrastructure and systems to improve efficiency and reliability and reduce pollution 74
Establish a truly independent regulatory body for the electricity sector 75Promote use of renewable energy sources 75Promote reduced water-usage 75Reduce waste generation by reducing usage of materials and maximizing 75Promote reduced energy-usage 76Diversify fuel sources for electric power generation 76Promote cleaner use of fossil fuels for electric power generation 76Increase investment in electricity infrastructure and systems to improve 76Redefine water and sewage pricing structure 76Redefine electricity pricing structure 76Strengthen the water and sewage regulatory body so that it becomes truly independent 77
Open the electric power market to competition in all areas (generation, transmission and distribution) 77
Open the water and sewage market to competition at all levels 77Create and promote efficient and reliable collective transport 79Complete the road and highway network 80Improve the productivity and competitiveness of existing ports and airports 80Ensure that the land-use plan reduces the need for transport 81Increase the efficiency and capacity of existing roads 81Promote clean fuels and advanced technology for transportation 82Create new mechanisms to incorporate the community in transportation 83Enhance debt financing options available to small and medium enterprises 29Strengthen the local capital industry and project it to external markets. 230Industrial development policy that translates widely and has a context and object based national innovation system. 230
Learning processes associated to the development of productive linkages. 231Export promotion for high technology and particularly sectors that have not had international market exposure and can have competitive advantages. 231
Harmonize government support mechanisms applied to agriculture with restrictions and agreements of free commerce. 231Correct the lack of integral documentation about national innovation systems whose structure and function has only been studied partially, with the collaboration of government agencies and academic entities.
231
Improve the education system for productive transformation and better social welfare. 232
Move as many productive units from the informal sector and black markets to the formal economic sector. 232
Reform social protection program to promote efforts by individuals to seek employment. 574
Income tax credits similar to USA. 574Review transfer programs 574Develop network of training and education 575Create and sustain a comprehensive program to promote the development of island-based businesses. 576
Reform regulatory environment surrounding the entry of new business firms and development. 576
Modify the application of minimum wage. 579Public funds to provide financial assistance directly to students 580Accountability to allocate resources where they are needed. 579Energy reform to lower costs and eliminate barriers of entry. 580Restructuring public policy (high quality, reliable, cost efficiency) 580Create independent regulatory board to provide oversight of generation and distribution of electricity. 580
Improve quality of transportation and water and sewer systems. 581Combine broad tax base with low rates. 583Attractive base for international business. 583Broad base consumption tax to reduce tax evasion and disincentives toward work. 583
Advance and upgrade infrastructure, facilitate private investments with a new financial method focused on efficiency and agility. 8
Transform the government, without privatization or severance, so that: a) offer high quality services with efficiency and agility, b) contribute to the socioeconomic development.
9
2005 - Cepal Study - Globalization and Development
2006 - Restoring Growth
2006 -Economic Development And Government Transformation Plan For Puerto Rico
ECONOMIC DEVELOPMENT PLAN FOR PUERTO RICO 2015
66
The economic development of Puerto Rico, like all countries, is limited by their levels of effi ciency and production capacity. These economic development plans contain excellent strategies to boost our levels of effi ciency and productive capacity. Strategies compiled by these economic development plans focus on the following areas: cost reduction, improve business and human capital skills, improve business intelligence, eliminate market failures caused by government intervention, and increase levels of physical capital. These strategies should be cause for refl ection for public policy makers and other civilian population groups.
Section 5: Strengths and opportunities in industrial sectors
In this section the strengths and opportunities in various industrial sectors are discussed. For this purpose will be used the analysis of the location coeffi cient (LQ) to compare Puerto Rico with the United States, to assess our competitive advantages. The location quotient analysis (LQ) was performed in order to study the different industrial sub-sectors of the economy of Puerto Rico. The LQ quantify the industry concentration in a region compared, usually, with a larger region, in this case Puerto Rico to the United States. The LQ was calculated for 186 subsectors (4 digit NAICS level) based on data for Puerto Rico and the United States, provided by the U.S. Census Bureau County Business Pattern for 2011. Data for agriculture, forestry, fi shing and hunting sector (NAICS 11) were not available for 2011. The criteria used to evaluate the sector performance were: number of employees, total annual payroll, annual payroll per employee and, number of establishments. To simplify the analysis the cumulative distribution function (CDF) was used to identify and prioritize the LQ by subsector according to the observed variables. The CDF is a function whose value is the probability that a continuous random variable has a corresponding lower or equal value to the function argument. The parameters chosen for the CDF analysis of all variables were 30 percent higher, or sectors that showed superior performance percentile 70 was selected. Also, annual payroll per employee was analyzed with the parameter of the 30 percent lower CDF. This is because lower costs mean more competitive.
Table 21 shows subsectors whose LQ gather all possible combinations of CDF for the observed variables. MID combinations are presented in Table 20. There were 28 subsectors who met at least 1 combination. Footwear manufacturing (NAICS 3162) was the only subsector that followed all the possible combinations of parameters (combination G). Drugs and druggists sundries merchant wholesalers (NAICS 4242), and medical and diagnostic laboratories (NAICS 6215) met the combined endpoint about the number of employees, annual payroll per worker
Promote a strong and healthy financial system to facilitate the efficient flow of capital to the economy and develop exporting capacities. 26
Promote entrepreneurship and improve value offers for consumers with a focus on diversification and competition. 26
Develop a business and labor environment based on quality and competitiveness. 26
Improving Labor Market Opportunities - Reduce Barriers to Job Creation and Labor Force Participation 19
Developing Human Capital 20Reducing the Costs of Doing Business 21Streamline Business Regulation - Mobilizing Finance for Business Development and Growth 11
Lowering Dependence on a Shrinking Industry 12Promote Independent Policy Evaluation 23Incubate the Chief Information Office so that it can strengthen and obtain its own identity. 19
Promote the restructuring of agencies and institutions to adapt them to new requirements and context. 22
Construction development projects from government investment 24Federal strategy initiatives. 27Dollars stay here. 28Publicity focused on results and branding recognition. 28
2013 - A New Puerto Rico
Source: Economic and Social Planning Program, Puerto Rico Planning Board.
2009 - Strategies of a Strategic Model
2012 - Report on the Competitiveness of Puerto Rico's Economy

ECONOMIC DEVELOPMENT PLAN FOR PUERTO RICO 2015
67
(lowest 30 percent), and number of establishments (combination E). Bakeries and tortilla manufacturing (NAICS 3118), beverage manufacturing (NAICS 3121), cut and sew apparel manufacturing (NAICS 3152), pharmaceutical and medicine manufacturing (NAICS 3254), paint, coating and adhesive manufacturing (NAICS 3255), cement and concrete product manufacturing (NAICS 3273), health and personal care stores (NIACS 4461), shoe stores (NAICS 4482), support activities related for water transportation (NAICS 4883), non-depository credit intermediation (NAICS 5222), investigation and security (NAICS 5616), junior colleges (NAICS 6112), and educational support services (NAICS 6117) met the combined endpoint of number of employees, annual payroll and, number of establishments (L combination).
The Table 22 shows the CL for the number of employees by sub-sector with the parameter superior to 30 percent of the CDF. The fi rst 4 subsectors had an LQ greater than 8, these were: NAICS 3162 – footwear manufacturing (17.55); the NAICS 3254 – pharmaceutical and medicine manufacturing (13.69), NAICS 3152 - cut and sew apparel manufacturing (11.29), and NAICS 3391 – medical equipment and supplies manufacturing (8.26).
Sector by NAICS A B C D E F G H J K L Conditions Met3162 - Footwear manufacturing 113118 - Bakeries and tortilla manufacturing 43121 - Beverage manufacturing 43152 - Cut and sew apparel manufacturing 43254 - Pharmaceutical and medicine manufacturing 43255 - Paint, coating, and adhesive manufacturing 43273 - Cement and concrete product manufacturing 44461 - Health and personal care stores 44482 - Shoe stores 44883 - Support activities for water transportation 45222 - Nondepository credit intermediation 45616 - Investigation and security services 46112 - Junior colleges 46117 - Educational support services 44242 - Drugs and druggists' sundries merchant wholesalers 46215 - Medical and diagnostic laboratories 42361 - Residential building construction 13119 - Other food manufacturing 13241 - Petroleum and coal products manufacturing 1
3353 - Electrical equipment manufacturing 13391 - Medical equipment and supplies manufacturing 14413 - Automotive parts, accessories, and tire stores 14481 - Clothing stores 14852 - Interurban and rural bus transportation 15259 - Other investment pools and funds 15611 - Office administrative services 15622 - Waste treatment and disposal 16211 - Offices of physicians 1
L - Number of Employees (CDF 70% or higher), Total Annual Payroll (CDF 70% or higher), Number of Establishments (CDF 70% or higher)
LegendA - Number of Employees (CDF 70% or higher), Annual Payroll Per Employee (CDF 30% or lower)B - Total Annual Payroll (CDF 70% or higher), Annual Payroll Per Employee (CDF 30% or lower)C - Annual Payroll Per Employee (CDF 30% or lower), Number of Establishments (CDF 70% or higher)D - Number of Employees (CDF 70% or higher), Total Annual Payroll (CDF 70% or higher), Annual Payroll Per Employee (CDF 30% or lower)E - Number of Employees (CDF 70% or higher), Annual Payroll Per Employee (CDF 30% or lower), Number of Establishments (CDF 70% or higher)F - Total Annual Payroll (CDF 70% or higher), Annual Payroll Per Employee (CDF 30% or lower), Number of Establishments (CDF 70% or higher)G - Number of Employees (CDF 70% or higher), Total Annual Payroll (CDF 70% or higher), Annual Payroll Per Employee (CDF 30% or lower), Number of Establishments (CDF 70% or higher)H - Number of Employees (CDF 70% or higher), Total Annual Payroll (CDF 70% or higher)J - Number of Employees (CDF 70% or higher), Number of Establishments (CDF 70% or higher)K - Total Annual Payroll (CDF 70% or higher), Number of Establishments (CDF 70% or higher)
Table 21: Cumulative Distribution Function Analysis for Location Quotient for all Sub-Sectors in Puerto Rico, 2011 (NAICS 11 - 72)
*CDF = Cumulative Distribution Function with respect to the Location Quotient

ECONOMIC DEVELOPMENT PLAN FOR PUERTO RICO 2015
68
Table 23 shows the CL for the total annual payroll by sub-sector with the parameter superior to 30 percent of the CDF. The fi rst 4 subsectors had an LQ greater than 9 and these were: NAICS 3254 – pharmaceutical and medicine manufacturing (18.82); the NAICS 3162 – footwear manufacturing (15.06), the NAICS 3152 - cut and sew apparel manufacturing (12.23); and NAICS 3391 - medical equipment and supplies manufacturing (9.17).
Table 22: Location Quotient of Number of Employees for All Sub-Sectors in Puerto Rico, 2011 (NAICS 11-72) with Cumulative Distribution Function 70% or HigherSector by NAICS Location Quotient
3162 - Footwear manufacturing 17.553254 - Pharmaceutical and medicine manufacturing 13.693152 - Cut and sew apparel manufacturing 11.293391 - Medical equipment and supplies manufacturing 8.265616 - Investigation and security services 4.613353 - Electrical equipment manufacturing 4.443255 - Paint, coating, and adhesive manufacturing 3.854883 - Support activities for water transportation 3.626112 - Junior colleges 3.585622 - Waste treatment and disposal 3.245222 - Nondepository credit intermediation 3.226215 - Medical and diagnostic laboratories 3.144482 - Shoe stores 2.966117 - Educational support services 2.914461 - Health and personal care stores 2.814242 - Drugs and druggists' sundries merchant wholesalers 2.85611 - Office administrative services 2.773118 - Bakeries and tortilla manufacturing 2.75259 - Other investment pools and funds 2.683121 - Beverage manufacturing 2.433273 - Cement and concrete product manufacturing 2.382361 - Residential building construction 2.35
Source: U.S. Census Bureau, County Business Patterns
Analysis made by the Puerto Rico Planning Board
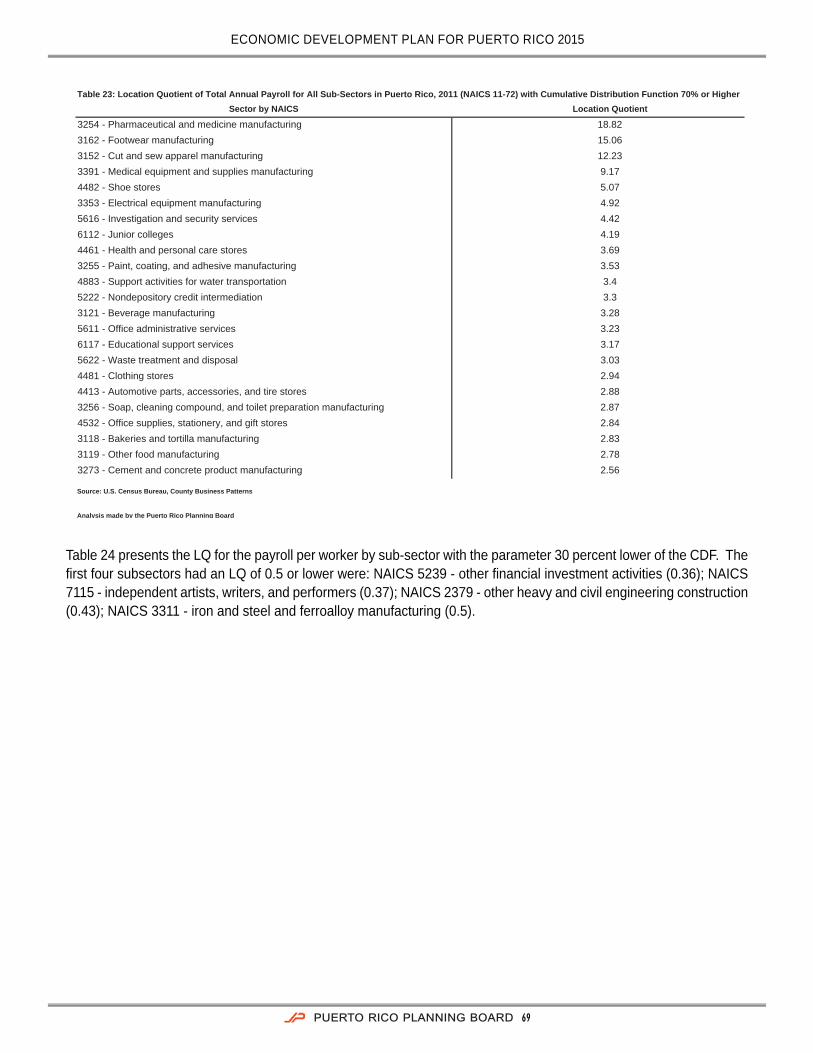
ECONOMIC DEVELOPMENT PLAN FOR PUERTO RICO 2015
69
Table 24 presents the LQ for the payroll per worker by sub-sector with the parameter 30 percent lower of the CDF. The fi rst four subsectors had an LQ of 0.5 or lower were: NAICS 5239 - other fi nancial investment activities (0.36); NAICS 7115 - independent artists, writers, and performers (0.37); NAICS 2379 - other heavy and civil engineering construction (0.43); NAICS 3311 - iron and steel and ferroalloy manufacturing (0.5).
Sector by NAICS Location Quotient
3254 - Pharmaceutical and medicine manufacturing 18.823162 - Footwear manufacturing 15.063152 - Cut and sew apparel manufacturing 12.233391 - Medical equipment and supplies manufacturing 9.174482 - Shoe stores 5.073353 - Electrical equipment manufacturing 4.925616 - Investigation and security services 4.426112 - Junior colleges 4.194461 - Health and personal care stores 3.693255 - Paint, coating, and adhesive manufacturing 3.534883 - Support activities for water transportation 3.45222 - Nondepository credit intermediation 3.33121 - Beverage manufacturing 3.285611 - Office administrative services 3.236117 - Educational support services 3.175622 - Waste treatment and disposal 3.034481 - Clothing stores 2.944413 - Automotive parts, accessories, and tire stores 2.883256 - Soap, cleaning compound, and toilet preparation manufacturing 2.874532 - Office supplies, stationery, and gift stores 2.843118 - Bakeries and tortilla manufacturing 2.833119 - Other food manufacturing 2.783273 - Cement and concrete product manufacturing 2.56
Source: U.S. Census Bureau, County Business Patterns
Analysis made by the Puerto Rico Planning Board
Table 23: Location Quotient of Total Annual Payroll for All Sub-Sectors in Puerto Rico, 2011 (NAICS 11-72) with Cumulative Distribution Function 70% or Higher

ECONOMIC DEVELOPMENT PLAN FOR PUERTO RICO 2015
70
Sector by NAICSLocationQuotient
5239 - Other financial investment activities 0.36
7115 - Independent artists, writers, and performers 0.37
2379 - Other heavy and civil engineering construction 0.43
3311 - Iron and steel mills and ferroalloy manufacturing 0.5
5191 - Other information services 0.55
6211 - Offices of physicians 0.57
2372 - Land subdivision 0.59
6212 - Offices of dentists 0.59
2373 - Highway, street, and bridge construction 0.6
5259 - Other investment pools and funds 0.6
2371 - Utility system construction 0.62
3345 - Navigational, measuring, electromedical, and control instruments manufacturing 0.63
5112 - Software publishers 0.63
5612 - Facilities support services 0.63
4236 - Electrical and electronic goods merchant wholesalers 0.65
4852 - Interurban and rural bus transportation 0.65
5122 - Sound recording industries 0.65
2362 - Nonresidential building construction 0.66
3335 - Metalworking machinery manufacturing 0.66
4243 - Apparel, piece goods, and notions merchant wholesalers 0.66
2389 - Other specialty trade contractors 0.67
3279 - Other nonmetallic mineral product manufacturing 0.68
5324 - Commercial and industrial machinery and equipment rental and leasing 0.69
3241 - Petroleum and coal products manufacturing 0.72
3321 - Forging and stamping 0.73
6215 - Medical and diagnostic laboratories 0.75
4245 - Farm product raw material merchant wholesalers 0.77
5615 - Travel arrangement and reservation services 0.77
2381 - Foundation, structure, and building exterior contractors 0.78
3363 - Motor vehicle parts manufacturing 0.78
4235 - Metal and mineral (except petroleum) merchant wholesalers 0.78
5331 - Lessors of nonfinancial intangible assets (except copyrighted works) 0.78
2383 - Building finishing contractors 0.79
7114 - Agents and managers for artists, athletes, entertainers, and other public figures 0.8
2361 - Residential building construction 0.82
3359 - Other electrical equipment and component manufacturing 0.82
4881 - Support activities for air transportation 0.82
3323 - Architectural and structural metals manufacturing 0.83
3329 - Other fabricated metal product manufacturing 0.83
3327 - Machine shops; turned product; and screw, nut, and bolt manufacturing 0.84
4239 - Miscellaneous durable goods merchant wholesalers 0.84
5629 - Remediation and other waste management services 0.84
7212 - RV (recreational vehicle) parks and recreational camps 0.84
4232 - Furniture and home furnishing merchant wholesalers 0.85
3162 - Footwear manufacturing 0.86
3371 - Household and institutional furniture and kitchen cabinet manufacturing 0.86
2382 - Building equipment contractors 0.88
4242 - Drugs and druggists' sundries merchant wholesalers 0.89
4841 - General freight trucking 0.9
Source: U.S. Census Bureau, County Business Patterns
Analysis made by the Puerto Rico Planning Board
Table 24: Location Quotient of Annual Payroll Per Employee for All Sub-Sectors in Puerto Rico, 2011 (NAICS 11-72) with Cumulative Distribution Function 30% or Lower

ECONOMIC DEVELOPMENT PLAN FOR PUERTO RICO 2015
71
Table 25 shows the LQ for the annual payroll per worker by sub-sector with the parameter at the top of 30 percent of the CDF. The fi rst 4 subsectors had a LQ greater than 1.9 and they were: NAICS 3151 – apparel knitting mills (4.24); NAICS 7113 – promoters of performing arts, sports, and similar events (2.10); NAICS 4533 – used merchandise stores (2.0); and, NAICS 6216 – home health care services (1.92).
Sector by NAICSLocation Quotient
3151 - Apparel knitting mills 4.24
7113 - Promoters of performing arts, sports, and similar events 2.1
4533 - Used merchandise stores 2
6216 - Home health care services 1.92
7213 - Rooming and boarding houses 1.9
4512 - Book, periodical, and music stores 1.86
4921 - Couriers and express delivery services 1.86
4884 - Support activities for road transportation 1.85
7139 - Other amusement and recreation industries 1.73
7222 - Limited-service eating places 1.73
4532 - Office supplies, stationery, and gift stores 1.72
4482 - Shoe stores 1.71
7111 - Performing arts companies 1.71
3119 - Other food manufacturing 1.66
6222 - Psychiatric and substance abuse hospitals 1.65
7211 - Traveler accommodation 1.57
4541 - Electronic shopping and mail-order houses 1.54
4529 - Other general merchandise stores 1.536232 - Residential mental retardation, mental health and substance abuse facilities 1.52
6244 - Child day care services 1.51
5323 - General rental centers 1.51
4511 - Sporting goods, hobby, and musical instrument stores 1.49
4431 - Electronics and appliance stores 1.49
5231 - Securities and commodity contracts intermediation and brokerage 1.49
4531 - Florists 1.47
5242 - Agencies, brokerages, and other insurance related activities 1.46
5111 - Newspaper, periodical, book, and directory publishers 1.46
7224 - Drinking places (alcoholic beverages) 1.44
6243 - Vocational rehabilitation services 1.43
6116 - Other schools and instruction 1.41
7221 - Full-service restaurants 1.41
3328 - Coating, engraving, heat treating, and allied activities 1.39
3111 - Animal food manufacturing 1.38
6231 - Nursing care facilities 1.38
3254 - Pharmaceutical and medicine manufacturing 1.37
4471 - Gasoline stations 1.37
7223 - Special food services 1.37
4481 - Clothing stores 1.35
3121 - Beverage manufacturing 1.35
7121 - Museums, historical sites, and similar institutions 1.34
3256 - Soap, cleaning compound, and toilet preparation manufacturing 1.34
4922 - Local messengers and local delivery 1.33
Source: U.S. Census Bureau, County Business Patterns
Analysis made by the Puerto Rico Planning Board
Table 25: Location Quotient of Annual Payroll Per Employee for Sub-Sectors with Cumulative Distribution Function 70% or Higher

ECONOMIC DEVELOPMENT PLAN FOR PUERTO RICO 2015
72
Table 26 illustrates the LQ for the number of establishments by sub-sector with the parameter at the top of 30 percent of the CDF. The fi rst 4 subsectors had an LQ of 4.7 or higher, they were: NAICS 5232 - securities and commodity exchanges (11.13); NAICS 6215 - medical and diagnostic laboratories (7.57); NAICS 4854 – school and employee bus transportation (5.36); NAICS 4852 - interurban and rural bus transportation (4.7).
Sector by NAICSLocation Quotient
5232 - Securities and commodity exchanges 11.13
6215 - Medical and diagnostic laboratories 7.57
4854 - School and employee bus transportation 5.36
4852 - Interurban and rural bus transportation 4.7
3254 - Pharmaceutical and medicine manufacturing 4.66
6112 - Junior colleges 4.36
3118 - Bakeries and tortilla manufacturing 4.17
3162 - Footwear manufacturing 3.57
3379 - Other furniture related product manufacturing 3.56
6113 - Colleges, universities, and professional schools 3.55
4482 - Shoe stores 3.24
6223 - Specialty (except psychiatric and substance abuse) hospitals 2.99
6111 - Elementary and secondary schools 2.79
3115 - Dairy product manufacturing 2.73
6219 - Other ambulatory health care services 2.72
4461 - Health and personal care stores 2.69
4413 - Automotive parts, accessories, and tire stores 2.65
6211 - Offices of physicians 2.63
4883 - Support activities for water transportation 2.56
3241 - Petroleum and coal products manufacturing 2.47
4242 - Drugs and druggists' sundries merchant wholesalers 2.34
4441 - Building material and supplies dealers 2.34
4481 - Clothing stores 2.31
3113 - Sugar and confectionery product manufacturing 2.3
5616 - Investigation and security services 2.23
6117 - Educational support services 2.17
3119 - Other food manufacturing 2.17
6221 - General medical and surgical hospitals 2.16
3273 - Cement and concrete product manufacturing 2.1
7131 - Amusement parks and arcades 2.08
3121 - Beverage manufacturing 2.07
3255 - Paint, coating, and adhesive manufacturing 2.06
3151 - Apparel knitting mills 2.06
6233 - Community care facilities for the elderly 2.02
4483 - Jewelry, luggage, and leather goods stores 1.99
3152 - Cut and sew apparel manufacturing 1.99
5222 - Nondepository credit intermediation 1.97
Source: U.S. Census Bureau, County Business Patterns
Analysis made by the Puerto Rico Planning Board
Table 26: Location Quotient of Number of Establishments for All Sub-Sectors in Puerto Rico, 2011 (NAICS 11-72) with Cumulative Distribution Function 70% or Higher

ECONOMIC DEVELOPMENT PLAN FOR PUERTO RICO 2015
73
References
Collins, SM, Bostworth, BP & Soto-Class, MA 2006, The Economy of Puerto Rico: Restoring Growth, Center for the New Economy & The Brookings Institution, San Juan, PR
Comisión Económica para América Latina y el Caribe – CEPAL 2004, Globalización y Desarrollo: Desafíos de Puerto Rico Frente al Siglo XXI, recuperado el 20 de agosto de 2014, http://www.cepal.org/publicaciones/xml/3/20443/l646-1.pdf
Comisión sobre Futuro Económico de Puerto Rico 2003, Hacia la Economía Posible, recuperado el 20 de agosto de 2014, http://www.camarapr.org/ponenciasFigueroa/PP-Hacia-la-Economia-Posible.pdf
Comité Interagencial de la Estrategia de Puerto Rico 1975, El Desarrollo Económico de Puerto Rico: Una Estrategia para la Próxima Década, recuperado el 20 de agosto de 2014, http://gis.jp.pr.gov/Externo_Econ/Programa%20de%20Planifi caci%C3%B3n%20Econ%C3%B3mica%20y%20Social/1975.11-Una_estrategia_para_la_proxima_decada_(Nov-1975).pdf
Comité para el Estudio de las Finanzas de Puerto Rico 1976, Informe al Gobernador del Comité para el Estudio de las Finanzas de Puerto Rico, recuperado el 20 de agosto de 2014, http://gis.jp.pr.gov/Externo_Econ/Programa%20de%20Planifi caci%C3%B3n%20Econ%C3%B3mica%20y%20Social/1975.12-Informe%20al%20Gobernador%20del%20Comit%C3%A9%20para%20el%20Estudio%20de%20las%20Finanzas%20de%20Puerto%20Rico%20(Informe%20Tobin,%201976).pdf
Comité Timón de Puerto Rico 2025, 2004, Puerto Rico 2025: Una Nueva Visión para el Futuro de Puerto Rico, recuperado el 20 de agosto de 2014, http://gis.jp.pr.gov/Externo_Econ/Programa%20de%20Planifi caci%C3%B3n%20Econ%C3%B3mica%20y%20Social/2004.03-PR_2025_Espanol_(Mar-2004).pdf
Consejo de Productividad Económica – Ofi cina del Gobernador 1994, Nuevo Modelo de Desarrollo Económico, recuperado el 20 de agosto de 2014, http://gis.jp.pr.gov/Externo_Econ/Programa%20de%20Planifi caci%C3%B3n%20Econ%C3%B3mica%20y%20Social/1994.02-Nuevo_Modelo_de_Desarrollo_Economico_(Feb-1994).pdf
Departamento de Desarrollo Económico y Comercio 2013, Un Nuevo Puerto Rico: Con Mejores Oportunidades de Negocio, recuperado el 20 de agosto de 2014, http://www.jp.gobierno.pr/
Estado Libre Asociado de Puerto Rico 2006, Plan de Desarrollo Económico y Transformación de Gobierno para Puerto Rico, recuperado el 20 de agosto de 2014, http://www.jp.gobierno.pr/Portal_JP/LinkClick.aspx?link=http%3a%2f%2fgis.jp.pr.gov%2fExterno_Econ%2fPrograma+de+Planifi caci%C3%B3n+Econ%C3%B3mica+y+Social%2f2006.10-Plan_de_Desarrollo_Economico_y_Transformacion_de_Gobierno_para_Puerto_Rico_(Oct-2006).pdf&tabid=313&mid=988
Federal Reserve Bank of New York 2012, Report on the Competitiveness of Puerto Rico’s Economy, recuperado el 20 de agosto de 2014, http://www.jp.gobierno.pr/Portal_JP/LinkClick.aspx?link=http%3a%2f%2fgis.jp.pr.gov%2fExterno_Econ%2fPrograma+de+Planifi caci%C3%B3n+Econ%C3%B3mica+y+Social%2f2012.06-Report_on_the_Competitiveness_of_Puerto+Rico%27s_Economy_(Jun-2012).pdf&tabid=313&mid=988
Federal Reserve Bank of New York 2014, An Update on the Competitiveness of Puerto Rico’s Economy, recuperado el 20 de agosto de 2014, http://www.newyorkfed.org/outreach-and-education/puerto-rico/2014/Puerto-Rico-Report-2014.pdf

ECONOMIC DEVELOPMENT PLAN FOR PUERTO RICO 2015
74
Gobierno de Puerto Rico 2009, Modelo Estratégico para una Nueva Economía: Crecimiento, Competitividad, Empleos, recuperado el 20 de agosto de 2014, http://gis.jp.pr.gov/Externo_Econ/Programa%20de%20Planifi caci%C3%B3n%20Econ%C3%B3mica%20y%20Social/2009.09-Modelo_Estrategico_para_una_Nueva_Economia_(Sep-2009).pdf
New Economic Strategies 2005, The Puerto Rico Life Sciences Road Map, recuperado el 20 de Agosto de 2014, http://www.induniv.org/docs/Puerto%20Rico%20Life%20Science%20Road%20Map%20-%20INDUNIV.pdf
United States Department of Commerce 1979, Economic Study of Puerto Rico, Vol. 1, recuperado el 20 de agosto de 2014, http://gis.jp.pr.gov/Externo_Econ/Programa%20de%20Planifi caci%C3%B3n%20Econ%C3%B3mica%20y%20Social/1979.12-US_Department_of_Commerce_Economy_Study_of_Puerto_Rico-vol_1_(Dic-1979).pdf
United States Department of Commerce 1979, Economic Study of Puerto Rico, Vol. 2-A, recuperado el 20 de agosto de 2014, http://gis.jp.pr.gov/Externo_Econ/Programa%20de%20Planifi caci%C3%B3n%20Econ%C3%B3mica%20y%20Social/1979.12-US_Department_of_Commerce_Economy_Study_of_Puerto_Rico-vol_2_a_(Dic-1979).pdf
United States Department of Commerce 1979, Economic Study of Puerto Rico, Vol. 2-B, recuperado el 20 de agosto de 2014, http://gis.jp.pr.gov/Externo_Econ/Programa%20de%20Planifi caci%C3%B3n%20Econ%C3%B3mica%20y%20Social/1979.12-US_Department_of_Commerce_Economy_Study_of_Puerto_Rico-vol_2_b_(Dic-1979).pdf