changing transportation needs in the developing and ... · (the presentation is based on...
TRANSCRIPT

Changing Transportation Needs in the
Developing and Industrialized World:
Similar Problems, Similar Solutions?
Andreas Schafer, David H.Marks
MIT
ALLIANCE FOR GLOBAL SUSTAINABILITY
ANNUAL CONFERENCE, MARCH 21-23
INCAE, SAN JOSE, COSTA RICA

WORKSHOP OUTLINE
• Urban Mobility: trends, challenges, and
policy-lessons learned
• Alternative transportation futures
• The role of institutions and infra-
structures in shaping transportation
futures

ENVIRONMENTAL IMPACTS CONSIDERED
• Suburbanization and land-use
• Congestion
• Noise
• Pollution
• Accidents
• Energy use
• Anthropogenic greenhouse effect

SUBURBANIZATION AND LAND-USE
“Our property seems to me to be the most beautiful in the world: It is so close to Babylon that we enjoy all the advantages of the city, and yet when we come home we are away from all the noise and the dust” (539 B.C.)
Source: Jackson (1985)
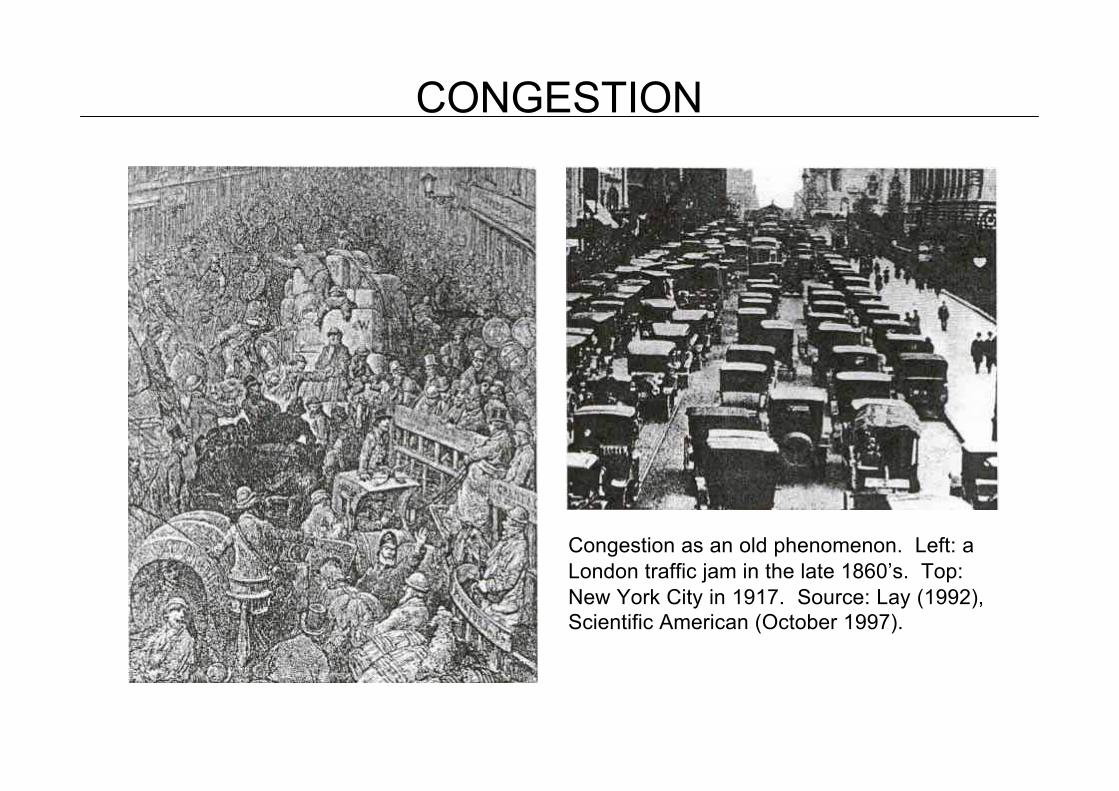
CONGESTION
Congestion as an old phenomenon. Left: a London traffic jam in the late 1860’s. Top: New York City in 1917. Source: Lay (1992), Scientific American (October 1997).

ACCIDENTS
Traffic Fatalities per 100 million vehicle-km: U.S.
0
2
4
6
8
10
12
14
16
18
20
1880 1900 1920 1940 1960 1980 2000 2020
Year
Fata
litie
s
Horses
Automobiles
Source: Lay (1992), U.S. Department of Commerce (2000)

ANTHROPOGENIC GREENHOUSE EFFECT
Source: IPCC (1996): Climate Change 1995, The Science of Climate Change
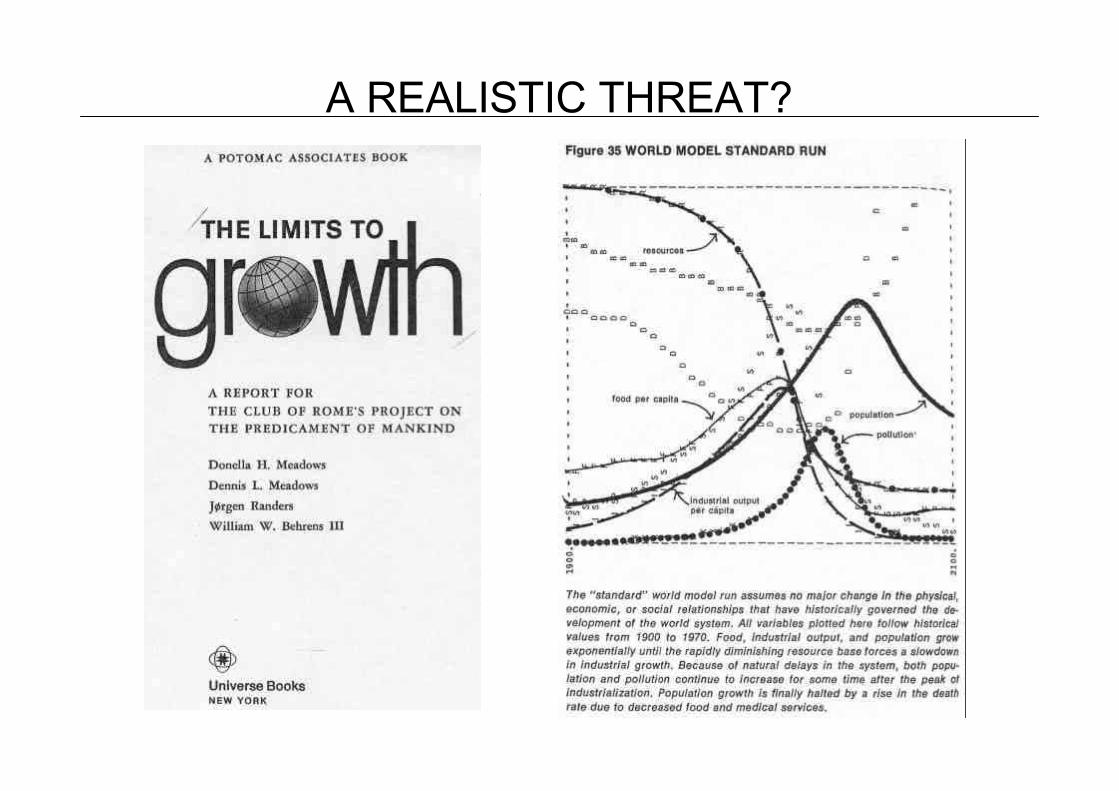
A REALISTIC THREAT?

SESSION 1
Urban Mobility: trends, challenges, and policy-lessons learned

Changing Transportation Needs in the US 1
• Trends in metro areas: population, income, motorization, mode share (trips and vkt)
• Problems: congestion (TTI data), air pollution (EPA data), accidents
• Infrastructure (DOT data)
• Current Realities from a few cities: Houston, Atlanta, New York City, Portland
Chris Zegras (MIT)

• Major debates:
– Smart Growth vs. Sprawl
– Light Rail as "Silver Bullet"
– Congestion pricing
– Bus innovations: LA
– Car Share
– ITS
– Role and Future of Vehicle Technologies
Changing Transportation Needs in the US 2

Bogotá - Colombia
Angelica Castro
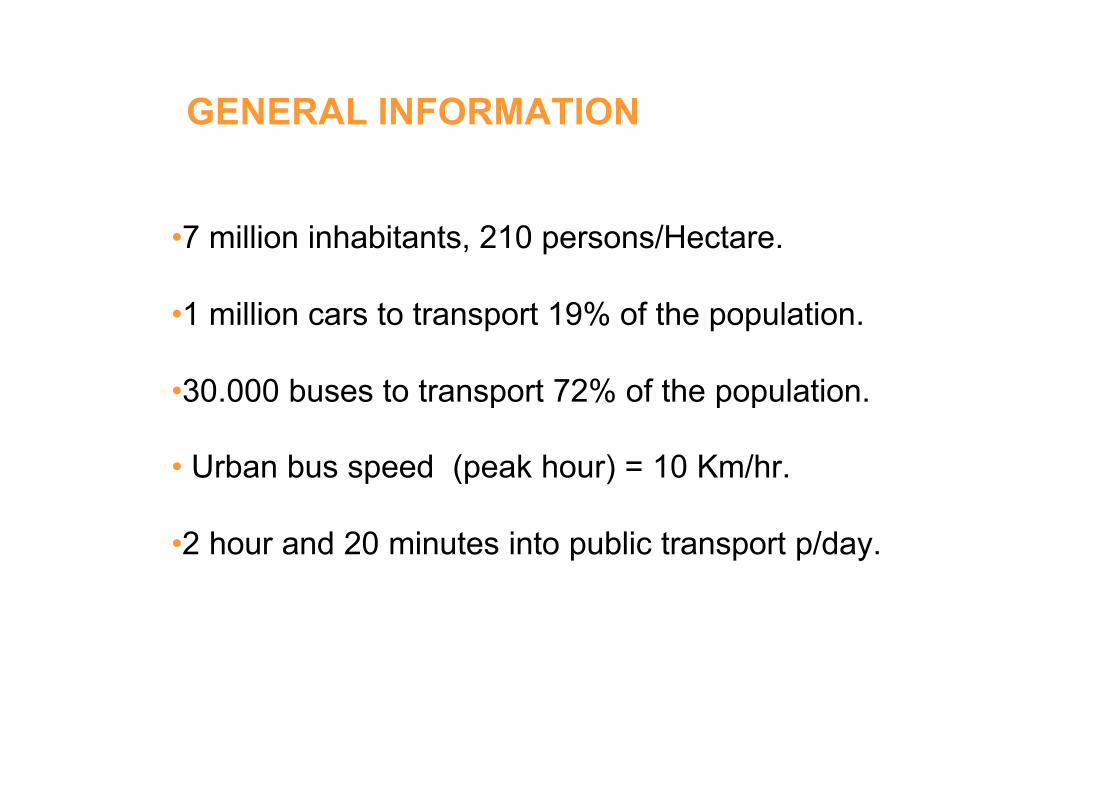
GENERAL INFORMATION
•7 million inhabitants, 210 persons/Hectare.
•1 million cars to transport 19% of the population.
•30.000 buses to transport 72% of the population.
• Urban bus speed (peak hour) = 10 Km/hr.
•2 hour and 20 minutes into public transport p/day.

STRATEGIES
•PUBLIC SPACE RECUPERATION
•BICYCLE
•DISCOURAGE PRIVATE CAR USE
•MASS TRANSPORTATION

PUBLIC SPACE PUBLIC SPACE
RECUPERATIONRECUPERATION• 285.500 mt2 constructed in walkways,
green space, road dividers, sidewalks.
• 3.149 neighborhood parks
• 323 pocket parks
• 11 metropolitan parks

BICYCLES
• BIKEWAYS . . . . . . . . . . . . . .
•• BICYCLE DAYBICYCLE DAY . . . . . . . . . . . .
• BIKE-PARKINGS. . . . . . . . . . . . .
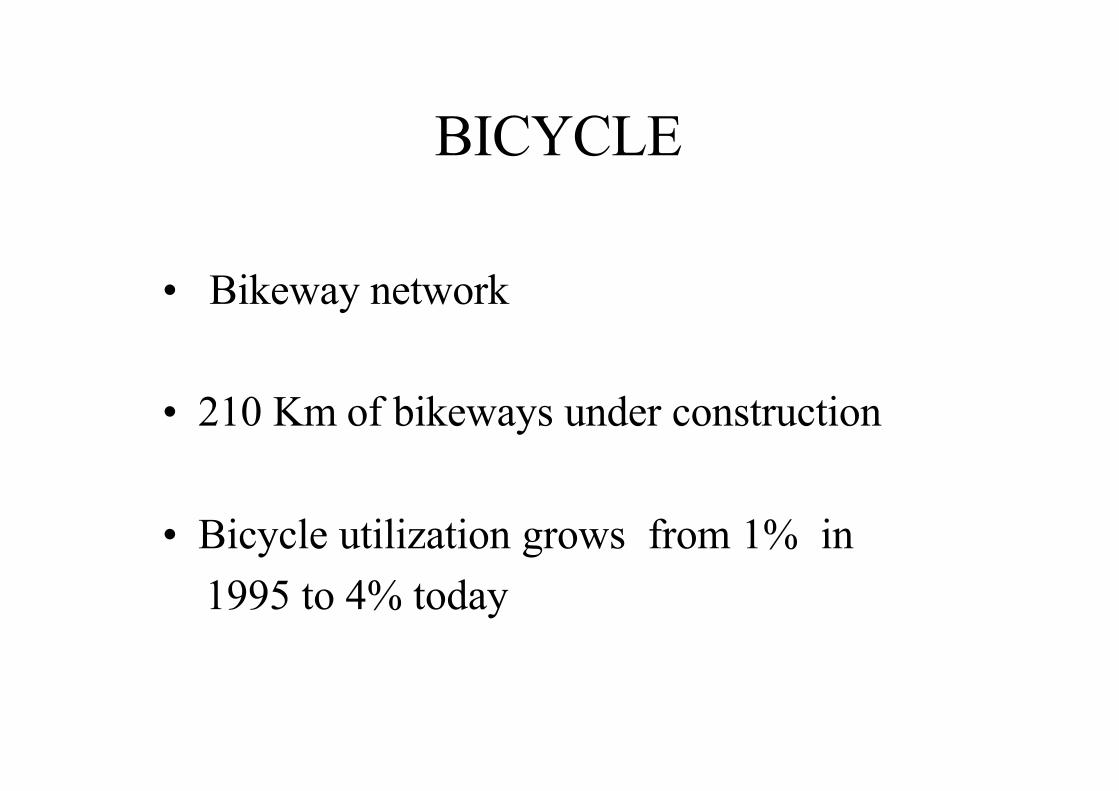
BICYCLE
• Bikeway network
• 210 Km of bikeways under construction
• Bicycle utilization grows from 1% in
1995 to 4% today

DISCOURAGE PRIVATE CAR USEDISCOURAGE PRIVATE CAR USE
• RESTRICTION DURING PEAK HOURS
• FUEL SURCHARGE TAX
• CAR-FREE WEEKDAYS
• PARKING SPACES

•18.000 direct jobs during the construction.
•3.000 direct jobs in operation.
•Just 72 jobs are from the government.
TRANSMILENIOTRANSMILENIO

TRANSMILENIOTRANSMILENIO
•Ticket $900 (US $ 0.40).
•148.000.000 passengers transportated.
•650.000 passengers per day.
•63.500 passengers during peak hours.
•457 troncal buses and 198 feeder buses.
•38 kilometers operating.
•59 stations and 3 under construction.
•26 Km/h

BOGOTA 2016, TOTAL SYSTEM

BOGOTA - COLOMBIA

Megacities in Asia as “Transit-Metropolises” ?
Contents
1) Megacities in Asia
2) Problems and challenges to be “Transit-Metropolises”
3) Difficulties to be overcome and things to be done
Prof. Dr. Hitoshi IEDA
TRIP Transport Research and Infrastructure Planning Lab,
Dept.of Civil Eng., University of Tokyo

1) Megacities in Asia
- Large part of world population.
- Many of world megacities
- Rapid economic growth in magacities
[Basic problems]
- Immense and Rapid Demographic Concentration
- Poverty or Large Disparity in Wealth
- Dense Habitation and Inadequate Living Conditions
- (Potentially) Terrible Traffic Problems

2) Problems and challenges to be “Transit-Metropolises” -1
[Points in transport in developing countries in Asia]
- Transit-based cites and motorcycle-based cites
- Basis of para-transit service supply
- Imbalance in transport demand in passenger and freight

[Transit development in megacities]
• Japan and NIES. Already transit-metropolises mostly
• Manila and Bangkok. Light rail network development
• Jakarta. Modernization of existing rail system
• China. Bus or rail?
• India. Too poor to develop transit systems of good quality
3) Difficulties to be overcome and things to be done
[Difficulties]
- Handicaps in price and in competitors to develop
transit systems
- Weak institutional systems in urban development
- Flexible and practical approach/ Often too weak
enforcement
- Strong market competition/ Often insufficient
coordination

[Are large cites in developing countries “sustainable”?]
“Sustainable Cities”
- High density in cores
- Use of public transit

Prof. Bjorn Malbert (Chalmers)
Mobility and Accessibility:
A brief account on research approaches at Chalmers
Presented at the AGS annual meeting in Costa Rica, March 2002, at the workshop “The Future of
Mobility – Transportation” by Professor Björn Malbert, Chalmers Environmental Initiative,
Chalmers Architecture.
(the presentation is based on information from Anders Hagson, unit director at the Dept. of City and
Mobility, Chalmers Architecture)
Sweden is a large country with very few inhabitants compared to other parts of Europe. Accordingly, our
problems and research responses might not properly represent the European situation. However, in ourlargest cities traffic problems occur and are on the agenda of urban planning practice as well as research.
The research at the department of City and Mobility, Chalmers Architecture, lead by Anders Hagson started
in late 1980s. It concerns different aspects on the relations between mobility systems and urban land-usedevelopment and focus on GIS-based tools for analysis and simulation to enhance policy and decision
making of the different actors involved. In other words: "What is the present situation? What could be done
if certain policy should be implemented? How can such measures be evaluated before and after action?"
Mobility and Accessibility 1
Points of departure:
Social problems:Congestion, air pollution, noise problems etc. in cities, especially in the larger cities along the national
motorway systems.
Proposed and partly implemented policy:Investments in by pass solutions in order to separate local and distant traffic, following the strong Swedish
tradition of traffic separation.
Research questions:What impacts will these changes in the transport systems have on the overall urban land-use development
and how can such changes be simulated and analysed in beforehand.
This led to the development of GIS-based applications for analysis with a key-focus on accessibility that
later are used and developed for several purposes, for instance the impact of external shopping centresconcerning traffic generation and environmental emissions.
Conclusions:
Changes in the urban transport systems result in changed and not always expected land-use patterns that in
turn generate new transportation behaviour and demands followed by new, or rather moved, congestion and
environmental problems. About 30% of all new urban development in Sweden over the last decades is
located along the newly built by pass roads. Thus, they have become "local streets" with mixed local and
distant traffic in an urban structure that is very difficult to support with efficient public transportation
systems.
Mobility and Accessibility 2

Current research in brief:
1. Traffic Calming following the ZERO-vision policy for preventing serious accidents.As a result of the above-described measures, cities got many roads designed for faster by pass traffic that
became local streets with need for a slower traffic. The aim for the research is to identify street
characteristics that affect car speed. Except for speed studies, a traffic environmental simulator will be usedfor studies of how different physical elements in the traffic environment affect car speed and drivers’
behaviour.
2. Accessibility for different groups of people using different modes of transportation.All types of geographical areas can be studied with population information on real estate coordinates.
• Direct distances between the homes of urban residents and the nearest service unit (post office, schools,
food stores etc.) have been analysed for the 45 largest towns in Sweden 1980 and 1995. Comprehensive
accessibility analysis
• Distances (travel time) between any origin/destination in actual or planned street, public transport, foth
path and bike lane networks with the respect to traffic safety, security and comfort for children, elderly and
women. Detailed accessibility analysis
Mobility and Accessibility 3
3. City Logistics for the efficient localisation of cargo terminals and routes in the urban
region.The idea is how to describe, understand and handle flows of people and goods in urban areas.
• Analysis of the consequences of changed retail structure concerning the transport demands of the consumers aswell as the providers.
• Strategic plan for improving the efficiency of flows of goods by locating terminals and identifyinginfrastructure improvements.
• Development of solutions for a more efficient and environmentally friendly city distribution.
4. Rapid Bus Transit - Subway on the ground, a flexible and step by step approach for
the development of efficient urban public transportation systems.There is a need for practical alternatives to expensive rail solutions as congested streets and poor public transporthave decreased the quality of the environment in urban areas around the world. Together with Volvo Mobility
Systems and Volvo do Brazil the department work on the improvement of the “Curitiba system” in four mainareas of development:
• Design of vehicles to provide visually appealing and customer oriented high-speed and high capacity service.
• Design of infrastructure, stations and stops to increase the speed, reduce the delays from boarding, crossings
and congestion.
• Design of inter-modality and transit enhancing services.
• Development of principles for integration between land-use planning, transportation planning and traffic
management.
Mobility and Accessibility 4
SESSION 2
Alternative transportation futures

Carfree City 1
The Carfree City as a Critical Building Block for Equitable, Sustainable Societies
J.H. Crawford
AGS Conference
San José, Costa Rica
21 March 2002

Abstract
• Rapid urbanization will continue, especially in developing nations.
• Resource and pollution constraints may limit increasing motorization in cities.
• The adverse social effects of intensive motoring are a further brake on continuing motorization.
• Billions of city dwellers need a better life, but continuing motorization is a poor means to achieve this end, even if technical innovation offers clean cars and sustainable energy.
Carfree City 2

• The carfree city is the logical extension of urban planning approaches that reduce the intrusiveness of cars. Carfree cities, based on rail transport of passengers and freight, provide greater benefits, and at nearly irreducible economic and environmental costs.
• Evidence suggests that many city dwellers in rich nations are seeking car-reduced living environments as a way to improve their lives. At least some of these people are ready for carfree neighborhoods.
• The carfree city offers developing nations a sustainable means of greatly improving both the mobility and the quality of life of their citizens.
Carfree City 3

Carfree City 4
Toward Global Mobility
Andreas Schafer
MIT
ALLIANCE FOR GLOBAL SUSTAINABILITY
ANNUAL CONFERENCE, MARCH 21-23
INCAE, SAN JOSE, COSTA RICA

TRAVEL BUDGETS AND IMPLICATIONS
• On high aggregation levels, humans spend a
fixed share of both money and time on
transportation on average
• As incomes rise, so does the demand for travel
• Traveling greater distances within the same
amount of time requires shifts toward faster
modes
– Urban areas: from walking and public modes
toward automobiles
– Intercity travel: from automobiles toward high-speed
rail and aircraft

TRAVEL TIME BUDGET: GLOBAL DATA
0.0
0.5
1.0
1.5
2.0
2.5
3.0
3.5
4.0
4.5
5.0
0 5000 10000 15000 20000
GDP/cap, US$(1985)
Tra
vel T
ime B
udegt, h
/cap/d
African Villages in:I Tanzania, 1986II Ghana, 1988
City Surveys: 1 Tianjin (China), 1993 2 Kazanlik (Bulgaria), 1965/66 3 Lima-Callao (Peru), 1965/66 4 Pskov (Former USSR), 1965/66 5 Maribor (Former Yugoslavia), 1965/66 6 Kragujevac (F. Yugoslavia), 1965/66 7 Torun (Poland), 1965/66 8 Gyoer (Hungary), 1965/66 9 Olomouc (Former CSFR), 1965/6610 Hoyerswerde (Former GDR), 1965/6611 Sao Paulo (Brazil), 198712 Sao Paulo (Brazil), 197713 Warsaw (Poland), 199314 6 Cities (France), 1965/6615 Osnabruck (Germany), 1965/6616 44 Cities (USA), 1965/6617 Jackson (USA), 1965/6618 Paris (France), 1976
I II
19 Paris (France), 198320 Paris (France), 199121 Sendai (Japan), 197222 Sapporo (Japan), 197223 Kanazawa (Japan), 197424 Kagoshima (Japan), 197425 Kumamoto (Japan), 197326 Hamamatsu (Japan), 197527 Fukui (Japan), 197728 Niigata (Japan), 197829 Hiroshima (Japan), 197830 Osaka (Japan), 198031 Tokyo (Japan), 198032 Osaka (Japan), 198533 Tokyo (Japan), 198534 Cities No. 21-29 in 198735 Tokyo (Japan), 199036 Osaka (Japan), 1990
National Travel Surveys:A Belgium, 1965/66B Austria, 1983C Great Britain, 1985/86D Germany, 1976E Netherlands, 1979F Great Britain, 1989/91G Finland, 1986H Netherlands, 1987I France, 1984J Germany, 1982K Netherlands, 1989L USA, 1990M Germany, 1989N Switzerland, 1984O Switzerland, 1989P Australia, 1986Q Singapore, 1991R Norway, 1985S Norway, 1992T Japan, 1987
2
1
3 4
57
8
910 14 15
161712
11
136
18 19 20
22 23
24
25
26 2728
2930
31
3233
35
36A
34
B
C
D
E F
GH
I
J KL
M
N
OP
Q
RS
T21
Source: Schafer and Victor (2000)

TRAVEL MONEY BUDGET: 16 COUNTRIES
Source: Schafer and Victor (2000)
0
5
10
15
20
25
30
35
40
45
50
0 5000 10000 15000 20000
GDP/cap, US$(1985)
Tra
vel M
oney B
udget, %
Thailand
TunisiaSri Lanka
Belgium
Denmark
France
FRG
Greece
Ireland
Italy
Japan
NL
Portugal
Spain
UK
USA
0
1
2
3
4
5
6
0 5 10 15 20 25 30 35 40 45 50
Travel Money Expenditures, % total Expenditures
Share
of
House
hold
s, %
0
10
20
30
40
50
60
70
80
90
100
Cum
ula
tive S
hare
of H
ousehold
s, %

BUDGET IMPLICATIONS: NATIONAL LEVEL
0
1
2
3
4
5
0 10 20 30 40 50 60 70
Per Capita Traffic Volume, pkm/cap/d
Tri
p R
ate
, T
rip
s/c
ap
/d
Walk
Bike
Public
Auto
1 Delhi Suburbs (1978-80) 2 U.K. (1975/76) 3 U.K. (1985/86) 4 U.K. (1989/91) 5 U.K. (1995/97) 6 Germany (1976) 7 Germany (1982) 8 Germany (1989) 9 Switzerland (1984)10 Switzerland (1989)11 Switzerland (1994)12 Norway (1985)13 Norway (1992)
14 Netherlands (1985)15 Netherlands (1990)16 Netherlands (1995)17 Australia (1985/86)18 U.S. (1977)19 U.S. (1983)20 U.S. (1990)21 U.S. (1995)
1
2
3
86
4 5
9 710,16
12
13
17
18
1920
1514
21
Source: Schafer (2000)

BUDGET IMPLICATIONS: WORLD MOBILITY(Data Points: 1960 - 1990; Curves: 1960 - 2050)
100
1000
10000
100000
1000000
100 1000 10000 100000 1000000
GDP/cap, US$(1985)
Pe
r C
ap
ita
Tra
ffic
Vo
lum
e,
pkm
North AmericaWestern EuropePacific OECD
Latin America
Eastern EuropeFormer Soviet Union
Middle East & North AfricaSub-Saharan Africa
South AsiaOther Pacific Asia
Target Point Industrialized Regions
Reforming Regions
Developing Regions
Centrally Planned Asia
Source: Schafer and Victor (2000); economic growth rates based on IPCC IS92a/e scenario

MODAL SHARES: EUROPE
0
10
20
30
40
50
60
70
80
90
100
Mo
da
l S
ha
re (
pkm
), %
Automobiles
Buses
Railways
High-Speed Modes EEU
WEU
100 1000 10000 100000
Per Capita Traffic Volume, pkm
(Data Points: 1960 - 1990; Curves: 1960 - 2050)
Source: Schafer and Victor (2000)
A SCAN OF ALTERNATIVE MOBILITY FUTURES
A SCAN OF ALTERNATIVE MOBILITY FUTURES
Germán C. Lleras E.MCP/MST CandidateMassachusetts Institute of Technology
Annual ConferenceMarch 21 - 23, 2002San José Costa Rica

Perception of mobility futures
Imaginary Visions
Projections and Forecasts
Descriptive Scenarios
1
3
2

Imaginary Visions

Salient Characteristics of Projections and Forecasts
Stock of
Automobiles (Mill)Forecasts and Real FiguresAuto Ownership in Germany
Until 1991 data for Western Germany only
Source: Mobility and Climate (1994),German Parliament
� Demand for mobility willincrease worldwide
� Shift from slower to fastermodes
�Relevance of the automobile(has been underestimated in the past!)

Descriptive Scenarios
Policy Driven Scenarios (APTA --------------- Car-Free Cities)
� Improvements in transit and slow-modes
� Declining auto-dependence at the urban level
� Urban Design encouraging higher densities
Technology Driven (Shell)
� Continuing growth of automobile use
� Commercial hybrid and fuel-cell vehicles
� Economic growth in some developing countries� More stringent environmental regulation and a more demanding global community� Urbanization / Suburbanization trend continues� Access and availability of oil is limited

Questions - Conclusions
� What will be the role of the private automobile in
different parts of the world?
� What will be the role of transit and slow modes?
� What will be the role of technology as a tool to reduce
the undesired effects of mobility, pollution (efficient
fuels), congestion (ITS), accidents (safety devices)?
� What could be the unintended effects of following a
technology driven solution or following radical changes
in human behavior?
� Are developing countries just following the path of the developed
world, or is there room for leapfrogging and therefore to take
advantage of technologies and policies that would help them save
valuable resources?

SESSION 3
The role of institutions and infrastructures in shaping transportation futures

Institutional Capacities 1
I. The Problem of Long Range Planning for Urban Mobility
• Typical lack of interest in the long range because it doesn't identify individual stakes in that future.
• The problem of attachment to high cost solutions such as subways,beyond the means of most cities (especially in Central America).
• The problem of metropolitan fragmentation into different political subunits (comunas, distritos, or whatever)
Prof. Ralph Gakenheimer (MIT)
• Therefore the need is for:
– Government commitment to the importance of preparations for future serious problems
– Participatory incrementalism--that engages stakeholders in the long range by initially relating them to near term projects.
– Budgetary realism
– Metroplitanization of government (examples such as the frictions between the Distrito Federal and the State of Mexico, etc.)
Institutional Capacities 2
III. Particular issues
• The need for anticipation (e.g. the sudden appearance of massive private parking garages when their rental prospects become financially attractive, without expansion of street capacity)
• The need for central access to protect the develop-ment of the city center (e.g. the apparent roles of Latin American metros in keeping the cities that have metros more viable than others. Potential roles for high capacity bus transport (on dedicated lanes, etc.)
• The need for entrepreneurial effort (Possibilities for car sharing to reduce potential auto ownership--our case that examines the numbers for Santiago, Chile)
Institutional Capacities 3

A Study of Connectivity in Latin America
Prof. Alberto Trejos (INCAE)