changing pattern of population growth and …pu.edu.pk/images/journal/csas/pdf/v_26_no_2_9dr. asad...
TRANSCRIPT

367
South Asian Studies A Research Journal of South Asian Studies Vol. 26, No. 2, July-December 2011, pp.367-391 Changing Pattern of Population Growth and Structure in Punjab, Pakistan Asad Ali Khan
University of the Bahawalpur, Bahawalpur ABSTRACT
With regard to the size of population Punjab is the Pakistan’s largest region. Its share in the size of population and its role in the growth of overall population of Pakistan and South Asia is highly significant. Since several past decades its population is growing rapidly. The impact of unprecedented population growth is manifold. Besides putting direct stress on food and other resources, it is creating numerous socio-economic and administrative problems. Rapid increment in the number of individuals is causing change in population structure also which is indirectly giving birth to unmanageable socio-economic and other problems. Specifically acceleration in the process of urbanization, changing pattern of the spatial distribution of population, age and sex structure, marital status composition and socio-cultural setup are the crucial aspects that call for special attention of the planners and policy makers. The study in point looks into all these aspects of the population of Punjab and based on careful examination suggests that all these aspects have considerable say in shaping idiosyncratic demographic profile of the region. Therefore, they must be monitored appropriately and incessantly and should be given proper weightage in planning policies to achieve the state of balance between population and resources. KEY WORDS: Punjab, Changing pattern, Population growth, Spatial distribution,
Population structure, Marital status. Introduction Containing well above half of the country’s population Punjab is the biggest province of Pakistan. Its share in the size of population and its role in the growth of population of Pakistan and South Asia cannot be overlooked. Although population growth rate indicates decreasing trend yet it is significantly high and its impact is manifold. Apart from putting direct pressure on resources, it is creating several socio-economic and managerial problems of serious nature. Speedy augmentation in the number of individuals is causing change in population structure which is indirectly giving birth to numerous unmanageable troubles. Particularly acceleration in the speed of urbanization, and change in the spatial

South Asian Studies 26 (2)
368
distribution of population, age and sex structure, marital status composition and socio-cultural structure are the aspects that need special attention of the planners and policy makers. Proper knowledge and input of these elements in population planning policies can guarantee their success.
The average annual percent increase in population, resulting from a surplus of births over deaths and the balance of immigrants and emigrants is known as population growth. The growth rate is a factor in determining how great a burden would be imposed on the region by the changing needs of its people for infrastructure (e.g., schools, hospitals, housing, roads), resources (e.g., food, water, electricity), and jobs. Rapid population growth can be seen as threatening for the resources from several perspectives. Acceleration in the process of urbanization due to natural growth and immigration from rural areas and managing resulting expansion of cities is becoming big problem. It is also causing change in the spatial distribution, age and sex structure, marital status composition, and socio-cultural structure of the population. Higher proportion of young population and resulting high dependency ratio compared to developed countries as well as to several other parts of South Asia is another important concern of the region.i Data based comprehensive analysis of these dynamic aspects of the population of Punjab is the main objective of current study. Foremost source of data is population census of Pakistan. To note changes in population growth trend and population structure, data have been computed from census reports of different years. However, comparison is mainly based upon last two censuses. Population Growth The size of population is highly dynamic and keeps on changing with the passage of time. Positive change in population size over time is termed as population growth. In some areas like Punjab, population is exploding while in others like several European countries it is imploding. For the purpose of measurement, change in population size can be quantified as the change in number of individuals in a population per unit time. The term population growth is expressed with the help of population growth rate. It may refer to the growth of world population or of a country like Pakistan or of a specific region like Punjab. In demographic usage, population growth rate (PGR) means the fractional rate at which the individuals in a population are added. Normally PGR refers to the rate of change in a population over a specific period of time, often expressed as a percentage of the number of individuals in the population at the beginning of that period. This can be expressed as;
PGR = Population at the end of period - Population at the beginning of periodPopulation at the beginning of period
or

Asad Ali Khan Changing Pattern of
369
For example population growth rate of India during the year 2008-09 was; PGR (India) = 1,171.0 - 1,149.3 x 100
1,149.3 = 1.9
The above formula can be expanded to; Growth rate = crude birth rate - crude death rate + net immigration rate
or ∆P/P = (B/P) - (D/P) + (I/P) - (E/P)
Where P is the total population, B is the number of births, D is the number of deaths, I is the number of immigrants, and E is the number of emigrants.
This formula allows for the identification of the source of population growth, whether due to natural increase or an increase in the net migration rate. Natural increase is an increase in the native-born population, stemming from either a higher birth rate and a lower death rate, or a combination of the two. Net migration rate is the difference between the number of immigrants and the number of emigrants.
The most common way to express population growth is as a ratio, not as a rate. The change in population over a unit time period is expressed as a percentage of the population at the beginning of the time period. That is:
Growth ratio = Growth rate x 100% A positive growth ratio indicates population increment, while a negative ratio
indicates population decline. A growth ratio of zero indicates the same number of people at the two times where net difference between births, deaths and migration is zero. However, a growth rate may be zero even when there are significant changes in the birth rates, death rates, immigration rates, and age distribution between the two times.
Punjab is inhabited by a very complex and many-faceted group of people that has been subjected to continuous changes more due to vital rates and less due to migration (Khan, 2009). Although the rate at which population of the region is growing has been steadily declining since peaking in 1960s at over 3% per annum, the population has grown rapidly (table 1). Since the beginning of the second half of 20th century, sustained high fertility resulted in momentous growth and rise in the size of its population. In terms of population number, the province is manifested with a large size even larger than most countries of the world as well as of the South Asia. It shares about 56 of the population of Pakistan. According to 2005 estimates size of Bangladesh’s population is just 1.7 times larger than the population size of Punjab. It is almost 3.34 times larger than Nepal, 4.3 times larger than Sri Lanka, 84.8 times larger than Bhutan and 283 times larger than Maldives (World Population Data Sheet, 2005; NIPS, 2005). The account of population growth tells that excellent arable lands due to high agricultural yields have been the fastest growing region of Pakistan as well as of South Asia. Growth of population in Punjab started to gear up in 1920s onwards with the extension of large-scale irrigation facilities that attracted the people from other areas also. Over
South Asian Studies 26 (2)
370
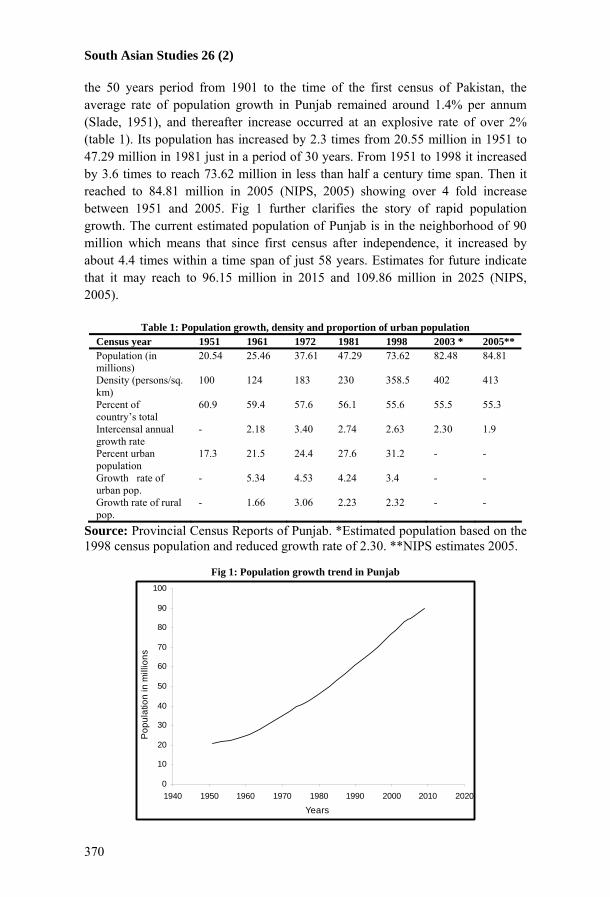
the 50 years period from 1901 to the time of the first census of Pakistan, the average rate of population growth in Punjab remained around 1.4% per annum (Slade, 1951), and thereafter increase occurred at an explosive rate of over 2% (table 1). Its population has increased by 2.3 times from 20.55 million in 1951 to 47.29 million in 1981 just in a period of 30 years. From 1951 to 1998 it increased by 3.6 times to reach 73.62 million in less than half a century time span. Then it reached to 84.81 million in 2005 (NIPS, 2005) showing over 4 fold increase between 1951 and 2005. Fig 1 further clarifies the story of rapid population growth. The current estimated population of Punjab is in the neighborhood of 90 million which means that since first census after independence, it increased by about 4.4 times within a time span of just 58 years. Estimates for future indicate that it may reach to 96.15 million in 2015 and 109.86 million in 2025 (NIPS, 2005).
Table 1: Population growth, density and proportion of urban population
Census year 1951 1961 1972 1981 1998 2003 * 2005** Population (in millions)
20.54 25.46 37.61 47.29 73.62 82.48 84.81
Density (persons/sq. km)
100 124 183 230 358.5 402 413
Percent of country’s total
60.9 59.4 57.6 56.1 55.6 55.5 55.3
Intercensal annual growth rate
- 2.18 3.40 2.74 2.63 2.30 1.9
Percent urban population
17.3 21.5 24.4 27.6 31.2 - -
Growth rate of urban pop.
- 5.34 4.53 4.24 3.4 - -
Growth rate of rural pop.
- 1.66 3.06 2.23 2.32 - -
Source: Provincial Census Reports of Punjab. *Estimated population based on the 1998 census population and reduced growth rate of 2.30. **NIPS estimates 2005.
Fig 1: Population growth trend in Punjab
0
10
20
30
40
50
60
70
80
90
100
1940 1950 1960 1970 1980 1990 2000 2010 2020
Years
Pop
ulat
ion
in m
illio
ns
Asad Ali Khan Changing Pattern of
371
Table 1 and fig 1 tell that population growth in Punjab has not occurred at a uniform rate and has been subjected to noticeable fluctuations. The highest growth rate (3.4) was recorded for the intercensal period of 1961 and 1972. The growth rate amplified between 1951 and 1972 perhaps due to a decline in mortality resulting from improvement in medical facilities, sustained high fertility and inflow of migrants. While slow downward trend in growth rate from 1972 to 1981 (2.75%) and 1981 to 1998 (2.63%) can be attributed to slow paced modest fall in fertility. Though, its share in the country’s population has been found decreasing in all the censuses and the overall decrease from 1951 to 1998 was 5.25% points, but in terms of population number and density the Punjab still ranks highest amongst the provinces. Its population is about 2.4 times larger than the population of Sindh, more than 4 times larger than the population of NWFP and more than 11 times larger than the population of Baluchistan (Khan, 2009). The recent growth rate suggesting a sizeable addition to the population every year not only dilutes the results of development efforts but also creates unsustainable level of demand for resources which are already scarce to cater the needs of people. Therefore, Punjab faces a formidable challenge of tackling the issues of economic development, reduction in unemployment, improving the living conditions of population and poverty reduction. If the current pace of growth continues, the population of province is likely to become double within next 30 years.
In the ninth population welfare plan (1998-2003), the Population Welfare Department of the Government of Punjab had planned to reduce the population growth rate by 0.1% in each of the five plan years to bring it down to 2.1 by the mid 2003. To tell whether the target was achieved or not, the plan evaluation is not available. However, according to this department, the increment in population over the five plan years between 1998 and 2003 was 9.75 million persons. By adding this figure to their mid year estimated baseline population of 77.5 million in 1998, the total population of the province in mid 2003 stands at 87.3 million. While based on the assumption of continued growth rate of 2.63% to the 1998 census population of 73.62 million results in the addition of 10.2 million by the year 2003 and 15.49 million individuals by the year 2006. If we apply the reduced growth rate of 2.30% on census population to estimate the population of 2003 and 2006, it gives the addition of 8.86 and 13.54 million individuals and a total population of about 82.49 million (Naeem, 2003: 31). This rate of growth gives an addition of 13.54 million in the census population of 1998 and a total population of about 87.16 million in 2006. The estimates prepared by NIPS for the years 2005, 2010 and 2020 give the population of province 84.81, 89.11 and 103.25 millions respectively (NIPS, 2005). However, recently the growth rate of population has been reported to reduce to 1.9%.ii
Furthermore, significant differences in the pattern of population growth between rural and urban areas can be noted since the first census of 1951 to the last census of 1998. Although, share of urban population has increased from 17.3% in 1951 to 31.2% in 1998, but likewise overall average annual growth rate,
South Asian Studies 26 (2)
372
the rate of urban population growth is also falling (table 1). During the intercensal period of 1951-61 average annual rate of population growth in urban areas was 5.34% (Naeem, 2003: 32) which dropped to 4.5% during the intercensal phase of 1961-72 and remained over 4% in the subsequent census of 1981. Then it decreased further to 3.4% in 1998 (1998 PCR of Punjab, 2001: 114). In rural areas, population growth rate increased appreciably from 1.66% during 1951-61 to 3.06 % during 1961-72, and then dropped slightly in 1981 and 1998 (table 1). Spatial distribution of population As regards spatial distribution of population over the province, it is highly uneven and influenced by a number of geographical factors like terrain, climate, soils, water distribution, agriculture, irrigation, manufacturing and accessibility. Data indicates that well over half of the Pakistan’s population lives on just over one-fourth (25.8%) of its land area occupied by the Punjab. Among the provinces of Pakistan, Punjab is the most thickly inhabited region, attributed mainly to its vast agricultural lands and better industrial development (Khan, 2003). It contained 358.5 persons/sq. km of land in 1998 as against 230 in 1981, 183 in 1972, 124 in 1961 and 100 persons/sq. km in 1951 (Khan, 1986: 25). Such a momentous increase in density also indicates a fast growth rate of population. In 1998 Punjab had more than double the number of persons/sq. km compared to the overall density of 166 persons/sq. km for Pakistan. Population density also varies highly by districtsiii (table 2). The districts located in the east-central part of the province are relatively densely populated while the districts located on extreme northern, southeastern, southern and western parts are relatively sparsely populated. This is perhaps due to the fact that east-central portion is an old agricultural heartland, contains more industries and provincial capital that provide more opportunities to earn livelihood. All the censuses had shown Lahore as a most thickly populated district with 640 persons in 1951, 1000.5 persons in 1981 and 3,566 persons in 1998 living per sq. km of land area. Currently Gujranwala, Faisalabad, Sialkot and Multan districts having 939, 927, 903 and 838 persons/sq. km respectively follow it. It is worth mentioning that all the districts having population density above 600 persons/sq. km are comparatively well developed in industrialization, education, health and other facilities. In contrast, the districts characterized with harsher geographic conditions and low or negligible industrial development has low density of population. For example, Rajanpur and Bahawalpur districts contain only 90 and 98 persons/sq. km of their land respectively. In order to present a general view of population distribution, the province can be divided into four density zones (map 1).

Asad Ali Khan Changing Pattern of
373
Map 1: Density zones of the Punjab
Data source: 1998 population census of Pakistan.
1) Thinly populated zone having less than 100 persons/sq. km includes only
two districts, Bahawalpur and Rajanpur. 2) Moderately populated zone having 100 to 199 persons/sq. km includes
seven districts namely, Attock, Chakwal, Mianwali, Khushab, Bhakkar, Layyah and D. G. Khan.
3) Densely populated zone having 200 to 399 persons/sq. km includes six districts namely, Jhelum, Hafizabad, Jhang, Muzaffargarh, Bahawalnagar and R. Y. Khan.
4) Heavily populated zone having 400 and more persons per sq. km includes nineteen districts namely, Rawalpind, Gujrat, Gujranwala, Mandi Bahauddin, Sargodha, Sialkot, Narowal, Sheikhupura, Lahore, Kasur, Faisalabad, T. T. Singh, Okara, Sahiwal, Pakpattan, Vehari, Khanewal, Multan and Lodhran.
Density distribution of population shows that most of the Punjab is heavily populated and there is an immense pressure on the carrying capacity of land. Resources are in a serious stress and problems are cropping up.
In terms of population size, Faisalabad was the largest district in 1981 sharing 9.92% population of the province followed by Multan 8.63%, Sahiwal 7.64% and Lahore 7.50%.iv Whilst, area wise smallest district Lahore is currently the largest district in terms of population size followed by Faisalabad, Gujranwala and Rawalpindi (table 2). It means that district wise proportionate share of population has not been uniform rather it fluctuated up and down from census to census. The share of Lahore district moved upward to 8.6%, whereas the share of Faisalabad and Multan districts moved downward to 7.4% and 4.2% respectively in 1998. The

South Asian Studies 26 (2)
374
share of other districts also showed fluctuating trend. The current four biggest districts jointly occupy about 9.3% of the land area and contain over one-fourth of the province’s population. This is primarily attributed to the status of provincial headquarter of Lahore, favorable climate and nearby location of Rawalpindi to the country’s capital, and vast industrial development of Faisalabad and Gujranwala. If we include Sheikhupura, R. Y. Khan, Multan, Jhang, Sialkot, Sargodha and Muzaffargarh districts to this list, they together contain about 53% of the Punjab’s inhabitants, whereas the other 23 districts contain remaining 47% inhabitants. Nineteen districts individually having populations above 1.8 million contain 76.2% of the total population, while 15 districts with individual populations below 1.8 million contain remaining 23.8% population. Area wise the biggest district Bahawalpur contains only 3.3% inhabitants, followed by Rajanpur, D. G. Khan and R. Y. Khan having only 1.5%, 2.2% and 4.3% population respectively. These four districts together occupy about 30% of the land area and contain only 11.3% of the province’s population (table 2). This can be attributed mainly to the prevalence of adverse climatic and desert conditions. On examining the density distribution of population by districts, it appears that over two-third of the population is concentrated on less than one-fourth of the land area of the province on one hand while on the other hand less than one-third of the population is sparsely distributed over three-fourth of the land area.
Moreover, Punjab is predominantly an agrarian region and most of its people live in rural areas. Certainly the proportion of urban population has grown faster over time, 3.7% points between 1981 and 1998 for example, but still the proportion of rural population is as high as 68.8%. The increasing share of urban population is largely the result of migration from rural to urban areas. But to a large extent urban fertility has also continued to be high showing not too much differential between rural and urban areas (Yusuf and Retherford, 1981; and Sather, 1979). The proportion of rural-urban population highly varies from district to district. Generally, the central and eastern districts have high whereas western and southern districts have comparatively low proportion of urban populations (table 2).
Table 2: Population distribution and growth rate by districts
Districts Area (sq. km)
Population number
% Share in Punjab
Density (persons/ sq. km)
Growth rate (%)
% Urban population
Hafizabad 2,367 832,980 1.1 352 2.3 27.3 Khushab 6,511 905,711 1.2 139 2.1 25.3 Jhelum 3,587 936,957 1.3 261 2.1 27.7 Bhakkar 8,153 1,051,456 1.4 129 2.7 16.0 Mianwali 5,840 1,056,620 1.4 181 2.3 20.8 Chakwal 6,524 1,083,725 1.5 166 2.0 12.2 Rajanpur 12,318 1,103,618 1.5 90 3.3 14.5 Layyah 6,291 1,120,951 1.5 178 3.1 12.9 Mandi Bahauddin 2,673 1,160,552 1.6 434 1.9 15.2 Lodhran 2,778 1,171,800 1.6 422 2.7 14.5 Narowal 2,337 1,265,097 1.7 541 2.0 12.2 Attock 6,857 1,274,935 1.7 186 2.2 21.3

Asad Ali Khan Changing Pattern of
375
Pakpattan 2,724 1,286,680 1.8 472 2.5 14.2 T. T. Singh 3,252 1,621,593 2.2 499 2.1 18.8 D. G. Khan 11,922 1,643,118 2.2 138 3.3 13.9 Sahiwal 3,201 1,843,194 2.5 576 2.1 16.4 Gujrat 3,192 2,048,008 2.8 642 2.2 27.7 Bahawalnagar 8,878 2,061,447 2.8 232 2.4 19.1 Khenewal 4,349 2,068,490 2.8 476 2.1 17.6 Vehari 4,364 2,090,416 2.8 479 2.7 16.0 Okara 4,377 2,232,992 3.0 510 2.4 23.0 Kasur 3,995 2,375,875 3.2 595 2.6 22.8 Bahawalpur 24,830 2,433,091 3.3 98 3.1 27.3 Muzaffargarh 8,249 2,635,903 3.6 319 3.4 12.9 Sargodha 5,854 2,665,979 3.6 455 2.0 28.1 Sialkot 3,016 2,723,481 3.7 903 2.5 26.1 Jhang 8,809 2,834,545 3.9 322 2.2 23.4 Multan 3,720 3,116,851 4.2 838 2.7 42.2 R. Y. Khan 11,880 3,141,053 4.3 264 3.2 19.6 Sheikhupura 5,960 3,321,029 4.5 557 2.7 26.2 Rawalpindi 5,285 3,363,911 4.6 636 2.7 53.2 Gujranwala 3,622 3,400,940 4.6 939 2.8 50.5 Faisalabad 5,856 5,429,547 7.4 927 2.5 42.7 Lahore 1,772 6,318,745 8.6 3,566 3.8 82.4 Punjab 205,343 73,621,290 100 358.5 2.6 31.3
Source: 1998 district census reports (DCRs) of Punjab.
On the basis of rural-urban share of population, the districts can be divided into three broader groups;
1) Less urbanized districts having urban population below 20% include Chakwal, Narowal, Mandi Bahauddin, Bhakkar, Layyah, Muzaffargarh, D. G. Khan, Rajanpur, R. Y. Khan, Lodhran, Vehari, Bahawalnagar, Pakpattan, Sahiwal, Khanewal and T. T. Singh.
2) Moderately urbanized districts that have urban population from 20 to 39% include Attock, Jhelum, Gujrat, Sialkot, Hafizabad, Sheikhupura, Kasur, Okara, Mianwali, Khushab, Sargodha, Jhang and Bahawalpur.
3) More urbanized districts containing 40% and above urban population include Lahore, Rawalpindi, Gujranwala, Faisalabad and Multan. The headquarter cities of these districts also rank amongst the ten biggest cities of Pakistan. Lahore has the highest and Chakwal and Narowal have the lowest share of urban populations (table 2).
Age and Sex Structure Age and sex structure represents the number (or proportion) of people of a given age and sex in a population which is built from the input of births at age zero, and deaths and migration at every age. Fertility, mortality and migration trends are reflected in the age and sex profile. The interaction of fertility, mortality and migration not only forms the age and sex structure at any given time but these processes in turn are also affected by it. Age and sex structure is determined by as well as is a determinant of births, deaths and migration occurring in the population. This reciprocal relationship works in a cyclic manner. For instance, high fertility during one period of time will produce, a generation later, comparatively a large number of childbearing age women and consequently a

South Asian Studies 26 (2)
376
large number of births which in turn will add a large number of children forming a young population structure. Furthermore, these two basic biological attributes are the “visible, indisputable and convenient indicators of social status” (Thomlinson, 1965: 428). Age and sex profile can be viewed as a key factor to the life of a population because it determines the future structure and demands of population for goods and services. It affects not only demographic but also social, economic and political structure of the population. The females in reproductive ages, marital status composition, working age population, manpower and potential school age population are influenced by age and sex distribution. Various social and economic issues like housing, employment, health and education are strongly related to it.v Thus, it would not be an exaggeration to say that changes in age and sex composition virtually influence all social institutions and contribute as a powerful stimulant force in social change. Age and sex certainly affect the working of society in important ways because society assigns social roles to population groups on the basis of their age and sex. Role of youngsters differ than olds, women perform different duties than men and different behaviors are expected from the people of each age group. Hence, the knowledge of age and sex structure is vital to understand population behavior, fertility pattern and future demands of population for resources.
Age structure of the population of Punjab has a considerable impact on its demographic and socio-economic characteristics. It determines the age specific needs of population. Though, three demographic variables jointly determine the age structure but high fertility has played major part in producing young age structure of population in Punjab. Therefore, it warrants special attention. Due to cultural limitations and low literacy ratio age reporting in Punjab is poor and subjected to heaping on certain preferred digits like 5 and 10 (Ahmed and Ali, 1992). Yet, it provides sufficient information for organizing and planning various activities. Since, all human actions and behavior tend to depend on and change with age, so, if young people in a population are relatively larger in number as in case of Punjab (table 3) then the competition for jobs will be stiff even if the economy is good, and it will be difficult for the people to maintain their accustomed level of living and vice versa.
Table 3: Age and sex distribution of population (1981 & 1998)
Age groups
Percent population
1981
Male Female Percent population
1998
Male Female
0-4 14.86 14.34 15.45 14.23 14.04 14.44 5-9 15.37 15.26 15.49 15.24 15.28 15.21 10-14 13.15 13.45 12.82 13.03 13.21 12.85 15-19 9.80 9.82 9.79 10.30 10.23 10.38 20-24 7.59 7.45 7.72 8.90 8.61 9.21 25-29 6.47 6.45 6.50 7.24 7.10 7.37 30-34 5.52 5.38 5.70 6.31 6.35 6.28 35-39 5.08 4.85 5.33 4.86 4.94 4.77 40-44 4.69 4.46 4.94 4.43 4.38 4.49 45-49 3.84 3.82 3.86 3.56 3.52 3.61 50-54 3.71 3.93 3.48 3.33 3.39 3.27

Asad Ali Khan Changing Pattern of
377
55-59 2.07 2.08 2.05 2.31 2.41 2.21 60-64 2.87 3.22 2.50 2.18 2.26 2.10 65-69 1.35 1.46 1.24 1.36 1.43 1.28 70-74 1.60 1.80 1.40 1.23 1.31 1.14 75+ 1.96 2.16 1.75 1.43 1.50 1.35 All 100 52.57 47.43 100 51.74 48.26
Source: 1981 and 1998 PCRs of the Punjab.
Based on the proportion of people at different ages, a population can be labeled as young or old. Normally, a population having more than 35% of its people under age 15 is termed as young and more than 10% aged 65 or above is termed as old (Weeks, 1986: 210). The population of Punjab can be termed as youthful population because 43.4% of its inhabitants were under age 15 and only 4.9% were aged in 1981. Modest change occurred up to 1998 when 42.5% population consisted of young and 4.0% aged group (table 5.4), showing only 0.9% point decline in each group.vi Although, fertility has the greatest influence on population structure, the improvements in infant and child mortality also contributed to the expansion of youthful population as greater proportions of each generation lived to adulthood. Almost similar situation prevails in all the districts of Punjab and they all have young population structure. Rawalpindi has the lowest proportion (38.6%) of young and highest proportion (57.8%) of adult population whereas D. G. Khan has the highest proportion (49%) of young and lowest proportion (47.6%) of adult population. Multan is attributed with the lowest (3.1%) and Chakwal with the highest proportion (6.0%) of aged population.vii The young age structure of population indicates that large number of people will enter in adult age group that might result in large number of marriages and consequently large number of births in the years to come. Thus, lot of employment opportunities will be required and there will be an immense pressure on resources related to the supply of food, water, shelter, health and education facilities.
Fig 2: Population pyramid of the Punjab
Data source: 1998 population census of Pakistan.

South Asian Studies 26 (2)
378
Furthermore, the age structure has been quantified graphically and statistically by constructing population pyramid, calculating average age of the population, aging index and dependency ratio. The population pyramid of Punjab (fig 2) is broad base built of numerous births, rapidly tapering off towards the top which may be termed as progressive or expansive (Khan, 1998). This shape of pyramid is a typical of oriental societies which is suggestive of the fact that number of children in the population is high due to high fertility. It indicates that age distribution of males as well as females is heavily weighted towards the economically unproductive younger group. It also suggests the occurrence of more marriages in future and high growth potential of population. The females saved now from infant and childhood mortality will be potential mothers after 15 to 20 years. The broad base of population pyramid is thus a powerful force for positive momentum of future population growth, as these ever-larger cohorts of young people will move into childbearing ages. The increasing entry of females in reproductive group reveals that demographic momentum in population is being built. A bulge at young adult ages may result high crude birth rate by producing a large number of children relative to the total population suggesting Punjab as high population growth rate area.
The age distribution by five years age groups (table 3) reveals that the proportion of population in 0-4 years is smaller than 5-9 years age group. Thereafter, it constantly decreases in successive age groups. This pattern is observed in almost all the districts of Punjab, in rural and urban areas and in the entire country as well, and prevailed throughout the all past censuses and also supported by the surveys conducted so far (Pakistan Demographic Survey, 2005; NIPS, 1998; NIPS, 1992). The smaller proportion of population in 0-4 years age group is a typical feature of many developing areas where age reporting is poor (Ali and Sultan, 2003). However, it may be an indication of a little fall in fertility also. Median age (16.23 years) dividing the population into equal halves, one above and the other below it, population pyramid and ageing indexviii reflect the young structure of population. Ageing index for Punjab in 1981 was 11.3 whereas it further declined to 9.43 in 1998. These figures are slightly higher than national level of 7.9 and slightly lower than India (11.1%) but much lower than USA and UK with aging index of 61.9 and 84.2 respectively (Khan, 2002: 109). This can be attributed to higher death rate in aged population, lower life expectancy and higher fertility in Punjab compared to developed countries of the world.
Dependency ratio (DR) is another important indexix to measure the social and economic impact of various age structures. Dependency burden is the share of population likely to require financial support from the working population. When fertility is high, the proportion of children in the population also tends to be high, and so does the DR. A large proportion of child population in Punjab indicates a high proportion of dependents relative to the work force. It reflects not merely a fast growth of population in the past but also foreshadows fast growth in the future. DR in 1981 was 93 whereas for rural and urban areas it was 96 and 88

Asad Ali Khan Changing Pattern of
379
respectively (1981 PCR of Punjab). In 1998 the index was 87 and for rural and urban areas it was 92 and 77 respectively (1998 PCR of Pujab), showing a little decline compared to 1981. Though, DR for Punjab is almost equal to the national level (87.3%) but markedly higher than India (66.7), UK (53.8) and USA (51.5) (Khan, 2002: 108). This situation points to a fairly heavy load on working age population. In fact, it is hard or even impossible to find out in the developing areas like Punjab that everyone of working age is actually working. Furthermore, due to variations in age structure, slight to marked variations in DR have been observed at district level. Highest DR (110) is found in D. G. Khan and lowest (73) in Rawalpindi (table 6). However, it is fairly high in all the districts placing tremendous burden on working age population which is further aggravated by low female participation rates in work force.
Table 4: Sex structure of population by selected age groups and rural-urban areas Percent in 1981 Percent in 1998
Age Groups
Both Male Female Rural Urban Both Male Female
Rural Urban
Under 1 2.9 2.9 3.0 2.96 2.93 2.4 2,4 2.4 2.5 2.2 Under 5 14.9 14.3 15.4 14.83 14.97 14.2 14.0 14.4 14.9 12.8 Under 10 30.2 29.6 30.9 30.40 29.80 29.5 29.3 29.7 30.7 26.7 Under 15 43.4 43.0 43.8 43.50 43.11 42.5 42.5 42.5 43.6 40.1 15-49 43.0 42.3 43.8 42.08 45.47 45.6 45.1 46.1 44.0 49.2 15-64 51.7 51.5 51.9 51.12 53.16 53.5 53.2 53.7 52.0 56.6 18 & Above
50.9 50.3 50.5 51.01 50.62 52.0 52.0 52.0 51.3 53.5
21 & Above
43.5 44.1 42.9 43.81 42.83 44.3 44.7 44.0 43.6 46.0
65 & Above
4.9 5.4 4.3 5.38 3.73 4.0 4.2 3.8 4.4 3.3
DR 93.5 94.1 92.8 95.61 88.12 87.0 87.8 86.2 92.3 76.7 Source: 1981 and 1998 PCRs of Punjab.
Table 4 reveals that young population of less than 15 years old comprised 43.4% in 1981 and 42.5% in 1998 showing a modest decline. The proportion of population under 15 years is higher in rural areas than their urban counterparts indicating comparatively more decline in fertility in urban areas.
As regard sex, it is perhaps the unique aspect of population which is most likely to be declared accurately. Sex ratio (SR)x is the basic demographic variable, some times called as host of other variables because it directly affects the incidence of births, deaths, marriages, migration and occupation (Rukanuddin and Farooqui, 1988). Fertility, mortality and migration operate variably to create inequalities in SR. Naturally, there is a biological trend of male preponderance at birth in the world over, but on the other hand they suffer from a higher pre-natal mortality (Clarke, 1972) for unknown reasons loosing the advantage of to outnumber females. However, this is not true entirely in case of Punjab where normally 102 to 103 boys are born for every 100 girls causing not too much difference. On the other side, female deaths exceed male deaths causing higher proportion of male population (Rukanuddin and Farooqui, 1988). Besides high mortality, lower status and poor counting of females (due to cultural limitations) further aggravates this feature. The proportion of males has decreased from

South Asian Studies 26 (2)
380
52.57% in 1981 to 51.74% in 1998 (or in other words SR from 110.8 to 107.2). It showed 8.1 percentage point decline from 1951 (when it was 115.3) to 1998. Yet there were 2,568,074 more males than females in1998 compared to 2,427,985 in 1981 showing an increase in overall number.
Table 5: Comparison of sex ratio of Punjab and Pakistan for five census years
Punjab Pakistan Census year All areas Rural Urban All areas Rural Urban
1951 115.3 113.4 124.6 116.4 114.6 126.4
1961 114.3 112.1 122.6 115.3 112.4 125.5 1972 116.2 115.5 118.3 114.3 112.6 119.3 1981 110.8 109.7 113.9 110.6 108.7 115.3 1998 107.2 105.9 110.3 108.5 106.8 112.1
Source: Population census organization of Pakistan.
Table 5 compares the changing pattern of SR of Punjab with national figures through different census years which has shown downward trend. Almost same pattern has been found for the districts and for the rural and urban areas with higher SR in urban areas of most of the districts compared to their rural counterparts (table 6).
Table 6: Changing pattern of sex ratio (SR) by districts and dependency ratio (DR)
Districts SR 1981
SR 1998
Difference SR rural areas
SR urban areas
Difference DR
Hafizabad 112.7 108.4 4.3 108.5 108.14 0.26 86.7 Khushab 104.5 99.4 5.1 98.7 101.3 -2.6 83.5 Jehlum 99.9 99.8 0.1 94.1 116.5 -22.4 80.5 Bhakkar 111.2 107.1 4.1 106.9 108.0 -1.1 93.8 Mianwali 108.1 100.8 7.3 99.8 104.4 -4.6 91.2 Chakwal 96.5 91.6 4.9 90.6 99.8 -9.2 81.8 Rajanpur 116.6 111.1 5.5 111.7 107.6 4.1 107 Layyah 111.6 106.8 4.8 106.8 107.1 -0.3 99.0 Mandi Bahauddin
112.9 104.9 8.0 105.3 102.8 2.5 85.5
Lodhran 112.2 108.3 3.9 108.4 107.8 0.6 97.8 Narowal 108.6 101.2 7.4 100.9 103.2 -2.3 96.8 Attock 101.6 99.6 2.0 96.4 112.5 -16.1 78.5 Pakpattan 111.2 108.0 3.2 108.0 108.0 0.0 88.3 T. T. Singh 108.6 105.3 3.3 105.3 104.9 0.4 85.6 D. G. Khan 112.3 108.2 4.1 108.3 107.3 1.0 110 Sahiwal 111.3 107.2 4.1 106.9 108.5 -1.6 83.4 Gujrat 109.1 100.4 8.7 96.2 112.2 -16.0 84.1 Bahawalnagar 113 111.1 1.9 107.5 106.8 0.7 91.2 Khenewal 111 107.7 3.3 107.7 107.5 0.2 88.9 Vehari 111.5 107.7 3.8 107.8 107.1 0.7 89.8 Okara 112 109.6 2.4 107.7 116.1 -8.4 86.9 Kasur 111.7 119.9 1.8 109.8 110.0 -0.2 95.1 Bahawalpur 113.3 110.8 2.5 109.1 115.3 -7.2 91.2 Muzaffargarh 112.4 108.7 3.7 108.3 111.5 -3.2 107 Sargodha 108.9 106.2 2.7 105.3 108.3 -3.0 84.5 Sialkot 108.7 105.2 3.5 103.3 110.9 -7.6 85.6 Jhang 111.9 108.4 3.5 108.3 108.6 0.3 85.7

Asad Ali Khan Changing Pattern of
381
Multan 112.5 110.4 2.1 108.4 113.2 -4.8 87.9 R. Y. Khan 113.3 108.8 4.5 109.1 107.8 1.3 97.2 Sheikhupura 112.5 108.6 3.9 108.6 108.7 -0.1 90.2 Rawalpindi 107.5 104.9 2.6 96.3 113.2 -16.9 73.0 Gujranwala 112.1 108.6 3.5 107.2 109.9 -2.7 86.9 Faisalabad 110.9 108.6 2.3 107.7 109.8 -2.1 81.8 Lahore 115.3 111.3 4.0 112.3 111.1 1.2 73.8 Punjab 110.8 107.2 3.6 105.9 110.3 -4.4 87.0
Source: 1981 and 1998 district census reports (DCRs) of Punjab.
The lowest SR has been observed in Chakwal and Jhelum which decreased from 97 and 99.9 in 1981 to 92 and 99.8 in 1998 respectively. Whilst the highest SR has been observed in Lahore, Rajanpur and Bahawalpur which decreased from 115 in 1981 for each of the former two districts and 113 for latter one to 111 in 1998 for each of the three districts (table 6). Variations in SR can also be attributed to resettlement of females due to marriages and males in search of jobs in other districts. The SR has shown a gradual decline not only in the province but also in all the districts which can be attributed to the better coverage and improvements in female mortality. The higher SR in urban areas than that of their rural counterparts is attributed mainly to sex selective migration of males to urban areas in search of livelihood. However, from the declining trend of higher male population in the past, it looks quite possible that in the years to come SR will further improve to become closer to the developed regions.
Table 7: Comparison of age specific sex ratio in Punjab and Pakistan, and by rural-urban areas
of Punjab 1981 1998
Age groups
Pakistan al1
Punjab all
Punjab rural
Punjab urban
Pakistan all
Punjab all
Punjab rural
Punjab urban
0-4 97.3 102.8 102.3 104.1 104.3 104.3 104.3 104.3 5-9 107.6 109.2 109.7 107.9 109.6 107.7 108.2 106.5 10-14 118.4 116.2 117.7 112.6 113.9 110.2 111.3 107.7 15-19 117.4 111.2 110 113.9 106.5 105.6 105.4 106 20-24 110.5 107.5 103.1 117.8 100.7 100.3 96.7 107.7 25-29 111.7 110.1 106.8 118.6 105.1 103.2 98.3 113.6 30-34 107.1 104.7 101.6 113.1 111.2 108.4 103.7 118 35-39 102.1 100.9 98.8 106.5 111.7 111.2 107.3 118.8 40-44 100.5 100 95.7 112.3 104.1 104.5 99.8 114.3 45-49 109.9 109.7 106.2 120 107.1 104.4 100.8 112.7 50-54 123.4 125.1 122.3 133.8 113 111.4 110.1 114.6 55-59 114.4 112.9 109.6 123.9 118.4 117.2 115.4 121.7 60-64 141.6 143.1 141.9 147.2 116.3 115.2 114.6 116.9 65-69 128.7 130.2 128.4 136.7 120.7 120.1 119 123 70-74 140.2 144 144.2 143.3 123.3 123.2 122.5 125.2 75 + 133 137.2 137.4 136.2 118.9 119.6 118.7 122.6 All 110.6 110.8 110 113.9 108.5 107.2 105.9 110.3
Data source: Population census organization of Pakistan.
Furthermore, the age specific SR for five-year (single year as well) age groups (table 7 & fig 3) presents an erratic pattern. For instance, it increases from age group 0-4 to 10-14 then declines to age group 20-24, proceeding further with slight fluctuations it increases considerably in later age groups. In age group 10-14, the excess of males can partly be attributed to age misreporting as in this age

South Asian Studies 26 (2)
382
group normally females attain puberty and in order to avoid revealing this status, some parents understate the ages of their 10-14 years old daughters. While, 15-19 years age group girls are shifted upward to next group perhaps due to the reason that many of them get married in this age and even some times bear children. Their ages are exaggerated and resultantly the proportion of both the sexes is almost equal in the 20-24 years age group. Like other developing areas and overall national situation, SR in Punjab is also substantially higher in older age groups partially because of lower female life expectancy than male and under reporting of females in these ages (Ali and Sultan, 2003). Despite all the aforesaid variations, the numbers of two sexes are not very widely divergent, however, the disparity whatever prevails is worth noting because of the contrasting roles of two sexes in the society and economy of the province since the economy and population of the province are closely interrelated.
Fig 3: Age specific sex ratio in the Punjab
0
20
40
60
80
100
120
140
160
0-4 5--9 10--14
15-19
20-24
25-29
30-34
35-39
40-44
45-49
50-54
55-59
60-64
65-69
70-74
75 +
Age groups
Sex
ratio
Punjab 1981Punjab 1998
Data source: 1981 and 1998 Population census of Pakistan.
Population Structure by Marital Status According to marital status, the population aged 15 years and above is classified as never married (single), currently married, and ever married (widowed and divorced). It is virtually an important variable of the population dynamics. The current concern to this social institution, however, arises from the standpoint of population growth. Essentially no childbearing occurs outside of marriage in Punjab; therefore, marital status directly affects population growth. Besides age structure and SR, marital status is influenced by socio-economic conditions, state laws and religious norms. It is never constant and keeps on changing over time with changes in its determinants. The marriage rates and proportion of married population in each age group are important to monitor population growth,

Asad Ali Khan Changing Pattern of
383
particularly when family planning has not taken roots to the desired level (Rukanuddin and Farooqui, 1988). It is impossible to separate birth rates from the age at marriage and marriage duration of the females. Higher marriage rates at younger ages generally tend to elevate birth rates whereas widowhood and divorces, if not followed by remarriages, bring the opposite results (Shrivastava, 1994).
Marriage rate has close relation to the process of procreation. Marriage is a socio-religious-legal wedlock that gives the couple license of bearing and rearing children. Its legality may be established by religious or civil means with the former most widely prevalent in the Punjab. Muslim family laws govern the minimum age at marriage which is 16 years for females and 18 years for males.xi Cultural and traditional factors also play an important part in decision-making about family formation. Parents make most of the decisions and in this regard Punjab follows the general trend that prevails over the country, where 98.7% marriages in rural and 78.7% in urban areas are arranged by the parents (Cheung, et al, 1985). There are two major forms of marriages in the region, monogamy and polygyny (a type of polygamy). Monogamy is far more common than polygyny. Though, high SR in the province has reduced the frequency of polygyny, yet it is common in some ethnic groups of southern Punjab in particular and may have profound influence on birth rate, but data on this type of marriage is scanty. Hijnal (1965) on the basis of tempo and prevalence of nuptiality has identified three different marriage patterns. First, the early family formation and universal prevalence as found in Punjab and other developing areas. Second, the late marriages and universal prevalence as found in the Eastern Europe. Third, the late marriages with higher proportion of females remaining single through the marriageable age as found in the Western Europe. The social and cultural norms prevalent in Punjab favor universal and early age marriages whereas divorces are reported almost negligible. Females are younger than males at the time of marriage as the latter must wait to establish them economically before assuming family responsibility. However, Punjab is experiencing a changing marriage pattern. There has been a steady increase in average age at marriage for both sexes (Soomro, 2003). For instance, it has risen from 20 years for females and 25 years for males in 1981xii to 22.5 years for femalesxiii and 26.6 years for males in 1996-97.xiv The proportion of the persons remaining single is also on the rise. In 1998, never married population consisted of 31.85%, married 61.8%, widowed 6% and divorced 0.4% as compared to 25.16%, 68.4%, 6.1% and 0.3% respectively in 1981 (table 8). The census results show consistency with demographic surveys results which revealed considerable delay in marriages (Hakim, et al, 2001 and 1998). This seems to have influenced birth rate and intercensal growth rate of population that showed a noticeable change (table 1).

South Asian Studies 26 (2)
384
Table 8: Marital status by sex and rural-urban areas
1981 1998 Marital status Both sexes Male Female Both sexes Male Female
All areas 25.16 30.91 18.70 31.85 37.3 26.0 Rural 23.5 29.30 17.16 29.9 35.47 24
Never married
Urban 29.4 34.93 22.89 36.0 40.81 30.46 All areas 68.38 65.27 71.87 61.76 58.6 65.1 Rural 69.8 66.66 73.14 63.4 60.03 66.86
Married
Urban 64.8 61.77 68.41 58.4 55.58 61.34 All areas 6.11 3.57 8.96 5.95 3.8 8.2 Rural 6.33 3.75 9.16 6.3 4.2 8.4
Widowed
Urban 5.54 3.13 8.41 5.3 3.1 7.7 All areas 0.35 0.25 0.47 0.45 0.3 0.7 Rural 0.4 0.28 0.54 0.4 0.3 0.7
Divorced
Urban 0.22 0.17 0.29 0.3 0.2 0.5 Source: 1981and 1998 PCRs, and Handbook of population census data of Punjab, 1987.
Table 8 makes a comparison of marital status by sex and rural-urban areas for two census years. The proportion of never married persons has shown an increasing trend which is relatively sharper in case of females. For example, the proportion of never married females for all areas has increased from 18.7% in 1981 to 26% in 1998 whereas the proportion of married persons has declined significantly. This trend has been observed in rural as well as in urban areas, in all age groups and in both the sexes except for the females of age 60 and over who showed an increase in the proportion of married rather than decline (table 9). This may be attributed to decreasing female mortality and increasing life expectancy. Though, decline in the proportion of married and rise in the proportion of never married persons has been observed in all age groups but the difference in change is comparatively sharper in younger ages and slighter in ages above 40. This is perhaps due to nearing to the sub-fecundity level. It also revealed that more women (27.1% in 1981 and 15.7% in 1998) than men (7.3% in 1981 and 4.2% in 1998) marry in their teen ages (table 9).
Table 9: Age and sex specific percentage distribution of never married (NM) and married (M) population (1981 & 1998)
Both 1981 Both 1998 Male 1981 Male 1998 Female 1981
Female 1998
Age groups
NM M NM M NM M NM M NM M NM M 15-19 83.06 16.7 89.9 9.8 92.5 7.3 95.6 4.2 72.5 27.1 83.9 15.7 20-24 46.74 52.3 58.5 40.7 64.2 35 74.1 25.1 27.9 71 42.6 56.4 25-29 20.47 78.1 28.5 70.1 31 67.8 41.1 57.8 8.9 89.4 15.5 82.8 30-34 8.86 88.8 12.1 85.8 13.7 84.4 17.2 81.2 3.8 93.5 6.6 90.7 35-39 3.94 93 6 90.8 6.2 91.4 8.1 89.8 1.7 94.4 3.7 91.9 40-44 2.96 92.3 4.1 91.1 4.4 92.2 5.1 91.9 1.5 92.4 2.9 90.3 45-49 1.77 91.6 3 89.9 2.5 93.4 3.8 92 0.95 90.4 2.1 87.7 50-54 2.63 86.9 3.1 85.5 3 91.5 3.8 89.7 2.21 81.1 2.4 80.7 55-59 1.36 87.4 2.7 82.3 1.8 91.8 3.1 88.1 0.87 82.4 2.2 75.5 60+ 2.52 70.5 3.6 68.9 2.5 84.1 3.5 80.3 2.5 51.5 3.8 55.4 All 25.16 68.4 31.8 61.8 30.9 65.3 37.3 58.6 18.7 71.9 26 65.1
Source: 1981 and 1998 PCRs, and Handbook of population census data of Punjab, 1987.
In a population, the estimates of marital status by sex for all ages are expected to be very close to each other (Soomro, 2003: 147). The apparent difference in the
Asad Ali Khan Changing Pattern of
385
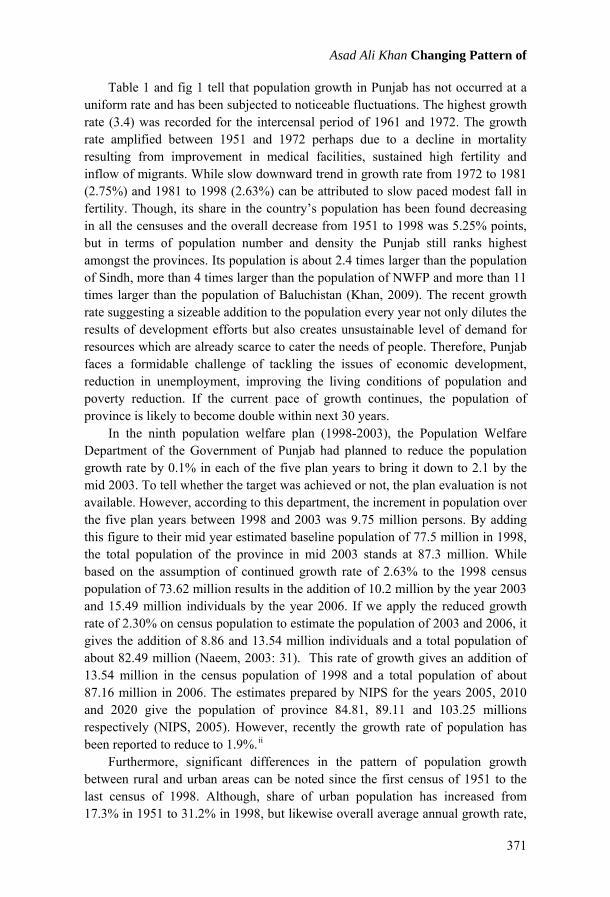
same age group can be explained by the difference in age at marriage of two sexes.xv On comparing the age-specific marital status distribution of two sexes, it appears that difference between them narrows down up to the age group of 35-44 years and after that it again starts widening. In fact, after the age 50 years the chances of getting married for females become fewer than males. The proportion of never married is at the peak in age group 15-19 and then it tapers off sharply in higher age groups. Whereas, the proportion of married increases sharply to the age group of 45-49 for males and 35-39 for females and starts tapering off gradually (table 9). The lower proportion of widowed males (3.8%) than females (8.2%) may be attributed to Punjab’s culture where more widowed men tend to marry than widowed women.
Fig 4: Age specific percentage distribution of widowed and divorced population in the Punjab
0
5
10
15
20
25
30
35
40
45
15-19 20-24 25-29 30-34 35-39 40-44 45-49 50-54 55-59 60+ All ages
Age groups
Per
cent
age
of p
opul
atio
n
Widow ed MaleWidow ed FemaleDivorced MaleDivorced Female
Data source: 1998 Provincial census report of Punjab.
The Proportion of widowed and divorced females also seems to be higher than males at all age levels which may be reflective of the higher male mortality than females and lesser rate of remarriage among females than males. The incidence of widowhood increases with age and shows a positive relationship with age of both the sexes but more to females (fig 4).
Marital Status of Reproductive Age Females Although, all the previously mentioned aspects of marital status, in one way or another, can affect fertility but the marital status of reproductive age females can play a leading role in influencing birth rate. According to NIPS (2001) 22.3% of the total population of Punjab consisted of reproductive age females. According to 1998 census 46.1% of the total female population was in reproductive age compared to 43.8% in 1981. The census data indicates slightly higher proportion of reproductive age females in urban than in rural areas which was 48.9 and 44.9%
South Asian Studies 26 (2)
386
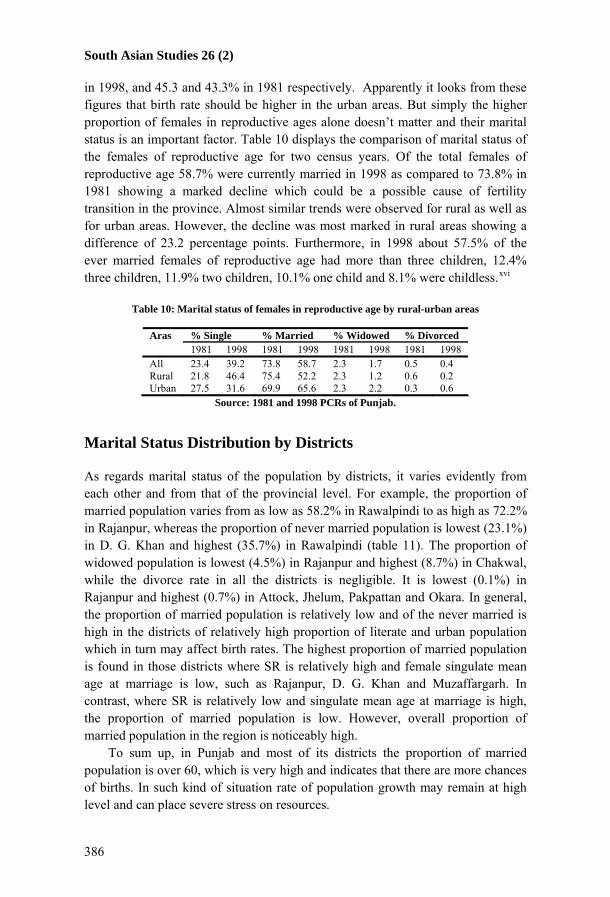
in 1998, and 45.3 and 43.3% in 1981 respectively. Apparently it looks from these figures that birth rate should be higher in the urban areas. But simply the higher proportion of females in reproductive ages alone doesn’t matter and their marital status is an important factor. Table 10 displays the comparison of marital status of the females of reproductive age for two census years. Of the total females of reproductive age 58.7% were currently married in 1998 as compared to 73.8% in 1981 showing a marked decline which could be a possible cause of fertility transition in the province. Almost similar trends were observed for rural as well as for urban areas. However, the decline was most marked in rural areas showing a difference of 23.2 percentage points. Furthermore, in 1998 about 57.5% of the ever married females of reproductive age had more than three children, 12.4% three children, 11.9% two children, 10.1% one child and 8.1% were childless.xvi
Table 10: Marital status of females in reproductive age by rural-urban areas
% Single % Married % Widowed % Divorced Aras 1981 1998 1981 1998 1981 1998 1981 1998
All 23.4 39.2 73.8 58.7 2.3 1.7 0.5 0.4 Rural 21.8 46.4 75.4 52.2 2.3 1.2 0.6 0.2 Urban 27.5 31.6 69.9 65.6 2.3 2.2 0.3 0.6
Source: 1981 and 1998 PCRs of Punjab.
Marital Status Distribution by Districts As regards marital status of the population by districts, it varies evidently from each other and from that of the provincial level. For example, the proportion of married population varies from as low as 58.2% in Rawalpindi to as high as 72.2% in Rajanpur, whereas the proportion of never married population is lowest (23.1%) in D. G. Khan and highest (35.7%) in Rawalpindi (table 11). The proportion of widowed population is lowest (4.5%) in Rajanpur and highest (8.7%) in Chakwal, while the divorce rate in all the districts is negligible. It is lowest (0.1%) in Rajanpur and highest (0.7%) in Attock, Jhelum, Pakpattan and Okara. In general, the proportion of married population is relatively low and of the never married is high in the districts of relatively high proportion of literate and urban population which in turn may affect birth rates. The highest proportion of married population is found in those districts where SR is relatively high and female singulate mean age at marriage is low, such as Rajanpur, D. G. Khan and Muzaffargarh. In contrast, where SR is relatively low and singulate mean age at marriage is high, the proportion of married population is low. However, overall proportion of married population in the region is noticeably high.
To sum up, in Punjab and most of its districts the proportion of married population is over 60, which is very high and indicates that there are more chances of births. In such kind of situation rate of population growth may remain at high level and can place severe stress on resources.

Asad Ali Khan Changing Pattern of
387
Table 11: Marital status by districts and district Districts % Married % Never married % Widowed % Divorced Hafizabad 60.0 32.8 6.7 0.5 Khushab 60.8 32.1 6.5 0.6 Jhelum 59.5 32.6 7.2 0.7 Bhakkar 62.2 32.0 5.4 0.4 Mianwali 62.0 31.5 6.0 0.5 Chakwal 59.2 30.8 8.7 1.3 Rajanpur 72.2 32.2 4.5 0.1 Layyah 63.6 30.7 5.4 0.3 Mandi Bahauddin 60.9 31.6 7.5 0.4 Lodhran 67.3 26.5 5.8 0.4 Narowal 67.8 32.4 6.4 0.4 Attock 60.5 31.7 7.1 0.7 Pakpattan 61.8 31.0 6.5 0.7 T. T. Singh 59.5 33.8 6.2 0.5 D. G. Khan 72.1 23.1 4.6 0.2 Sahiwal 58.8 34.3 6.3 0.6 Gujrat 60.2 32.2 7.0 0.6 Bahawalnagar 66.2 28.0 5.5 0.4 Khenewal 61.7 31.7 6.2 0.4 Vehari 62.3 30.9 6.3 0.5 Okara 62.1 30.7 6.5 0.7 Kasur 62.1 31.6 5.9 0.4 Bahawalpur 66.2 28.0 5.5 0.4 Muzaffargarh 70.1 24.1 5.4 0.4 Sargodha 61.2 31.7 6.6 0.5 Sialkot 60.1 33.8 5.8 0.3 Jhang 62.2 30.5 6.7 0.6 Multan 63.4 30.7 5.6 0.4 R. Y. Khan 66.7 27.4 5.6 0.2 Sheikhupura 60.8 32.8 6.0 0.4 Rawalpindi 58.2 35.7 5.7 0.4 Gujranwala 60.1 34.2 5.5 0.2 Faisalabad 59.1 34.6 5.9 0.4 Lahore 58.6 36.2 4.9 0.3 Punjab 61.8 31.8 6.0 0.4
Source: 1998 DCRs of Punjab; and NIPS, Pakistan population data sheet 2001. Socio-Cultural Structure The current population of Punjab is composed of several castes and ethnic groups having different norms and taboos that may variably influence population growth. Although people belonging to different language groups reside in the region, Punjabi is, however, the dominating language spoken by over three-fourth of the population. Saraiki in southern and south western parts is the most commonly spoken language. Other languages spoken in the region are very limited. Among them, Urdu serves as medium of communication between different ethnic groups and also bears the status of national language (table 12). On the basis of castes and languages highly assorted situation prevails over the region. Punjab can thus be viewed as a heterogeneous region.

South Asian Studies 26 (2)
388
Table 12: Linguistic and religious composition of population
All areas % Rural % Urban % Language spoken Both Male Female Both Male Female Both Male Female Punjabi 75.23 75.01 75.46 73.62 73.30 73.97 78.75 78.69 78.82 Saraiki 17.36 17.48 17.27 21.44 21.71 21.16 8.38 8.37 8.40 Urdu 4.54 4.49 4.53 1.99 2.00 1.99 10.05 9.88 10.25 Pushto 1.16 1.22 1.09 0.86 0.87 0.85 1.81 1.97 1.63 Balochi 0.66 0.67 0.64 0.90 0.92 0.87 0.13 0.14 0.13 Sindhi 0.13 0.14 0.12 0.15 0.16 0.15 0.09 0.11 0.06 Others 0.95 0.97 0.92 1.02 1.03 1.01 0.77 0.84 0.70 Religion Muslims 97.22 97.21 97.22 97.66 97.64 97.68 96.25 96.30 96.20 Christian 2.31 2.32 2.30 1.87 1.89 1.85 3.27 3.24 3.30 Hindu 0.12 0.12 0.12 0.15 0.15 0.15 0.06 0.06 0.06 Ahmadi 0.25 0.24 0.25 0.19 0.19 0.19 0.37 0.35 0.38 Scheduled castes
0.03 0.03 0.03 0.04 0.04 0.04 0.01 0.01 0.01
Others 0.06 0.06 0.06 0.08 0.08 0.08 0.03 0.03 0.03 Source: 1998 PCR of Punjab, 2001.
Notwithstanding, the most powerful factor binding the people together is
neither race nor language but the common heritage of their Islamic religion (Johnson, 1979). At present 97.22% inhabitants are Muslims (table 12). Islam is the source of fundamental values of their life and has pervasive influence on most of the aspects of people living in Pakistan. It has molded some of the basic cultural traditions like beliefs, sanctions, institutions and ceremonials (Baloch, 1965; and Wilber, 1964). It influences customs, marriages, education, diet, celebration of festivals and demographic behaviour as well and, therefore, is an important consideration in implementing various policies. Though, Islamic norms emphasize on simplicity but some social events like marriages are mostly celebrated in colorful manner. Most of the marriages are arranged by the parents and usually start with the social custom of betrothal. Civil marriages are rare and normally disliked by the society. The birth of male child is celebrated with great pleasure but on female birth no rejoicings are expressed by the family. Joint family system is most prevalent in Punjab particularly in its rural areas, but nuclear family system is rapidly emerging with changing socio-economic conditions and attitudes of the people.xvii
In sum Punjab can be viewed as a distinctive region with regard to its demographic shape and socio-cultural setup. High rate of population growth, highly variable size of the population of districts, young age structure, high age dependency ratio, higher proportion of male population, higher proportion of married population, and heterogeneity in castes and languages are some of its distinguishing features. Conclusion Examination of population growth indicates that although rate of growth is gradually declining but still it is high enough to strain resources of the region. Rapid growth of population is also causing changes in the spatial distribution of

Asad Ali Khan Changing Pattern of
389
population and increasing density of population in all the districts immensely. Analysis of age structure yielded that proportion of young age (0-14 years) population is over 40%. Because of the high proportion of children, the population of Punjab can be termed as ‘young’. Study of sex ratio revealed that there are more males in the population than females but the gap is narrowing down gradually and my close down in future. Showing downward trend, dependency ratio is still considerably high that is an indication of massive burden on earning age population. This clearly indicates that region is under a considerable economic stress. Proportion of never married population is on the rise and married population is on the decrease. Widowed population has shown decline and divorced population has shown slight rise. This is an indication that slowly population has started its journey towards the onset of the process of population stabilization in the region. However, it is much needed for the better management of the resources of the region that our planners and policy makers should be cognizant to give due consideration to all these demographic profile shaping factors in policy matters of the national as well as of the local level. Notes
1. Term region for this study means the entire province of Punjab. 2. As law of 70 tells, that is 70 divided by growth rate (2.63) = population doubling
time. 3. 3. Govt. of Pakistan, 2005, Economic Survey 2004-05, Finance Division,
Economic Advisor’s Wing, Islamabad. 4. At the time of last census of Pakistan total number of the districts of the Punjab
was 34 while by the addition of two new districts namely Nankana Sahib and Chiniot current number of its districts is 36.
5. 1981 Census Report of Punjab Province, 1984, Population Census Organization, Islamabad.
6. For example, from age-sex distribution, estimates of school age population can be made and on that basis one may arrive at an estimate of the number of educational institutions, teachers, textbooks, playgrounds etc.
7. 1998 & 1981 Provincial Census Reports of Punjab, Population Census Organization, Islamabad.
8. 1998 District Census Reports of Punjab, Population Census Organization, Islamabad.
9. Ageing index refers to the proportion of aged population in relation to young population and calculated as; aged population of 65 years and above X 100 / young population of 0-14 years. A population with ageing index of 15 or below is considered as young, with 15 to 30 is intermediate and above 30 is old.
10. Dependency ratio (DR) or ratio between dependent age population and working age population refers to the proportion of combined population of children that are under age 15 and aged that are over age 64 to that of the adults aged 15 to 64. DR of 60 and above is considered a burden. If it increases further, then a decreasing number of working age population has to look after an increasing number of dependents.
11. Sex ratio refers to the proportion of males and females in a population or the number of males or females for every 100 or 1000 females or males. 1998 census of Pakistan used the definition, number of males/100 females.
South Asian Studies 26 (2)
390
12. Marriageable age. (2008). (http://en.wikipedia.org/wiki/Marriageable_age#Asia accessed on May 13.
13. 1981 Census Report of Punjab Province, 1984, Population Census Organization, Islamabad, p. 13.
14. NIPS, 2001, Pakistan Population Data Sheet. 15. Pakistan Fertility and Family Planning Survey 1996-97, NIPS, 1998, Islamabad. 16. In Punjab men usually marry with the women younger than them. 17. 1998 Provincial Census Report of Punjab, 2001, Population Census Organization,
Islamabad, p. 136. 18. 1998 Provincial Census Report of Punjab, 2001, Population Census Organization
of Pakistan. References Ahmed, Tauseef. and Ali, S. M. (1992). Characteristics of Households and Respondents. A
Chapter in ‘Pakistan Demographic and Health Survey 1990/91’. Islamabad: National Institute of Population Studies (NIPS). pp. 19-34.
Ali, S. M. and. Sultan, M. (2003). Age and Sex Distribution of 1998 Census: An Evaluation. A Chapter in ‘Population of Pakistan: An Analysis of 1998 Population and Housing Census’, Islamabad: PIDE. pp. 95-115.
Baloch, N. A. (1965). The Traditional Cultures in West Pakistan. in Anwar S. Dil. Perspectives on Pakistan. Abbotabad Book Service. pp. 167-202.
Cheung, P. et al. (1985). Cultural Variations in the Transition to Marriages in Four Asian Societies. in International Population Conference. Florence. Vol. 3. Liege. International Union for Scientific Study of Population. pp. 979-1004.
Clarke, John. I. (1972). Population Geography (2nd ed.). Oxford: Pergamon Press. Hakim, A. et al. (1998). Pakistan Fertility and Family Planning Survey (Main Report) 1996-
97. Islamabad: NIPS. Hakim, A. et al. (2001). Pakistan Reproductive and Health Survey 2000-01. Islamabad:
NIPS. Hijnal, J. (1965). European Marriage Pattern in Perspectives. in Essays in Historical
Demography. London: Adward Arnold Press. Johnson, B. L. C. (1979). Pakistan. London: Heinemann. Khan, A. A. (2009). Is fertility in less developed rapidly growing regions really influenced
by literacy rate and age at marriage? A case of Punjab, Pakistan. Journal of South Asian Studies. (24)1. Lahore: University of the Punjab. pp. 121-146.
Khan, F. K. (1998). Economic Geography (11th ed.). Karachi: Saleem Publishing House. Khan, F. K. (2002). Pakistan: Geography, Economy and People (revised ed). Karachi:
Oxford University Press. Khan, Rana Insaf Ali. (1986). Population Size, Growth and its Distribution. in A Population
Profile of Pakistan. Islamabad: PCO. pp. 21-25. Khan, Rana Insaf Ali. (2003). Spatial Distribution of Population with Special Reference to
1998 Marriageable age. (2008). (http://en.wikipedia.org/wiki/Marriageable_age#Asia accessed on
May 13. Naeem, Jamila. (2003). Socio Economic and Demographic Profile of Punjab. Islamabad:
PIDE. NIPS (1992). Pakistan Demographic and Health Survey (PDHS) 1990-91. Islamabad. NIPS. (1998). PFFPS 1996-97. Main Report. Islamabad. NIPS. (2001). Pakistan Population Data Sheet 2001. Islamabad. NIPS. (2005). Population Growth & Its Implications. Islamabad. July 2005. Pakistan, Govt. of. (2005). Pakistan Demographic Survey. Islamabad: FBS.

Asad Ali Khan Changing Pattern of
391
PCO. (1984). 1981 Census Report of Punjab Province. Islamabad. PCO. (1986). A Population Profile of Pakistan. Islamabad. PCO. (1998). District Census Reports of Punjab. Islamabad. PCO. (1999). 1998 District Census Report of Bahawalpur. Islamabad. PCO. (2001). 1998 Provincial Census Report of Punjab. Islamabad. Population Census. A Chapter in ‘Population of Pakistan: An Analysis of 1998 Population
and Housing Census’. Islamabad: PIDE. pp. 181-203. Rukanuddin, Abdul Razzaaque and Farooqui, M. N. I. (1988). The State of Population in
Pakistan 1987. Islamabad: NIPS. Sathar, Zeba A. (1979). Rural Urban Fertility Differentials in Pakistan: 1975. The Pakistan
Development Review. (16)4. Slade, E. H. (1951). Census of Pakistan Report and Table. Vol. 1. Soomro, G. Y. (2003). Levels and Trends of Nuptiality in Pakistan. A Chapter in
‘Population of Pakistan: An Analysis of 1998 Population and Housing Census’. Islamabad: PIDE. pp. 145-162.
Weeks, John R. (1986). Population: An Introduction to Concepts and Issues (3rd ed.). California: Wadsworth Publishing Company.
Wilber, Donald N. (1964). Pakistan: Its People, Its Society, Its Culture. London: New Haven Harf Press.
World Population Data Sheet, 2005. (2005). New York: Population Reference Bureau. Yusuf, Farhat and Retherford, R. P. (1981). Urban-Rural Fertility Differentials in Pakistan,
Journal of Biosocial Sciences (13) 4. pp. 491-99. Biographical Note Dr. Asad Ali Khan is Associate Professor at Department of Geography, The Islamia University of Bahawalpur, Bahawalpur-Pakistan