changing corporate tax rates impacts on the risk level of
TRANSCRIPT

Open Research Journal of Accounting and Taxation Vol. 1, No. 1, September 2013, PP: 01 -23
Available online http://scitecpub.com/Journals.php
1 Copyright © scitecpub.com, all rights reserved.
Research article
Changing Corporate Tax Rates Impacts On The
Risk Level of Viet Nam Consumer Good Firms
Dinh Tran Ngoc Huy 1
E-mail: [email protected]
__________________________________________________________________________________________
ABSTRACT This study analyzes the impacts of tax policy on market risk for the listed firms in the Viet Nam consumer good
industry as it becomes necessary. First, by using quantitative and analytical methods to estimate asset and equity
beta of total 121 listed companies in Viet Nam consumer good industry with a proper traditional model, we
found out that the beta values, in general, for many companies are acceptable. Second, under 3 different scenarios of changing tax rates (20%, 25% and 28%), we recognized that there is not large disperse in equity
beta values, estimated at 0,690, 0,694 and 0,697.These values are lower than those of the listed VN construction
firms. Third, by changing tax rates in 3 scenarios (25%, 20% and 28%), we recognized equity /asset beta mean
increase if tax rate increases from 20% to 25%, then goes up to 28%. Finally, this paper provides some
outcomes that could provide companies and government more evidence in establishing their policies in
governance.
KEYWORDS: equity beta, financial structure, financial crisis, risk, tax rate, consumer good industry
JEL CLASSIFICATION : G010, G100, G390
__________________________________________________________________________________________
1. Introduction Throughout many recent years, Viet Nam consumer good industry is considered as one of active economic
sectors, which has certain positive effect for the economy. This paper is organized as follow. The research issues
and literature review will be covered in next sessions 2 and 3, for a short summary. Then, methodology and
conceptual theories are introduced in session 4 and 5. Session 6 describes the data in empirical analysis. Session
7 presents empirical results and findings. Next, session 8 covers the analytical results. Then, session 9 presents
analysis of risk. Lastly, session 10 will conclude with some policy suggestions. This paper also supports readers
with references, exhibits and relevant web sources.
2. Research Issues
We mention some issues on the estimating of impacts of tax rates on beta for listed consumer good companies in
Viet Nam stock exchange as following:
1 MBA, PhD candidate, Banking University, HCMC – GSIM, International University of Japan, Japan, [email protected]

Open Research Journal of Accounting and Taxation Vol. 1, No. 1, September 2013, PP: 01 -23
Available online http://scitecpub.com/Journals.php
2 Copyright © scitecpub.com, all rights reserved.
Issue 1: Whether the risk level of consumer good firms under the different changing scenarios of tax rates
increase or decrease so much. Issue 2: Whether the disperse distribution of beta values become large in the different changing scenarios of tax
rates estimated in the consumer good industry.
3. Literature review Smith (2004) mentions in Chicago, properties located in a designated TIF (tax increment financing) district will
exhibit higher rates of appreciation after the area is designated a qualifying TIF district when compared to those
properties selling outside TIF districts, and when compared to properties that sell within TIF district boundaries
prior to designation. Mihir and James (2004) stated that the sizable U.S. taxation of foreign investment income
is inconsistent with promoting efficient ownership of capital assets. Then, Vikas and David (2008) said that the change in the tax law, by itself did not cause the housing bubble but
other factors play a larger role, such as: a failure by regulators to intervene. Klara (2009) found evidence of a
positive relationship between income tax rates and the size of the shadow economy. And positive effects are
reinforced when tax changes are accompanined by improving government services and strengthening legal
system.
Vieri et all (2011) found out tax system could affect economic factors that trigger the financial crisis, such as:
mortgage interest, management performance – based remuneration, and securitization process. Thomas et all
(2011) recognized that tax incentives may indeed have exacerbated the behaviour of economic agents, leading
them to wrong economic decision. George and Jot Yau (2012) found that there is a positive relationship between
transaction cost and price volatility, suggesting that the imposition of a transaction tax could increase financial
market fragility, increasing the likelihood of a financial crisis rather than reducing it.
Next, Ruud et all (2013) said that greater tax bias is associated with significantly higher aggregate bank
leverage, and this in turn is associated with a significantly greater chance of crisis.
Then, Sung, Mark and Laura (2013) also indicated that business property values are more responsive to changes
in tax rates as compared to residential property.
Finally, tax rate can be considered as one among many factors that affect business risk of construction material
firms.
4. Conceptual theories
The impact of fiscal policy on the economy
Tax policy is one among major fiscal policies. In a specific industry such as construction material industry, on
the one hand, using tax policy with a decrease or increase in tax rate could affect tax revenues, profit after tax,
demand, the allocation of economic resources and financial results and compensation and jobs of the industry.
Beside, using tax policies and rules could affect the excessive using of leverage or debt, as well as the number of
financial transactions in businesses and the economy. On the other hand, using tax incentives will help the
companies to obtain more resources and generate growth.
In the financial crisis 2007-2009, tax policy are not the cause whereas the government could use it to help the
economy and business. However, we might note that the wrong use of tax policy might partly cause the crisis
impacts become more serious.
5. Methodology
In this research sample, we use the live data from the stock exchange market in Viet Nam (HOSE and HNX)
during the four or five years period 2007-2011 to estimate systemic risk results and tax impacts. In this
research, analytical research method is used, philosophical method is used and specially, tax rate scenario
analysis method is used. Analytical data is from the situation of listed consumer good firms in VN stock
exchange and cuurent tax rate is 25%. Finally, we use the results to suggest policy for both these enterprises,
relevant organizations and government.
6. General Data Analysis
The study has 121 listed firms in the consumer good market with the live data from the stock exchange.

Open Research Journal of Accounting and Taxation Vol. 1, No. 1, September 2013, PP: 01 -23
Available online http://scitecpub.com/Journals.php
3 Copyright © scitecpub.com, all rights reserved.
Firstly, we estimate equity beta values of these firms and use financial leverage to estimate asset beta values of
them. Secondly, we change the tax rate from 25% to 28% and 20% to see the sensitivity of beta values. In 3 cases (rate = 20%, 25%, and 28%), asset beta mean is estimated at 0,334, 0,336 and 0,338. Also in 3 scenarios,
we find out var of asset beta estimated at 0,066 (almost the same) which shows small risk dispersion. Tax rate
changes almost has no effect on asset beta var under financial leverage.
7. Empirical Research Findings and Discussion In the below section, data used are from total 121 listed consumer good companies on VN stock exchange
(HOSE and HNX mainly). In the scenario 1, current tax rate is 25% which is used to calculate market risk
(beta). Then, two (2) tax rate scenarios are changed up to 28% and down to 20%, compared to the current
corporate tax rate.
Market risk (beta) under the impact of tax rate, includes: 1) equity beta; and 2) asset beta.
7.1 Scenario 1: current tax rate is 25%
In the case of tax rate of 25%, all beta values of 121 listed firms on VN consumer good market as following:
Table 1: Market risk of listed companies on VN consumer good market (t = 25%)
Order
No.
Company stock
code Equity beta Asset beta (assume debt beta = 0)
1 AAM 0,650 0,569
2 ABT 0,852 0,660
3 ACL 1,115 0,383
4 AGC 1,020 0,051
5 AGD 0,545 0,201
6 AGF 0,881 0,365
7 AGM 0,444 0,148
8 ANV 1,108 0,809
9 ASA 0,637 0,369
10 ASM 0,856 0,348
11 ATA 1,573 0,341
12 AVF 0,255 0,060
13 BAS 1,200 0,545
14 BBC 1,236 0,895
15 BHS 0,957 0,435
16 BLF 0,903 0,177
17 CAD 1,384 -0,023
18 CAN 0,505 0,234
19 CFC -0,150 -0,085
20 CLC 0,579 0,202
21 CLP 0,223 0,071
22 CMC 1,530 1,151
23 CMX 0,091 0,015
24 CSM 1,803 0,553
25 DBC 0,994 0,371
26 DBF 0,147 0,076
27 DCS 1,492 1,018
28 DNF 0,441 0,105
29 DQC 1,089 0,479
30 DRC 1,823 1,093
31 EVE 0,079 0,066
32 FBA 0,493 0,355

Open Research Journal of Accounting and Taxation Vol. 1, No. 1, September 2013, PP: 01 -23
Available online http://scitecpub.com/Journals.php
4 Copyright © scitecpub.com, all rights reserved.
33 FBT 0,477 0,156
34 FDG 0,233 0,045
35 FMC 0,878 0,232
36 GDT 0,562 0,418
37 GFC 0,131 0,015
38 GGG 1,410 0,341
39 GIL 0,783 0,415
40 GLT 0,687 0,483
41 GMC 1,033 0,434
42 HAD 1,020 0,813
43 HAT 0,827 0,659
44 HAX 1,115 0,410
45 HDM 0,534 0,086
46 HFX -0,648 0,275
47 HHC 1,023 0,612
48 HLG 0,762 0,226
49 HNM 0,840 0,522
50 HTL 0,734 0,482
51 HVG 0,626 0,225
52 ICF 0,916 0,414
53 IFS 0,889 0,375
54 KDC 0,477 0,337
55 KMR 0,670 0,474
56 KSC 0,420 0,340
57 KSD 0,265 0,106
58 KTS 0,387 0,241
59 LAF 1,248 0,558
60 LIX 0,346 0,220
61 LSS 1,327 0,917
62 MCF 0,094 0,027
63 MEF 0,325 0,143
64 MPC 1,140 0,326
65 MSN 1,503 0,841
66 NET 0,357 0,246
67 NGC 0,687 0,113
68 NHS 0,381 0,190
69 NPS 0,984 0,427
70 NSC 0,910 0,578
71 NST 0,887 0,264
72 PID 0,316 0,220
73 PNJ 0,643 0,262
74 PSL 0,259 0,193
75 PTB 0,122 0,032
76 PTG 0,391 0,194
77 RAL 0,883 0,306
78 S33 0,267 0,068
79 SAF 0,888 0,524
80 SAV 0,820 0,406
81 SBT 0,855 0,716
82 SCD 0,738 0,546

Open Research Journal of Accounting and Taxation Vol. 1, No. 1, September 2013, PP: 01 -23
Available online http://scitecpub.com/Journals.php
5 Copyright © scitecpub.com, all rights reserved.
83 SEC 0,738 0,295
84 SGC 0,596 0,448
85 SHV 0,199 0,043
86 SJ1 0,635 0,408
87 SLS 0,179 0,077
88 SMB 0,143 0,048
89 SPD 0,174 0,033
90 SRC 2,056 0,753
91 SSC 0,959 0,727
92 SSF 0,157 0,067
93 SVC 1,301 0,401
94 TAC 1,076 0,393
95 TCM 1,302 0,462
96 TET 0,346 0,296
97 THB 0,976 0,608
98 THV 0,301 0,056
99 TLG 0,632 0,326
100 TMT 0,388 0,200
101 TMW 0,293 0,115
102 TNA 1,066 0,378
103 TNG 1,135 0,310
104 TRI 1,014 0,111
105 TS4 1,592 0,614
106 TTG 0,429 0,358
107 VCF 0,996 0,840
108 VDL 0,810 0,534
109 VDN 0,034 0,003
110 VHC 1,103 0,584
111 VHF 0,157 0,060
112 VIA 0,387 0,337
113 VKC 0,122 0,047
114 VKD 0,095 0,051
115 VLF 0,100 0,031
116 VNH 0,547 0,256
117 VNM 0,475 0,369
118 VTF 0,517 0,231
119 VTI 0,023 0,003
120 VTL 0,620 0,211
121 WSB 0,127 0,097
7.2. Scenario 2: tax rate increases up to 28%
If corporate tax rates increases up to 28%, all beta values of total 121 listed firms on VN consumer good market
as below:
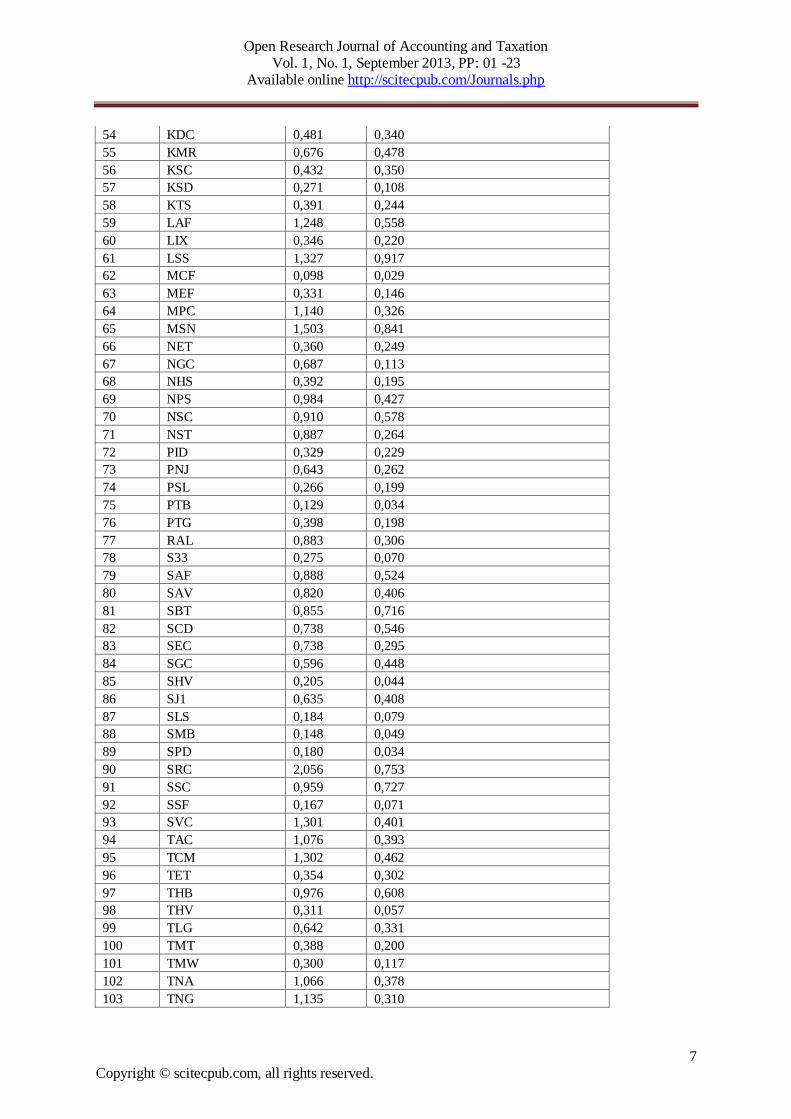
Table 2: Market risks of listed consumer good firms (t = 28%)
Order
No.
Company stock
code Equity beta Asset beta (assume debt beta = 0)
1 AAM 0,650 0,569
2 ABT 0,852 0,660
3 ACL 1,115 0,383

Open Research Journal of Accounting and Taxation Vol. 1, No. 1, September 2013, PP: 01 -23
Available online http://scitecpub.com/Journals.php
6 Copyright © scitecpub.com, all rights reserved.
4 AGC 1,020 0,051
5 AGD 0,545 0,201
6 AGF 0,881 0,365
7 AGM 0,455 0,151
8 ANV 1,108 0,809
9 ASA 0,646 0,375
10 ASM 0,856 0,348
11 ATA 1,573 0,341
12 AVF 0,263 0,062
13 BAS 1,200 0,545
14 BBC 1,236 0,895
15 BHS 0,957 0,435
16 BLF 0,903 0,177
17 CAD 1,384 -0,023
18 CAN 0,505 0,234
19 CFC -0,150 -0,085
20 CLC 0,579 0,202
21 CLP 0,229 0,073
22 CMC 1,530 1,151
23 CMX 0,097 0,016
24 CSM 1,803 0,553
25 DBC 0,994 0,371
26 DBF 0,153 0,079
27 DCS 1,492 1,018
28 DNF 0,454 0,108
29 DQC 1,089 0,479
30 DRC 1,823 1,093
31 EVE 0,085 0,071
32 FBA 0,505 0,363
33 FBT 0,477 0,156
34 FDG 0,240 0,047
35 FMC 0,878 0,232
36 GDT 0,562 0,418
37 GFC 0,136 0,016
38 GGG 1,410 0,341
39 GIL 0,783 0,415
40 GLT 0,687 0,483
41 GMC 1,033 0,434
42 HAD 1,020 0,813
43 HAT 0,832 0,664
44 HAX 1,115 0,410
45 HDM 0,534 0,086
46 HFX -0,694 0,294
47 HHC 1,023 0,612
48 HLG 0,762 0,226
49 HNM 0,840 0,522
50 HTL 0,742 0,488
51 HVG 0,626 0,225
52 ICF 0,916 0,414
53 IFS 0,907 0,383
Open Research Journal of Accounting and Taxation Vol. 1, No. 1, September 2013, PP: 01 -23
Available online http://scitecpub.com/Journals.php
7 Copyright © scitecpub.com, all rights reserved.
54 KDC 0,481 0,340
55 KMR 0,676 0,478
56 KSC 0,432 0,350
57 KSD 0,271 0,108
58 KTS 0,391 0,244
59 LAF 1,248 0,558
60 LIX 0,346 0,220
61 LSS 1,327 0,917
62 MCF 0,098 0,029
63 MEF 0,331 0,146
64 MPC 1,140 0,326
65 MSN 1,503 0,841
66 NET 0,360 0,249
67 NGC 0,687 0,113
68 NHS 0,392 0,195
69 NPS 0,984 0,427
70 NSC 0,910 0,578
71 NST 0,887 0,264
72 PID 0,329 0,229
73 PNJ 0,643 0,262
74 PSL 0,266 0,199
75 PTB 0,129 0,034
76 PTG 0,398 0,198
77 RAL 0,883 0,306
78 S33 0,275 0,070
79 SAF 0,888 0,524
80 SAV 0,820 0,406
81 SBT 0,855 0,716
82 SCD 0,738 0,546
83 SEC 0,738 0,295
84 SGC 0,596 0,448
85 SHV 0,205 0,044
86 SJ1 0,635 0,408
87 SLS 0,184 0,079
88 SMB 0,148 0,049
89 SPD 0,180 0,034
90 SRC 2,056 0,753
91 SSC 0,959 0,727
92 SSF 0,167 0,071
93 SVC 1,301 0,401
94 TAC 1,076 0,393
95 TCM 1,302 0,462
96 TET 0,354 0,302
97 THB 0,976 0,608
98 THV 0,311 0,057
99 TLG 0,642 0,331
100 TMT 0,388 0,200
101 TMW 0,300 0,117
102 TNA 1,066 0,378
103 TNG 1,135 0,310

Open Research Journal of Accounting and Taxation Vol. 1, No. 1, September 2013, PP: 01 -23
Available online http://scitecpub.com/Journals.php
8 Copyright © scitecpub.com, all rights reserved.
104 TRI 1,014 0,111
105 TS4 1,592 0,614
106 TTG 0,442 0,368
107 VCF 1,001 0,844
108 VDL 0,810 0,534
109 VDN 0,036 0,003
110 VHC 1,103 0,584
111 VHF 0,161 0,062
112 VIA 0,399 0,348
113 VKC 0,128 0,049
114 VKD 0,103 0,055
115 VLF 0,105 0,032
116 VNH 0,557 0,261
117 VNM 0,475 0,369
118 VTF 0,529 0,236
119 VTI 0,024 0,003
120 VTL 0,620 0,211
121 WSB 0,131 0,100
7.3. Scenario 3: tax rate decreases down to 20%
If corporate tax rate decreases down to 20%, all beta values of total 121 listed firms on the consumer good
market in VN as following:
Table 3: Market risk of listed consumer good firms (t = 20%)
Order
No.
Company stock
code Equity beta Asset beta (assume debt beta = 0)
1 AAM 0,650 0,569
2 ABT 0,852 0,660
3 ACL 1,115 0,383
4 AGC 1,020 0,051
5 AGD 0,545 0,201
6 AGF 0,881 0,365
7 AGM 0,427 0,142
8 ANV 1,108 0,809
9 ASA 0,623 0,361
10 ASM 0,856 0,348
11 ATA 1,573 0,341
12 AVF 0,244 0,057
13 BAS 1,200 0,545
14 BBC 1,236 0,895
15 BHS 0,957 0,435
16 BLF 0,903 0,177
17 CAD 1,384 -0,023
18 CAN 0,505 0,234
19 CFC -0,150 -0,085
20 CLC 0,579 0,202
21 CLP 0,214 0,069
22 CMC 1,530 1,151
23 CMX 0,083 0,014
24 CSM 1,803 0,553

Open Research Journal of Accounting and Taxation Vol. 1, No. 1, September 2013, PP: 01 -23
Available online http://scitecpub.com/Journals.php
9 Copyright © scitecpub.com, all rights reserved.
25 DBC 0,994 0,371
26 DBF 0,138 0,071
27 DCS 1,492 1,018
28 DNF 0,421 0,101
29 DQC 1,089 0,479
30 DRC 1,823 1,093
31 EVE 0,072 0,060
32 FBA 0,475 0,342
33 FBT 0,477 0,156
34 FDG 0,222 0,043
35 FMC 0,878 0,232
36 GDT 0,562 0,418
37 GFC 0,124 0,014
38 GGG 1,410 0,341
39 GIL 0,783 0,415
40 GLT 0,687 0,483
41 GMC 1,033 0,434
42 HAD 1,020 0,813
43 HAT 0,818 0,652
44 HAX 1,115 0,410
45 HDM 0,534 0,086
46 HFX -0,583 0,247
47 HHC 1,023 0,612
48 HLG 0,762 0,226
49 HNM 0,840 0,522
50 HTL 0,720 0,473
51 HVG 0,626 0,225
52 ICF 0,916 0,414
53 IFS 0,860 0,363
54 KDC 0,469 0,331
55 KMR 0,659 0,466
56 KSC 0,400 0,324
57 KSD 0,256 0,103
58 KTS 0,379 0,236
59 LAF 1,248 0,558
60 LIX 0,346 0,220
61 LSS 1,327 0,917
62 MCF 0,087 0,025
63 MEF 0,314 0,138
64 MPC 1,140 0,326
65 MSN 1,503 0,841
66 NET 0,351 0,242
67 NGC 0,687 0,113
68 NHS 0,365 0,182
69 NPS 0,984 0,427
70 NSC 0,910 0,578
71 NST 0,887 0,264
72 PID 0,297 0,207
73 PNJ 0,643 0,262
74 PSL 0,247 0,185

Open Research Journal of Accounting and Taxation Vol. 1, No. 1, September 2013, PP: 01 -23
Available online http://scitecpub.com/Journals.php
10 Copyright © scitecpub.com, all rights reserved.
75 PTB 0,112 0,029
76 PTG 0,380 0,189
77 RAL 0,883 0,306
78 S33 0,256 0,065
79 SAF 0,888 0,524
80 SAV 0,820 0,406
81 SBT 0,855 0,716
82 SCD 0,738 0,546
83 SEC 0,738 0,295
84 SGC 0,596 0,448
85 SHV 0,189 0,041
86 SJ1 0,635 0,408
87 SLS 0,170 0,073
88 SMB 0,135 0,045
89 SPD 0,166 0,031
90 SRC 2,056 0,753
91 SSC 0,959 0,727
92 SSF 0,143 0,061
93 SVC 1,301 0,401
94 TAC 1,076 0,393
95 TCM 1,302 0,462
96 TET 0,334 0,285
97 THB 0,976 0,608
98 THV 0,287 0,053
99 TLG 0,615 0,317
100 TMT 0,388 0,200
101 TMW 0,283 0,111
102 TNA 1,066 0,378
103 TNG 1,135 0,310
104 TRI 1,014 0,111
105 TS4 1,592 0,614
106 TTG 0,410 0,342
107 VCF 0,988 0,833
108 VDL 0,810 0,534
109 VDN 0,031 0,003
110 VHC 1,103 0,584
111 VHF 0,151 0,058
112 VIA 0,366 0,319
113 VKC 0,112 0,043
114 VKD 0,084 0,045
115 VLF 0,092 0,028
116 VNH 0,531 0,248
117 VNM 0,475 0,369
118 VTF 0,496 0,222
119 VTI 0,021 0,002
120 VTL 0,620 0,211
121 WSB 0,121 0,093
All three above tables and data show that values of equity and asset beta in the case of increasing tax rate up to
28% or decreasing rate down to 20% have small fluctuation.

Open Research Journal of Accounting and Taxation Vol. 1, No. 1, September 2013, PP: 01 -23
Available online http://scitecpub.com/Journals.php
11 Copyright © scitecpub.com, all rights reserved.
8. Comparing statistical results in 3 scenarios of changing tax rate:
a. tax rate = 25%
Statistic results Equity beta Asset beta (assume debt beta = 0) Difference
MAX 2,056 1,151 0,9046
MIN -0,583 -0,085 -0,4979
MEAN 0,690 0,334 0,3563
VAR 0,2158 0,0663 0,1495
Note: Sample size : 121
b. tax rate = 28%
Statistic results Equity beta Asset beta (assume debt beta = 0) Difference
MAX 2,056 1,151 0,9046
MIN -0,694 -0,085 -0,6084
MEAN 0,697 0,338 0,3589
VAR 0,2134 0,0656 0,1478
Note: Sample size : 121
c. tax rate = 20%
Statistic results Equity beta Asset beta (assume debt beta = 0) Difference
MAX 2,056 1,151 0,9046
MIN -0,583 -0,085 -0,4979
MEAN 0,690 0,334 0,3563
VAR 0,2158 0,0663 0,1495
Note: Sample size : 121
Based on above results, we find out:
Equity beta mean values in all 3 scenarios are acceptable ( <0,7) and asset beta mean values are much
smaller (< 0,4). In the case of current tax rate of 25%, equity beta value fluctuates in a wide range from -
0,583 (min) up to 2,056 (max value is much higher) and asset beta fluctuates from -0,085 (min) up to 1,151
(max). If corporate tax rate increases to 28%, equity beta moves from -0,694 (min) up to 2,056 (max) and
asset beta moves from -0,085 (min) up to 1,151 (max). Hence, we note that there is a little increasing
change in equity beta min value if corporate tax increases. When tax rate decreases down to 20%, equity
beta and asset beta remain unchanged in scenario 3.
Beside, Exhibit 7 informs us that in the case 28% tax rate, average equity beta value of 121 listed firms
increases up to 0,003 while average asset beta value of these 121 firms increase slightly up to 0,002. Then,
when tax rate reduces to 20%, average equity beta value of 121 listed firms reduce to 0,004 and average
asset beta value of 121 firms down to 0,003.
The below chart 1 shows us : when tax rate decreases down to 20%, average equity and asset beta values
decrease slightly (0,690 and 0,334) compared to those at the initial rate of 25% (0,694 and 0,336). At the
same time, when tax rate increases up to 28%, average equity and asset beta increase just slightly (to 0,694
and 0,336). However, the fluctuation of equity beta value (0,216) in the case of 20% tax rate is higher than
(>) the results in the rest 2 tax rate cases.
9. Risk analysis In the case of decreasing tax rate, (20%), the market and companies can receive more benefits such as
generating more jobs and compensation, but the government budget can have deficit and the government has to
cut expenses. Changes in tax rates can have both positive and negative impacts on the local market. In the case
of increasing tax rate (28%), the government will have budget to finance public expenditures but the tax could
reduce both demand and supply. Tax policy can be used for monetary expansionary or contractionary purposes

Open Research Journal of Accounting and Taxation Vol. 1, No. 1, September 2013, PP: 01 -23
Available online http://scitecpub.com/Journals.php
12 Copyright © scitecpub.com, all rights reserved.
as well. The debt level of business sector also needed to be taken into account if the government would like to
change the tax rates.
Chart 1: Comparing statistical results of three (3) scenarios of changing tax rate
0,690
0,334
0,216
0,066
0,694
0,336
0,214
0,066
0,697
0,338
0,2134
0,0656
0,000 0,100 0,200 0,300 0,400 0,500 0,600 0,700 0,800
Equity beta mean
Asset beta mean
Equity beta var
Asset beta var
t = 28%
t = 25%
t = 20%
10. Conclusion and Policy suggestion In summary, the government continues to increase the effectiveness of building the legal system and regulation
and macro policies supporting the plan of developing both the construction and the construction material
market. The Ministry of Finance Continue to increase the effectiveness of fiscal policies and tax policies which
are needed to combine with other macro policies at the same time, although we could note that in this study
when tax rate is going to increase up to 28%, the value of equity beta mean and asset beta mean also increase,
and equity beta var is the highest in the case of tax rate 20%. Certainly, the government bodies could choose
either changing tax rates or cutting public expenditures. The State Bank of Viet Nam continues to increase the
effectiveness of capital providing channels for both construction material and real estate companies. Finally, this
paper suggests implications for further research and policy suggestion for the Viet Nam government and relevant organizations, economists and investors from current market conditions.
REFERENCES [1] Ajinkya, Bijal., and Kumar, Mahesh., (2012), Taxation aspects of Mergers and Acquisitions, Asia-Pacific
Tax Bulletin
[2] Aldeweireldt J., (2012), Tax Treatment of Employee Stock Options: An International Comparison, Tax
Notes International
[3] Beeman, R.E., (2009), A Compendium of Financial Crisis Tax Guidance, Bank Accounting & Finance
[4] Cont, R.. (2010). Empirical properties of Asset Returns: Stylized facts and Statistical Issues. Quantitative
Finance.
[5] Fernandez, Pablo. (2008). Levered and Unlevered Beta. SSRN Working paper series.
[6] Flifel, Kaouther., (2012), Financial Markets between Efficiency and Persistence : Empirical Evidence on
Daily Data, Asian Journal of Finance and Accounting
[7] Grullon, Gustavo., Lyandres, Evgeny., and Zhdanov, Alexei., (2012), Real Options, Volatility and Stock
Returns, Journal of Finance
[8] Hall, B., and Liebman, J., (2000), The Taxation of Executive Compensation, Tax Policy and the Economy
Open Research Journal of Accounting and Taxation Vol. 1, No. 1, September 2013, PP: 01 -23
Available online http://scitecpub.com/Journals.php
13 Copyright © scitecpub.com, all rights reserved.
[9] Huy, Dinh T.N., (2012), Estimating Beta of Viet Nam listed construction companies groups during the crisis,
Journal of Integration and Development
[10] Kimberly, Clausing A., (2012), In Search of Corporate Tax Incidence, Tax Law Review
[11] Ling, Amy., (2013), Tax Issues Relating to Intangibles, Asia-Pacific Tax Bulletin
[12] Pereiro, Luis E.,(2010), The Beta Dilemma in Emerging Markets, Journal of Applied Corporate Finance
[13] Saleem, Kashif., (2011), Time Varying Correlations between Stock and Bond Returns : Empirical Evidence
from Russia, Asian Journal of Finance and Accounting
Research
[14]Ang, A., Chen, J., (2007), CAPM Over the Long Run: 1926-2001, Journal of Empirical Finance
[15] Baker, Kent H., Singleton, Clay J., and Veit, Theodore E., (2011), Survey Research in Corporate Finance:
Bridging The Gap Between Theory and Practice, Oxford University Press
[16] ADB and Viet Nam Fact Sheet, 2010
Other web sources
[17] http://www.ifc.org/ifcext/mekongpsdf.nsf/Content/PSDP22
[18] http://www.mofa.gov.vn/vi/
[19] http://www.hsx.vn/hsx/
[20] www.saigontimes.com.vn;
[21] www.mof.gov.vn ;
[22] www.vneconomy.com.vn ;
[23] www.sbv.gov.vn.

Open Research Journal of Accounting and Taxation Vol. 1, No. 1, September 2013, PP: 01 -23
Available online http://scitecpub.com/Journals.php
14 Copyright © scitecpub.com, all rights reserved.
Exhibit
Exhibit 1 – Interest rates in banking industry during crisis
(source: Viet Nam commercial banks)
Year Borrowing
Interest rates
Deposit
Rates
Note
2011 18%-22% 13%-14%
2010 19%-20% 13%-14% Approximately
(2007: required reserves
ratio at SBV is changed
from 5% to 10%)
(2009: special supporting
interest rate is 4%)
2009 9%-12% 9%-10%
2008 19%-21% 15%-16,5%
2007 12%-15% 9%-11%
Exhibit 2 – Basic interest rate changes in Viet Nam
(source: State Bank of Viet Nam and Viet Nam economy)
Year Basic rate Note
2011 9%
2010 8%
2009 7%
2008 8,75%-14% Approximately, fluctuated
2007 8,25%
2006 8,25%
2005 7,8%
2004 7,5%
2003 7,5%
2002 7,44%
2001 7,2%-8,7% Approximately, fluctuated
2000 9%
Exhibit 3 – Inflation, GDP growth and macroeconomics factors
(source: Viet Nam commercial banks and economic statistical bureau)
Year Inflation GDP USD/VND rate
2011 18% 5,89% 20.670
2010 11,75%
(Estimated at
Dec 2010)
6,5%
(expected)
19.495
2009 6,88% 5,2% 17.000
2008 22% 6,23% 17.700
2007 12,63% 8,44% 16.132
2006 6,6% 8,17%
2005 8,4%
Note approximately

Open Research Journal of Accounting and Taxation Vol. 1, No. 1, September 2013, PP: 01 -23
Available online http://scitecpub.com/Journals.php
15 Copyright © scitecpub.com, all rights reserved.
Exhibit 4: GDP growth Việt Nam 2006-2010 (source: Bureau Statistic)
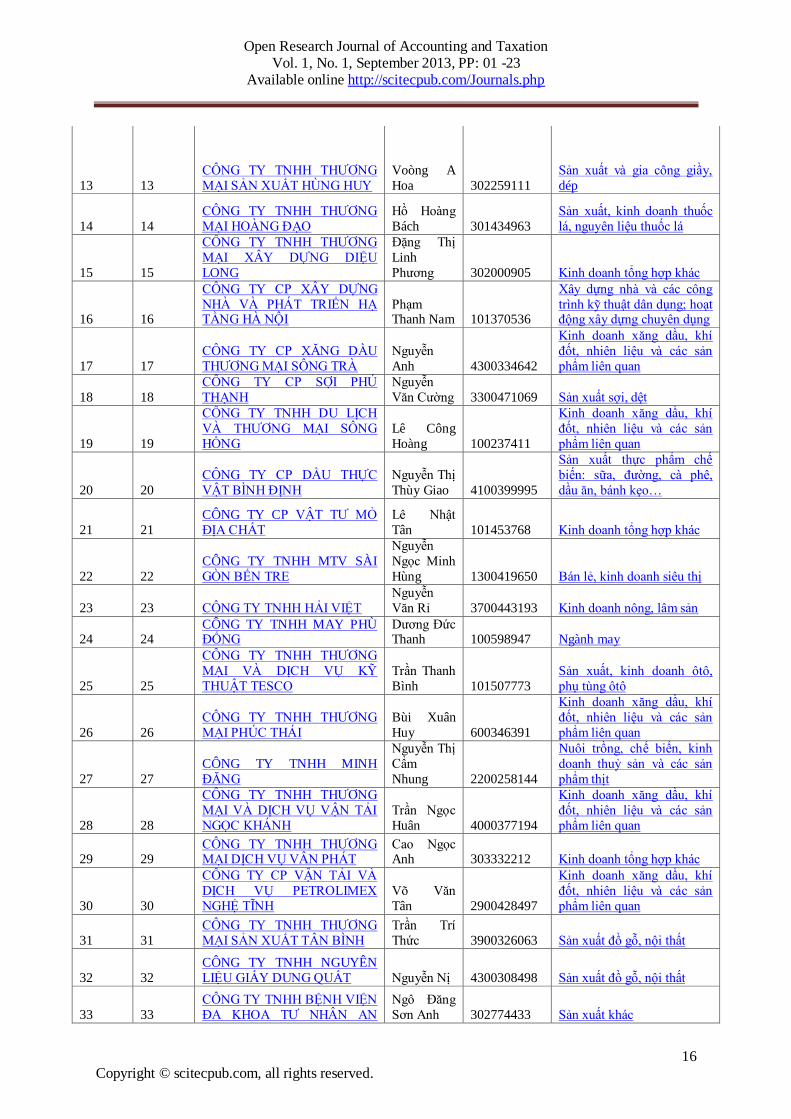
Exhibit 5: Top 40 among top 500 SMEs with the highest growth speed in 2012 (source: Vietnamnet and Viet
Nam report)
Order Rank Company name CEO Tax code Industry
1 1
CÔNG TY CP LÂM SẢN
PISICO QUẢNG NAM
Phan Văn
Cƣờng 4000405162 Kinh doanh nông, lâm sản
2 2
CÔNG TY CP VÀNG BẠC ĐÁ
QUÝ SJC CẦN THƠ
Lê Phát
Vinh 1800636290 Vàng, bạc, đá quý
3 3 CÔNG TY CP SỢI PHÚ NAM
Hoàng Văn
Thám 3300491474 Sản xuất sợi, dệt
4 4
CÔNG TY CP VÀNG BẠC ĐÁ
QUÝ BẾN THÀNH
Tề Trí
Dũng 300847936 Vàng, bạc, đá quý
5 5
CÔNG TY CP MAY CHIẾN
THẮNG
Ninh Thị
Ty 100101058 Ngành may
6 6
CÔNG TY TNHH DU LỊCH
TRẦN VIỆT
Nguyễn
Mạnh
Cƣơng 301069809 Du lịch, khách sạn
7 7 N.A 2012701
8 8
CÔNG TY TNHH TRUYỀN
THÔNG ADT
Đặng Huy
Thắng 100905796 Sản xuất khác
9 9
CÔNG TY CP KẾT NỐI
NHÂN TÀI
Tiêu Yến
Trinh 305202145 Kinh doanh tổng hợp khác
10 10 CÔNG TY TNHH THIẾT LẬP
Nguyễn
Hoàng Ẩn 1500441413
Sản xuất, kinh doanh, chế
biến gạo, bột mỳ, ngũ cốc…
11 11
CÔNG TY TNHH-CHẾ BIẾN
THỦY SẢN VÀ XNK TRANG
KHANH
Trần Tuấn
Khanh 1900287501
Nuôi trồng, chế biến, kinh
doanh thuỷ sản và các sản
phẩm thịt
12 12
CÔNG TY SẢN XUẤT
THƢƠNG MẠI VÀ ĐẦU TƢ
TAM MINH
Lƣu Tuấn
Anh 4300327589 Sản xuất đồ gỗ, nội thất
Open Research Journal of Accounting and Taxation Vol. 1, No. 1, September 2013, PP: 01 -23
Available online http://scitecpub.com/Journals.php
16 Copyright © scitecpub.com, all rights reserved.
13 13
CÔNG TY TNHH THƢƠNG
MẠI SẢN XUẤT HÙNG HUY
Voòng A
Hoa 302259111
Sản xuất và gia công giầy,
dép
14 14
CÔNG TY TNHH THƢƠNG
MẠI HOÀNG ĐẠO
Hồ Hoàng
Bách 301434963
Sản xuất, kinh doanh thuốc
lá, nguyên liệu thuốc lá
15 15
CÔNG TY TNHH THƢƠNG
MẠI XÂY DỰNG DIỆU
LONG
Đặng Thị
Linh
Phƣơng 302000905 Kinh doanh tổng hợp khác
16 16
CÔNG TY CP XÂY DỰNG
NHÀ VÀ PHÁT TRIỂN HẠ TẦNG HÀ NỘI
Phạm Thanh Nam 101370536
Xây dựng nhà và các công
trình kỹ thuật dân dụng; hoạt động xây dựng chuyên dụng
17 17
CÔNG TY CP XĂNG DẦU
THƢƠNG MẠI SÔNG TRÀ
Nguyễn
Anh 4300334642
Kinh doanh xăng dầu, khí
đốt, nhiên liệu và các sản
phẩm liên quan
18 18
CÔNG TY CP SỢI PHÚ
THẠNH
Nguyễn
Văn Cƣờng 3300471069 Sản xuất sợi, dệt
19 19
CÔNG TY TNHH DU LỊCH
VÀ THƢƠNG MẠI SÔNG
HỒNG
Lê Công
Hoàng 100237411
Kinh doanh xăng dầu, khí
đốt, nhiên liệu và các sản
phẩm liên quan
20 20
CÔNG TY CP DẦU THỰC
VẬT BÌNH ĐỊNH
Nguyễn Thị
Thùy Giao 4100399995
Sản xuất thực phẩm chế
biến: sữa, đƣờng, cà phê,
dầu ăn, bánh kẹo…
21 21
CÔNG TY CP VẬT TƢ MỎ
ĐỊA CHẤT
Lê Nhật
Tân 101453768 Kinh doanh tổng hợp khác
22 22
CÔNG TY TNHH MTV SÀI
GÒN BẾN TRE
Nguyễn
Ngọc Minh
Hùng 1300419650 Bán lẻ, kinh doanh siêu thị
23 23 CÔNG TY TNHH HẢI VIỆT
Nguyễn
Văn Rỉ 3700443193 Kinh doanh nông, lâm sản
24 24 CÔNG TY TNHH MAY PHÙ ĐỔNG
Dƣơng Đức Thanh 100598947 Ngành may
25 25
CÔNG TY TNHH THƢƠNG
MẠI VÀ DỊCH VỤ KỸ
THUẬT TESCO
Trần Thanh
Bình 101507773
Sản xuất, kinh doanh ôtô,
phụ tùng ôtô
26 26
CÔNG TY TNHH THƢƠNG
MẠI PHÚC THÁI
Bùi Xuân
Huy 600346391
Kinh doanh xăng dầu, khí
đốt, nhiên liệu và các sản
phẩm liên quan
27 27
CÔNG TY TNHH MINH
ĐĂNG
Nguyễn Thị
Cẩm
Nhung 2200258144
Nuôi trồng, chế biến, kinh
doanh thuỷ sản và các sản
phẩm thịt
28 28
CÔNG TY TNHH THƢƠNG
MẠI VÀ DỊCH VỤ VẬN TẢI
NGỌC KHÁNH
Trần Ngọc
Huân 4000377194
Kinh doanh xăng dầu, khí
đốt, nhiên liệu và các sản
phẩm liên quan
29 29 CÔNG TY TNHH THƢƠNG MẠI DỊCH VỤ VÂN PHÁT
Cao Ngọc Anh 303332212 Kinh doanh tổng hợp khác
30 30
CÔNG TY CP VẬN TẢI VÀ
DỊCH VỤ PETROLIMEX
NGHỆ TĨNH
Võ Văn
Tân 2900428497
Kinh doanh xăng dầu, khí
đốt, nhiên liệu và các sản
phẩm liên quan
31 31
CÔNG TY TNHH THƢƠNG
MẠI SẢN XUẤT TÂN BÌNH
Trần Trí
Thức 3900326063 Sản xuất đồ gỗ, nội thất
32 32
CÔNG TY TNHH NGUYÊN
LIỆU GIẤY DUNG QUẤT Nguyễn Nị 4300308498 Sản xuất đồ gỗ, nội thất
33 33
CÔNG TY TNHH BỆNH VIỆN
ĐA KHOA TƢ NHÂN AN
Ngô Đăng
Sơn Anh 302774433 Sản xuất khác
Open Research Journal of Accounting and Taxation Vol. 1, No. 1, September 2013, PP: 01 -23
Available online http://scitecpub.com/Journals.php
17 Copyright © scitecpub.com, all rights reserved.
SINH
34 34
CÔNG TY TNHH IN LỤA
NHẤT PHƢƠNG
Huỳnh Thị
Thanh
Thuỷ 301441840
Sản xuất giấy, in ấn, xuất
bản
35 35
CÔNG TY CP DẦU KHÍ SÀI
GÒN-PHÚ YÊN
Trần Công
Chƣởng 4400344901
Kinh doanh xăng dầu, khí
đốt, nhiên liệu và các sản
phẩm liên quan
36 36
CÔNG TY CP BÊ TÔNG
ĐĂNG HẢI
Phan Văn
Khanh 400619838
Sản xuất, kinh doanh vật
liệu xây dựng: xi măng,
gạch xây, đá, cát…
37 37
CÔNG TY CP GIÀY BÌNH
ĐỊNH
Võ Ngọc
Thủy 4100258761
Sản xuất và gia công giầy,
dép
38 38
CÔNG TY CP ĐẦU TƢ PHÁT
TRIỂN THIÊN SƠN
Vũ Văn
Tuyên 101536301
Sản xuất, kinh doanh vật
liệu xây dựng: xi măng,
gạch xây, đá, cát…
39 39
HTX THƢƠNG MẠI ĐÔ
THÀNH
Hàng
Thanh Dân 302804374
Kinh doanh thực phẩm chế
biến: sữa, đƣờng, cà phê,
dầu ăn, bánh kẹo……
40 40
CÔNG TY CP XÂY DỰNG
TỔNG HỢP 269
Trƣơng
Duy Niệm 3000244523
Xây dựng nhà và các công
trình kỹ thuật dân dụng; hoạt
động xây dựng chuyên dụng
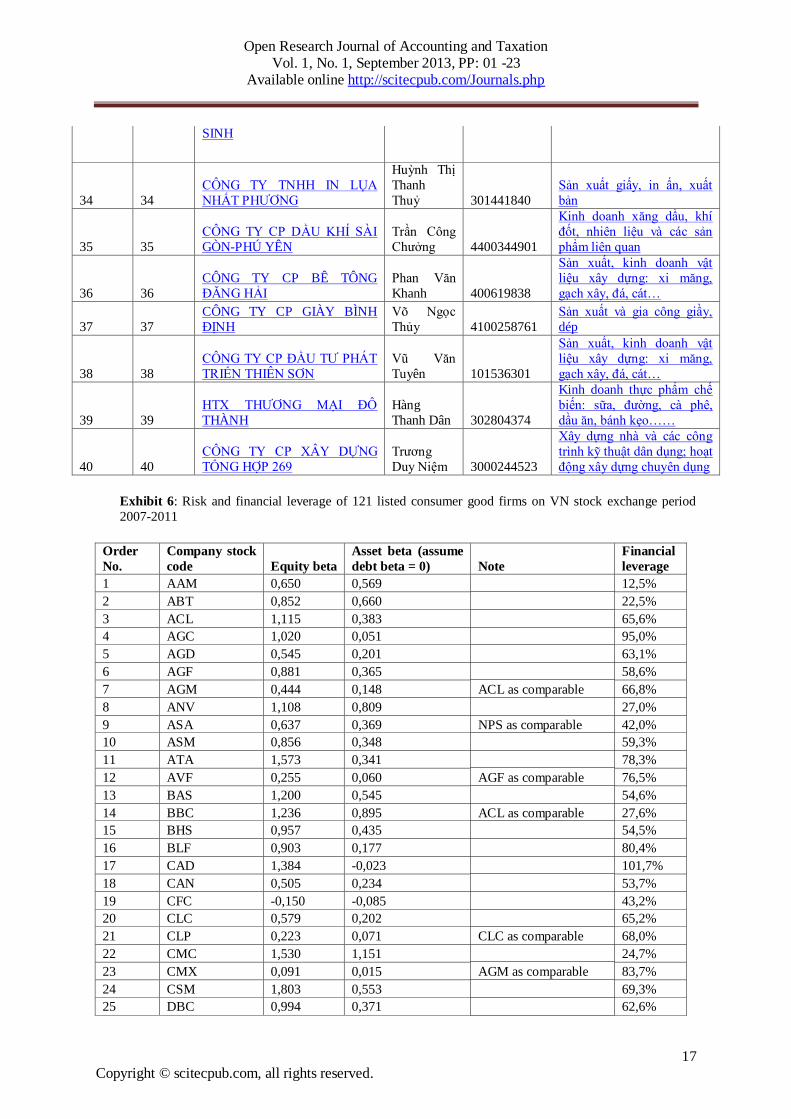
Exhibit 6: Risk and financial leverage of 121 listed consumer good firms on VN stock exchange period
2007-2011
Order
No.
Company stock
code Equity beta
Asset beta (assume
debt beta = 0) Note
Financial
leverage
1 AAM 0,650 0,569 12,5%
2 ABT 0,852 0,660 22,5%
3 ACL 1,115 0,383 65,6%
4 AGC 1,020 0,051 95,0%
5 AGD 0,545 0,201 63,1%
6 AGF 0,881 0,365 58,6%
7 AGM 0,444 0,148 ACL as comparable 66,8%
8 ANV 1,108 0,809 27,0%
9 ASA 0,637 0,369 NPS as comparable 42,0%
10 ASM 0,856 0,348 59,3%
11 ATA 1,573 0,341 78,3%
12 AVF 0,255 0,060 AGF as comparable 76,5%
13 BAS 1,200 0,545 54,6%
14 BBC 1,236 0,895 ACL as comparable 27,6%
15 BHS 0,957 0,435 54,5%
16 BLF 0,903 0,177 80,4%
17 CAD 1,384 -0,023 101,7%
18 CAN 0,505 0,234 53,7%
19 CFC -0,150 -0,085 43,2%
20 CLC 0,579 0,202 65,2%
21 CLP 0,223 0,071 CLC as comparable 68,0%
22 CMC 1,530 1,151 24,7%
23 CMX 0,091 0,015 AGM as comparable 83,7%
24 CSM 1,803 0,553 69,3%
25 DBC 0,994 0,371 62,6%

Open Research Journal of Accounting and Taxation Vol. 1, No. 1, September 2013, PP: 01 -23
Available online http://scitecpub.com/Journals.php
18 Copyright © scitecpub.com, all rights reserved.
26 DBF 0,147 0,076
CLP as comparable, F.S
2010 48,4%
27 DCS 1,492 1,018 31,8%
28 DNF 0,441 0,105 DCS as comparable 76,1%
29 DQC 1,089 0,479 56,0%
30 DRC 1,823 1,093 40,1%
31 EVE 0,079 0,066 CMX as comparable 16,6%
32 FBA 0,493 0,355 ASA as comparable 28,0%
33 FBT 0,477 0,156 67,2%
34 FDG 0,233 0,045 BHS as comparable 80,6%
35 FMC 0,878 0,232 73,6%
36 GDT 0,562 0,418 25,6%
37 GFC 0,131 0,015 FMC as comparable 88,4%
38 GGG 1,410 0,341 75,8%
39 GIL 0,783 0,415 47,0%
40 GLT 0,687 0,483 29,7%
41 GMC 1,033 0,434 58,0%
42 HAD 1,020 0,813 20,3%
43 HAT 0,827 0,659 NPS as comparable 20,2%
44 HAX 1,115 0,410 63,2%
45 HDM 0,534 0,086 83,9%
46 HFX -0,648 0,275 NPS as comparable 142,4%
47 HHC 1,023 0,612 40,2%
48 HLG 0,762 0,226 70,3%
49 HNM 0,840 0,522 37,8%
50 HTL 0,734 0,482 HAD as comparable 34,2%
51 HVG 0,626 0,225 64,0%
52 ICF 0,916 0,414 54,8%
53 IFS 0,889 0,375 CSM as comparable 57,8%
54 KDC 0,477 0,337 HVG as comparable 29,4%
55 KMR 0,670 0,474 FMC as comparable 29,3%
56 KSC 0,420 0,340 FBA as comparable 18,9%
57 KSD 0,265 0,106 GDT as comparable 59,9%
58 KTS 0,387 0,241 GDT as comparable 37,7%
59 LAF 1,248 0,558 55,3%
60 LIX 0,346 0,220 36,3%
61 LSS 1,327 0,917 30,9%
62 MCF 0,094 0,027 KSD as comparable 70,9%
63 MEF 0,325 0,143 SJ1 as comparable 56,0%
64 MPC 1,140 0,326 71,4%
65 MSN 1,503 0,841 44,0%
66 NET 0,357 0,246 FBT as comparable 31,0%
67 NGC 0,687 0,113 83,5%
68 NHS 0,381 0,190 KMR as comparable 50,2%
69 NPS 0,984 0,427 56,6%
70 NSC 0,910 0,578 36,5%
71 NST 0,887 0,264 70,2%
72 PID 0,316 0,220 KSC as comparable 30,3%
73 PNJ 0,643 0,262 59,2%
74 PSL 0,259 0,193 MEF as comparable 25,3%
75 PTB 0,122 0,032 NHS as comparable 73,9%

Open Research Journal of Accounting and Taxation Vol. 1, No. 1, September 2013, PP: 01 -23
Available online http://scitecpub.com/Journals.php
19 Copyright © scitecpub.com, all rights reserved.
76 PTG 0,391 0,194 NGC as comparable 50,3%
77 RAL 0,883 0,306 65,3%
78 S33 0,267 0,068 ABT as comparable 74,5%
79 SAF 0,888 0,524 41,0%
80 SAV 0,820 0,406 50,4%
81 SBT 0,855 0,716 16,3%
82 SCD 0,738 0,546 26,1%
83 SEC 0,738 0,295 60,0%
84 SGC 0,596 0,448 24,8%
85 SHV 0,199 0,043 SEC as comparable 78,4%
86 SJ1 0,635 0,408 35,8%
87 SLS 0,179 0,077 NET as comparable 57,0%
88 SMB 0,143 0,048 NET as comparable 66,7%
89 SPD 0,174 0,033 SEC as comparable 81,2%
90 SRC 2,056 0,753 63,4%
91 SSC 0,959 0,727 24,2%
92 SSF 0,157 0,067 PID as comparable 57,4%
93 SVC 1,301 0,401 69,2%
94 TAC 1,076 0,393 63,5%
95 TCM 1,302 0,462 64,5%
96 TET 0,346 0,296 PTG as comparable 14,6%
97 THB 0,976 0,608 37,7%
98 THV 0,301 0,056 SVC as comparable 81,5%
99 TLG 0,632 0,326 TAC as comparable 48,4%
100 TMT 0,388 0,200 48,4%
101 TMW 0,293 0,115 SJ1 as comparable 60,8%
102 TNA 1,066 0,378 64,5%
103 TNG 1,135 0,310 72,7%
104 TRI 1,014 0,111 89,0%
105 TS4 1,592 0,614 61,4%
106 TTG 0,429 0,358 FBA as comparable 16,6%
107 VCF 0,996 0,840 TNG as comparable 15,7%
108 VDL 0,810 0,534 34,1%
109 VDN 0,034 0,003 TMW as comparable 91,0%
110 VHC 1,103 0,584 47,1%
111 VHF 0,157 0,060 LIX as comparable 61,6%
112 VIA 0,387 0,337 TTG as comparable 12,8%
113 VKC 0,122 0,047 S33 as comparable 61,4%
114 VKD 0,095 0,051 SSF as comparable 46,6%
115 VLF 0,100 0,031 S33 as comparable 69,1%
116 VNH 0,547 0,256 TRI as comparable 53,2%
117 VNM 0,475 0,369 22,4%
118 VTF 0,517 0,231 VCF as comparable 55,3%
119 VTI 0,023 0,003 VHF as comparable 88,6%
120 VTL 0,620 0,211 66,1%
121 WSB 0,127 0,097 VHF as comparable 23,6%
Average 53,4%

Open Research Journal of Accounting and Taxation Vol. 1, No. 1, September 2013, PP: 01 -23
Available online http://scitecpub.com/Journals.php
20 Copyright © scitecpub.com, all rights reserved.
Exhibit 7 – Increase/decrease risk level of listed consumer good firms under changing scenarios of tax
rates : 25%, 28%, 20% period 2007 - 2011
Order
No.
Company
stock code
t = 25% t = 28% t = 20%
Equity
beta
Asset
beta
Increase
/Decrease
(equity beta)
Increase
/Decrease
(asset beta)
Increase
/Decrease
(equity beta)
Increase
/Decrease
(asset beta)
1 AAM 0,650 0,569 0,000 0,000 0,000 0,000
2 ABT 0,852 0,660 0,000 0,000 0,000 0,000
3 ACL 1,115 0,383 0,000 0,000 0,000 0,000
4 AGC 1,020 0,051 0,000 0,000 0,000 0,000
5 AGD 0,545 0,201 0,000 0,000 0,000 0,000
6 AGF 0,881 0,365 0,000 0,000 0,000 0,000
7 AGM 0,444 0,148 0,011 0,004 -0,017 -0,006
8 ANV 1,108 0,809 0,000 0,000 0,000 0,000
9 ASA 0,637 0,369 0,009 0,005 -0,015 -0,008
10 ASM 0,856 0,348 0,000 0,000 0,000 0,000
11 ATA 1,573 0,341 0,000 0,000 0,000 0,000
12 AVF 0,255 0,060 0,007 0,002 -0,012 -0,003
13 BAS 1,200 0,545 0,000 0,000 0,000 0,000
14 BBC 1,236 0,895 0,000 0,000 0,000 0,000
15 BHS 0,957 0,435 0,000 0,000 0,000 0,000
16 BLF 0,903 0,177 0,000 0,000 0,000 0,000
17 CAD 1,384 -0,023 0,000 0,000 0,000 0,000
18 CAN 0,505 0,234 0,000 0,000 0,000 0,000
19 CFC -0,150 -0,085 0,000 0,000 0,000 0,000
20 CLC 0,579 0,202 0,000 0,000 0,000 0,000
21 CLP 0,223 0,071 0,006 0,002 -0,009 -0,003
22 CMC 1,530 1,151 0,000 0,000 0,000 0,000
23 CMX 0,091 0,015 0,005 0,001 -0,008 -0,001
24 CSM 1,803 0,553 0,000 0,000 0,000 0,000
25 DBC 0,994 0,371 0,000 0,000 0,000 0,000
26 DBF 0,147 0,076 0,006 0,003 -0,009 -0,005
27 DCS 1,492 1,018 0,000 0,000 0,000 0,000
28 DNF 0,441 0,105 0,013 0,003 -0,020 -0,005
29 DQC 1,089 0,479 0,000 0,000 0,000 0,000
30 DRC 1,823 1,093 0,000 0,000 0,000 0,000
31 EVE 0,079 0,066 0,005 0,004 -0,008 -0,006
32 FBA 0,493 0,355 0,012 0,008 -0,018 -0,013
33 FBT 0,477 0,156 0,000 0,000 0,000 0,000
34 FDG 0,233 0,045 0,007 0,001 -0,011 -0,002
35 FMC 0,878 0,232 0,000 0,000 0,000 0,000
36 GDT 0,562 0,418 0,000 0,000 0,000 0,000
37 GFC 0,131 0,015 0,005 0,001 -0,007 -0,001
38 GGG 1,410 0,341 0,000 0,000 0,000 0,000
39 GIL 0,783 0,415 0,000 0,000 0,000 0,000
40 GLT 0,687 0,483 0,000 0,000 0,000 0,000
41 GMC 1,033 0,434 0,000 0,000 0,000 0,000
42 HAD 1,020 0,813 0,000 0,000 0,000 0,000
43 HAT 0,827 0,659 0,005 0,004 -0,009 -0,007
44 HAX 1,115 0,410 0,000 0,000 0,000 0,000

Open Research Journal of Accounting and Taxation Vol. 1, No. 1, September 2013, PP: 01 -23
Available online http://scitecpub.com/Journals.php
21 Copyright © scitecpub.com, all rights reserved.
45 HDM 0,534 0,086 0,000 0,000 0,000 0,000
46 HFX -0,648 0,275 -0,046 0,020 0,064 -0,027
47 HHC 1,023 0,612 0,000 0,000 0,000 0,000
48 HLG 0,762 0,226 0,000 0,000 0,000 0,000
49 HNM 0,840 0,522 0,000 0,000 0,000 0,000
50 HTL 0,734 0,482 0,008 0,005 -0,013 -0,009
51 HVG 0,626 0,225 0,000 0,000 0,000 0,000
52 ICF 0,916 0,414 0,000 0,000 0,000 0,000
53 IFS 0,889 0,375 0,018 0,008 -0,029 -0,012
54 KDC 0,477 0,337 0,005 0,003 -0,007 -0,005
55 KMR 0,670 0,474 0,006 0,005 -0,010 -0,007
56 KSC 0,420 0,340 0,012 0,010 -0,020 -0,016
57 KSD 0,265 0,106 0,006 0,002 -0,009 -0,004
58 KTS 0,387 0,241 0,005 0,003 -0,008 -0,005
59 LAF 1,248 0,558 0,000 0,000 0,000 0,000
60 LIX 0,346 0,220 0,000 0,000 0,000 0,000
61 LSS 1,327 0,917 0,000 0,000 0,000 0,000
62 MCF 0,094 0,027 0,005 0,001 -0,007 -0,002
63 MEF 0,325 0,143 0,006 0,003 -0,010 -0,005
64 MPC 1,140 0,326 0,000 0,000 0,000 0,000
65 MSN 1,503 0,841 0,000 0,000 0,000 0,000
66 NET 0,357 0,246 0,004 0,003 -0,006 -0,004
67 NGC 0,687 0,113 0,000 0,000 0,000 0,000
68 NHS 0,381 0,190 0,010 0,005 -0,016 -0,008
69 NPS 0,984 0,427 0,000 0,000 0,000 0,000
70 NSC 0,910 0,578 0,000 0,000 0,000 0,000
71 NST 0,887 0,264 0,000 0,000 0,000 0,000
72 PID 0,316 0,220 0,013 0,009 -0,020 -0,014
73 PNJ 0,643 0,262 0,000 0,000 0,000 0,000
74 PSL 0,259 0,193 0,007 0,005 -0,012 -0,009
75 PTB 0,122 0,032 0,007 0,002 -0,010 -0,003
76 PTG 0,391 0,194 0,007 0,003 -0,011 -0,005
77 RAL 0,883 0,306 0,000 0,000 0,000 0,000
78 S33 0,267 0,068 0,008 0,002 -0,012 -0,003
79 SAF 0,888 0,524 0,000 0,000 0,000 0,000
80 SAV 0,820 0,406 0,000 0,000 0,000 0,000
81 SBT 0,855 0,716 0,000 0,000 0,000 0,000
82 SCD 0,738 0,546 0,000 0,000 0,000 0,000
83 SEC 0,738 0,295 0,000 0,000 0,000 0,000
84 SGC 0,596 0,448 0,000 0,000 0,000 0,000
85 SHV 0,199 0,043 0,006 0,001 -0,009 -0,002
86 SJ1 0,635 0,408 0,000 0,000 0,000 0,000
87 SLS 0,179 0,077 0,005 0,002 -0,009 -0,004
88 SMB 0,143 0,048 0,005 0,002 -0,008 -0,003
89 SPD 0,174 0,033 0,005 0,001 -0,008 -0,002
90 SRC 2,056 0,753 0,000 0,000 0,000 0,000
91 SSC 0,959 0,727 0,000 0,000 0,000 0,000
92 SSF 0,157 0,067 0,010 0,004 -0,015 -0,006
93 SVC 1,301 0,401 0,000 0,000 0,000 0,000
94 TAC 1,076 0,393 0,000 0,000 0,000 0,000

Open Research Journal of Accounting and Taxation Vol. 1, No. 1, September 2013, PP: 01 -23
Available online http://scitecpub.com/Journals.php
22 Copyright © scitecpub.com, all rights reserved.
95 TCM 1,302 0,462 0,000 0,000 0,000 0,000
96 TET 0,346 0,296 0,008 0,007 -0,012 -0,010
97 THB 0,976 0,608 0,000 0,000 0,000 0,000
98 THV 0,301 0,056 0,010 0,002 -0,015 -0,003
99 TLG 0,632 0,326 0,011 0,005 -0,017 -0,009
100 TMT 0,388 0,200 0,000 0,000 0,000 0,000
101 TMW 0,293 0,115 0,006 0,003 -0,010 -0,004
102 TNA 1,066 0,378 0,000 0,000 0,000 0,000
103 TNG 1,135 0,310 0,000 0,000 0,000 0,000
104 TRI 1,014 0,111 0,000 0,000 0,000 0,000
105 TS4 1,592 0,614 0,000 0,000 0,000 0,000
106 TTG 0,429 0,358 0,012 0,010 -0,020 -0,016
107 VCF 0,996 0,840 0,005 0,004 -0,008 -0,007
108 VDL 0,810 0,534 0,000 0,000 0,000 0,000
109 VDN 0,034 0,003 0,002 0,000 -0,003 0,000
110 VHC 1,103 0,584 0,000 0,000 0,000 0,000
111 VHF 0,157 0,060 0,004 0,001 -0,006 -0,002
112 VIA 0,387 0,337 0,013 0,011 -0,020 -0,018
113 VKC 0,122 0,047 0,006 0,002 -0,009 -0,004
114 VKD 0,095 0,051 0,007 0,004 -0,011 -0,006
115 VLF 0,100 0,031 0,005 0,002 -0,008 -0,003
116 VNH 0,547 0,256 0,010 0,005 -0,016 -0,008
117 VNM 0,475 0,369 0,000 0,000 0,000 0,000
118 VTF 0,517 0,231 0,013 0,006 -0,020 -0,009
119 VTI 0,023 0,003 0,001 0,000 -0,002 0,000
120 VTL 0,620 0,211 0,000 0,000 0,000 0,000
121 WSB 0,127 0,097 0,004 0,003 -0,006 -0,005
Average 0,003 0,002 -0,004 -0,003
Exhibit 8- VNI Index and other stock market index during crisis 2006-2010
0
1000
2000
3000
4000
5000
6000
7000
Thg1-06
Thg4-06
Thg7-06
Thg10-0
6
Thg1-07
Thg4-07
Thg7-07
Thg10-0
7
Thg1-08
Thg4-08
Thg7-08
Thg10-0
8
Thg1-09
Thg4-09
Thg7-09
Thg10-0
9
Thg1-10
Thg4-10
Thg7-10
VN Index
S&P 500
SSE index
NIKKEI 225 (/0')
TSEC (/0')
KOSPI
CNT (/00')
Open Research Journal of Accounting and Taxation Vol. 1, No. 1, September 2013, PP: 01 -23
Available online http://scitecpub.com/Journals.php
23 Copyright © scitecpub.com, all rights reserved.
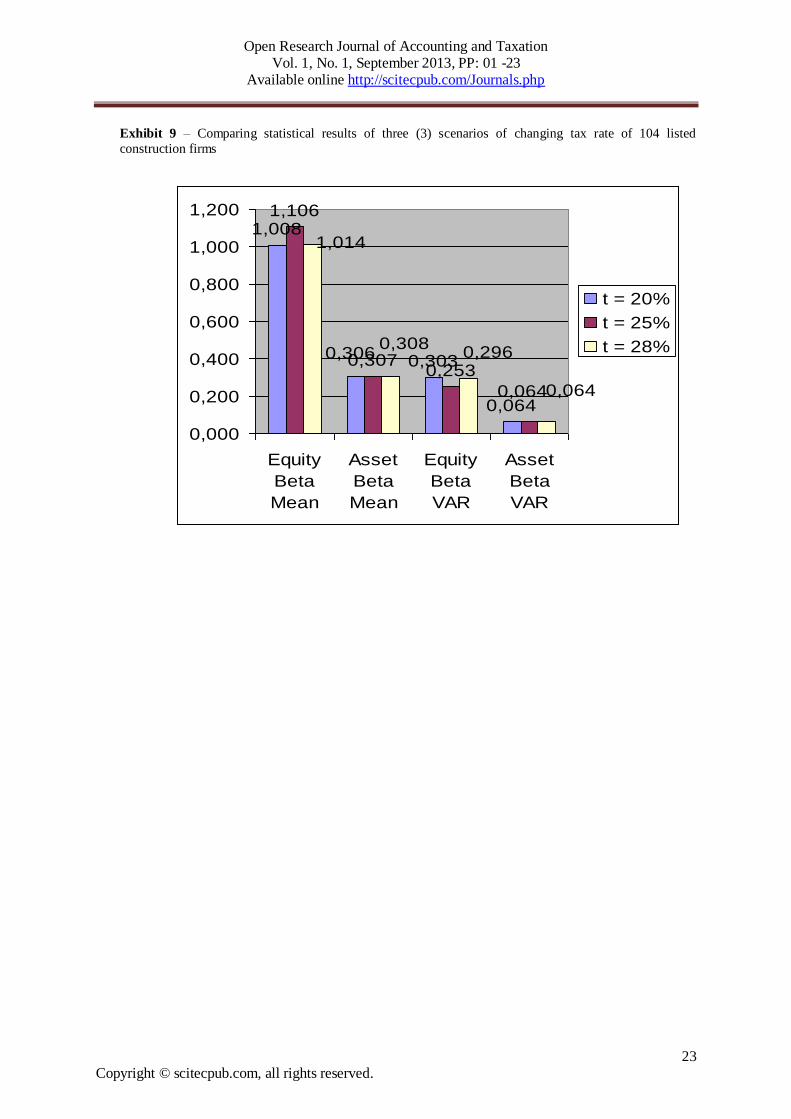
Exhibit 9 – Comparing statistical results of three (3) scenarios of changing tax rate of 104 listed
construction firms
1,008
0,303
0,064
1,106
0,3070,253
0,306
0,064
1,014
0,3080,296
0,064
0,000
0,200
0,400
0,600
0,800
1,000
1,200
Equity
Beta
Mean
Asset
Beta
Mean
Equity
Beta
VAR
Asset
Beta
VAR
t = 20%
t = 25%
t = 28%