assessing the changing impacts over time of gas
TRANSCRIPT

Assessing the Changing Impacts over Time of Gas Station Related Source NO2 Concentrations
David A. Sullivan, Dennis J. Hlinka, Mark T. Holdsworth
Sullivan Environmental1900 Elkin Street, Suite 200
Alexandria, VA 22308

Background: Case Study

Background: Case Study (Cont.)

Study of Gravity Flow Potential
Figure 11. Surface Temperature at 23:13 hours on 4/26/2013
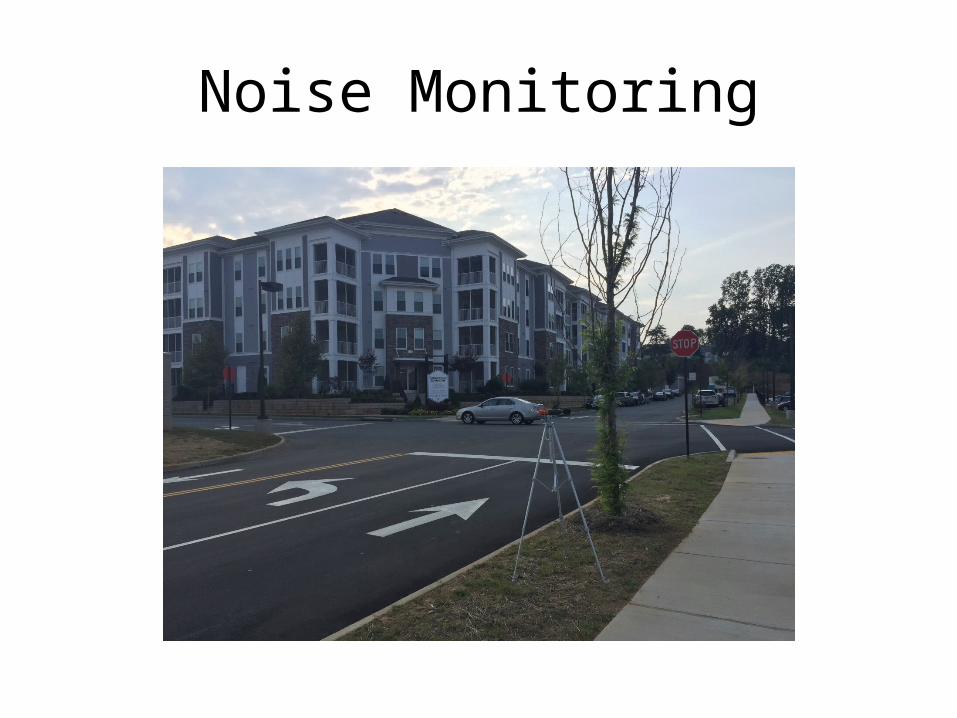
Noise Monitoring

Timeline• 1973 – Stage I controls began
• 1975 – Stage I submerged filling becoming common at gasoline stations and gasoline delivery trucks
• 1983 – Stage I balanced submerged filling use common at gasoline stations and for gasoline delivery trucks
• 1990 – Stage II and on board canister technology rules promulgated
• 1994 – Stage II required in non-attainment areas ORVR rules promulgated
• 2006 – ORVR technology common (assumed 50 percent) with an incompatbility penalty per EPA emission factors
• 2013 – Stage II being phased out so incompatibilities between ORVR and Stage II are removed
• 2020 – Reduced emissions due to ORVR technology only

Figure 1. Layout of Gasoline Station, Nearby Roadway Intersection and Traffic Flow.
5,094 Vehicles per Hour
2,549 Vehicles per Hour
3,126 Vehicles per Hour
3,492 Vehicles per Hour

Model Domain and Receptor Grid.

MOVES estimated 1990, 2015, and 2025 emission factors for NOx.
Source Type
MOVES NOx Emission Factors
(grams/vehicle mile) 1990 2015 2025
Gasoline Station Idling Queue 11.00 3.00 1.00
Gasoline Station Entrance/Exit 3.09 0.91 0.20
Nearby Roadway Segments 2.05 0.63 0.16
Nearby Intersection Idling Queues 19.46 6.25 1.46

Changing Ratio NO2/NOx
Source TypeTailpipe NO2/NOx percentage
1990 2015 2025
Gasoline Station Idling Queue - - -
Gasoline Station Entrance/Exit 2.94 10.00 ~ 14.5
Nearby Roadway Segments 4.04 10.34 14.80
Nearby Intersection Idling Queues 4.50 10.00 14.29
Overall Average 3.83 10.11 14.54

Example: National Distribution NO2 1-Hour 98th Percentile Values
0
20
40
60
80
100
120
140
160
0 50 100 150 200 250 300 350 400 450
NO
21-
Hour
98t
h Pe
rcen
tile
Conc
entr
ation
(pp
b)
Monitor Number
NO2 1-Hour 98th Percentile US National Monitors Values (ppb) for 2014
Dr. Cole's 153 ppb Estimated NO2 for Costco
Sullivan's ConservativeEstimate of 60 ppb NO2
Monitor Location Near NewJersey Turnpike Toll Booth for George Washington Bridge in to New York City
2014

Only Monitor in U.S. > NAAQSToll Booths at NYC George Washington Bridge

Port of Long Beach I-710(maximum 98th percentile 15 m from Highway = 83 ppb in 2011)
~190,000 vehicles / day (>30,000 Heavy Duty Diesel Trucks)
G Estrada 2014

Predicted 98th Percentile 1-hour NO2 concentrations compared to current NO2 NAAQS.
Emission Year
Modeled NOx (ppb)
Converted NO2 (ppb)
Background NO2 (ppb)
Total NO2 (ppb)
NO2 NAAQS
(ppb) 1990 1360.8 62.0 75.4 137.4 100 2015 504.5 58.7 34.6 93.3 100 2025 105.5 18.3 40.1 58.4 100
2015 OLM2 283.0 129.4 32.4 161.8 100 2015 ARM25 527.7 422.2 29.1 451.3 100
2 (Owen and Brode, 2014) 5
(RTP, 2013)
0
20
40
60
80
100
120
140
160
0 50 100 150 200 250 300 350 400 450
NO 2
1-Ho
ur 9
8th
Perc
entil
e Co
ncen
trati
on (
ppb)
Monitor Number
NO2 1-Hour 98th Percentile US National Monitors Values (ppb) for 2014
Dr. Cole's 153 ppb Estimated NO2 for Costco
Sullivan's ConservativeEstimate of 60 ppb NO2
Monitor Location Near NewJersey Turnpike Toll Booth for George Washington Bridge in to New York City

Predicted annual average NO2 concentrations compared to current NO2 NAAQS.
Emission Year
Modeled NOx (ppb)
Converted NO2 (ppb)
Background NO2 (ppb)
Total NO2 (ppb)
NO2 NAAQS
(ppb) 1990 217.1 18.0 23.3 41.3 53 2015 72.2 10.0 12.3 22.3 53 2025 22.9 2.5 12.8 15.3 53
2015 OLM2 72.2 31.7 12.3 44.0 53 2015 ARM25 72.2 44.4 12.3 56.7 53
2 (Owen and Brode, 2014) 5
(RTP, 2013)

Maximum Predicted 98th Percentile NO2 Concentrations (ppb)for 2015 Emissions Year
Maximum 93 ppb

Conclusions
• EPA has made great progress in reducing emissions from gasoline marketing
• More refined methods to model near-field conversion of NO to NO2 are needed
• MOVES is effective for urban-scale emission inventories but need practical guidance for project level applications