changes in food selection after implementation of a
TRANSCRIPT

Wright State University Wright State University
CORE Scholar CORE Scholar
Master of Public Health Program Student Publications Master of Public Health Program
2013
Changes in Food Selection after Implementation of a Nutritional Changes in Food Selection after Implementation of a Nutritional
Labeling Program in a Worksite Cafeteria Labeling Program in a Worksite Cafeteria
Brenda Bodenmiller Wright State University - Main Campus
Follow this and additional works at: https://corescholar.libraries.wright.edu/mph
Part of the Nutrition Commons, and the Public Health Commons
Repository Citation Repository Citation Bodenmiller, B. (2013). Changes in Food Selection after Implementation of a Nutritional Labeling Program in a Worksite Cafeteria. Wright State University, Dayton, Ohio.
This Master's Culminating Experience is brought to you for free and open access by the Master of Public Health Program at CORE Scholar. It has been accepted for inclusion in Master of Public Health Program Student Publications by an authorized administrator of CORE Scholar. For more information, please contact [email protected].

Running Head: NUTRITION LABEL 1
Changes in Food Selection after Implementation of a Nutritional Labeling Program in a Worksite Cafeteria
Brenda Bodenmiller
Wright State University

NUTRITION LABEL 2
Acknowledgments
Thank you to Marietta Orlowski, Sylvia Ellison, Ed Syron, and Christine Broomhall for your
support and guidance with assisting me in completing this paper. Thank you to my family, both
home and at work for patience and understanding; Miami Valley Hospital’s senior leadership;
and John Eckelberry and his team in Nutrition Services for leading the way of health promotion
within our hospital.

NUTRITION LABEL 3
Table of Contents
Abstract ............................................................................................................................................4
Introduction ......................................................................................................................................5
Review of Literature ................................................................................................................... 5
Purpose ...........................................................................................................................................22
Methods..........................................................................................................................................22
Results ............................................................................................................................................26
Data Analysis .................................................................................................................................29
Discussion ......................................................................................................................................32
Conclusion .....................................................................................................................................39
References ......................................................................................................................................40
Appendices .....................................................................................................................................49
Appendix A: Cycle B Menu Examples Weeks 1-4 ...........................................................49
Appendix B: Examples of Signage ....................................................................................53
Appendix C: Photo Examples ............................................................................................54
Appendix D: List of Tier 1 Core Public Health Competencies Met ..................................55

NUTRITION LABEL 4
Abstract
This quantitative study examined the individual employee selection changes that occur in
cafeteria purchases after the implementation of nutritional information point of purchase
campaign in a hospital worksite. The study utilized data received from daily sales. Twelve
selected variables were obtained from the labeling campaign. One entrée, soup, side item, and
dessert were chosen from each of the nutrition color categories: red, yellow, and green. A
comparison of the monthly sales totals for the selected menu items from each category (red,
yellow, green) items was completed. Each monthly total was compared for any identifiable
trends. The original analysis plan was hampered by a number of factors. Implications of the
results and recommendations for future research are discussed.
Keywords: Point of purchase, Nutrition and Health, Ecological
NUTRITION LABEL 5
Changes in Food Selection after Implementation of a Nutritional Labeling Program in a
Worksite Cafeteria
Cardiovascular disease (CVD) is the leading cause of death. More than 2200 Americans
die of CVD each day, an average of 1 death every 39 seconds (American Heart Association
[AHA], 2012). Cardiovascular disease includes heart disease and stroke; both conditions involve
narrowed or blocked vessels of the heart or circulatory system. The narrowing involves a
process called atherosclerosis, which is a buildup of plaque and fatty material inside the lining of
the arteries. Atherosclerosis begins early in life and is influenced by non-modifiable and
modifiable behavioral risk factors (AHA, 2011). Non-modifiable factors are traits and situations
in which there is not any lifestyle control. Examples of non-modifiable risk factors include
gender, age and heredity. Modifiable risk factors include behaviors that are associated with an
increased risk of disease and include tobacco use, high blood pressure (hypertension), diabetes,
high cholesterol, obesity, physical inactivity, obesity and unhealthy diets. Data from the Nurses’
Health Study suggest that women, maintaining a desirable body weight, eating a healthy diet,
exercising regularly, not smoking, and consuming a moderate amount of alcohol could account
for an 84% reduction in risk for CVD (AHA, 2002).
Review of Literature
Nutritional studies have documented that healthy dietary patterns are associated with a
substantially reduced risk of CVD. Knoops, Groot, Fidanza, Kromhout, and Van Staveren,
(2006) demonstrated through the HALE population, using different dietary guidelines for
preventing chronic diseases had a significantly lower risk of all-cause mortality. Appel et al.
(2005) demonstrated through the results of the OmniHeart trial that blood pressure, low-density
lipoprotein cholesterol, and estimated coronary heart disease risk were lower on each diet

NUTRITION LABEL 6
compared to baseline. Nutrition plays an important role as a modifiable determinant for
cardiovascular and non-cardiovascular diseases (AHA, 2006).
In addition to CVD, chronic diseases, including heart disease, cancer, stroke, diabetes,
and respiratory diseases, each share major risk factors beyond genetics and social inequalities
including tobacco use, unhealthy diet, physical inactivity, and lack of access to preventative care
(Halpin, Morales-Suarez-Varela, & Martin-Moreno, 2010).
Obesity and Health
The high prevalence of overweight and obesity across the population is of concern as
obesity is a chronic health conditions as well as an independent risk factor for cardiovascular
disease and other chronic health conditions (AHA, 2006). Excess body weight adversely affects
many CVD risk factors (e.g. increasing low-density lipoprotein LDL cholesterol levels,
triglyceride levels, blood pressure, blood pressure BP, and blood glucose levels, and reducing
high-density lipoprotein HDL cholesterol levels). Obesity affects other chronic conditions such
as osteoarthritis, and in the United States, overweight and obesity contribute to 14% to 20% of
all cancer-related mortality (Calle, Roderiquez, Walker-Thurmond, & Thun, 2003). Factors
which have contributed to the “obesity epidemic” and body weight are those which affect calorie
balance. Calorie balance refers to the relationship between calories consumed from foods and
beverages and calories expended in normal body functions (i.e. metabolic processes) and through
physical activity (United States Department of Agriculture [USDA], 2010). Obesity is a result of
caloric imbalance. “Individuals tend to consume more calories than are expended and
consuming more calories than expended leads to weight gain” (Je’quier & Tappy, 1999, p. 453).
Excess calories are associated with portion sizes, high calorie density food and sedentary lifestyle
or physical inactivity. Bray and Popkin (1998) concluded that dietary fat plays a role in the

NUTRITION LABEL 7
development of obesity. Binkley, Eales, and Jekanowski (2000) concluded that increased
consumption of fast food is a contributing factor to increased obesity. Therefore, the overall
environment in which individuals live, learn, and play affects the type and amount of food
consumed and physical activity. Food and eating environments are components that contribute
to increasing obesity and chronic diseases. “Major changes in our food system and eating
environments have been driven by: 1) technological advances; 2) U.S. food and agricultural
policies; and 3) economic, social, and lifestyle changes” (Story, Kaphingst, Robinson-O’Brien,
& Glanz, 2008, p. 254). Our society demands and seeks access to food that is convenient and
easily accessible but often these lead to unhealthy eating habits. The environment affects
nutritional choice. Nutritional choice is influenced by multifactorial factors such as increased
portion sizes, high-calorie density foods, easy access to plentiful, inexpensive food, sedentary
lifestyle, and commercial and cultural influences that, in aggregate, encourage calorie
consumption in excess of calorie utilization (AHA, 2006). Average daily calorie count per
individual has increased specifically with availability of added fats and oils, grains, milk and
milk products (USDA, 2010). Since the 1970s, the number of fast food restaurants has more
than doubled.
Nutrition and Health
The importance of proper nutrition and its role in health continues to impact chronic
disease. Numerous research studies have demonstrated the role that diet plays in prevention of
chronic diseases. Fung, Schulze, Manson, Willet, and Hu (2004) concluded a diet with high
intakes of red and processed meats, refined grains, and sweets and desserts may increase stroke
risk, whereas a diet higher in fruits and vegetables, fish, and whole grains may protect against
stroke. Appel et al. (1997) demonstrated that a diet rich in fruits and vegetables, and low-fat

NUTRITION LABEL 8
dietary foods and with reduced saturated and total fat can substantially lower blood pressure.
This type of diet, such as the DASH diet has shown for years its use to prevent and treat
hypertension. The strongest dietary determinants of elevated cholesterol concentrations are
dietary saturated fatty acid and trans fatty acid intake (AHA, 2006). There are multiple dietary
factors that increase blood pressure that include: excessive sodium and insufficient potassium
intake; overweight and obesity; and excess alcohol consumption (USDA, 2010). Despite the
evidence supporting the benefits of a healthy diet on blood pressure, lipids insulin sensitivity,
and body weight, the majority of the population does not meet several of the public health targets
set forth in the dietary guidelines. It has been estimated that >50% of global deaths can be
attributed to diet (AHA, 2006). The need to change dietary habits is clear and must begin with
consuming less fat, cholesterol, and sodium to reduce the risk of heart disease while adding more
foods that are low in fat and rich in complex carbohydrates, such as fiber to reduce risk of diet
related cancer (USDA, 1985, 1990). Research shows that high intake of fruits and vegetables
can contribute to good cardiovascular health (AHA, 2006; USDA, 2010). The importance of
proper nutrition, Hu and Willett (2002) concluded, “Substantial evidence indicates that diets
relying on non- hydrogenated and unsaturated fats, whole grains as the main carbohydrate, an
abundance of fruits and vegetables, and adequate omega-3 fatty acids can offer significant
protection against cardiovascular disease […] incorporating healthy diets, with exercise,
avoidance of smoking, and a healthy body weight may prevent the majority of cardiovascular
diseases in western populations” (p. 2575).
Health Enhancing Nutrition Behaviors
Healthy eating results from a combination of behaviors that occur across a lifespan and
involves individual choice and environmental influences which affect and promote a healthy

NUTRITION LABEL 9
lifestyle. General guidelines for daily health that can enhance eating include increasing intake of
whole grains, vegetables and fruits, and reducing intake of sugar-sweetened beverages.
Specifically, 6-8 servings of whole grains, 4-5 servings of fruits and vegetables, 2-3 servings of
fat-free or low-fat milk, less than 6oz of lean meats, poultry and fish (AHA, 2006; USDA, 2010).
The USDA guidelines include calorie intake and expenditure per day by age, gender, and
physical activity levels. Actual food group servings will vary based upon age and activity
patterns. Carbohydrates, protein and fat are essential nutrients that are included in a diet. The
recommended proportions vary according to age. Young children (1-3 years of age) should have
5-20% of their diet from protein and 30-40% from fat. But, adults need 10-35% protein and 20-
35% fat. In addition to age, there are recommendations specific to a population such as pregnant
women. Pregnant women are encouraged take an iron supplement and consume 8-12 ounces of
seafood per week (USDA, 2010). Recommendations also include guidelines for reducing
sodium consumption, keeping trans fatty acid consumption as low as possible, and reducing
intake of calories from solid fats and added sugars, and limit refined grains. In addition to the
dietary recommendations, there are guidelines to facilitate a physically active lifestyle.
However, an individual’s choice may be limited by what is available in a person’s environment,
including stores, restaurants, schools, and worksites.
Ecological Approaches to Modifying Diet
“An ecological approach is useful to illustrate the various connections between people
and their environments” (Story et al., 2008, p. 254). In an ecological model, all behavior is
influenced by multilevel environmental factors. Environmental factors exist on intrapersonal,
interpersonal, community, organizations and system levels. Intrapersonal influences include
constructs such as self-control, self-determination, and competence. An interpersonal (social)

NUTRITION LABEL 10
influence includes constructs such as, peers, school, work, and friends. Community influences
are constructs that include the community in which one may reside. The community may
promote physical activity with bike paths or walking paths. Organizations may include schools,
worksites, and faith-based such as churches. System influences may include influences such as
public health and policy. The AHA conceptual model for food influences and identifies
facilitators and barriers to attaining a healthy diet and lifestyle, Figure 1 (AHA, 2009).
Incorporating a sociological model consists of targeting individual, interpersonal, and
organizational elements combined with the interactions within and among them. The Institute of
Medicine (IOM) notes interventions implemented at any level within an ecological model can
influence individual behavior change. However, existing research also suggests “that concurrent
intervention at multiple levels such as individual, family, and community are most likely to
sustain change and should be encouraged” (Matson-Koffman, Brownstein, Neiner, and Greaney,
2005, p. 168). Incorporating policy and environmental strategies coupled with promotion of
physical activity and good nutrition, and comprehensive policy, environmental and systems-level
intervention for patient care can be effective in controlling chronic conditions Matson-Koffman,
Grenade, & Anwuri, (2008). Robinson (2008) examined the dietary behaviors, focusing on fruit
and vegetable intake, of low-income African Americans. The studies that were most ecological,
recommending the integration of environmental and individual targets across a variety of
settings, suggesting multiple targets, and including at least two different strategies , with the
client as a direct target and at least one other targeting a component of the environment
demonstrated the greatest results for increased fruit and vegetable intake (Robinson, 2008). The
socio-ecological model provides a useful framework for achieving a better understanding of the
multiple factors and barriers that impact dietary behaviors.

NUTRITION LABEL 11
Figure 1. AHA ecological model of influence on eating behaviors.
The individual (intrapersonal).
Numerous individual factors influence eating behaviors. Intrapersonal factors are within
the control of the individual. Individual factors that are related to food choices and eating
behaviors include biological, demographic factors, and personal cognitions. Biological factors
include an individual’s genetic makeup, age, gender, and race. Individuals may have a genetic
predisposition to a specific disease, such as cardiovascular disease; or genetic make-up may
influence what an individual eats. For example, Hispanics have an inherited chemical sensitivity
to bitter tastes, which may cause them to avoid certain foods. Researchers at Temple University
in Philadelphia tested 152 predominantly Hispanic children for genetic bitter taste sensitivity.
Seventy percent of the children had the genetic trait. Demographic factors include factors such
as age, gender, socioeconomic status, race/ethnicity, and disability status. Socioeconomic status
influences individual eating habits. The highest rates of obesity in America are found among
groups of people with low incomes. Cognitions that impact food choices include individual
NUTRITION LABEL 12
motivations, such as having the desire to want to lose weight or eat healthy, self-efficacy,
outcome expectations and behavioral capability (Story et al., 2008). Examples of cognitions
include an individual’s knowledge of the healthier choice, and individual food preferences (taste,
texture and appearance), individual habits, individual energy and nutrient needs, health concerns,
cultural or religious practices, cost and availability. A mother of child-bearing age should
consume extra amounts of folate and foods with added folic acid to assist the health of a baby
during pregnancy. An athlete will require higher energy requirements during training to meet
nutritional needs. Both are examples of how motivation or outcome expectation may affect an
individual’s nutritional choice.
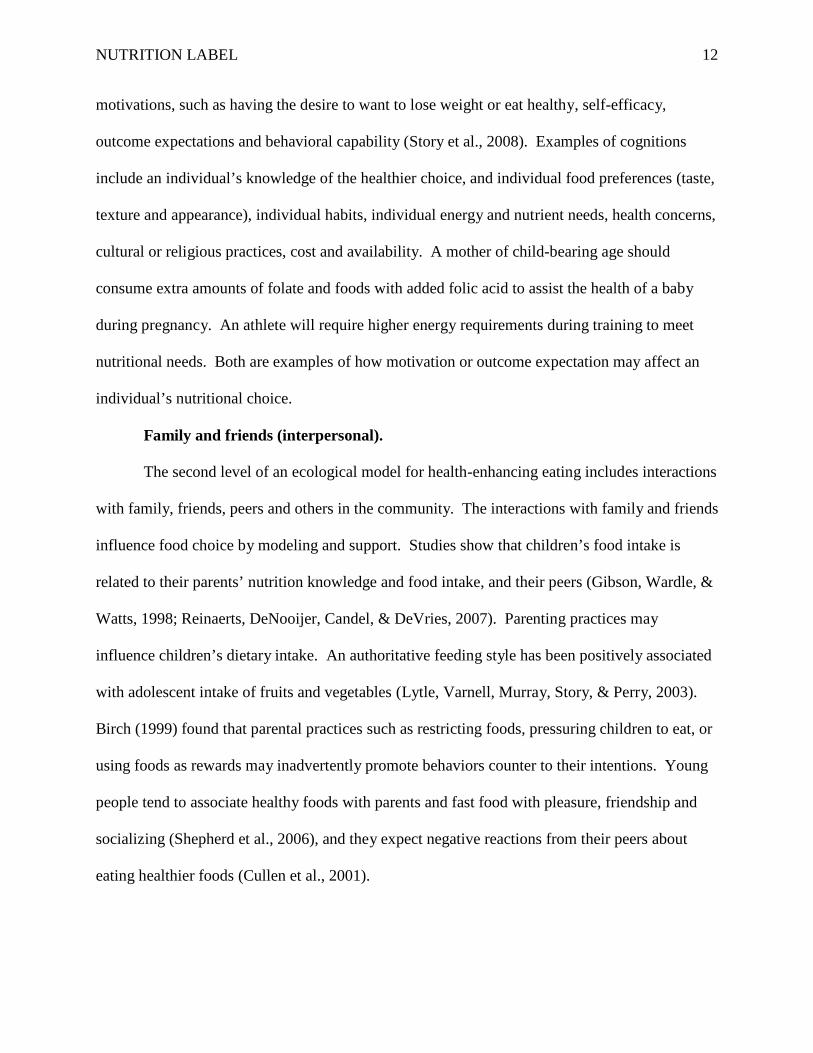
Family and friends (interpersonal).
The second level of an ecological model for health-enhancing eating includes interactions
with family, friends, peers and others in the community. The interactions with family and friends
influence food choice by modeling and support. Studies show that children’s food intake is
related to their parents’ nutrition knowledge and food intake, and their peers (Gibson, Wardle, &
Watts, 1998; Reinaerts, DeNooijer, Candel, & DeVries, 2007). Parenting practices may
influence children’s dietary intake. An authoritative feeding style has been positively associated
with adolescent intake of fruits and vegetables (Lytle, Varnell, Murray, Story, & Perry, 2003).
Birch (1999) found that parental practices such as restricting foods, pressuring children to eat, or
using foods as rewards may inadvertently promote behaviors counter to their intentions. Young
people tend to associate healthy foods with parents and fast food with pleasure, friendship and
socializing (Shepherd et al., 2006), and they expect negative reactions from their peers about
eating healthier foods (Cullen et al., 2001).

NUTRITION LABEL 13
Behavior is not only influenced by culture and social networks; it is also influenced by
the perception of how others within the social networks and culture will perceive the particular
behavior. Molaison, Connell, Stuff, Yadrick, and Bogle (2005) concluded that most participants
“believed that their peers would not support them in consuming more fruits and vegetables
because most of their peers ate junk” (p. 249). “Social gatherings also tend to decrease the
variance of consumption; those who normally eat large amounts eat less, while those who
normally eat little will eat more” (Clendenen, Herman, & Polivy, 1994, p. 1). Cultural norms
will affect what particular food or beverages that are consumed. James (2004) concluded that
there was a general perception that eating healthfully meant giving up part of their cultural
heritage when trying to conform to the dominant culture. Another example is a vegan, an
individual who follows a vegetarian diet that excludes meat, eggs, dairy products and other
animal-derived ingredients. Yet, depending upon the community and social interactions it may
be difficult to maintain this particular lifestyle. Convenience and fast may be preferred rather
than healthy choices. Making a healthier choice could be more difficult if the healthier choice is
not strongly valued within society.
Environments
Environments consist of micro environment, the home environment, and macro
environments which are any physical environments outside of the home where people interact
and eat or purchase food, e.g. schools, restaurants, supermarkets and worksites.
Americans have 47.5% of their meals prepared within the home (Guthrie, Lin, & Frazao,
2002). Some factors within the home environment are availability and accessibility of healthy
foods, the frequency of family meals, and parental intake and parenting practices (modeling of
healthy dietary intake). Grimm, Harnack, and Story (2004) concluded that availability of soft

NUTRITION LABEL 14
drinks in the home has also been strongly associated with soft drink consumption among
children.
Environments which are located outside the home include social environments such as
schools and worksites. These settings within the community play an important role in affecting
individuals’ food choices.
School.
“School food environments can impact children’s and adolescents dietary intake, because
two meals and snacks are eaten at school every day” (Story, Kaphingst, & French, 2006, p. 109).
Most schools will offer federally reimbursed meals which meet defined nutrition standards.
However, most will offer a la carte offerings in the cafeteria. Federal requirements do very little
to limit the sale or set nutrition standards. The number of food establishments in the U.S. has
nearly doubled in the past three decades U.S. Food and Drug Administration [FDA], 2006).
Foods eaten away from home tend to be more calorie dense and of poorer nutritional quality than
foods prepared at home (Guthrie et al., 2002). Studies have linked frequent eating out to higher
calorie intake, weight gain, and obesity (McCrory et al., 1999; Pereira, Kartashov, Ebbeling, Van
Horn, & Slattery, 2005). Supermarkets; grocery stores play a major role in food purchasing and
availability of healthful products contribute to healthy eating patterns. Environmental strategies
are aimed at reducing barriers or increasing opportunities for healthy choices by providing more
healthy options, making healthy choices more accessible and by establishing policies that require
healthy choices or restrict the number of unhealthy options.
Worksite.
Americans currently spend two-thirds of their time at the worksite. Sixty-six percent of
Americans are employed thus making the worksite a significant environment (United States

NUTRITION LABEL 15
Bureau of Labor Statistics, 2007). Increased time at work creates opportunities for worksites to
provide environmental interventions that play an important role towards improvement of health.
Nutritional behaviors can be positively influenced by work site health promotion programs that
include healthful modifications of the work site environment. Workplace environments provide
opportunities for on-site health promotion programs and may influence dietary intake through
availability and variety of healthful food options. In a controlled worksite environmental
intervention study in which two strategies were used for promotion of stair use and information
in cafeteria, by providing product information for healthier food choices, it was concluded that a
relatively modest food and physical activity intervention proved to be effective in improving
cholesterol levels (Engbers, Van Poppel, & Van Mechelen 2005). In a review of worksite
nutrition and physical activity interventions for controlling employee overweight and obesity, it
was found that worksite nutrition and physical activity programs achieve modest improvements
in employee weight status (Anderson et al., 2009). “Organizational initiatives are influenced by
management support, commitment, and supportive organizational structures to sustain policy
efforts over time” (Sorensen, Linnan, & Hunt, 2004, p. S94). Mhurchu, Aston, and Jebb (2010)
conducted an extensive review on environmental strategies consisting of changes to worksite
nutrition policies and practices such as nutritional labeling, vending policies and menu
reformulation, to determine the impact on employee behavior. They found positive changes in
fruit and vegetable consumption as a result Mhurchu et al. (2010).
Healthcare environments tend to be complex and have a unique role. They provide a
place of employment in a rapidly changing health care environment, and are regarded as experts
for providing community education. They support public health initiatives by providing
education and access to community screenings. Examples include community education and

NUTRITION LABEL 16
support of identification of health risks, tobacco cessation efforts, and healthy nutritional choices.
Nurses represent an important component of the hospital workforce and serve as role models
when caring for patients. “With increased national attention focused on preventing and reducing
obesity, the role of the nurse as behavior models is important to patients, families and
community” (Rush, Kee, & Rice, 2005, p. 167). It is also important to provide a positive
workplace image. Previous research has revealed that people who are overweight question the
validity of advice given by overweight health professional. Therefore, achieving improved
health and physical image for a healthcare professional may have indirect benefits for the
patients and community.
Therefore, the worksite offers opportunities as an environment to provide interventions
that incorporate strategies to influence a healthier nutritional choice. Figure 2 is an example of a
conceptual model that demonstrates the various ways to influence a healthy lifestyle in the
workplace. In worksite ecological model physical environments, informational messaging, and
behavioral social approaches can influence latest choice and behavior which may then influence
the outcome of body composition. A worksite can influence behaviors such as food choice,
dietary intake and physical activity by providing environmental changes and policies that offer
onsite food availability and healthy choices and onsite exercise options. These environmental
conditions support access to affordable healthy food and safety for exercise. Informational
messages support knowledge; social approaches that support social norms with community and
managerial support all influence individual behaviors of food choices, dietary intake and physical
activity there by influencing body size and composition.

NUTRITION LABEL 17
Figure 2. Analytic framework for worksite nutrition and physical activity interventions to improve weight status. Source: Anderson et al., 2009
Macro-environment.
The outer level of an ecological model is the macro-environment. Macro-environments
consist of factors operating within the larger society include food marketing, food production,
and distribution systems, agriculture policies, and economic price structure. The macro/public
policy level factors involve local, state, and federal policies. Although macro level factors are
more distal and indirect, they still effect what people eat.
Choice Engineering
Environments can be structured in a way that promotes well-being making it easier to
promote a healthier lifestyle. A supportive environment is one that offers convenient access to
healthy food choices. “Environmental interventions are advocated at a population level because
individual nutrition behavior change strategies are expensive and labor-intensive relative to the
number of persons they affect” (Seymour, Yaroch, Serdula, Blanck, & Khan, 2004, p. S108).
Worksite and university interventions have a potential for success (Seymour et al., 2004).
Multiple interventions incorporated within an environment offer promise in assisting
individuals to make healthier food choices. Specifically, studies have demonstrated how

NUTRITION LABEL 18
environmental modifications (labeling, increasing healthy choices, and price reductions) can
positively influence dietary intake (Engbers, et al., 2005; Glanz, 1999; Jeffery, French, Raether,
& Baxter, 1994). The Institute of Medicine [IOM] (2001) and U.S. Department of Health and
Human Services and The Advertising Council (2004) report concluded that environmental
strategies (combination of environmental and individual) with a focus on large-scale changes in
dietary and physical activity behaviors are promising approaches to improve dietary and physical
activity behaviors. Examples of environmental interventions include food availability, access,
pricing or information such as point-of-purchase in worksites, universities, grocery stores, and
restaurants.
Pricing.
Recent years have seen a significant increase in concerns about health and wellness and a
corresponding growth in consumer demand for healthy food products (Glazer, 2008). One way
to assist individuals to make healthier food choices is with price structuring. Offering a low
price for healthier options is one approach and higher pricing for less healthier options. When
low fat snacks were added to vending machines at different pricing levels snack sales increased
by 9%-93% respectively based upon the price reduction (French et al., 2001). Another study
looked at the feasibility and long term sustainability of the price reduction strategy. Hannan,
French, Story, and Fulkerson (2002) found that pricing structure may not have been widely
adopted due to the loss of revenue. The study examined whether the purchase pattern in which
prices of targeted high fat foods were raised and targeted low fat foods were lowered. The study
concluded that a pricing strategy is possible and feasible to maintain revenue. Raising the price
on high fat foods serves two purposes; it encourages substitution with a more healthful option,
and it helps to balance revenues.

NUTRITION LABEL 19
Default choices.
Another specific strategy to alter behavioral choice is to alter the default choice. The
default choice is the option that is assigned. The default choice works through applying behavior
economics. When individuals make choices they tend to favor the default option, rather than
taking the time to consider an alternative state. Thaler and Benartzi (2004) found that savings
rates increased dramatically when employees are automatically enrolled. Altering choice
through altering the default option can be applied in healthy options, offering water as the default
beverage in a cafeteria, vegetables or fruit as the default side. One example of a default option is
placing low fat salad dressing options on the salad bar and placing packets of regular salad
dressing across the room. A study at a Chinese takeout restaurant, patrons were asked if they
would prefer a half-serving of rice (without any price discount). Many of them preferred this
option, which had always been available, but had not occurred to them when the full-sized entrée
was offered as the default (Schwartz, Riis, Elbel, & Ariely, 2012).
Nutritional labeling.
The goal of nutritional labeling is to provide accurate food item information to
individuals. Food labels can educate consumers about origins of their food, the practices used to
produce it, or the nutritional content. An example of labels that inform consumers about
nutritional content of foods and beverages is the nutrition information label that appears on the
back of food and beverage packages. The label now required by the U.S. FDA was launched in
1994 in expectation that the information would help curb diet-related disease by helping
consumers make healthier choices. Providing nutritional information and labeling may serve
two purposes, one is that it is a quick way to provide information and awareness, plus offer
choice of purchasing a red, yellow or green item. Research by Buscher, Martin, and Crocker

NUTRITION LABEL 20
(2001) concluded that customers are influenced to choose healthfully when they are aware of
nutrition information about food choices. The type of information that is placed upon on the
label is important because of consumer literacy. The information label must be easy to
understand and be written to be interpreted quickly due to people’s time and attention span.
Previous research has demonstrated that the ability to interpret nutritional information requires
not only high literacy but also high numeracy skills (Rothman et al., 2006). Patients
demonstrated deficits in understanding nutrition labels. Poor label comprehension was highly
correlated with low-level literacy and numeracy skills, but even patients with higher literacy
could have trouble interpreting labels (Rothman et al., 2006). One third of U.S. adults have
trouble reading and acting on health related information (National Association of Adult Literacy,
2006). Although menu labeling is a public health policy, reading and understanding the label is
complex. Using calorie information requires an understanding of one’s total calorie needs and
estimation of serving size. Due to comprehension and literacy levels color coded information
systems have been introduced.
Point of purchase.
Point of purchase interventions are a form of nutritional education. Point of purchase
gives visual cues, these cues are easily recognizable visual prompts (symbols) at the site of food
selection. Examples may be the symbol of a heart to denote an item is “heart” healthy or a stop
light coloring system indication whether an item is acceptable (green), proceed with caution, use
selectively (yellow) or an item this is not a healthy choice (red). A large number of decisions are
made at the time of purchase. Point of purchase signs or color coding may also include
additional labeling.

NUTRITION LABEL 21
Point of purchase programs have also been studied in a variety of workplace settings for
years. In pilot projects conducted by the National Heart Lung and Blood Institute, point of
purchase prompts were shown to influence to sales in the direction of desired change in a
cafeteria and at food vending machines. Reed, Powers, Greenwood, Smith, and Underwood
(2011) noted a significant mean difference in daily fruit consumption. Buscher et al. (2001)
found that it was important to have the nutritional information provided. Studies that utilized
more than one strategy demonstrated potential for success. Thorndike, Sonnenberg, Riis,
Barraclough, and Levy (2012) implemented a two stage experiment. The first stage introduced
nutrition labels that were color coded to help identify the healthfulness of foods and beverages.
In the second stage, the locations of foods and beverages were changed in order to increase the
visibility of the healthy food and beverage choices. Therefore, interventions aimed at
influencing choice may be more successful when multiple interventions are employed.
Thorndike et al. (2012) demonstrated that the color coded intervention improved sales of healthy
items, with the largest change occurring among beverages. During phase 1, sales of all red items
decreased 9.2% and red item beverages decreased by 16.5%. During phase 2, sales of red items
further decreased 4.9% and red item beverages decreased 11.4% (Thorndike et al, 2012). In a
similar study, Levy, Riis, Sonnenberg, Barraclough, and Thorndike (2012) demonstrated that all
the labeling decreased all employees’ red item purchases by 11.2% and increased green item
purchases 6.6%. Red item beverages decreased the most 23.8%. Despite baseline differences in
healthy food purchases, a simple color-coded labeling and choice architecture intervention
improved food and beverage choice among employees from all racial and socioeconomic
backgrounds. Engbers et al. (2005) in a systematic review of worksite health promotion
programs, found that fruit , vegetable, and fat intake can be positively influenced by
NUTRITION LABEL 22
environmental strategies that include point-of-purchase labeling, promotional materials,
expanded availability of healthy foods, and targeted food placement.
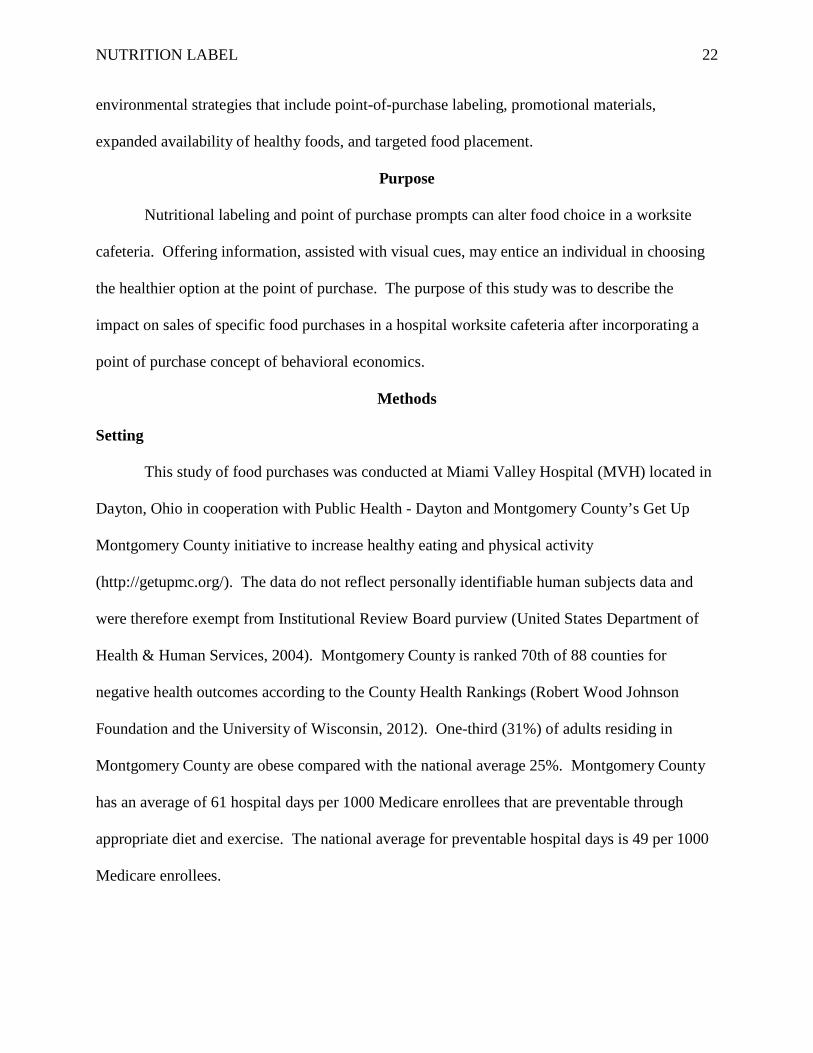
Purpose
Nutritional labeling and point of purchase prompts can alter food choice in a worksite
cafeteria. Offering information, assisted with visual cues, may entice an individual in choosing
the healthier option at the point of purchase. The purpose of this study was to describe the
impact on sales of specific food purchases in a hospital worksite cafeteria after incorporating a
point of purchase concept of behavioral economics.
Methods
Setting
This study of food purchases was conducted at Miami Valley Hospital (MVH) located in
Dayton, Ohio in cooperation with Public Health - Dayton and Montgomery County’s Get Up
Montgomery County initiative to increase healthy eating and physical activity
(http://getupmc.org/). The data do not reflect personally identifiable human subjects data and
were therefore exempt from Institutional Review Board purview (United States Department of
Health & Human Services, 2004). Montgomery County is ranked 70th of 88 counties for
negative health outcomes according to the County Health Rankings (Robert Wood Johnson
Foundation and the University of Wisconsin, 2012). One-third (31%) of adults residing in
Montgomery County are obese compared with the national average 25%. Montgomery County
has an average of 61 hospital days per 1000 Medicare enrollees that are preventable through
appropriate diet and exercise. The national average for preventable hospital days is 49 per 1000
Medicare enrollees.
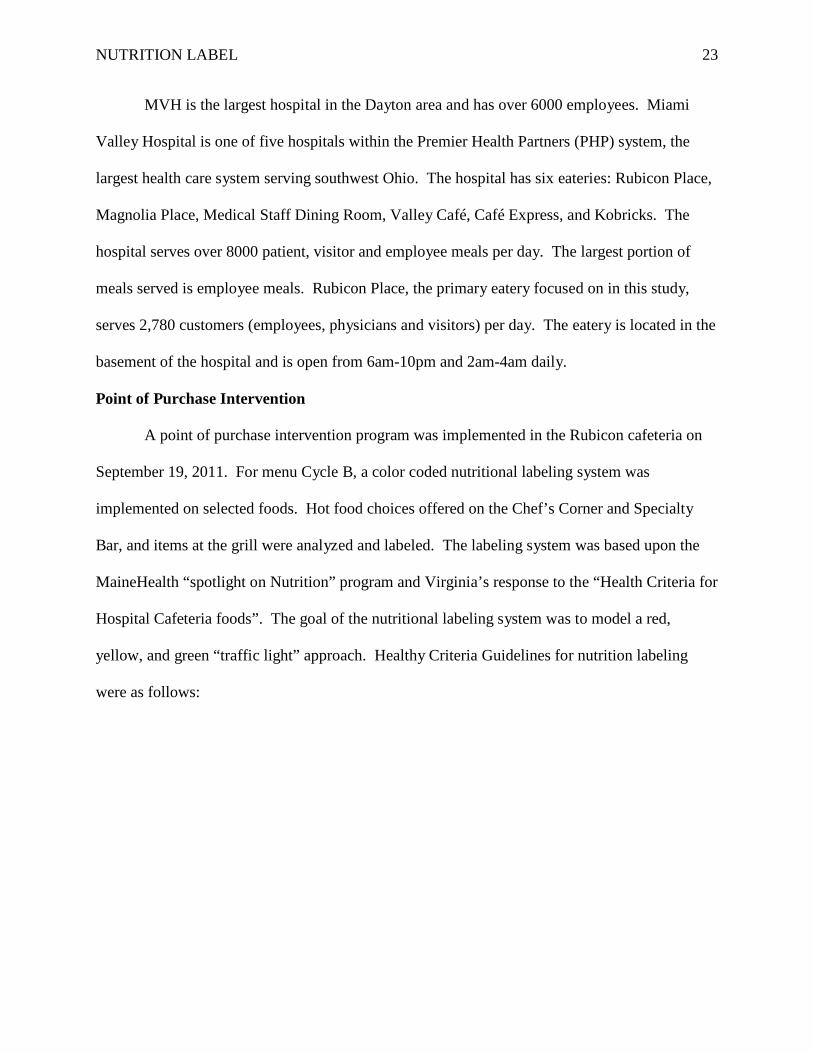
NUTRITION LABEL 23
MVH is the largest hospital in the Dayton area and has over 6000 employees. Miami
Valley Hospital is one of five hospitals within the Premier Health Partners (PHP) system, the
largest health care system serving southwest Ohio. The hospital has six eateries: Rubicon Place,
Magnolia Place, Medical Staff Dining Room, Valley Café, Café Express, and Kobricks. The
hospital serves over 8000 patient, visitor and employee meals per day. The largest portion of
meals served is employee meals. Rubicon Place, the primary eatery focused on in this study,
serves 2,780 customers (employees, physicians and visitors) per day. The eatery is located in the
basement of the hospital and is open from 6am-10pm and 2am-4am daily.
Point of Purchase Intervention
A point of purchase intervention program was implemented in the Rubicon cafeteria on
September 19, 2011. For menu Cycle B, a color coded nutritional labeling system was
implemented on selected foods. Hot food choices offered on the Chef’s Corner and Specialty
Bar, and items at the grill were analyzed and labeled. The labeling system was based upon the
MaineHealth “spotlight on Nutrition” program and Virginia’s response to the “Health Criteria for
Hospital Cafeteria foods”. The goal of the nutritional labeling system was to model a red,
yellow, and green “traffic light” approach. Healthy Criteria Guidelines for nutrition labeling
were as follows:

NUTRITION LABEL 24
Figure 3. Stop light guidelines used in the nutrition labeling system.
Sample Data
The sample for this study consisted of total food sales for selected items included in
the point of decision nutritional labeling campaign over a six month period. The Rubicon
cafeteria has three different menu cycles that rotate throughout the year. Cycle B menu was in
place September 19, 2011-February 12, 2012. Cycle C menu began February 13, 2012
through May 27, 2012, and Cycle A menu May 28, 2012 through September 26, 2012. This
study plan was to focus on the Cycle B menu period September 19, 2011-February 12, 2012.
Each menu cycle has different weekly menus (see Appendix 1).
Twelve menu items were selected to be in the study sample. One entrée, soup, side item,
and dessert were chosen from each of the nutrition color categories: red, yellow, and green. The
sample menu items were chosen based upon their previous popularity (see Figure 4). Monthly
sales totals for the selected menu items were requested from nutrition services for the time
period August 1, 2011-February 29, 2012. This date range included the end of the menu cycle
prior to the point of purchase intervention.

NUTRITION LABEL 25
Figure 4. Sample items used in the study.
In addition to the select red, yellow and green category menu items, salad dressing and
fresh vegetable purchase data was also included. At the time of this study, the hospital was
participating in a local public health initiative called Get Up Montgomery County. Get Up is a
social marketing campaign promoting, among other things, the practice of eating five fruits and
vegetables each day. Changes in salad dressing offerings and fresh vegetable frequency cards
were additional cafeteria strategies. With the new strategy, the default choice of salad dressing
was changed. Fat free dressings were included on the updated salad bar. Regular (full fat)
dressings were offered only by individual packets. This was a shift from previous practice when
few low fat low calorie dressings were offered in the packets and regular (full fat) dressings
options located on the salad bar. Fresh vegetable frequency cards worked like reward cards:
after the purchase of six fresh vegetables the seventh vegetable was free.
Data Analysis Plan
A comparison of the monthly sales totals for the selected menu items from each category
(red, yellow, green) was completed. Each monthly total was compared for any identifiable
NUTRITION LABEL 26
trends. In addition, a monthly comparison of the number of (full fat) salad dressing packets and
fresh vegetable servings was completed. The original analysis plan was hampered by a number
of factors that will be discussed in the results section.
Results
Descriptive Data
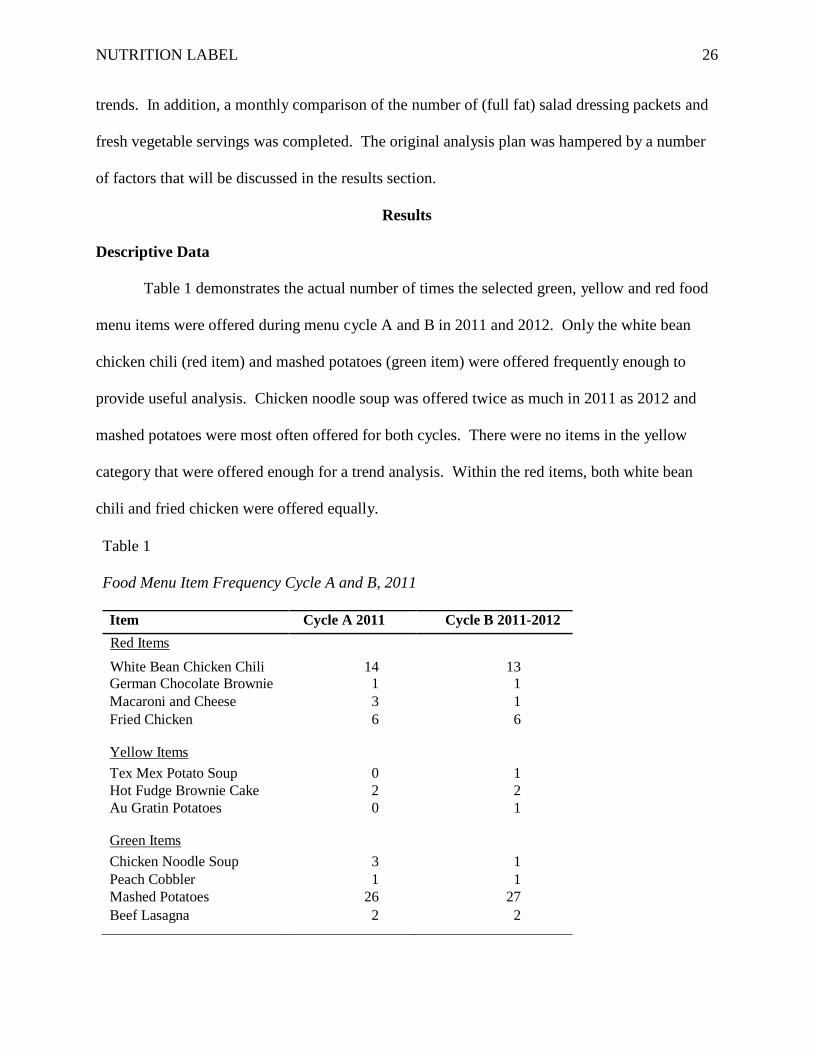
Table 1 demonstrates the actual number of times the selected green, yellow and red food
menu items were offered during menu cycle A and B in 2011 and 2012. Only the white bean
chicken chili (red item) and mashed potatoes (green item) were offered frequently enough to
provide useful analysis. Chicken noodle soup was offered twice as much in 2011 as 2012 and
mashed potatoes were most often offered for both cycles. There were no items in the yellow
category that were offered enough for a trend analysis. Within the red items, both white bean
chili and fried chicken were offered equally.
Table 1 Food Menu Item Frequency Cycle A and B, 2011
Item Cycle A 2011 Cycle B 2011-2012 Red Items White Bean Chicken Chili 14 13 German Chocolate Brownie 1 1 Macaroni and Cheese 3 1 Fried Chicken 6 6
Yellow Items Tex Mex Potato Soup 0 1 Hot Fudge Brownie Cake 2 2 Au Gratin Potatoes 0 1
Green Items Chicken Noodle Soup 3 1 Peach Cobbler 1 1 Mashed Potatoes 26 27 Beef Lasagna 2 2

NUTRITION LABEL 27
Sale
s
Figure 5 represents the actual number of sales for each of the green variables beginning in
August 2011, prior to the implementation of the labeling system through February 2012. The
beef lasagna had a range of 74-326 and the mashed potatoes had a range of 2634-3142. There is
not any identifiable trend noted for all of the sales of each green variable. Figure 6 demonstrates
actual sales total for the selected yellow menu items sold from August 2011 to February 2012.
Due to the lack of frequency that each item was offered sales were minimal. Figure 7 represents
the total sales of the red variables from August 2011 to February 2012. Fried chicken and white
bean chicken chili was both up and down without any identifiable trends. Macaroni and cheese
had a very wide range of 234 to 1045.
3500
3000
2500
2000
1500
1000
500
0
Peach Cobbler Beef Lasagna Chicken Noodle
Soup
Mashed Potatoes
11-Aug
11-Sep
11-Oct
11-Nov
11-Dec
12-Jan
12-Feb
Items Figure 5. Sales total for select green items, August 2011-February 2012.

NUTRITION LABEL 28
Sale
s Sa
les
350
300
250
200
150
100
50
11-Aug
11-Sep
11-Oct
11-Nov
11-Dec
12-Jan
12-Feb
0
Hot Fudge Cake Tex Mex Soup Augratin Potatoes Items
Figure 6. Sales total for select yellow items, August 2011-February 2012.
1800
1600
1400
1200
1000
800
600
400
200
11-Aug
11-Sep
11-Oct
11-Nov
11-Dec
12-Jan
12-Feb
0
German Chocolate Cake
Fried Chicken White Bean Chili Mac & Cheese Side
Items Figure 7. Sales total for select red items, August 2011-February 2012.

NUTRITION LABEL 29
Sale
s
Caul
iflow
er
Calif
n Ve
g N
orm
d Ve
g Ca
rrot
s M
idor
i Veg
Gr
een
Bean
s Pr
ince
Chr
Ke
y W
est
Carib
bean
Ca
pri V
eg
Broc
coli
Italia
n O
rient
al
Squa
sh
Med
ley
Snow
Pea
s Gr
illed
Sn
ap P
eas
Without any identifiable trends from the selected variables as noted in Figure 4 there is
lack of any information that is able to be gained from the data that was chosen for the project.
Therefore data was obtained using all fresh vegetables (see Figure 8).
700
600
500
400
300
200
100
0
11-Aug
11-Sep
11-Oct
11-Nov
11-Dec
12-Jan
12-Feb
Items Figure 8. Sales total for select fresh vegetables, August 2011-February 2012.
Eighteen fresh vegetables were offered, fresh green beans was most popular for the months
of August 2011, September 2011 and February 2012. Sales rose and fell over the time period.
There was no trend established in either direction. This trend analysis again shows that there are
not any identifiable trends that are able to be concluded from this data set. There are very wide
ranges and sales totals are increased for one month and then decreased the following month.
Data Analysis
Analysis of the data became difficult due to several factors. Table 2 represents planned analysis
and the problems that were encountered with the data

NUTRITION LABEL 30
Table 2
Analysis Plan Steps and Associated Problem Encountered Analysis Plan Problem Encountered Compare monthly menu items sales totals. Menu item availability. Compare menu items by category color. Menu item recipe formulation changes. Request more data to address problems. Data format and availability. Menu Item Availability
Items were chosen to include an entrée, soup, dessert, and side item from each food
group. Upon obtaining the data it was discovered that all of the items were not offered on the
menu cycles with the same frequency; some items being offered more frequently such as mashed
potatoes 26/27 and some items not offered every month such as fried pork chop which was
deleted from the menu. This made analysis very difficult. Lack of frequency of the selected
green, yellow and red menu resulted in a very low number for analysis.
Menu Item Recipe Formulation Changes
Another complication that was identified is the recipes for the selected menu items were
constantly changing during the menu cycle. From the beginning of the implementation of the
labeling program, the goal for the nutrition services department was to increase the number of
green and yellow items and decrease the number of red items. This resulted in the recipes being
modified to become more nutritious. For example, the white bean chicken chili was a red item
when the labeling began (September 2011) but, within two months, the soup was modified and
became a yellow item according to the labeling criteria. Though it was discovered that monthly
comparison of items or trend analysis would not be accurate, food service surveys and direct
reports indicated that the point of decision prompts were increasing awareness and influencing
NUTRITION LABEL 31
choices. Therefore, an attempt was made to obtain more data. Additional data was requested for
all data for August 2011 through February 2012 and a trend analysis was planned for all red, all
yellow and all green items.
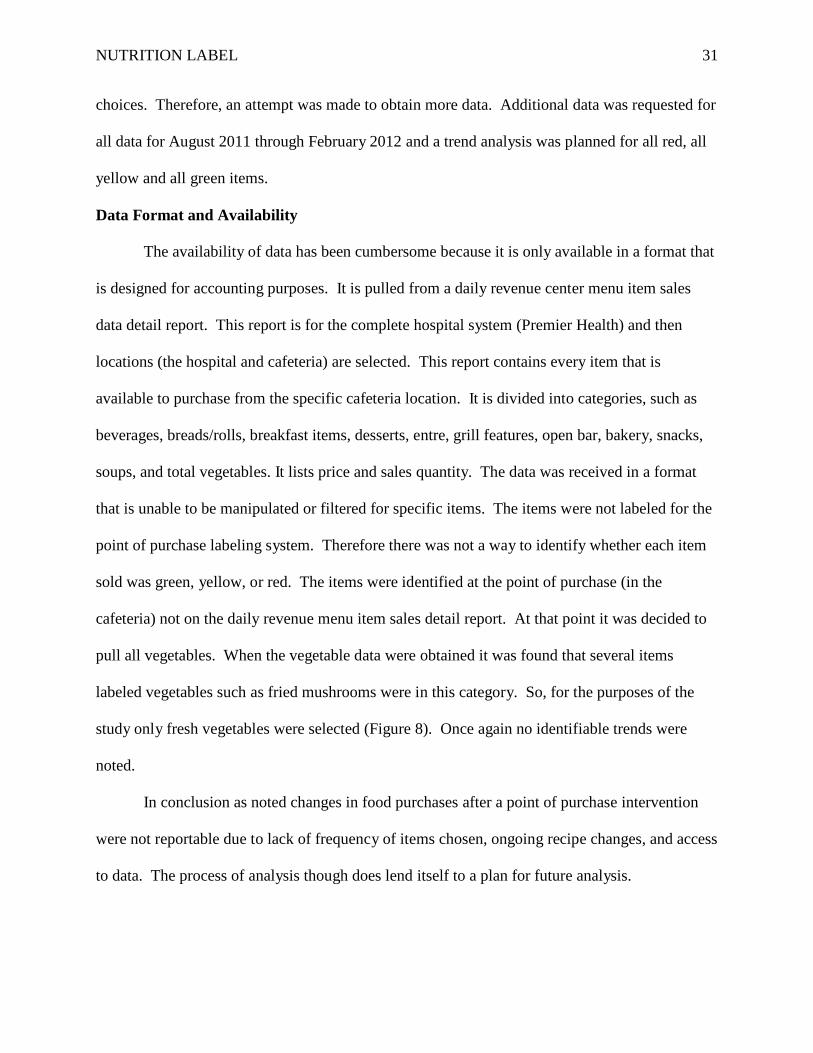
Data Format and Availability
The availability of data has been cumbersome because it is only available in a format that
is designed for accounting purposes. It is pulled from a daily revenue center menu item sales
data detail report. This report is for the complete hospital system (Premier Health) and then
locations (the hospital and cafeteria) are selected. This report contains every item that is
available to purchase from the specific cafeteria location. It is divided into categories, such as
beverages, breads/rolls, breakfast items, desserts, entre, grill features, open bar, bakery, snacks,
soups, and total vegetables. It lists price and sales quantity. The data was received in a format
that is unable to be manipulated or filtered for specific items. The items were not labeled for the
point of purchase labeling system. Therefore there was not a way to identify whether each item
sold was green, yellow, or red. The items were identified at the point of purchase (in the
cafeteria) not on the daily revenue menu item sales detail report. At that point it was decided to
pull all vegetables. When the vegetable data were obtained it was found that several items
labeled vegetables such as fried mushrooms were in this category. So, for the purposes of the
study only fresh vegetables were selected (Figure 8). Once again no identifiable trends were
noted.
In conclusion as noted changes in food purchases after a point of purchase intervention
were not reportable due to lack of frequency of items chosen, ongoing recipe changes, and access
to data. The process of analysis though does lend itself to a plan for future analysis.

NUTRITION LABEL 32
Discussion
Cardiovascular disease continues to be the leading cause of death in the United States,
and is followed by cancer and stroke. Proper nutrition and diet play an important role in
prevention of these three leading causes of death and disability. Healthy eating consists of a
combination of behaviors, including the consumption of fruit and vegetables, choosing whole
grains and low-fat proteins and the minimization of the intake of sodium. Eating behaviors
develop over a lifetime, and are influenced by many environmental factors.
In an ecological model, several levels of environmental factors, such as a system level
influence a person’s behavior. The worksite setting is one example of an organizational
environment that can have opportunities to provide multilevel interventions to supportive health
promotion. In cafeterias, worksites can influence healthy behaviors by offering environmental
changes that promote healthier food choice, such as nutritional labeling and point of purchase
prompts. Points of purchase interventions give visual cues that are easily recognizable, such as a
stop light labeling system.
Food Selection Changes
There were several factors identified that affected the plans for analysis, thereby affecting
the ability to describe the results. One specific menu cycle time frame and only a few selected
food items, proved inappropriate for proper analysis. Due to the great variety of the food entrees
and sides items offered in the menu cycle, the selected foods items were not offered in enough
consistency for an analysis. Review of previous studies suggests, a better option would have
been to compare sales of all items within the green category and all items within the red
category. Using the total items sold for each category would have allowed us to report items as a
proportion of total sales, and not look directly at frequency of a few color-coded items. In a

NUTRITION LABEL 33
similar point-of-purchase study of college students, Freedman and Connors (2010) did not
demonstrate significant difference in sales of any food item between baseline and intervention.
However, overall sales of tagged items, as a percentage of total sales within each cereal, soup,
and cracker category, increased as a result of the intervention (Freedman & Connors, 2010.).
In addition to problems with the sample selected, a second methodological issue with the
evaluation was that recipes continued to be modified during the menu cycle. In the real world of
the cafeteria, increasing the number of healthy options in the cafeteria is a good thing. It created
difficulty with the evaluation though; items started in one color-coded category and ended the
study period in another category. Red item recipes, such as the white bean chili, were modified
to become a healthier recipe, and as a result become coded as a yellow item. While this is a very
good overall goal for the nutrition services department to offer healthier items; a better solution
would be to not alter the food items during the menu cycle or during the study time frame. In a
similar study, in which certain entrée items were targeted and designated as a healthy entrée, no
recipes were modified from baseline formulations (Sproul, Canter, & Schmidt, 2003).
Promotional information and displays were available during the time period. Approximately
60% of the respondents reported that they had noticed the promotional materials. The majority
79% indicated that the presence of these materials did not influence their meal selections. In
another study where the worksite had been undergoing a series of changes to offer healthier
items, data had been collected six days prior, and six days post intervention (Schmitz & Fielding,
1986).
A third area that affected the ability to describe changes in food selection involved the
availability of useful data for evaluation of the sales. The daily revenue sheets that were used for
the trend analysis did not have a way to identify which items had been labeled or categorized.

NUTRITION LABEL 34
They were only available in paper PDF format that could not be “filtered” or manipulated to
adjust for certain variables. This made the data very cumbersome. All data had to be pulled
manually and then placed in a separate spreadsheet.
Future System Application
In looking at opportunities for improvement in the evaluation process, it is important to
understand how other researchers have documented changes in food choice after implementing a
point of purchase labeling system. More recently, since our study was implemented, two
additional similar studies have been released that offer possible solutions to limitations that were
identified in our study. Other researchers have measured changes by a) measuring the
intervention during a period of time, b) using all the data in a particular area or category; not just
individual items or variables, c) collecting the data in a different format that has been set up
ahead of time so the data collection is an easier process and, d) inclusion of additional cafeteria
categories in the labeling program, such as beverages.
Phases of point of purchase.
To evaluate changes that may occur from an intervention, it is important to have a pre
intervention period and a post intervention period. Offering the implementation of a study in
particular period of time allows the opportunity to just measure what may be occurring within
that particular time period. Nothing is changed except what is within the intervention. Having
both a pre and post intervention measurement supports conclusions that changes can be attributed
to the intervention. For example, Reed evaluated the eating behaviors of college students
following PowerPoint messaging located between the cookie and fruit selection, the intervention
occurred for 9 days. A significant mean difference in daily fruit consumption was found
following the slide presentation. Average daily fruit consumption at baseline was 408

NUTRITION LABEL 35
(SD=73.43). Post baseline average daily fruit consumption significantly increased (533;
SD=102). The point of decision messaging significantly influenced fruit selection in a single
dining room setting. Cookie and fruit consumption was measured 9 days pre and 9 days post
intervention (Reed et al., 2011). In a similar study at Massachusetts General Hospital in Boston a
2-phase labeling intervention was implemented. Baseline data was collected for three months
then a two phase intervention was implemented for six months. Phase 1 was a labeling
intervention of a simple color-coded scheme which provided information about healthy cafeteria
items. Phase 2 was an architecture intervention involving food display and placement. The
primary outcome was change in sales of red and green items from baseline to phase 1 and from
phase 1 to phase 2. The results were able to show the proportion of sales of red and green items
between baseline, phase1 and phase2 (Thorndike et al., 2012).
Data selection and measures.
When deciding to undertake the study, it was known that daily sales sheets listing every
item sold were available to use for collection purposes. However, it was later discovered that the
sales sheets provided challenges, a) the sheets were not available in an electronic format so that
the selected variables would be easily extracted, b) the selected variables were not offered each
and every day; and they were not easy to identify on the daily sales sheets. Because data had to
be manually reentered into Excel, only select items were chosen for the sample. Several studies
have addressed the sampling issues by using a computerized cash register system which
categorizes the sales data, a) placing the targeted items into a particular category they are easily
identified in a specific sales category, b) sampling every item in the category, and c) through
observation.

NUTRITION LABEL 36
A computerized system is helpful to address the data set issues. In a more recent study,
Thorndike et al. (2012) labeled all items as red, yellow or green on the basis of the United States
Department of Agriculture’s 2005 My Pyramid healthy eating recommendations. Before
collecting any data, all cafeteria cash registers were programmed to capture the information
needed to identify an item as red, yellow, or green. Throughout the study, register data was
exported daily. Additionally the cashiers who worked during the study were trained to enter
specific names of food and beverages (Thorndike et al., 2012). In another study, the items were
placed into categories within a computerized cash-register system and the selected variables
identified ahead of time in the cash register system. If unable to manipulate or alter a specific
cash register system for categorizing specific food items, existing food categories may be used
for the study. For example Freedman and Connors (2010) used specific food categories that
were already identifiable in sales; cereal, bread, soup, cracker, canned vegetables, granola/energy
bar, and salad dressing. While it may not be possible to “program cash registers” it is important
to understand how items are categorized when entered into the register system to evaluate if there
are additional opportunities that would assist with identification on the daily sales sheets.
In another study of college students a specific campaign, “Eat Smart” was introduced
which provided information on which items were healthful food items and the items were tagged
with the “Fuel Your life” logo. All sales of tagged items were compared to sales of the same
items during the intervention period. Second tagged items as a percentage of total items sold in
each category were calculated, and sales were compared for the two time periods (Freedman and
Connors, 2010).
Finally, in lieu of tracking total sales of select or all food items, others have tracked food
selection changes at the individual level. In a hospital cafeteria setting, after implementing of a

NUTRITION LABEL 37
color-coded labeling system, Levy and colleagues (2012) tracked individual employee purchases.
Employee purchases were tracked via employee identification. He concluded despite baseline
differences in healthy food purchases, a simple color-coded labeling intervention improved food
and beverage choices among employees from all racial and socioeconomic backgrounds (Levy et
al., 2012.).
Food categories.
Understanding how pre-established food categories are set up is another component that
is important to define prior to beginning a study. For example when it was realized the
frequency of individual food items were too low for comparison, we looked at using a pre-
established specific category that was already in the cash register system. As we looked at the
category labeled vegetables, we discovered that fried vegetables were included in this category.
If using pre-established categories it is important to understand everything that is placed in that
category. We therefore used the “fresh” vegetables and manually pulled them from the sales
sheets. As mentioned before, another researcher used existing categories of cereal, soup, and
crackers and tagged those categories then looked at the percent of tagged items to the overall
sales total (Freedman & Connors, 2010).
Another option that may be important to consider would be the inclusion of beverages in
the intervention. Beverages were not included in the labeling system, but have been used in
other studies. Thorndike et al. (2012) concluded that a color-coded labeling intervention
improved sales of healthy items. The largest changes occurred among beverages. The purchase
of red beverages decreased 16.5% during phase 1 and further decreased by 11.4% in phase 2.
The purchase of green beverages increased 9.6% in phase 1 and 4.0% in phase 2 and, bottled
water consumption increased 25.8% overall (Thorndike et al., 2012). Labeling of beverages is an

NUTRITION LABEL 38
additional important factor, as the consumption of sugar sweetened beverages has increased over
the last few years and the epidemiologic evidence grows for the role between sugary beverages
and poor health outcomes, including obesity, diabetes and heart disease (Malik, Popkin, Bray,
Despres, & Hu, 2010).
Public Health Implications
Worksites can play a very powerful role in the health of a population. A majority of
Americans (66%) are employed outside the home, making worksite an important environment to
implement change (Bureau of Labor Statistics, 2007). Worksites are viable settings for reaching
large numbers of working adults of varying socioeconomic levels and ethnic backgrounds (Pratt
et al., 2007). As the cost of health care in the United States continues to increase, chronic disease
comprises the majority of health care expenditures, accounting for seventy five percent of the
nation’s annual health care costs and affecting greater than one third of working-age Americans
(Milani & Lavie, 2009). Interventions that improve worksite health also have public health
implications to impact the community and population health. Many national strategic policies
include worksites and the importance they play in improving the health of our country. For
example the National Prevention Strategy includes seven priorities to improve the health and
wellness of the U.S. population.
The importance of evaluating worksite health promotion programs cannot be over looked.
Especially, as we become more of a data driven society, we note the importance of evidence
based outcomes to substantiate the need and support for particular programs. Accurate data,
analysis, and evaluation systems must be planned for; specifically, playing close attention to the
data set prior to beginning a study. Accurate studies lead to evidence based practices that can be
taken forward to impact public health. For example data is used for programs such as

NUTRITION LABEL 39
implementation of flu vaccine at the worksite. Another example is how providers are reimbursed
for services; the new Medicare rules dictate how much a provider will be reimbursed, based upon
quality indicators such as infection rates and patient satisfaction. Employers are establishing
guidelines for their employees’ biometrics and health insurance rates. Programs that help to
establish healthy eating practices play a role in educating the employee to healthier options.
Therefore, to lead to a valuable conclusion for any program, it is important to have available data
that will be able to measure for the relevant outcome.
Conclusion
Overall, while this study was not able to measure changes in the food purchases of the
study variables, there are several positive points to mention. While menu items continued to
change, there is always a very wide variety of fruits and vegetables that are offered on every
menu. In addition, recipes continue to be modified to become healthier items. Finally, the
worksite is continuing to modify and offer more green items with every menu. To date the
cafeteria offers between 60 and 70% of green choices on its daily menu. In addition, this
cafeteria is one of several within the hospital and the Premier Health system. The labeling is
being expanded to other eateries and expanded to additional hospitals within the Premier Health
system. The focus of this study and interactions with the leadership in nutrition services helped
raise the level of awareness and response for helping modify employee healthy behaviors by
continually to offer more healthy green food choices.
NUTRITION LABEL 40
References
American Heart Association [AHA]. (2002). AHA guidelines for primary prevention of
cardiovascular disease and stroke: 2002 update: consensus panel guide to comprehensive
risk reduction for adult patients without coronary or other atherosclerotic vascular
diseases. Circulation, 106, 388-391.
American Heart Association [AHA]. (2006). Diet and lifestyle recommendations revision 2006:
A scientific statement from the American Heart Association nutrition committee.
Circulation, 114, 82-96.
American Heart Association [AHA]. (2009). Implementing American Heart Association
pediatric and adult nutrition guidelines: A scientific statement from the American Heart
Association nutrition committee of the council on nutrition, physical activity, and
metabolism, council of cardiovascular disease in the young, council on arteriosclerosis,
thrombosis and vascular biology, council on cardiovascular nursing, council on
epidemiology and prevention, and council for high blood pressure research. Circulation,
119, 1161-1175.
American Heart Association [AHA]. (2011). Value of primordial and primary prevention for a
cardiovascular disease: A policy statement from the American Heart Association.
Circulation, 124, 967-990.
American Heart Association [AHA]. (2012). Executive Summary: Heart disease and stroke
statistics-2012 update: A report from the American Heart Association. Circulation, 125,
188-197.
Anderson, L. M., Quinn, T. A., Glanz, K., Ramirez, G., Kathwati, L. C., Johnson, D. B.,
Buchanan, L. R., Archer, W. R., Chattopadhyay, S., Kalra, G. P., & Katz, D. L. (2009).

NUTRITION LABEL 41
The effectiveness of worksite nutrition and physical activity interventions for controlling
employee overweight and obesity: a systematic review. American Journal of Preventative
Medicine, 37(4), 340-57.
Appel, L. J., Sacks, F. M., Carey, V. J., Obarzanek, E., Swain, J. F., Miller, E. R., Conlin, P. R.,
Erlinger, T. P., Rosner, B. A., Laranjo, N. M., Charleston, J., McCarron, P., & Bishop, L.
(2005). Effects of protein, monounsaturated fat, and carbohydrate intake on blood
pressure and serum lipids. Journal American Medicine Association, 294(19), 2455-2464.
Appel, L. J., Moore, T. J., Obarzanek, E., Vollmer, V. M., Svetkey, L. P., Sacks, F. M., Bray, G.
A., Vogt, T. M., Cutler, J. A., Windhauser, N. M., Lin, P. H., & Karanja, N. (1997). A
clinical trial of the effects of dietary patterns on blood pressure. DASH Collaborative
Research Group. New England Journal of Medicine, 336(16), 1117-1124.
Bray, G. A., & Popkin, B. M. (1998). Dietary fat intake does affect obesity. American Journal
Clinical Nutrition, 68(6), 1157-1173.
Binkley, J. K., Eales, J., & Jekanowski, M. (2000). The relationship between dietary changes and
rising U.S. obesity. International Journal of Obesity and Related Metabolic Disorders,
24(8), 1032-1039.
Birch, L. (1999). Development of food preferences. Annual Review of Nutrition, 19(1), 41-62.
Buscher, L., Martin, K., & Crocker, S. (2001). Point-of-purchase messages framed in terms of
cost, convenience, taste, and energy improve healthful snack selection in a college food
service setting. Journal of the American Dietetic Association, 101(8), 909-913.
Calle, E. E., Roderiquez, C., Walker-Thurmond, K., & Thun, M. J. (2003). Overweight, obesity,
and mortality from cancer in a prospectively studied cohort of U.S. adults. The New
England Journal of Medicine, 348(17), 1625-1638.

NUTRITION LABEL 42
Clendenen, V. L, Herman, C. P., & Polivy, J. (1994). Social facilitation of eating among friends
and strangers. Appetite, 23(10), 1-13.
Cullen, K. W., Baranowski, T., Rittenberry, L., Cosart, C., Herbert, D., & De Moor, C. (2001).
Child-reported family and peer influences on fruit, juice, and vegetable consumption:
reliability and validity of measures. Health Education Research, 16(2), 187-200.
Engbers, L. H., Van Poppel, M. N., Chin, A. P. M. J., & Van Mechelen, W. (2005). Worksite
health promotion programs with environmental changes: A systematic review. American
Journal Preventive Medicine, 29(1), 61-70.
Freedman, M. R., & Connors, R. (2010). Point-of- purchase nutrition information influences
food purchasing behaviors of college students: A pilot study. Journal of the American
Dietetic Association, 110(8), 1222-1226.
French, S. A., Jefferey, R. W., Story, M., Breitlow, K. K., Baxter, J. S., Hannana, P., & Snyder,
P. (2001). Pricing and promotion effects on low fat vending snack purchases: The CHIPS
Study. American Journal of Public Health, 91(1), 112-117.
Fung, T. T., Schulze, M., Manson, J. E., Willet, W. C., & Hu, F. B. (2004). Dietary patterns meat
intake and the risk of type 2 diabetes in women. Internal Medicine, 164(20), 2235-2240.
Gibson, E. L., Wardle, J., &Watts, C. J. (1998). Fruit and vegetable consumption, nutritional
knowledge and beliefs in mother and children. Appetite, 31(2), 205-228.
Glanz, K. (1999). Progress in dietary behavior change. American Journal Health Promotion,
14(2), 112-117.
Glazer, F. (2008). NPD: Consumers pricing industry is behind. Nation’s Restaurant News,
14(21), 50.

NUTRITION LABEL 43
Grimm, G. C., Harnack, L., & Story, M. (2004). Factors associated with soft drink consumption
in school-aged children. Journal of the American Dietetic Association, 104(12), 44-49.
Guthrie, J. F., Lin, B. H., Frazao, E. (2002). Roles of food prepared away from home in the
American diet. Journal of Nutrition Education and Behavior, 34(3), 140-150.
Halpin, H. A., Morales-Suarez-Varela, M. M., & Martin-Moreno, J. M. (2010). Chronic disease
prevention and the new public health. The New Public Health, 32(1), 120-154.
Hannan, P., French, S. A., Story, M., & Fulkerson, J. A. (2002). A pricing strategy to promote
sales of lower fat foods in high school cafeterias: Acceptability and sensitivity analysis.
American Journal of Health Promotion, 17(1), 1-12.
Hu, F. B., & Willett, W. C. (2002). Optimal diets for the prevention of coronary heart disease.
Journal of the American Medical Association, 288(20), 2569-2578.
Institutes of Medicine. (2001). Hurtado, M., Swift, E. K., Corrigan, J.M.. Envisioning the
national health care quality report. Retrieved from
http://www.nap.edu/catalog/10073.html
James, D. (2004). Factors influencing food choices, dietary intake, and nutrition-related attitudes
among African Americans: application of a culturally sensitive model. Ethnicity and
Health, 9(4), 349-367.
Jeffery, R. W., French, S. A., Raether, C., & Baxter, J. E. (1994). An environmental intervention
to increase fruit and salad purchases in a cafeteria. Preventive Medicine, 23(6), 788-792.
Je’quier, E., & Tappy, L., (1999). Regulation of body weight in humans. Physiological Reviews,
79(2), 451-480.
Knoops, K., Groot, L. C., Fidanza, F., Kromhout, D., & Van Staveren, W. A. (2006).
Comparison of three different dietary scores in relation to 10-year mortality in elderly

NUTRITION LABEL 44
European subjects: the HALE Project. European Journal of Clinical Nutrition, 60(6),
746-755.
Levy, D. E., Riis, J., Sonnenberg, L. M., Barraclough, S. J., & Thorndike, A. N. (2012). Food
choices of minority and low-income employees a cafeteria intervention. American
Journal of Preventive Medicine, 43(3), 240-248.
Lytle, L. A., Varnell, S., Murray, D. M., Story, M., & Perry C. (2003). Predicting adolescents’
intake of fruits and vegetables. Journal of Nutrition Education and Behavior, 35(4), 170-
175.
Malik, V. S., Popkin, B. M., Bray, G. A., Despres, J. P., & Hu, F. B. (2010). Sugar-sweetened
beverages, obesity, type 2 diabetes mellitus, and cardiovascular disease risk. Circulation,
121(11), 1356-1364.
Matson-Koffman, D. M., Brownstein, J. N., Neiner, J.A., & Greaney, M. L., (2005). A site
specific literature review of policy and environmental interventions that promote physical
activity and nutrition for cardiovascular health: What works? American Journal of Health
Promotion, 19(3), 167-192.
Matson-Kothman, D., Grenade, S. A., & Anwuri, V. V. (2008). Strategies for establishing
policy, environmental, and systems-level interventions for managing high blood pressure
and high cholesterol in health care settings: A qualitative case study. Preventing Chronic
Disease Public Health research, Practice, and Policy, 5(3), 1-16.
McCrory, M. A., Fuss, P. J., Hays, N. P. Vinken, A. G., Greenberg, A. S., & Roberts, S. B.
(1999). Overeating in America: association between restaurant food consumption and
body fatness in healthy adult men and women ages 19 to 80. Obesity Research, 7(6), 564-
571.

NUTRITION LABEL 45
Mhurchu, C., Aston, L., & Jebb, S. (2010). Effects of worksite health promotion interventions on
employee diets: A systematic review. BMC Public Health, 10(62), 62-73.
Milani, R. V., & Lavie, C. J. (2009). Impact of Worksite Wellness Intervention on Cardiac Risk
Factors and one-Year Health Care Costs. The American Journal of Cardiology, 104(10),
1389-1392.
Molaison, E. F., Connell, C. L., Stuff, J. E., Yadrick, M. K., & Bogle, M. L. (2005). Influences
on fruit and vegetable consumption in low-income black American adolescents. Journal
of Nutrition Education and Behavior, 37(5), 246-251.
National Association of Adult Literacy. (2006) The health literacy of American adults. Retrieved
March 28, 2012 from http://nces.ed.gov/naal/
Pereira, M. A, Kartashov, A. I., Ebbeling, C. B., Van Horn, L., & Slattery, M. L. (2005). Fast
food habits, weight gain, and insulin resistance (the CARDIA study): 15-year prospective
analysis. Lancet, 365(9453), 36-42.
Pratt, C., Lemon, S. C., Fernandez, I. D., Goetzel, R., Beresford, S. A., French, S. A., Stevens,
V. J., Vogt, T. M., & Webber, L. S. (2007). Design characteristics of worksite
environmental interventions for obesity prevention. Obesity, 15(9), 2171-2180.
Reed, J., Powers, A., Greenwood, M., Smith, W., & Underwood, R. (2011). Using “point of
decision” messages to intervene on college students’ eating behaviors. American Journal
of Health Promotion, 25(5), 298-300.
Reinaerts, E., De Nooijer, J., Candel, M., & DeVries, N. (2007). Explaining school children’s
fruit and vegetable consumption: the contributions of availability, accessibility, exposure,
parental consumption and habit in addition to psychosocial factors. Appetite, 48(2), 248-
258.

NUTRITION LABEL 46
Robert Wood Johnson Foundation and University of Wisconsin Population Health Institute.
(2012). County health rankings. Retrieved October 24, 2012 from
http://www.countyhealthrankings.org
Robinson, T. (2008). Applying the socio-ecological model to improving fruit and vegetable
intake among low income African Americans. Journal Community Health, 33(6) 395-
406.
Rothman, R. L., Housam, R., Weiss, H., Davis, D., Gregory, R., Gebretsadik, T., Shintani, A., &
Elasy, T. A. (2006). Patient understanding of food labels; the role of literacy and
numeracy. American Journal of Preventative Medicine, 31(5), 391-398.
Rush, K. L., Kee, C. C., & Rice, M. (2005). Nurses as imperfect role models for health
promotion. Western Journal of Nursing Research, 27(2), 166-183.
Schmitz, M. F., & Fielding, J. E. (1986). Point-Of-Choice Nutritional Labeling: Evaluation in a
Worksite Cafeteria. Journal of Nutritional Education, 18(1), S65-S68.
Schwartz, J., Riis, J., Elbel, B., & Ariely, D. (2012). Inviting consumers to downsize fast food
portions significantly reduces calorie consumption. Health Affairs, 31(2), 1-9.
Seymour, J., Yaroch, A., Serdula, M., Blanck, H., & Khan, L. (2004). Impact of nutrition
environmental interventions on point-of-purchase behavior in adults: A review.
Preventive Medicine, 39(2), S108-S136.
Shepherd, J., Harden, A., Rees, R., Brunton, J., Garcia, S. O., & Oakley, A. (2006). Young
people and healthy eating: a systematic review of research on barriers and facilitators.
Health Education Research Theory and Practice, 21(2), 239-257.
Sorensen, G., Linnan, L., & Hunt, M. K. (2004). Worksite-based research and initiatives to
increase fruit and vegetable consumption, Preventive Medicine, 39(2), S94-100.

NUTRITION LABEL 47
Sproul, A., Canter, D., & Schmidt, J. (2003). Does point-of-purchase nutrition influence meal
selections? A test in an army cafeteria. Military Medicine, 168(7), 556-560.
Story, M., Kaphingst, K. M., & French, S. (2006). The role of schools in obesity prevention.
Future Child, 16(1), 109-142.
Story, M., Kaphingst, K. M., Robinson-O’Brien, R., & Glanz, K. (2008). Creating healthy food
and eating environments: Policy and environmental approaches. The Annual Review of
Public Health, 29(1), 253-273.
Thaler, R. H., & Benartzi, S. (2004). “Save More Tomorrow ™: Using behavioral economics to
increase employee saving.” Journal of Political Economy, 112(S1), S164-S187.
Thorndike, A., Sonnenberg, L., Riis, J., Barraclough, S., & Levy, D. (2012). A 2-phase labeling
and choice architecture intervention to improve healthy food and beverage choices.
American Journal of Public Health, 102(3), 527-533.
United States Bureau of Labor Statistics. (2007). Retrieved June 26, 2012 from
www.bls.gov/data/home
United States Department of Agriculture. (1985). Dietary Guidelines for Americans. Retrieved
September 28, 2012 from www.capp.usda.gov/DGAsPreviousGuidelines
United States Department of Agriculture. (1990). Dietary Guidelines for Americans. Retrieved
September 28, 2012 from www.capp.usda.gov/DGAsPreviousGuidelines
United States Department of Agriculture. (2010). Dietary Guidelines for Americans. Retrieved
September 28, 2012 from www.dietaryguidelines.gov
U.S. Department of Health and Human Services and The Advertising Council. (2004). Healthy
Lifestyles and Disease Prevention Media Campaign Report, March 2004. Retrieved from

NUTRITION LABEL 48
http://www.adcouncil.org/content/download/1410/12408/file/Healthy-Lifestyles_white-
paper.pdf
United States Food & Drug administration [FDA]. (2006). The Keystone Report. Retrieved June
26, 2013 from www.fda.gov/Food/LabelingNutrition/ReportsResearch/ucm082064.htm
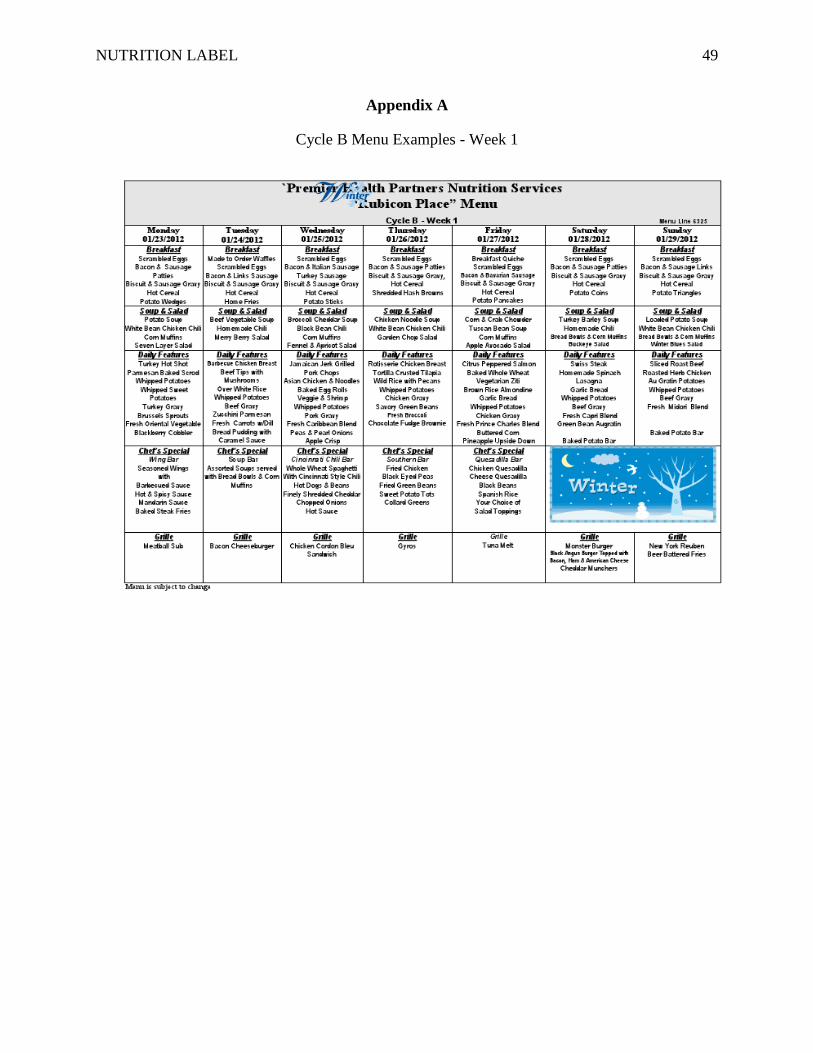
NUTRITION LABEL 49
Appendix A
Cycle B Menu Examples - Week 1

NUTRITION LABEL 50
Appendix A Cont’d
Cycle B Menu Examples – Week 2

NUTRITION LABEL 51
Appendix A Cont’d
Cycle B Menu Examples – Week 3

NUTRITION LABEL 52
Appendix A Cont’d
Cycle B Menu Example – Week 4

NUTRITION LABEL 53
Appendix B
Sign Examples
Friday Cycle A-3 2011
Scrambled Eggs (1 Scoop/Serving) $0.75Bacon (slice) $0.65Bavarian Sausage $1.95Biscuit $0.65
with Sausage Gravy $1.50Hot Cereal $0.75 Potato Munchers
(10 in an order) $1.95(Each) $0.25
French Toast Sticks (each) $0.60
GREEN…Choose Often
YELLOW…Choose Sometimes
RED…Choose SparinglyFriday Cycle A-1 2012
Friday Cycle A-3 2011
Roast Turkey $2.95Turkey Hot Shot $3.50Grilled Pork Chop $3.50
in a Tomato Wine SauceBaked Sweet Potato $1.25Whipped Potatoes $0.95
with Turkey GravyFresh Sugar Snap Peas $1.75
with MushroomsFresh Midori Blend $1.75Apple Cobbler $1.50
GREEN…Choose Often
YELLOW…Choose Sometimes
RED…Choose SparinglyFriday Cycle A-1 2012
Friday Cycle A-3 2011
Grilled Chicken StripsPulled Pork
Pulled ChickenBeef Brisket
Your Choice ofSweet BBQ Sauce Spicy BBQ Sauce
Traditional BBQ Sauce
$0.52 per ounce
Curly Fries $1.50
GREEN…Choose Often
YELLOW…Choose Sometimes
RED…Choose SparinglyFriday Cycle A-1 2012
Friday Cycle A-3 2011
Grilled Pork Chopin a Tomato Wine SauceWhipped Potatoes
Fresh Sugar Snap Peaswith Mushrooms
orFresh Midori Blend
20 oz. Fresh Brewed Ice Tea or
Bottled Water$0.50 Meal Deal Discount
GREEN…Choose Often
YELLOW…Choose Sometimes
RED…Choose SparinglyFriday Cycle A-1 2012

NUTRITION LABEL 54
Appendix C
Photo Examples

NUTRITION LABEL 55
Appendix D
List of Tier 1 Core Public Health Competencies Met
Domain #1: Analytic/Assessment Identify the health status of populations and their related determinants of health and illness (e.g., factors contributing to health promotion and disease prevention, the quality, availability and use of health services) Describe the characteristics of a population-based health problem (e.g., equity, social determinants, environment) Use variables that measure public health conditions Use methods and instruments for collecting valid and reliable quantitative and qualitative data Identify sources of public health data and information Recognize the integrity and comparability of data Identify gaps in data sources Adhere to ethical principles in the collection, maintenance, use, and dissemination of data and information Describe the public health applications of quantitative and qualitative data Collect quantitative and qualitative community data (e.g., risks and benefits to the community, health and resource needs) Use information technology to collect, store, and retrieve data Describe how data are used to address scientific, political, ethical, and social public health issues
Domain #2: Policy Development and Program Planning Gather information relevant to specific public health policy issues Describe how policy options can influence public health programs Identify mechanisms to monitor and evaluate programs for their effectiveness and quality Demonstrate the use of public health informatics practices and procedures (e.g., use of information systems infrastructure to improve health outcomes)
Domain #3: Communication Identify the health literacy of populations served
Domain #4: Cultural Competency Incorporate strategies for interacting with persons from diverse backgrounds (e.g., cultural, socioeconomic, educational, racial, gender, age, ethnic, sexual orientation, professional, religious affiliation, mental and physical capabilities)
Domain #5: Community Dimensions of Practice Recognize community linkages and relationships among multiple factors (or determinants) affecting health (e.g., The Socio-Ecological Model) Demonstrate the capacity to work in community-based participatory research efforts Identify stakeholders Collaborate with community partners to promote the health of the population Maintain partnerships with key stakeholders Gather input from the community to inform the development of public health policy and programs
Domain #6:Public Health Sciences Identify the basic public health sciences (including, but not limited to biostatistics, epidemiology, environmental health sciences, health services administration, and social and behavioral health sciences) Describe the scientific evidence related to a public health issue, concern, or, intervention Retrieve scientific evidence from a variety of text and electronic sources Discuss the limitations of research findings (e.g., limitations of data sources, importance of observations and interrelationships)
Domain #7: Financial Planning and Management Adhere to the organization’s policies and procedures Operate programs within current and forecasted budget constraints Apply basic human relations skills to internal collaborations, motivation of colleagues, and resolution of conflicts
NUTRITION LABEL 56
Appendix D Cont’d
Domain #8: Leadership and Systems Thinking Incorporate ethical standards of practice as the basis of all interactions with organizations, communities, and individuals Describe how public health operates within a larger system Participate with stakeholders in identifying key public health values and a shared public health vision as guiding principles for community action Identify internal and external problems that may affect the delivery of Essential Public Health Services Use individual, team and organizational learning opportunities for personal and professional development Participate in mentoring and peer review or coaching opportunities Participate in the measuring, reporting and continuous improvement of organizational performance Describe the impact of changes in the public health system, and larger social, political, economic environment on organizational practices