changes in consumer market preference and purchase
TRANSCRIPT

Western Kentucky University Western Kentucky University
TopSCHOLAR® TopSCHOLAR®
Masters Theses & Specialist Projects Graduate School
Spring 2021
Changes in Consumer Market Preference and Purchase Changes in Consumer Market Preference and Purchase
Frequency in Response to the Covid-19 Pandemic Frequency in Response to the Covid-19 Pandemic
Sean Thomas Dial Western Kentucky University, [email protected]
Follow this and additional works at: https://digitalcommons.wku.edu/theses
Part of the Community Health and Preventive Medicine Commons, E-Commerce Commons,
Engineering Commons, and the Technology and Innovation Commons
Recommended Citation Recommended Citation Dial, Sean Thomas, "Changes in Consumer Market Preference and Purchase Frequency in Response to the Covid-19 Pandemic" (2021). Masters Theses & Specialist Projects. Paper 3502. https://digitalcommons.wku.edu/theses/3502
This Thesis is brought to you for free and open access by TopSCHOLAR®. It has been accepted for inclusion in Masters Theses & Specialist Projects by an authorized administrator of TopSCHOLAR®. For more information, please contact [email protected].

CHANGES IN CONSUMER MARKET PREFERENCE AND PURCHASE
FREQUENCY IN RESPONSE TO THE COVID-19 PANDEMIC
A Thesis
Presented to
The Faculty of the School of Engineering and Applied Sciences
Western Kentucky University
Bowling Green, Kentucky
In Partial Fulfillment
Of the Requirements for the Degree
Master of Science
By
Sean Dial
May 2021

CHANGES IN CONSUMER MARKET PREFERENCE AND PURCHASE
FREQUENCY IN RESPONSE TO THE COVID-19 PANDEMIC
Date Recommended April 8, 2021____________
_______________________________________
Dr. Fatemeh (Mahtab) Orooji, Thesis Director
_______________________________________
Dr. Asghar Rezasoltani
_______________________________________
Dr. Kenneth Askins
_____________________________________ Associate Provost for Research and Graduate Education

iii
CONTENTS
Introduction ........................................................................................................................ 1
Literature Review ..............................................................................................................11
Methodology .....................................................................................................................24
Results ...............................................................................................................................31
Discussion .........................................................................................................................88
References ...................................................................................................................... 100

iv
LIST OF FIGURES
Figure 1. Preferred Market Survey ...................................................................................27
Figure 2. Gender Distribution (%) ....................................................................................32
Figure 3. Age Distribution Histogram ..............................................................................33
Figure 4. Age Distribution (%) .........................................................................................34
Figure 5. Ethnicity Distribution (%) .................................................................................35
Figure 6. Distribution of Highest Level of Education Completed (%) ............................36
Figure 7. Q5 Purchase Frequency Rank Distribution .......................................................38
Figure 8. Q6 Purchase Frequency Rank Distribution .......................................................39
Figure 9. Q7 Preference Distribution (%) ........................................................................40
Figure 10. Q8 Purchase Frequency Rank Distribution .....................................................41
Figure 11 Q9 Purchase Frequency Rank Distribution ......................................................42
Figure 12. Q10 Preference Distribution (%) ....................................................................42
Figure 13. Q11 Purchase Frequency Rank Distribution ...................................................43
Figure 14. Q12 Purchase Frequency Rank Distribution ...................................................44
Figure 15. Q13 Preference Distribution (%) ....................................................................45
Figure 16. Q14 Purchase Frequency Rank Distribution ...................................................46
Figure 17. Q15 Purchase Frequency Rank Distribution ...................................................47
Figure 18. Q16 Preference Distribution (%) ....................................................................48
Figure 19. Q17 Purchase Frequency Rank Distribution ...................................................49
Figure 20. Q18 Purchase Frequency Rank Distribution ...................................................50
Figure 21. Q19 Preference Distribution (%) ....................................................................51
Figure 22. Q20 Purchase Frequency Rank Distribution ...................................................52
v
Figure 23. Q21 Purchase Frequency Rank Distribution ...................................................53
Figure 24. Q22 Preference Distribution (%) ....................................................................53
Figure 25. Q23 Purchase Frequency Rank Distribution ...................................................54
Figure 26. Q24 Purchase Frequency Rank Distribution ...................................................55
Figure 27. Q25 Preference Distribution (%) ....................................................................56
Figure 28. Q26 Purchase Frequency Rank Distribution ...................................................56
Figure 29. Q27 Purchase Frequency Rank Distribution ...................................................57
Figure 30. Q28 Preference Distribution (%) ....................................................................58
Figure 31. Q5:Q6 Net Differences of Rank ......................................................................59
Figure 32. Q8:Q9 Net Differences of Rank ......................................................................61
Figure 33. Q11:Q12 Net Differences of Rank ..................................................................62
Figure 34. Q14:Q15 Net Differences of Rank ..................................................................63
Figure 35. Q17:Q18 Net Differences of Rank ..................................................................65
Figure 36. Q20:Q21 Net Differences of Rank ..................................................................66
Figure 37. Q23:Q24 Net Differences of Rank ..................................................................67
Figure 38. Q26:Q27 Net Differences of Rank ..................................................................69
Figure 39. Q5Q6:Q17Q18 Net Changes of Rank Differences .........................................70
Figure 40. Q8Q9:Q20Q21 Net Changes of Rank Differences .........................................72
Figure 41. Q11Q12:Q23Q24 Net Changes of Rank Differences .....................................73
Figure 42. Q14Q15:Q126Q27 Net Changes of Rank Differences ...................................74
Figure 43. Q5:Q17 Net Changes of Rank ........................................................................76
Figure 44. Q6:Q18 Net Changes of Rank ........................................................................77
Figure 45. Q8:Q20 Net Changes of Rank ........................................................................78

vi
Figure 46. Q9:Q21 Net Changes of Rank ........................................................................80
Figure 47. Q11:Q23 Net Changes of Rank ......................................................................81
Figure 48. Q12:Q24 Net Changes of Rank ......................................................................82
Figure 49. Q14:Q26 Net Changes of Rank ......................................................................84
Figure 50. Q15:Q27 Net Changes of Rank ......................................................................85
vii
LIST OF TABLES
Table 1. Gender Distribution ............................................................................................32
Table 2. Age Distribution .................................................................................................33
Table 3. Ethnicity Distribution .........................................................................................35
Table 4. Distribution of Highest Level of Education Completed .....................................36
Table 5. Likert Scale Rank Assignments ..........................................................................37
Table 6. Purchase Frequency Rank Distributions .............................................................38
Table 7. Preference Distributions .....................................................................................39
Table 8. Net Differences of Rank, Median, and Mode between Markets ........................59
Table 9. Q5:Q6 Net Differences of Rank .........................................................................59
Table 10. Q8:Q9 Net Differences of Rank .......................................................................60
Table 11. Q11:Q12 Net Differences of Rank ...................................................................62
Table 12. Q14:Q15 Net Differences of Rank ...................................................................63
Table 13. Q17:Q18 Net Differences of Rank ...................................................................64
Table 14. Q20:Q21 Net Differences of Rank ...................................................................66
Table 15. Q23:Q24 Net Differences of Rank ...................................................................67
Table 16. Q26:Q27 Net Differences of Rank ...................................................................68
Table 17. Net Changes of Rank, Median, and Mode Differences between Markets ........70
Table 18. Q5Q6:Q17Q18 Net Changes of Rank Differences ...........................................70
Table 19. Q8Q9:Q20Q21 Net Changes of Rank Differences ...........................................71
Table 20. Q11Q12:Q23Q24 Net Changes of Rank Differences .......................................73
Table 21. Q14Q15:Q26Q27 Net Changes of Rank Differences .......................................74
Table 22. Net Changes of Rank, Median, and Mode after Effects of the Pandemic ........75

viii
Table 23. Q5:Q17 Net Changes of Rank ..........................................................................76
Table 24. Q6:Q18 Net Changes of Rank ..........................................................................77
Table 25. Q8:Q20 Net Changes of Rank ..........................................................................78
Table 26. Q9:Q21 Net Changes of Rank ..........................................................................79
Table 27. Q11:Q23 Net Changes of Rank ........................................................................81
Table 28. Q12:Q24 Net Changes of Rank ........................................................................82
Table 29. Q14:Q26 Net Changes of Rank ........................................................................83
Table 30. Q15:Q27 Net Changes of Rank ........................................................................85
Table 31. Q7:Q19 Net Changes of Market Preference .....................................................86
Table 32. Q10:Q22 Net Changes of Market Preference ...................................................86
Table 33. Q13:Q25 Net Changes of Market Preference ...................................................86
Table 34. Q16:Q28 Net Changes of Market Preference ...................................................87

ix
CHANGES IN CONSUMER MARKET PREFERENCE AND PURCHASE
FREQUENCY IN RESPONSE TO THE COVID-19 PANDEMIC
Sean Dial May 2021 102 Pages
Directed by: Dr. Fatemeh Orooji, Dr. Asghar Rezasoltani, and Dr. Kenneth Askins
School of Engineering and Applied Sciences Western Kentucky University
Research literature throughout 2020 indicate consumer behavioral changes in
response to the systemic effects of the global COVID-19 pandemic, but these studies
investigate transient adaptations in consumer behaviors during the early quarantine period
of the pandemic. This study intends to investigate lasting or permanent changes in
consumer market preference and purchase frequency between BAM and online retail due
to the effects of the pandemic. The principal investigator designed a survey for
participants to estimate purchase frequencies and market preferences for apparel,
electronics, groceries, and general purchases before and after the pervasive effects of the
pandemic (N = 1195; n = 61). The principal investigator utilizes descriptive statistics to
characterize response distributions and differences/changes of rank/preference to evaluate
statistically significant differences between markets and changes between temporal
periods. The only product category that demonstrates a consensus preference for online
retail before and after the effects of the pandemic is electronics; there was and remains a
consensus preference for BAM to purchase apparel, groceries, and general purchases.
However, changes of net differences between markets after the effects of the pandemic
indicate a statistically significant minority of the sample have increased purchase
frequency through online retail for all product categories and general purchases after the
effects of the pandemic, suggesting a minority have developed adaptations to utilize a
less preferred market (i.e., online retail) to supplement purchases through a preferred

iv
market (i.e., BAM) due to real/perceived product scarcity at BAM, compliance with
health and safety mandates, and/or personal agency and self-preservation in avoidance of
contagion, perceived danger, or inconveniences of altered business operations. The
effects of the pandemic appear to have had insignificant influence on consumer
behaviors, wherein there are no lasting or permanent changes in consumer market
preference and estimated purchase frequency per market, rather only a minority have
developed transient adaptations to utilize an alternate market to ensure the acquisition of
products at a desired rate while the effects of the pandemic persist.

1
Introduction
The pervasive influence of epidemics or pandemics upon the operations of entire
populations, such as general social interactions, manufacturing, and commerce, are not
novel (Larson & Shin, 2018; Laato, Islam, Farooq, & Dhir, 2020), but the year of 2020
marks a precedent for the dramatic impact of a global pandemic in the contemporary state
of the Information Age. The Information Age describes a broad timeline of invention and
innovation in information technology from the mid-20th century that extends until the
present; however, the contemporary state of the Information Age is characterized by
interdependent information and communication systems, disruptive marketing utility of
social media platforms, “smart” devices, advanced analytical and predictive algorithms,
an escalation of digital media, entertainment media conglomeration into an oligopoly of
streaming services, customer-tailored advertisements online, ever-increasing consumer
reliance upon online retail, and cryptocurrencies.
The events of 2020 pertaining to the global COVID-19 pandemic indicate the
advent of a new technological age because information technology has become so
seamlessly integrated into social structure and institutions that unpredictable, remarkable
stress upon information systems at a national and international scale can cause
catastrophic disruption to societal operation and national economies. The adaptive
measures of various organizations indicate a trend toward remote participation/operation
for eligible services, such as distanced learning for education or telecommuting for
“nonessential” services (i.e., services that do not require access to a localized facility,
equipment, etc.) (Duygun & Şen, 2020; Laato et al., 2020; Nguyen, Hoang, Tran, Vu,
Fodjo, Colebunders, Dunne, & Vo, 2020; Teng-Calleja, Caringal-Go, Manaois, Isidro, &

2
Zantua, 2020); furthermore, quarterly reports throughout 2020 from various business
organizations indicate an increased demand for online retail, digital retail, streaming
services, and food deliveries, suggesting consumer habits for various categories of
products and goods are shifting away from “brick-and-mortar” (BAM) shopping ventures
to home delivery and digital “ownership” (Duygun & Şen, 2020; Jeżewska-Zychowicz,
Plichta, & Królek, 2020; Sheth, 2020; Teng-Calleja et al., 2020; Neger & Uddin, 2020;
Wang, An, Gao, Kiprop, & Geng, 2020). While the adaptations are intended as indefinite,
requisite measures to mitigate the contagion of the pandemic, governments and business
organizations have learned requirements and methods for adaptation that will allow these
entities to respond faster and more effectively in the future occurrence of
national/international emergencies or catastrophes, such as pandemics or natural
disasters. The adaptations may not be permanent, but the events of 2020 pertaining to
COVID-19 indicate the advent of a new technological age characterized by extensive,
interdependent networks of remote individuals within organizations and/or the capability
to convert to remote services immediately, an emphasis on delivery facilitated internally
or through partnerships with delivery services utilizing independent contractors, and the
complete transformation of information technology from a facilitative utility into a
necessity for the sustainability of any organization.
Multitudes of studies and reports in the last decade suggest that consumer habits
have trended away from BAM retail toward online retail (Karim, 2013; Liu, Xiao, Lim,
& Tan, 2017), and those throughout 2020 suggest consumers have increased utilization of
online retail in response to the effects of COVID-19, including quarantine or “stay-at-
home” orders (Kaur, Kunasegaran, Singh, Salome, & Sandhu, 2020; Laato et al., 2020;

3
Nguyen et al., 2020), occupancy and health mandates for business facilities (Teng-Calleja
et al., 2020; Nguyen et al., 2020; Betsch, Korn, Sprengholz, Felgendreff, Eitze, Schmid,
& Bӧhm, 2020; Laato et al., 2020), and inconsistent inventory availability or scarcity at
BAM stores due to panicked hoarding behaviors that characterize preparation for
anticipated emergencies (Duygun & Şen, 2020; Jeżewska-Zychowicz et al., 2020; Kaur et
al., 2020; Laato et al., 2020; Parlapani, Holeva, Voitsidis, Blekas, Gliatas, Porfyri,
Golemis, Papadopoulou, Dimitriadou, Chatzigeorgiou, Bairachtari, Patsiala, Skoupra,
Papigkioti, Kafetzopoulou, & Diakogiannis, 2020; Sheth, 2020; Neger & Uddin, 2020;
Wang et al., 2020). However, most available data for changes in consumer habits
between BAM and online retail since impact of the pandemic are measured internally,
and organizations may withhold proprietary information from the public. Furthermore,
most research on the effects of the pandemic investigates transient changes in consumer
behavior to adapt to early quarantine orders and collateral effects rather than lasting or
permanent changes in consumer behavior for market preference and purchase frequency
after the effects of the pandemic. Research literature is bereft of the Voice of the
Customer (VOC) in regard to the potential differences in consumer preferences and
purchases frequencies between BAM and online retail before the sweeping effects of the
global COVID-19 pandemic and those preferences after the pervasive impact of COVID-
19.
Problem Statement
The dearth of information on consumer preferences in the selection of offline or
online markets before and after the pervasive impact of the global COVID-19 pandemic
indicates a need for studies that address this concern. The VOC is not represented for

4
these preferences in existing literature, and business organizations suggest changes in
consumer habits (e.g., purchase frequency) and preferences after the sweeping effects of
COVID-19 from their interpretations of internal measures and metrics that merely imply
changes in consumer habits, not preferences.
Significance of the Research
Business organizations will directly derive benefits from an investigation of
consumer preferences and purchase frequencies between BAM and online retail through
achieving a more comprehensive understanding of customers’ general preferences in the
utilization of BAM or online retail in response to the effects of the global COVID-19
pandemic. Business organizations may utilize VOC to inform strategic planning,
organizational restructuring, process changes, etc. that prioritize customer requirements
for the generally preferred access to products and goods. Furthermore, the knowledge of
consumer preferences between BAM and online retail informs business organizations of
opportunities for improvement in the less-preferred market; business organizations whose
primary structure is the less-preferred market may restructure to the preferred market, if
possible, or they may adapt the existing structure and current-state processes to satisfy
key customer requirements in approach to the preferred market. An understanding of any
potential changes in general preferences and purchase frequencies between BAM and
online retail after the impact of the COVID-19 pandemic is foundational for any type of
organization to evaluate its responses to the pandemic, standardize effective adaptations
to improve response time and efficacy in similar contexts, and learn the value of adaptive
flexibility to sustainability and customer satisfaction.

5
Purpose of the Research
The purpose of this study is to investigate the potential changes in general preference
for a market (i.e., BAM or e-commerce markets) and changes in purchases frequencies
for each market after the pervasive impact of the global COVID-19 pandemic through
VOC. This study intends to investigate the aforementioned changes for general (i.e.,
all/total) purchases and three categories of products and goods: apparel, electronics, and
groceries.
Research Questions
Research Question 1: Is there a consensus preference for a market before the effects
of the global COVID-19 pandemic?
• H0: There is no consensus preference for market before the effects of the
global COVID-19 pandemic
• H1: There is a consensus preference for BAM before the effects of the global
COVID-19 pandemic.
• H2: There is a consensus preference for online retail before the effects of the
global COVID-19 pandemic.
Research Question 2: Is there a consensus preference for a market after the effects
of the global COVID-19 pandemic?
• H0: There is no consensus preference for market after the effects of the global
COVID-19 pandemic
• H1: There is a consensus preference for BAM after the effects of the global
COVID-19 pandemic.
• H2: There is a consensus preference for online retail after the effects of the
global COVID-19 pandemic.

6
Research Question 3: Is there a difference in the consensus preference for a market
between the temporal periods before and after the effects of the global COVID-19
pandemic?
• H0: There is no statistically significant difference in the consensus preference
for market between the temporal periods before and after the effects of the
global COVID-19 pandemic.
• H1: There is a statistically significant difference in the consensus preference
for market between the temporal periods before and after the effects of the
global COVID-19 pandemic.
Research Question 4: Is there a difference in the reported purchase frequency
between BAM and online retail before the effects of the global COVID-19
pandemic?
• H0: There is no statistically significant difference in the reported purchase
frequency between BAM and online retail before the effects of the global
COVID-19 pandemic.
• H1: There is a statistically significant difference in the reported purchase
frequency between BAM and online retail before the effects of the global
COVID-19 pandemic, in which subjects reported higher frequency of BAM
purchases than online retail purchases.
• H2: There is a statistically significant difference in the reported purchase
frequency between BAM and online retail before the effects of the global
COVID-19 pandemic, in which subjects reported higher frequency of online
retail purchases than BAM purchases.
Research Question 5: Is there a difference in the reported purchase frequency
between BAM and online retail after the effects of the global COVID-19 pandemic?
• H0: There is no statistically significant difference in the reported purchase
frequency between BAM and online retail after the effects of the global
COVID-19 pandemic.
• H1: There is a statistically significant difference in the reported purchase
frequency between BAM and online retail after the effects of the global
COVID-19 pandemic, in which subjects report higher frequency of BAM
purchases than online retail purchases.
• H2: There is a statistically significant difference in the reported purchase
frequency between BAM and online retail after the effects of the global
COVID-19 pandemic, in which subjects report higher frequency of online
retail purchases than BAM purchases.

7
Research Question 6: Is there a difference in the reported purchase frequency of a
market after the effects of the global COVID-19 pandemic?
• H0: There is no statistically significant difference in the reported purchase
frequency of a market after the effects of the global COVID-19 pandemic.
• H1: There is a statistically significant difference in the reported purchase
frequency of a market after the effects of the global COVID-19 pandemic, in
which subjects reported higher purchase frequency after the effects of the
pandemic.
• H2: There is a statistically significant difference in the reported purchase
frequency of a market after the effects of the global COVID-19 pandemic, in
which subjects reported lower purchase frequency after the effects of the
pandemic.
Assumptions
There is assumed access to the student and faculty populations of Ogden College
at Western Kentucky University (WKU). The sample is assumed to represent the
population. Survey data are non-parametric.
Limitations and Delimitations
The survey will be delimited to the student and faculty population of Ogden
College at Western Kentucky University (WKU) for feasibility in sample acquisition.
The survey responses are limited to subjective, ordinal Likert scales for purchase
frequency and closed-ended selections between markets, and quantitative analyses are
limited to non-parametric descriptive statistics and differences of rank/preference. The
Mann-Whitney U Test is inapplicable to this research design because the test can only
indicate a difference in sample sizes for frequency; as the sample sizes of responses for
each survey question are always the same and known to be identical in composition of
participants, the Mann-Whitney U Test will always indicate no statistically significant
difference between any two samples because the distribution of responses across choices
on the Likert scale is limited to the sample size. Furthermore, if the research design

8
satisfied the requirements to conduct a Mann-Whitney U Test, the test is still inapplicable
to the assessment of statistically significant difference in consensus market preferences
between temporal periods because there is no critical value for n = 3 if α = 0.05. The
Wilcoxon Signed Ranks Test is inapplicable to the research design due to similar
violations for frequency of ranks described for the Mann-Whitney U Test; moreover,
there are no critical values for n ≤ 8 if α = 0.05, and increasing α will always result in no
significant difference in samples between any given comparison of survey questions. The
Kruskall Wallis Test is inapplicable because the samples for each survey question are not
randomly assigned to product categories, markets, or temporal periods and are not
mutually independent, as the samples are known to be identical for each survey question.

9
Definition of Terms
• COVID-19 pandemic
o In December 2019, reports from Wuhan, China indicated the emergence of
an incipient national-scale pandemic of severe acute respiratory syndrome
coronavirus 2 (SARS-COV-2), now dubbed the coronavirus disease of
2019 (COVID-19). The pandemic escalated to the global scale by the
spring of 2020, resulting in various approaches to mitigating contagion
across the world that have remarkably stressed and altered societal
operation, particularly commerce and economy.
• “brick-and-mortar”
o AKA BAM, physical retail/commerce, traditional retail/commerce, and
physical stores/storefronts
o BAM refers to a traditional market that offers stock of products and goods
or provides services at physical stores
• online retail
o AKA electronic commerce (e-commerce)
o Online retail is a disruptive market that offers products and goods for
home delivery and instantaneous access to digital products and services
through utilization of the Internet.
• market
o AKA market type
o Market refers to the type of market between BAM and online retail.

10
• consumer market preference
o In the context of this thesis, consumer market preference refers to an
individual’s satisfaction with and tendency to prioritize utility of a market
when purchasing products and goods. The options for preference in this
context are BAM and online retail.
• consensus preference
o A consensus preference refers to the consumer preference shared by the
majority (approximately 51% or more) of individuals in a sample or
population
• purchase frequency
o In the context of this thesis, purchase frequency refers to a sample
subject’s estimation of his/her frequency of utilization of a specific market
within a period of time (within any given month for this study) from a
subjective, ordinal Likert scale of descriptive terms for purchase frequency
(e.g., rarely, sometimes, often, etc.).

11
Literature Review
Kukar-Kinney, Scheinbaum, and Schaeffers (2016) compared compulsive and
non-compulsive online shoppers in the scenario of deals offered in response to unit sales
with a focus on the behaviors of the use of social shopping platforms, purchases on these
platforms, and the use of sale certificates when applicable. The sample consisted of 236
participants who completed an online survey submitted to an undefined subject pool of
students at an undisclosed university. The results suggested that the time pressure of
limited-time offers and the social pressure of generating deals through purchases are
primary factors that increase compulsive online shoppers’ probability to purchase
products on compulsion. The authors propose that the pressures that enable these
behaviors are potentially detrimental to consumers because compulsive buyers may be
manipulated to make numerous purchases in order to accrue sales vouchers and
certificates that they fail to redeem.
Petre, Minocha, and Roberts (2006) investigated how human-computer interaction
(HCI) and customer relationship management (CRM) strategies can be incorporated into
e-commerce design in order to promote customer retention, trust, and loyalty through
comprehension of consumers’ requisites and perceptions about service quality. The
phase of the study concerned with e-commerce was composed of twelve volunteers who
were observed during e-commerce transactions; the authors admitted that the sample was
not representative of a diverse e-commerce population. The observations, interviews, and
evaluations allowed the authors to develop and refine an evaluation instrument for the
total consumer experience, dubbed E-SEQUAL. The authors suggest that E-SEQUAL

12
can be applied to other electronic domains for the evaluation of user satisfaction, such as
e-government platforms and business-to-business e-commerce relationships.
Liu, Xiao, Lim, and Tan (2017) promoted product appeal and website appeal as
principal psychological mechanisms for business-to-consumer e-commerce platforms to
utilize in alleviating the issues of information asymmetry by improving consumers’
purchase intention through trust. Through a marketing research firm, 423 e-commerce
consumers were recruited by e-mail invitations, but only 293 viable responses were
included in the sample. The results suggested that website appeal has partial influence on
the positive effect of product appeal on purchase intention, and trust in e-commerce
platforms increases purchase intention while improving the positive relationships
between website appeal and purchase intention and between product appeal and purchase
intention. Due to the results, the authors recommend that e-commerce platforms improve
service qualities most relevant to product and website appeal.
Pappas, Kourouthanassis, Giannakos, and Lekakos (2017) explored consumers’
purchase behavior for online shopping through complexity theory in order to assess
online shopping experience and to determine online shopping motivations. The sample
was composed of 401 Greek citizens recruited through a snowball sampling method. The
results suggested nine arrangements of online shopping experiences and motivations that
cause higher purchase intentions. The results suggest to researchers and e-commerce
retailers alike the development of novel theories in personalized e-commerce and its
processes for providing service.
Chiang and Dholakia (2003) investigated consumers’ purchase intentions for
online shopping through surveys that focused on three variables likely to influence

13
purchase intention: convenience characteristics of e-commerce platforms, product type
characteristics, and perceived product price. The sample consisted of 160 returned
questionnaires that had been submitted at random to travelers on a train in Northeast
Rhode Island. The results suggested that convenience and product type influence
purchase intention for online shopping, purchase intention for online shopping was
greater when offline shopping was perceived as inconvenient, and purchase intention for
online shopping was greater when a product is perceived as a “search” good rather than
an “experience” good.
Karim (2013) examined customer satisfaction in online shopping in order to
determine the primary reasons that motivate and inhibit consumers’ rationales for online
shopping. The sample consisted on sixty respondents to surveys randomly distributed at
various locations in Wrexham, North Wales. The results suggested that the major
motivations for online shopping are the perceived conveniences of time saving,
information availability, ease of use, reduced stress, and price, while inhibitions to online
shopping include online payment security, personal privacy, unclear warranties and
return policies, and lack of customer service. The author recommended that e-commerce
retailers can reduce inhibitions by improving transaction security and consumer privacy,
streamlining processes for placing orders, and improving delivery times and return
policies.
Larson and Shin (2018) investigated customer reactions to natural disasters
because the incredibly disruptive events are difficult to predict or unpredictable yet
common. The authors targeted a sample of US residents impacted by Hurricane Matthew,
with 231 respondents (n = 231) to investigate the potential relationships among fear

14
induced by the experience of a natural disaster, perceptions of shopping convenience, and
shopping behavior during a natural disaster. The results of the survey suggest that fear
induced by the hurricane is inversely related to perception of shopping convenience, in
which individuals with higher fear perceived the shopping environment as more difficult
and inconvenient (perhaps dangerous); however, individuals with higher fear are also
more likely to engage in utilitarian (i.e., practical necessities; e.g., food, water, medicine,
batteries, gas fuel, etc.) and hedonic (i.e., excessive, gratuitous, hoarding) shopping
behaviors.
Betsch, Korn, Sprengholz, Felgendreff, Eitze, Schmid, and Bӧhm (2020)
investigated the social and behavioral consequences of mandatory and voluntary mask
policies related to the efficacies of the policies, stigmatization, and perceived fairness.
Serial cross-sectional data from April 14 to May 26, 2020 suggest that mandatory policies
tend to increase compliance regardless of moderate acceptance, and the practice of
wearing a mask has a positive correlation with other protective behaviors (e.g., hand-
washing, social distancing of at least six feet, etc.). Betsch et al.’s experiment (n = 925)
further suggests that voluntary policies would likely elicit inadequate compliance, are
perceived as less fair, and have the potential to exacerbate stigmatization. The authors
suggest that a mandatory mask-wearing policy is a more effective, perceivably fair, and
socially responsible countermeasure to mitigate contagion by airborne viruses.
Duygun & Şen (2020) evaluated and compared consumer reports for various
nations and Turkey to determine consumer behavior relative to Maslow’s hierarchy of
needs. The authors suggest that consumer behaviors have prioritized products, goods, and
services that satisfy the two lowest, foundational tiers of Maslow’s hierarchy:

15
physiological needs (e.g., air, water, food, shelter, sleep, clothing, and reproduction) and
safety needs (e.g., personal security, resources, health, property, etc.). The authors remark
on hoarding behaviors with the initial enforcement of mandates for quarantine/“stay-at-
home” orders, mask-wearing policies, social-distancing rules, etc. by observing increases
in online purchases, increases in gun and ammunition sales in the US (particularly first-
time gun purchases; these data may be confounded by concurrent sociopolitical events),
and increases in sales of personal protective equipment (PPE; especially masks). While
the authors emphasize that consumer behaviors have prioritized satisfaction of
physiological and safety needs, they note remarkable increases in sales of products
pertaining to home improvement and leisure activities, suggesting a priority for esteem
and self-actualization in consumers who have satisfied physiological and safety needs.
Hoenig and Wenz (2020) state that education is a primary cause of health
inequality due to its influence on health behavior and living and working conditions,
primarily differences in professional opportunities relative to highest level of education
completed, and they conducted a survey to investigate health behavior (e.g., social
distancing, increased hygiene, mask-wearing, etc.) and working conditions (e.g., working
from home, reduced work hours, unemployment, etc.) in different levels of education
(i.e., highest level of education completed) during the initial response to the COVID-19
pandemic in Germany. The authors defined three broad levels of education: low (high
school education or less), intermediate (associate degree, bachelor’s degree, or trade
degree), and high (master’s degree or higher). For all three educational levels, more than
75% of respondents reported compliance with recommended social-distancing and
hygiene behaviors, with a difference less than 10% between any two groups. Highly

16
educated respondents reported a probability of over 45% to work from home;
intermediately educated respondents reported a probability of 17%; and, lowly educated
respondents reported a probability of 11%. The authors suggest that socioeconomic and
occupational inequalities in the risk of infection by COVID-19 primarily result from
differences in working conditions, such as the inability to work from home for low
socioeconomic occupations, rather than differences in health behaviors.
Jeżewska-Zychowicz, Plichta, and Królek (2020) investigated the potential of
trust in circulating information and perceived stress as predictors for consumers’
fear/paranoia of restricted access to food and for food purchase behaviors during the
COVID-19 pandemic. The authors utilized online video-conferencing to perform
interviews with 1,033 Polish adults in March 2020, and then they utilized logistic
regression to estimate probability of fear of restricted access to food and the probability
to purchase greater amounts of food than usual. The authors suggest the probability of
experiencing the fear of restricted access to food increased by 16% with higher perceived
stress, by 50% with higher trust in “mass media and friends” (i.e., circulating
information), and by 219% with perceived changes in food availability within the
previous month; however, trust in “Polish government institutions” decreased the
probability of fear by 22%. The probability of purchasing significantly more food than
usual increased by 9% with higher perceived stress, by 46% with trust in circulating
information, by 81% with perceived changes in food availability in the previous month,
and by 130% with fears of restricted access to food as the pandemic escalates. The
authors suggest that government institutions may struggle to disseminate information and
recommendations regarding the pandemic through mass media due to the inefficacy upon

17
individuals exhibiting low trust for media organizations and, more significantly, due to
the increasing probability of the aforementioned fears and panic-induced food-hoarding
behaviors as trust in mass media increases. The authors recommend the development of
interventions to reduce perceived stress and increase trust in information from reputable,
accredited sources.
Kaur, Kunasegaran, Singh, Salome, and Sandhu (2020) conducted a survey to
investigate Malaysian consumer behavior (i.e., consumption behaviors, purchase
frequency, transaction lot sizes, etc.) during the first phase of movement order control
(MCO) and lockdowns mandated in response to COVID-19. The authors were
specifically concerned with the influences of depression, uncertainty, panic, and fear on
consumption behaviors. The study featured 231 respondents (n = 231) chosen by
convenience sampling. The results of the study demonstrate mass and social media were
perceived by consumers as instrumental in evaluating the severity of the crisis, and their
consumer behaviors adapted commensurately to the perceived severity of the crisis. The
authors propose that Malaysian Fear of Missing Out (FoMO) was a vital variable in
consumer behavior during initial MCO, and likely it is a vital variable in consumer
behavior in identical crisis scenarios.
Laato, Islam, Farooq, and Dhir (2020) investigated unusual consumer behaviors
(e.g., hoarding toilet paper) during the COVID-19 pandemic. The authors utilized the
stimulus-organism-response (SOR) framework to compose a structural model for the
relationship of exposure to online information sources (i.e., environmental stimuli) to the
behaviors of unusual purchases and voluntary self-isolation. The authors conducted an
online survey with 211 Finnish respondents, and they discovered a strong relationship

18
between self-intention to isolate and intention to make unusual purchases, suggesting that
the reported consumer behavior was directly related to anticipated time of isolation. The
study further suggests exposure to online information sources caused as increase of
information overload (i.e., circulation of inconsistent, contradictory, and opinion-based
information) and cyberchondria (i.e., a form of hypochondria, in this instance for
contraction of COVID-19, induced by perceived or unfounded common symptomology
from review of online medical literature in the attempt of self-diagnosis). Moreover, the
authors determined information overload was a strong predictor of cyberchondria. The
perceived severity of the crisis and cyberchondria had significant influence upon
intention for unusual purchases and voluntary isolation.
Nguyen, Hoang, Tran, Vu, Fodjo, Colebunders, Dunne, and Vo (2020) conducted
a survey from March 31 to April 6, 2020 to evaluate the compliance of Vietnamese adults
to COVID-19 preventative measures and to investigate the effects of the pandemic on
their daily lives. The survey assessed personal preventative behaviors (e.g., social
distancing, mask-wearing, consistent handwashing, etc.) and community preventative
behaviors (e.g., isolation, avoiding large gatherings, etc.). The survey featured 2,175
respondents and yielded a mean adherence score of 7.23 ± 1.63 on a scale from 1-9 for
personal preventative measures and a mean adherence score of 9.57 ± 1.12 on a scale
from 1-11 for community preventative measures. Perceived adaptation of the community
to lockdown procedures, fears/concerns for one’s health, residence in large cities, access
to official sources for COVID-19 information, and healthcare professions/education were
associated with higher adherence scores to anti-COVID instructions. The authors suggest

19
there is high compliance with personal and community preventative behaviors among
Vietnamese residents.
Parlapani, Holeva, Voitsidis, Blekas, Gliatas, Porfyri, Golemis, Papadopoulou,
Dimitriadou, Chatzigeorgiou, Bairachtari, Patsiala, Skoupra, Papigkioti, Kafetzopoulou,
and Diakogiannis (2020) conducted an online study from April 10 to April 13, 2020 to
investigate COVID-19-related fear, depression and anxiety symptoms, social
responsibility, and behavioral responses during the COVID-19 pandemic in Greece. The
sample consisted of 3,029 respondents who met inclusion criteria. 35.7% of the sample
reported high levels of fear, 22.8% reported moderate to severe depressive symptoms,
and 77.4% reported moderate to severe anxiety symptoms.
Sheth (2020) examined existing literature related to COVID-19 to determine
trends in adaptive behaviors. First, punctuated periods of hoarding have been reported
globally, particularly for personal protective equipment and hygienic products. Second,
consumers have become resourceful and creative in improvisations to operate within the
restraints of COVID-19 mandates and policies for events (e.g., sidewalk weddings, Zoom
funeral services, etc.) and resource acquisition. Third, restrictions for events (e.g.,
movies, concerts, etc.) have created pent-up demand for consumers who are denied
access. Fourth, out of necessity, the convenience of availability and utility, and the
boredom of quarantine/lockdown procedures, consumers have embraced digital
technology for information, communication, commerce, and entertainment. Fifth,
consumers have increased reliance on e-commerce, home delivery, and digital media,
particularly in countries with strict lockdown procedures. Sixth, for individuals able or
required to work from home experience an unclear boundary between work and home.

20
Seventh, people tend to treat social reunions after the separation of lockdown orders with
greater significance. Eighth, the increased availability of leisure time has allowed people
to discover or refine talents. Sheth suggests consumer and social behaviors will resume a
semblance of normalcy eventually, but existing consumer behaviors and value stream
processes will become modified to comply with health regulations and to increase market
access. New consumer behaviors will emerge from legislation and policies, technological
innovation and invention, and shifts in dynamic demographics (e.g., age).
Teng-Calleja, Caringal-Go, Manaois, Isidro, and Zantua (2020) conducted an
online survey in the Philippines to investigate organizational responses and personnel
coping behaviors intended to mitigate the effects of the COVID-19 pandemic. The
authors utilized crisis in context theory (CCT) as an ecological framework to study
human behavior, and they also incorporated perspectives from psychology, organization
development, and management. The sample included 216 employed residents of the
Philippines. The study identified six organizational actions/responses to facilitate
personnel adaptation to the crisis: 1) flexible work arrangements (i.e., schedule changes,
workhour changes, working from home, etc.) , 2) mental health programs (e.g., social
media groups), 3) physical health and safety measures (i.e., personal protective
equipment, social-distancing rules, temperature checks, etc.), 4) financial support (i.e.,
early disbursement of salaries and benefits, advances, cash loans, suspension of loan
deductions, hazard pay for onsite personnel, subsidized payments for remote workers,
and processing government aid), 5) provision of material resources (e.g., requisite
technological resources for remote operation, temporary housing and amenities,
transportation, groceries and vitamins, etc.), and 6) communication of short- and long-
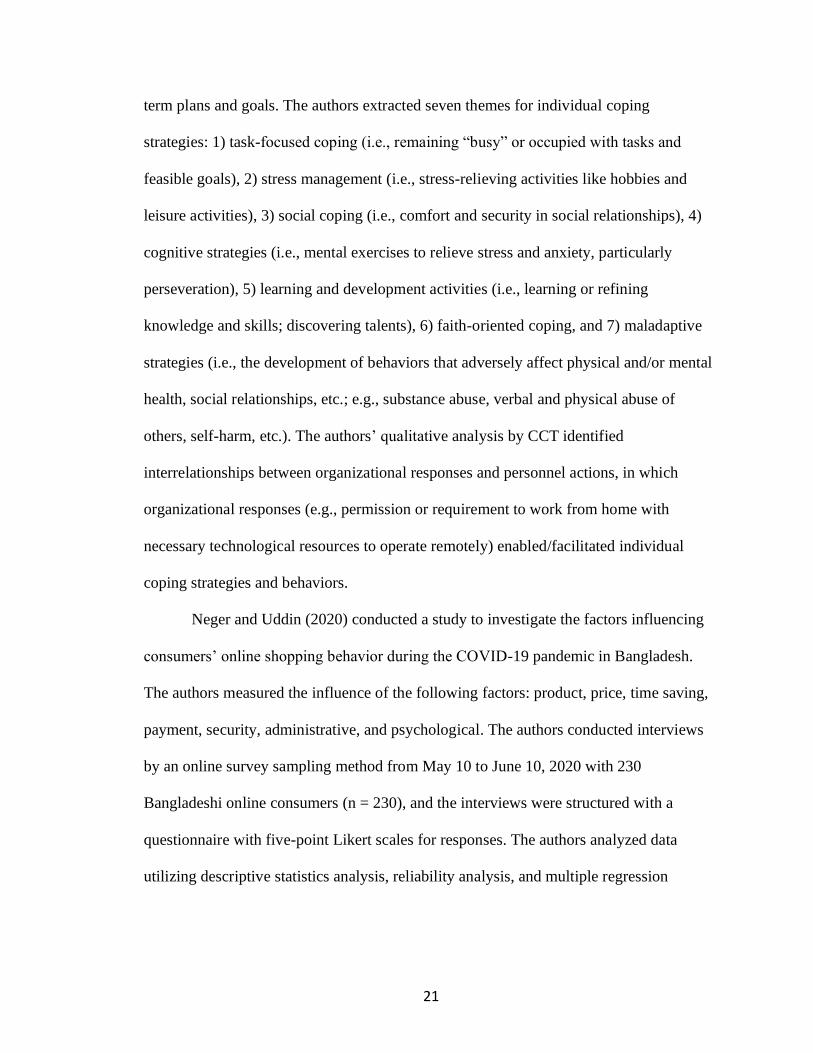
21
term plans and goals. The authors extracted seven themes for individual coping
strategies: 1) task-focused coping (i.e., remaining “busy” or occupied with tasks and
feasible goals), 2) stress management (i.e., stress-relieving activities like hobbies and
leisure activities), 3) social coping (i.e., comfort and security in social relationships), 4)
cognitive strategies (i.e., mental exercises to relieve stress and anxiety, particularly
perseveration), 5) learning and development activities (i.e., learning or refining
knowledge and skills; discovering talents), 6) faith-oriented coping, and 7) maladaptive
strategies (i.e., the development of behaviors that adversely affect physical and/or mental
health, social relationships, etc.; e.g., substance abuse, verbal and physical abuse of
others, self-harm, etc.). The authors’ qualitative analysis by CCT identified
interrelationships between organizational responses and personnel actions, in which
organizational responses (e.g., permission or requirement to work from home with
necessary technological resources to operate remotely) enabled/facilitated individual
coping strategies and behaviors.
Neger and Uddin (2020) conducted a study to investigate the factors influencing
consumers’ online shopping behavior during the COVID-19 pandemic in Bangladesh.
The authors measured the influence of the following factors: product, price, time saving,
payment, security, administrative, and psychological. The authors conducted interviews
by an online survey sampling method from May 10 to June 10, 2020 with 230
Bangladeshi online consumers (n = 230), and the interviews were structured with a
questionnaire with five-point Likert scales for responses. The authors analyzed data
utilizing descriptive statistics analysis, reliability analysis, and multiple regression

22
analysis. The results suggest that all factors except price and security had significant,
positive associations with online shopping behavior during the COVID-19 pandemic.
Wachyuni and Kusumaningrum (2020) conducted a descriptive study of tourist
travel intentions for Indonesia from February to April 2020 with a sample of 128
respondents (n = 128) obtained by simple random sampling through WhatsApp broadcast
messages. Sample subjects competed a questionnaire, and the authors conducted simple
quantitative analyses
(i.e., descriptive statistics analysis) of the data. The results suggest 78% of respondents
would return to Indonesia on tour, approximately 65% intend to travel to Indonesia
within six months after the pandemic is “officially” declared “over,” and 66% report a
preference for nature tourism. The majority of respondents reported a preference for a
short-period tour (i.e., 1-4 days). The results suggest travel intention mean is greater than
travel anxiety (the authors treat the Likert-scales as continuous, which is debatably
acceptable but atypical). The authors construed optimism for the quick recovery of the
Indonesian tourist industry due to the reported travel intentions and preferences.
Wang, An, Gao, Kiprop, and Geng (2020) analyzed food stockpiling (i.e.,
hoarding) behavior, including the changes in food reserve scale and willingness to
purchase fresh food reserves during the COVID-19 pandemic in China. The authors
suggest that the scale of food reserve ranges from 3.37 to 7.37 days (i.e., estimated days
of food per household) after the initial reports of COVID-19; if fresh food reserves were
available, consumers were willing to pay a premium of 60.47% (mean of 18.14 yuan) for
fresh reserves. The authors suggest food hoarding is propelled by a set of multiple
motivations and subjective risk perception. The authors’ characterization of

23
demographics suggest highly educated female and high-income consumers were more
likely to reserve larger scale food reserves (i.e., hoard food), and willingness to pay
premiums for fresh reserves increased with income.
The existing literature pertaining to the social, industrial, and economic effects of
the COVID-19 pandemic demonstrate global trends in consumer behavior changes (e.g.,
an increase in hoarding behavior and online shopping), perception changes (e.g.,
perception of crisis severity and trust in mass media), health and safety mandates for
preventative behaviors (e.g., social distancing, consistent hand-washing, mask-wearing,
etc.), public compliance with mandates, and organizational actions/responses to mandates
to maintain operations in compliance and to facilitate personnel. While some studies have
investigated consumer motivations, adaptive consumer behaviors, and mental health
coping strategies, there is an absence of research investigating VOC to identify
estimations for purchase frequency through either market type (BAM or e-commerce) or
general preferences for market types in the contexts of different product categories.

24
Methodology
The study will employ pragmatic philosophy with a convergent mixed methods
design to allow flexible adaptation to best understand the research problem within the
current social and economic paradigms (Creswell, 2014, p. 39-40) through the analysis of
demographic information and ranked responses between two temporal periods. The
researcher designed a survey that will require sample subjects to estimate purchase
frequency for both markets and report a general preference for either market in the
temporal periods before and after the pervasive effects of the global COVID-19
pandemic. Subjects will report purchase frequency through subjective, ordinal Likert
scales and a general preference for a market through a selection between BAM and online
retail. The survey will investigate estimated purchase frequency for typical purchases
(i.e., any and all purchases within a period of time) and for three distinct categories of
products and goods: apparel, electronics, and groceries. The survey will then utilize
descriptive statistics and differences of rank/preference to assess the survey responses for
potential differences in estimated purchase frequency between markets within temporal
periods, changes in estimated purchase frequency within markets between temporal
periods, and changes in market preference after the systemic effects of the global
pandemic.
Participants and Sample
The surveys will be distributed to the students and faculty of Ogden College at
Western Kentucky University (WKU) via the university’s internal e-mail system to
obtain a representative sample of the college-educated, adult population of the United
States. The principal investigator has readily available access to the population. The

25
population consists of college-educated, adult consumers of various combinations of the
demographics of gender, age, ethnicity, and education level. The study requires at least
fifty respondents for a representative sample (n ≥ 50).
Variables
The researcher intends to compare estimations for purchase frequency and
preferred market before and after the pervasive effects of the global COVID-19
pandemic. The social and economic paradigms of the two time periods represent
independent variables that influence consumer behaviors (i.e., purchase frequency),
preferences, and requirements. The responses to survey questions pertaining to purchase
frequency occur on a seven-point Likert scale: never (1), rarely (2), sometimes (3), half
the time (4), often (5), most of the time (6), and always (7); responses pertaining to
preference are close-ended between BAM and online retail. The survey responses
represent dependent variables that are influenced by the contemporary social and
economic paradigm. Any identity descriptors reported through demographic information
and unknown idiosyncratic consumer motivations and behaviors represent confounding
variables that influence purchase frequency and preference.
Instrumentation and Materials
The researcher has composed a simple survey (Figure 1) to collect data of
estimated purchase frequencies per market and preferences during the time periods before
and after the pervasive effects of COVID-19. The survey is intentionally designed to be
completed in under five minutes to encourage participation, and the language of
questions is simple and unambiguous. The first section of the survey contains four
questions pertaining to demographic information for gender, age, ethnicity, and highest

26
level of education completed. The core structure of the remainder of the survey consists
of three questions: 1) How frequently do you shop in person at a store? 2) How
frequently do you shop online for home delivery? 3) Which experience do you prefer?
These three questions are repeated for typical shopping, apparel shopping, electronics
shopping, and grocery shopping for each temporal period, yielding a total of 24
questions.
The researcher designed a subjective, ordinal Likert scale for sample subjects to
estimate purchase frequencies for each market from the period of time stated in the
question. The scale is intentionally designed to investigate consumers’ personal
estimations of how frequently they utilize either market when shopping from subjective
descriptions of frequency because individual consumer habits and available capital for
transactions are highly variable and disproportionate; the researcher intends to investigate
the estimated proportions of purchases conducted through each market for different
product categories, and sample subjects are likely to report truly inaccurate quantitative
estimations for purchase frequency. The descriptors of the Likert scale are subjective yet
distinct, and they are intended to elicit an intuitive, quick response that better reflects
VOC than dwelling on equally broad quantitative estimations. The Likert scale features
seven descriptors ranging from “never” to “always:” never (1), rarely (2), sometimes (3),
half the time (4), often (5), most of the time (6), and always (7).
The third core question is closed-ended with the choice between BAM and online
retail. Within each temporal period and for each product category, the sample subjects
will report a preference for either market. The researcher intends to identify consensus
preferences in the sample population for each product category within each time period

27
and to determine if changes have occurred in consensus preferences from the social and
economic effects of the global COVID-19 pandemic.
Figure 1. Preferred Market Survey
1 What is your gender?
Female MaleOther:
______
Prefer not
to say
2 What is your age?
18-25 26-35 36-45 46-55 55-64 65+Prefer not
to say
3 What is your ethnicity?
CaucasianAfrican-
American
Latino or
HispanicAsian
Native
American
Native
Hawaiian or
Pacific
Islander
OtherPrefer not
to say
4 What is your highest level of education completed? High school
or
equivalent
Associate's
degree
Bachelor's
degree
Master's
degree
Doctorate
degree
Trade
degree
Prefer not
to say
5 In any month, how frequently did you buy clothing and
apparel in person at a store?Never Rarely Sometimes
Half the
timeOften
Most of the
timeAlways
6 In any month, how frequently did you order clothing and
apparel online for home delivery?Never Rarely Sometimes
Half the
timeOften
Most of the
timeAlways
7 Which experience did you like more?In person Online
8 In any month, how frequently did you buy electronics in
person at a store?Never Rarely Sometimes
Half the
timeOften
Most of the
timeAlways
9 In any month, how frequently did you order electronics
online for home delivery?Never Rarely Sometimes
Half the
timeOften
Most of the
timeAlways
10 Which experience did you like more?In person Online
11 In any month, how frequently did you buy groceries in
person at a store?Never Rarely Sometimes
Half the
timeOften
Most of the
timeAlways
12 In any month, how frequently did you order groceries online
for home delivery?Never Rarely Sometimes
Half the
timeOften
Most of the
timeAlways
13 Which experience did you like more?In person Online
14 In general, how frequently did you shop in person at a
store?Never Rarely Sometimes
Half the
timeOften
Most of the
timeAlways
15 In general, how frequently did you shop online for home
delivery?Never Rarely Sometimes
Half the
timeOften
Most of the
timeAlways
16 Which experience did you like more?In person Online
17 In any month, how frequently do you buy clothing and
apparel in person at a store?Never Rarely Sometimes
Half the
timeOften
Most of the
timeAlways
18 In any month, how frequently do you order clothing and
apparel online for home delivery?Never Rarely Sometimes
Half the
timeOften
Most of the
timeAlways
19 Which experience do you like more?In person Online
20 In any month, how frequently do you buy electronics in
person at a store?Never Rarely Sometimes
Half the
timeOften
Most of the
timeAlways
21 In any month, how frequently do you order electronics
online for home delivery?Never Rarely Sometimes
Half the
timeOften
Most of the
timeAlways
22 Which experience do you like more?In person Online
23 In any month, how frequently do you buy groceries in
person at a store?Never Rarely Sometimes
Half the
timeOften
Most of the
timeAlways
24 In any month, how frequently do you order groceries online
for home delivery?Never Rarely Sometimes
Half the
timeOften
Most of the
timeAlways
25 Which experience do you like more?In person Online
26 In general, how frequently do you shop in person at a
store?Never Rarely Sometimes
Half the
timeOften
Most of the
timeAlways
27 In general, how frequently do you shop online for home
delivery?Never Rarely Sometimes
Half the
timeOften
Most of the
timeAlways
28 Which experience do you like more?In person Online
Thank you for taking the time to complete this survey. Answer questions to the best of your ability.
Estimated time to complete: 5 minutes
After the Effects of the COVID-19 Pandemic
Answer the following questions based on your shopping experiences after the COVID-19 pandemic.
Preferred Market Survey
Please volunteer your demographic information. If you choose to decline, answer "prefer not to say."
Before the Effects of the COVID-19 Pandemic
Answer the following questions based on your shopping experiences before the COVID-19 pandemic.

28
Procedures
The researcher will disseminate invitations to the survey to WKU students and
faculty of Ogden College through the university’s internal e-mail system. The estimated
date to initiate survey dissemination is February 1, 2021. The researcher will issue the
invitations every Monday at 7:00 am (CST), and the surveys will remain active until
11:59 PM the following Sunday. The researcher will issue surveys by this pattern from
February 1, 2021 through February 22, 2021 for a total of four data collection cycles.
Sample subjects may only respond to the survey once. The researcher requires at least 50
respondents for a representative sample (n ≥ 50). Upon completion of the final data
collection cycle at 11:59 PM on February 28, 2021, the researcher will begin quantitative
and qualitative analyses of the compiled data for the sample.
Method of Data Analysis
The principal investigator will utilize descriptive statistics analysis to characterize
the frequency distributions of responses for each question to determine potential
consensus purchase frequencies and preferences for market. Then, the principal
investigator will assign numerical ranks to responses to examine the individual and net
differences/changes in purchase frequencies and changes in preferences between paired
survey questions. The possible combinations of survey question comparisons include the
comparison between markets for a product category within a temporal period, the
comparison of the previous article between temporal periods, and the comparison of a
market for a product category between temporal periods. Utilizing a confidence interval
of α = 0.05, the criteria to satisfy a statistically significant difference (or “change” for
comparison of temporal periods) between the distributions of responses for a pair of

29
survey questions are as follows: there is a difference in median and/or mode of at least ±1
AND there is a directional net difference/change of 4 or more individual reports [if α =
0.05, a difference of ranks between markets or a change of ranks within a market between
temporal periods of n ≥ 4 ( n = 61, 61 x 0.05 = 3.05 » 4) indicates a statistically
significant difference/change that is likely not random], AND there are remarkable
differences in distribution shape, primarily skew (note: distributions are assumed to non-
parametric, but the distributions of paired responses can be assumed to be identical if
independent variables have no influence because the participants are known to be the
same across all survey questions, which allows comparison of distribution shape between
any permissible pair; differences in distribution characteristics and statistically significant
net differences/changes of rank/preference indicate an independent variable likely does
influence consumer behaviors and, thus, survey responses). With the knowledge of
distributions and statistically significant differences between temporal periods, the
researcher will interpret the relationship of consumer market preference with estimated
purchase frequency through each market and the potential causation relationships for
changes in purchase frequencies and preferences after the pervasive social and economic
effects of the global COVID-19 pandemic in comparison to existing literature.
Threats to Validity
As the survey design is novel, validity and reliability are unknown. The
distributions of survey responses are assumed to be non-parametric and the data are
ordinal, thus quantitative analyses are prohibited. The comparisons of medians, modes,
net rank/preference differences/changes, and distribution shapes lack the validity and
reliability of quantitative analyses, but they can adequately assess statistically significant

30
differences between distributions upon satisfying the principal investigator’s criteria. The
study intends to collect a random sample through voluntary respondence, but the study
will likely become biased toward specific demographics for age and highest level of
education due to the target population. Furthermore, the validity of responses depends
significantly upon the participants’ gravity and honesty; thus, the potential exists for
participants to report false information intentionally for personal amusement. Any
analysis requires a minimum of n = 30 for adequate power, but the principal investigator
desires a sample size of n ≥ 50 to improve power. Any individual demographic
represented within the sample will likely lack the statistical power for any accuracy or
meaningful practical significance to suggest trends in consumer behavior specific to an
individual demographic.

31
Results
During February 2021, the survey invitations were issued via e-mail to the student
and faculty population of WKU’s Ogden College (N = 1195) on February 1st, February
8th, and February 18th. Due to security concerns, the principal investigator, as a student,
was not permitted access to the mailing list for Ogden College, therefore requiring the
dissemination of e-mail surveys by a faculty member with permitted access. Thus, the
procedure for data collection deviated from the reported plan, in which survey invitations
were not issued according to the reported schedule. Nevertheless, on March 1, 2021, the
principal investigator closed the survey to further response, yielding 72 respondents, of
which 11 were excluded due to failure to complete the survey. Only respondents who had
successfully reported ranks for every pair of purchase frequency questions are included in
data analysis (n = 61).
Demographics Distributions
The first four questions of the survey request demographic information for
gender, age, ethnicity, and highest level of education completed (Q1-Q4 respectively).
While the sample size (n = 61) satisfies the statistical power to analyze the sample as a
whole with adequate validity, there are few individual identifiers that meet the minimum
size (n = 30) to represent a specific demographic with any remarkable validity or
accuracy in regard to potential trends or associations with reported ranks/preferences or
changes in ranks/preferences between temporal periods (i.e., before and after the
systemic effects of the pandemic).

32
Gender
The sample is composed of nearly two-thirds males (n = 38; 62.30%), slightly
over one-third female (n = 22; 36.06%), and a single respondent who prefers not to report
gender (1.64%) (Table 1; Figure 2).
Table 1. Gender Distribution
Figure 2. Gender Distribution (%)
Age
The sample demonstrates some variety in the distribution of age ranges, in which
63.93% (n = 39) respondents are 18-25 years old, and the distribution skews toward the
older age ranges (Table 2; Figures 3 and 4); when compared with the highest level of
education completed, the principal investigator can infer that the majority of 18-25 year-
Gender Count %
Female 22 36.06
Male 38 62.30
Other 0 0.00
Prefer not to say 1 1.64
Total 61 100.00
Gender Distribution

33
olds in the sample are students and the spike in the quantity of 55-64 year-olds is likely
attributed to faculty members with master’s and/or doctorate degrees.
Table 2. Age Distribution
Figure 3. Age Distribution Histogram
Age Range Count %
18-25 39 63.93
26-35 5 8.20
36-45 5 8.20
46-55 2 3.28
56-64 6 9.84
65+ 1 1.64
Prefer not to say 3 4.92
Total 61 100.01
Age Distribution

34
Figure 4. Age Distribution (%)
Ethnicity
A vast majority of the sample identifies as Caucasian (n = 48; 78.69%) (Table 3;
Figure 5), which is technically an umbrella term for a plethora of distinct European
cultures who are associated by a common pale skin tone and cultural similarities; thus,
the proportion of the sample identifying as Caucasian may actually represent a greater
diversity of ethnic heritages, but the homogeneity of American culture negates the
relevance of such a notion or that pertaining to any other ethnicity choice in the survey.
The second greatest proportion of the population is composed of four individuals who
prefer not to report ethnicity (6.56%). Next, another three individuals identify as “other”
(4.92%), which is nearly as nondescript as reporting “prefer not to say,” but these
individuals still demonstrated a willingness to report ethnicity if only the accurate
identifier was an available choice. Otherwise, the remainder of the sample consists of two
individuals who identify as African-American (3.28%), three who identify as Hispanic or
Latino (4.92%), and one who identifies as Asian (1.64%). While the aforementioned
demographics of ethnicity tend to be broader in constituency, the most specific choices

35
for ethnicity, Native American and Native Hawaiian or Pacific Islander, are not
represented in the sample.
Table 3. Ethnicity Distribution
Figure 5. Ethnicity Distribution (%)
Highest Level of Education Completed
The sample’s characterization of the highest level of education completed reflects
a similar distribution to age, in which the majority of the sample is composed of
individuals with high school or equivalent (e.g., GED) (n = 26; 42.62%) as the highest
level of education completed, and the distribution skews toward the higher levels of
education (Table 4; Figure 6). No respondents report completion of a trade degree,
Ethnicity Count %
Caucasian 48 78.69
African-American 2 3.28
Hispanic or Latino 3 4.92
Asian 1 1.64
Native American 0 0.00
Native Hawaiian or Pacific Islander 0 0.00
Other 3 4.92
Prefer not to say 4 6.56
Total 61 100.01
Ethnicity Distribution

36
licensure, or certification. The majority of individuals reporting high school or
equivalent, an associate degree, or a bachelor’s degree are likely current students, and the
majority of individuals with master’s or doctorate degrees are likely faculty members.
Table 4. Distribution of Highest Level of Education Completed
Figure 6. Distribution of Highest Level of Education Completed (%)
Highest Level of Education Completed Count %
High school or equivalent 26 42.62
Associate's degree 11 18.03
Bachelor's degree 12 19.67
Master's degree 3 4.92
Doctorate degree 8 13.11
Trade degree 0 0.00
Prefer not to say 1 1.64
Total 61 100.00
Distribution of Highest Level of Education Completed

37
Purchase Frequency Ranks and Market Preferences
Sample Rank and Market Preference Distributions
Q5: Estimated Purchase Frequency for Apparel through BAM (Pre-
pandemic)
The median and mode of the sample is Rank 3 (Sometimes), and the distribution
skews toward higher ranks (Table 6; Figure 7). There are 47 respondents reporting Ranks
1, 2, and 3 (the low to moderate purchase frequency region of the Likert scale; Table 5)
(77.05%), whereas 12 respondents report Ranks 5, 6, and 7 (the moderate to high
purchase frequency region of the Likert scale) (19.67%). The distribution of estimated
purchase frequency ranks suggests a majority of the sample had low to moderate
purchase frequency for apparel through BAM before the effects of the pandemic.
Table 5. Likert Scale Rank Assignments
Survey Choice Rank
Never 1
Rarely 2
Sometimes 3
Half the time 4
Often 5
Most of the time 6
Always 7
Likert Scale Rank Assignments

38
Table 6. Purchase Frequency Rank Distributions
Figure 7. Q5 Purchase Frequency Rank Distribution
Q6: Estimated Purchase Frequency for Apparel through Online Retail (Pre-
pandemic)
The median and mode of the sample is Rank 2 (Rarely), and the distribution
skews toward higher ranks (Table 6; Figure 8). There are 49 respondents reporting Ranks
1, 2, and 3 (80.33%), whereas six respondents report Ranks 5, 6, and 7 (9.84%). The
distribution of estimated purchase frequency ranks suggests a majority of the sample had
Q5 Q6 Q8 Q9 Q11 Q12 Q14 Q15 Q17 Q18 Q20 Q21 Q23 Q24 Q26 Q27
Rank 1 4 11 8 11 3 42 0 5 9 7 13 10 3 30 3 5
Rank 2 20 21 25 14 4 11 5 12 23 23 29 13 5 14 12 14
Rank 3 23 17 17 14 3 2 11 19 16 15 12 14 5 6 17 15
Rank 4 2 6 3 6 4 3 13 12 3 3 3 6 4 2 10 7
Rank 5 3 4 2 11 8 2 12 11 3 7 1 8 5 4 10 12
Rank 6 7 2 3 4 8 0 12 2 5 3 1 6 13 2 7 7
Rank 7 2 0 3 1 31 1 8 0 2 3 2 4 26 3 2 1
Median 3 2 2 3 7 1 5 3 2 3 2 3 6 2 3 3
Mode 3 2 2 2, 3 7 1 4 3 2 2 2 3 7 1 3 3
Pre-pandemic Effects Post-pandemic Effects
Purchase Frequency Rank Distributions

39
very low to moderate purchase frequency for apparel through online retail before the
effects of the pandemic.
Figure 8. Q6 Purchase Frequency Rank Distribution
Q7: Market Preference for Apparel (Pre-pandemic)
The sample distribution of market preference is 46 respondents who report a
preference for BAM (75.41%), 13 respondents who report a preference for online retail
(21.31%), and two respondents who do not report a preference (3.38%) (Table 7; Figure
9). The distribution of market preference suggests a majority of the sample preferred
purchasing apparel through BAM before the effects of the pandemic, but over a fifth of
the sample preferred utilizing online retail.
Table 7. Preference Distributions
Q7 Q10 Q13 Q16 Q19 Q22 Q25 Q28
BAM 46 22 52 38 42 21 51 34
Online 13 38 7 23 18 39 9 25
N/A 2 1 2 0 1 1 1 2
Pre-pandemic Effects Post-pandemic Effects
Preference Distributions

40
Figure 9. Q7 Preference Distribution (%)
Q8: Estimated Purchase Frequency for Electronics through BAM (Pre-
pandemic)
The median and the mode of the sample is Rank 2 (Rarely), and the distribution
skews into a plateau toward higher ranks (Table 6; Figure 10). There are 50 respondents
reporting Ranks 1, 2, and 3 (81.97%), whereas eight respondents report Ranks 5, 6, and 7
(13.11%). The distribution of estimated purchase frequency ranks suggests a majority of
the sample had low to moderate purchase frequency for electronics through BAM before
the effects of the pandemic.

41
Figure 10. Q8 Purchase Frequency Rank Distribution
Q9: Estimated Purchase Frequency for Electronics through Online Retail
(Pre-pandemic)
The median of the sample is Rank 3 (Sometimes), the modes are Ranks 2 and 3
(Rarely and Sometimes), and the distribution is relatively even around the bimodality of
Ranks 2 and 3 before skewing toward higher ranks past Rank 5 (Table 6; Figure 11).
There are 39 respondents reporting Ranks 1, 2, and 3 (63.93%), whereas 16 respondents
report Ranks 5, 6, and 7 (26.23%). The distribution of estimated purchase frequency
ranks suggests a majority of the sample had very low to moderate purchase frequency for
electronics through online retail before the effects of the pandemic, but over a quarter of
the sample report moderate to high purchase frequency.

42
Figure 11. Q9 Purchase Frequency Rank Distribution
Q10: Market Preference for Electronics (Pre-pandemic)
The sample distribution of market preference is 22 respondents who report a
preference for BAM (36.07%), 38 respondents who report a preference for online retail
(62.30%), and one respondent who does not report a preference (1.64%) (Table 7; Figure
12). The distribution of market preference suggests a majority of the sample preferred
purchasing electronics through online retail before the effects of the pandemic, but over a
third of the sample preferred utilizing BAM.
Figure 12. Q10 Preference Distribution (%)

43
Q11: Estimated Purchase Frequency for Groceries through BAM (Pre-
pandemic)
The median and mode of the sample is Rank 7 (Always), and the distribution
skews severely toward lower ranks below Rank 7 and diminishes in a step pattern of
plateaus from Rank 6 to Rank 5 and from Rank 4 to Rank 1 (Table 6; Figure 13). There
are ten respondents reporting Ranks 1, 2, and 3 (16.39%), whereas 47 respondents report
Ranks 5, 6, and 7 (77.05%), of which 31 report Rank 7 (50.82%). The distribution of
estimated purchase frequency ranks suggests a majority of the sample, with literally half
the sample reporting the highest purchase frequency rank, had very high purchase
frequency for groceries through BAM before the effects of the pandemic.
Figure 13. Q11 Purchase Frequency Rank Distribution
Q12: Estimated Purchase Frequency for Groceries through Online Retail
(Pre-pandemic)
The median and mode of the sample is Rank 1 (Never), and the distribution skews
severely toward higher ranks past Rank 1 (Table 6; Figure 14). There are 55 respondents
reporting Ranks 1, 2, and 3 (90.16%), of which 42 report Rank 1 (68.85%), whereas three

44
respondents report Ranks 5, 6, and 7 (4.92%). The distribution of estimated purchase
frequency ranks suggests a majority of the sample, with over half the sample reporting
the lowest purchase frequency rank, had very low to practically no purchase frequency
for groceries through online retail before the effects of the pandemic.
Figure 14. Q12 Purchase Frequency Rank Distribution
Q13: Market Preference for Groceries (Pre-pandemic)
The sample distribution of market preference is 52 respondents who report a
preference for BAM (85.25%), seven respondents who report a preference for online
retail (11.48%), and two respondents who do not report a preference (3.28%) (Table 7;
Figure 15). The distribution of market preference suggests a vast majority of the sample
preferred purchasing groceries through BAM before the effects of the pandemic, but over
a tenth of the sample preferred utilizing online retail.

45
Figure 15. Q13 Preference Distribution (%)
Q14: Estimated Purchase Frequency for General Shopping through BAM
(Pre-pandemic)
The median of the sample is Rank 5 (Often), the mode is Rank 4 (Half the time),
and the distribution is a plateau centered around the median (Table 6; Figure 16). There
are 16 respondents reporting Ranks 1, 2, and 3 (26.23%), 13 respondents reporting Rank
4 (21.31%), and 32 respondents report Ranks 5, 6, and 7 (52.46%). The distribution of
estimated purchase frequency ranks suggests a majority of the sample had moderate to
high purchase frequency in general through BAM before the effects of the pandemic.

46
Figure 16. Q14 Purchase Frequency Rank Distribution
Q15: Estimated Purchase Frequency for General Shopping through Online
Retail (Pre-pandemic)
The median and mode of the sample is Rank 3 (Sometimes), and the distribution
resembles a normal distribution centered around the median (Table 6; Figure 17). There
are 36 respondents reporting Ranks 1, 2, and 3 (59.02%), 12 respondents reporting Rank
4 (19.67%), and 13 respondents report Ranks 5, 6, and 7 (21.31%). The distribution of
estimated purchase frequency ranks suggests a majority of the sample had very low to
moderate purchase frequency in general through online retail before the effects of the
pandemic.

47
Figure 17. Q15 Purchase Frequency Rank Distribution
Q16: General Market Preference (Pre-pandemic)
The sample distribution of market preference is 38 respondents who report a
preference for BAM (62.30%) and 23 respondents who report a preference for online
retail (37.70%) (Table 7; Figure 18). The distribution of market preference suggests a
majority of the sample preferred utilizing BAM for general (i.e., all/total within a month)
purchases before the effects of the pandemic, but over a third of the sample preferred
utilizing online retail.

48
Figure 18. Q16 Preference Distribution
Q17: Estimated Purchase Frequency for Apparel through BAM (Post-
pandemic)
The median and mode of the sample is Rank 2 (Rarely), and the distribution
sharply skews toward higher ranks past Rank 3 (Table 6; Figure 19). There are 48
respondents reporting Ranks 1, 2, and 3 (78.69%), whereas ten respondents report Ranks
5, 6, and 7 (16.39%). The distribution of estimated purchase frequency ranks suggests a
majority of the sample has very low to low purchase frequency for apparel through BAM
after the effects of the pandemic.

49
Figure 19. Q17 Purchase Frequency Rank Distribution
Q18: Estimated Purchase Frequency for Apparel through Online Retail
(Post-pandemic)
The median of the sample is Rank 3 (Sometimes), the mode is Rank 2 (Rarely),
and the distribution sharply skews toward higher ranks past Rank 3 (Table 6; Figure 20).
There are 45 respondents reporting Ranks 1, 2, and 3 (73.77%), whereas 13 respondents
report Ranks 5, 6, and 7 (21.31%). The distribution of estimated purchase frequency
ranks suggests a majority of the sample has very low to low purchase frequency for
apparel through online retail after the effects of the pandemic.

50
Figure 20. Q18 Purchase Frequency Rank Distribution
Q19: Market Preference for Apparel (Post-pandemic)
The sample distribution of market preference is 42 respondents who report a
preference for BAM (68.85%), 18 respondents who report a preference for online retail
(29.51%), and one respondent who does not report a preference (1.64%) (Table 7; Figure
21). The distribution of market preference suggests a majority of the sample prefers
purchasing apparel through BAM after the effects of the pandemic, but nearly a third of
the sample prefers utilizing online retail.

51
Figure 21. Q19 Preference Distribution (%)
Q20: Estimated Purchase Frequency for Electronics through BAM (Post-
pandemic)
The median and the mode of the sample is Rank 2 (Rarely), and the distribution
severely skews toward higher ranks past Rank 3 (Table 6; Figure 22). There are 56
respondents reporting Ranks 1, 2, and 3 (91.80%), of which 29 report Rank 2 (47.54%),
whereas four respondents report Ranks 5, 6, and 7 (6.56%). The distribution of estimated
purchase frequency ranks suggests a majority of the sample has very low to low purchase
frequency for electronics through BAM after the effects of the pandemic.

52
Figure 22. Q20 Purchase Frequency Rank Distribution
Q21: Estimated Purchase Frequency for Electronics through Online Retail
(Post-pandemic)
The median and mode of the sample is Rank 3 (Sometimes), and the distribution
skews toward higher ranks past the median (Table 6; Figure 23). There are 37
respondents reporting Ranks 1, 2, and 3 (60.66%), whereas 18 respondents report Ranks
5, 6, and 7 (29.51%). The distribution of estimated purchase frequency ranks suggests a
majority of the sample has very low to low purchase frequency for electronics through
online retail after the effects of the pandemic, but nearly a third of the sample reports
moderate to high purchase frequency.

53
Figure 23. Q21 Purchase Frequency Rank Distribution
Q22: Market Preference for Electronics (Post-pandemic)
The sample distribution of market preference is 21 respondents who report a
preference for BAM (34.43%), 39 respondents who report a preference for online retail
(63.93%), and one respondent who does not report a preference (1.64%) (Table 7; Figure
24). The distribution of market preference suggests a majority of the sample prefers
purchasing electronics through online retail after the effects of the pandemic, but over a
third of the sample prefers utilizing BAM.
Figure 24. Q22 Preference Distribution (%)

54
Q23: Estimated Purchase Frequency for Groceries through BAM (Post-
pandemic)
The median of the sample is Rank 6 (Most of the time), the mode is Rank 7
(Always), and the distribution skews toward lower ranks into a plateau below Rank 6
(Table 6; Figure 25). There are 13 respondents reporting Ranks 1, 2, and 3 (21.31%),
whereas 44 respondents report Ranks 5, 6, and 7 (72.13%), of which 26 report Rank 7
(42.62%). The distribution of estimated purchase frequency ranks suggests a majority of
the sample, with nearly half the sample reporting the highest purchase frequency rank,
has very high purchase frequency for groceries through BAM after the effects of the
pandemic.
Figure 25. Q23 Purchase Frequency Rank Distribution
Q24: Estimated Purchase Frequency for Groceries through Online Retail
(Post-pandemic)
The median of the sample is Rank 2 (Rarely), the mode is Rank 1 (Never), and the
distribution skews severely toward higher ranks past Rank 1 (Table 6; Figure 26). There
are 50 respondents reporting Ranks 1, 2, and 3 (81.97%), of which 30 report Rank 1

55
(49.18%), whereas nine respondents report Ranks 5, 6, and 7 (14.75%). The distribution
of estimated purchase frequency ranks suggests a majority of the sample, with nearly half
the sample reporting the lowest purchase frequency rank, has very low to practically no
purchase frequency for groceries through online retail after the effects of the pandemic.
Figure 26. Q24 Purchase Frequency Rank Distribution
Q25: Market Preference for Groceries (Post-pandemic)
The sample distribution of market preference is 51 respondents who report a
preference for BAM (83.61%), nine respondents who report a preference for online retail
(14.75%), and one respondent who does not report a preference (1.64%) (Table 7; Figure
27). The distribution of market preference suggests a vast majority of the sample prefers
purchasing groceries through BAM after the effects of the pandemic, but over a tenth of
the sample prefers utilizing online retail.

56
Figure 27. Q25 Preference Distribution (%)
Q26: Estimated Purchase Frequency for General Shopping through BAM
(Post-pandemic)
The median and mode of the sample is Rank 3 (Sometimes), and the distribution
mimics a normal distribution centered around the median (Table 6; Figure 28). There are
32 respondents reporting Ranks 1, 2, and 3 (52.46%), ten respondents reporting Rank 4
(16.39%), and 19 respondents report Ranks 5, 6, and 7 (31.15%). The distribution of
estimated purchase frequency ranks suggests a majority of the sample has low to
moderate purchase frequency in general through BAM after the effects of the pandemic.
Figure 28. Q26 Purchase Frequency Rank Distribution

57
Q27: Estimated Purchase Frequency for General Shopping through Online
Retail (Post-pandemic)
The median and mode of the sample is Rank 3 (Sometimes), and the distribution
skews toward higher ranks past Rank 3 with a second, albeit not bimodal, peak at Rank 5
(Table 6; Figure 29). There are 34 respondents reporting Ranks 1, 2, and 3 (55.74%),
seven respondents reporting Rank 4 (11.48%), and 20 respondents report Ranks 5, 6, and
7 (32.79%). The distribution of estimated purchase frequency ranks suggests a majority
of the sample has very low to moderate purchase frequency in general through online
retail after the effects of the pandemic.
Figure 29. Q27 Purchase Frequency Rank Distribution
Q28: General Market Preference (Post-pandemic)
The sample distribution of market preference is 34 respondents who report a
preference for BAM (55.74%), 25 respondents who report a preference for online retail
(40.98%), and two respondents who do not report a preference (3.28%) (Table 7; Figure
30). The distribution of market preference suggests a majority (i.e., over half) of the

58
sample prefers utilizing BAM for general purchases after the effects of the pandemic, but
nearly half the sample prefers utilizing online retail.
Figure 30. Q28 Preference Distribution (%)
Rank Differences between Markets within Temporal Periods
Difference of Markets for Apparel before the Effects of the Pandemic
(Q5:Q6)
In the comparison of purchase frequency for apparel between BAM and online
retail before the effects of the pandemic, the difference of medians and of modes is -1
(Tables 8 and 9). The net differences of rank are two for low ranks (sum of differences
for Ranks 1, 2, and 3), four for Rank 4 (“Half the time” implies no difference in
proportion of market utilization), and -6 for high ranks (sum of differences for Ranks 5,
6, and 7), indicating a net of six individual reports that decrease from high ranks to Rank
4 and low ranks (Tables 8 and 9; Figure 31). The differences in median and mode, the net
difference of ranks, and the differences in distribution patterns indicate a statistically
significant difference between the reported purchase frequencies for apparel through
BAM and online retail before the effects of the pandemic, in which the sample

59
demonstrates slightly lower purchase frequency for apparel through online retail than
BAM before the effects of the pandemic.
Table 8. Net Differences of Rank, Median, and Mode between Markets
Table 9. Q5:Q6 Net Differences of Rank
Figure 31. Q5:Q6 Net Differences of Rank
Q5:Q6 Q8:Q9 Q11:Q12 Q14:Q15 Q17:Q18 Q20:Q21 Q23:Q24 Q26:Q27
Net Low 2 -11 45 20 -3 -17 37 2
Net Mid 4 3 -1 -1 0 3 -2 -3
Net High -6 8 -44 -19 3 14 -35 1
Median -1 1 -6 -2 1 1 -4 0
Mode -1 0, 1 -6 -1 0 1 -6 0
Net Differences of Rank, Median, and Mode between Markets
Pre-pandemic Effects Post-pandemic Effects
Q5 Q6 Net Difference
Rank 1 4 11 7
Rank 2 20 21 1
Rank 3 23 17 -6
Rank 4 2 6 4
Rank 5 3 4 1
Rank 6 7 2 -5
Rank 7 2 0 -2
Q5:Q6 Net Differences of Rank

60
Difference of Markets for Electronics before the Effects of the Pandemic
(Q8:Q9)
In the comparison of purchase frequency for electronics between BAM and online
retail before the effects of the pandemic, the difference of medians is one, and the
differences of modes are zero and one (the sample distribution for Q9 is bimodal) (Tables
8 and 10). The net differences of rank are -11 for low ranks, three for Rank 4, and eight
for high ranks, indicating a net of 11 individual reports that increase from low ranks to
Rank 4 and high ranks (Tables 8 and 10; Figure 32). The differences in median and
mode, the net difference of ranks, and the differences in distribution patterns indicate a
statistically significant difference between the reported purchase frequencies for
electronics through BAM and online retail before the effects of the pandemic, in which
the sample demonstrates moderately higher purchase frequency for electronics through
online retail than BAM before the effects of the pandemic.
Table 10. Q8:Q9 Net Differences of Rank
Q8 Q9 Net Difference
Rank 1 8 11 3
Rank 2 25 14 -11
Rank 3 17 14 -3
Rank 4 3 6 3
Rank 5 2 11 9
Rank 6 3 4 1
Rank 7 3 1 -2
Q8:Q9 Net Differences of Rank

61
Figure 32. Q8:Q9 Net Differences of Rank
Difference of Markets for Groceries before the Effects of the Pandemic
(Q11:Q12)
In the comparison of purchase frequency for groceries between BAM and online
retail before the effects of the pandemic, the difference of medians and modes is -6
(Tables 8 and 11). The net differences of rank are 45 for low ranks, -1 for Rank 4, and -
44 for high ranks, indicating an astounding net of 45 individual reports that decrease from
high ranks to Rank 4 and low ranks (Tables 8 and 11; Figure 33). The distribution
patterns for Q11 and Q12 are nearly the identical inverse of each other, in which the
distribution of Q11 features a median and mode of Rank 7 (Always) and a severe skew
toward lower ranks, whereas the distribution of Q12 features a median and mode of Rank
1 (Never) and a severe skew toward higher ranks. The differences in median and mode,
the net difference of ranks, and the differences in distribution patterns indicate a
statistically and practically significant difference between the reported purchase
frequencies for groceries through BAM and online retail before the effects of the
pandemic, in which the sample demonstrates dramatically lower purchase frequency (i.e.,

62
practically none) for groceries through online retail than BAM before the effects of the
pandemic.
Table 11. Q11:Q12 Net Differences of Rank
Figure 33. Q11:Q12 Net Differences of Rank
Difference of Markets in General before the Effects of the Pandemic
(Q14:Q15)
In the comparison of purchase frequency for general purchases between BAM and
online retail before the effects of the pandemic, the difference of medians is -2, and the
difference of modes is -1 (Tables 8 and 12). The net differences of rank are 20 for low
ranks, -1 for Rank 4, and -19 for high ranks, indicating a remarkable net of 20 individual
Q11 Q12 Net Difference
Rank 1 3 42 39
Rank 2 4 11 7
Rank 3 3 2 -1
Rank 4 4 3 -1
Rank 5 8 2 -6
Rank 6 8 0 -8
Rank 7 31 1 -30
Q11:Q12 Net Differences of Rank

63
reports that decrease from high ranks and Rank 4 to low ranks (Tables 8 and 12; Figure
34). The differences in median and mode, the net difference of ranks, and the differences
in distribution patterns indicate a statistically and practically significant difference
between the reported purchase frequencies for general purchases through BAM and
online retail before the effects of the pandemic, in which the sample demonstrates
remarkably lower purchase frequency for general purchases through online retail than
BAM before the effects of the pandemic.
Table 12. Q14:Q15 Net Differences of Rank
Figure 34. Q14:Q15 Net Differences of Rank
Q14 Q15 Net Difference
Rank 1 0 5 5
Rank 2 5 12 7
Rank 3 11 19 8
Rank 4 13 12 -1
Rank 5 12 11 -1
Rank 6 12 2 -10
Rank 7 8 0 -8
Q14:Q15 Net Differences of Rank

64
Difference of Markets for Apparel after the Effects of the Pandemic
(Q17:Q18)
In the comparison of purchase frequency for apparel between BAM and online
retail after the effects of the pandemic, the difference of medians is one, and the
difference of modes is zero (Tables 8 and 13). The net differences of rank are -3 for low
ranks, zero for Rank 4, and three for high ranks, indicating a net of three individual
reports that increase from low ranks to high ranks (Tables 8 and 13; Figure 35). The
differences in median and mode, the net difference of ranks, and the differences in
distribution patterns indicate no statistically significant difference between the reported
purchase frequencies for apparel through BAM and online retail after the effects of the
pandemic, albeit with a difference of one between medians, in which the sample
demonstrates statistically and practically no difference in the purchase frequencies for
apparel through online retail and BAM after the effects of the pandemic. With no
statistical difference between markets, the majority of the sample for both Q17 and Q18
report very low to low purchase frequency.
Table 13. Q17:Q18 Net Differences of Rank
Q17 Q18 Net Difference
Rank 1 9 7 -2
Rank 2 23 23 0
Rank 3 16 15 -1
Rank 4 3 3 0
Rank 5 3 7 4
Rank 6 5 3 -2
Rank 7 2 3 1
Q17:Q18 Net Differences of Rank

65
Figure 35. Q17:Q18 Net Differences of Rank
Difference of Markets for Electronics after the Effects of the Pandemic
(Q20:Q21)
In the comparison of purchase frequency for electronics between BAM and online
retail after the effects of the pandemic, the difference of medians and modes is one
(Tables 8 and 14). The net differences of rank are -17 for low ranks, 3 for Rank 4, and 14
for high ranks, indicating a remarkable net of 17 individual reports that increase from low
ranks to Rank 4 and high ranks (Tables 8 and 14; Figure 36). The differences in median
and mode, the net difference of ranks, and the differences in distribution patterns indicate
a statistically and practically significant difference between the reported purchase
frequencies for electronics through BAM and online retail after the effects of the
pandemic, in which the sample demonstrates remarkably higher purchase frequency for
electronics through online retail than BAM after the effects of the pandemic.

66
Table 14. Q20:Q21 Net Differences of Rank
Figure 36. Q20:Q21 Net Differences of Rank
Difference of Markets for Groceries after the Effects of the Pandemic
(Q23:Q24)
In the comparison of purchase frequency for groceries between BAM and online
retail after the effects of the pandemic, the difference of medians is -4, and the difference
of modes is -6 (Tables 8 and 15). The net differences of rank are 37 for low ranks, -2 for
Rank 4, and -35 for high ranks, indicating an astounding net of 37 individual reports that
decrease from high ranks and Rank 4 to low ranks (Tables 8 and 15; Figure 37). The
distribution patterns for Q23 and Q24 are nearly the identical inverse of each other, in
which the distribution of Q23 features a median of Rank 6 (Most of the time), a mode of
Rank 7 (Always), and a severe skew toward lower ranks, whereas the distribution of Q24
features a median of Rank 2 (Rarely), a mode of Rank 1 (Never), and a severe skew
Q20 Q21 Net Difference
Rank 1 13 10 -3
Rank 2 29 13 -16
Rank 3 12 14 2
Rank 4 3 6 3
Rank 5 1 8 7
Rank 6 1 6 5
Rank 7 2 4 2
Q20:Q21 Net Differences of Rank

67
toward higher ranks. The differences in median and mode, the net difference of ranks,
and the differences in distribution patterns indicate a statistically and practically
significant difference between the reported purchase frequencies for groceries through
BAM and online retail after the effects of the pandemic, in which the sample
demonstrates dramatically lower (i.e., practically none) purchase frequency for groceries
through online retail than BAM after the effects of the pandemic.
Table 15. Q23:Q24 Net Differences of Rank
Figure 37. Q23:Q24 Net Differences of Rank
Q23 Q24 Net Difference
Rank 1 3 30 27
Rank 2 5 14 9
Rank 3 5 6 1
Rank 4 4 2 -2
Rank 5 5 4 -1
Rank 6 13 2 -11
Rank 7 26 3 -23
Q23:Q24 Net Differences of Rank

68
Difference of Markets in General after the Effects of the Pandemic
(Q26:Q27)
In the comparison of purchase frequency for general purchases between BAM and
online retail after the effects of the pandemic, the difference of medians and modes is
zero (Tables 8 and 16). The net differences of rank are two for low ranks, -3 for Rank 4,
and one for high ranks, indicating a net of 3 individual reports that decrease from Rank 4
by two to low ranks and increase from Rank 4 by one to higher ranks (Tables 8 and 16;
Figure 38). The differences in median and mode, the net difference of ranks, and the
differences in distribution patterns indicate no statistically significant difference between
the reported purchase frequencies for general purchases through BAM and online retail
after the effects of the pandemic, in which the sample demonstrates statistically and
practically no difference in the purchase frequencies for general purchases through online
retail and BAM after the effects of the pandemic. With no statistical difference between
markets, the majority of the sample for both Q26 and Q27 report very low to moderate
purchase frequency.
Table 16. Q26:Q27 Net Differences of Rank
Q26 Q27 Net Difference
Rank 1 3 5 2
Rank 2 12 14 2
Rank 3 17 15 -2
Rank 4 10 7 -3
Rank 5 10 12 2
Rank 6 7 7 0
Rank 7 2 1 -1
Q26:Q27 Net Differences of Rank

69
Figure 38. Q26:Q27 Net Differences of Rank
Rank Differences between Markets between Temporal Periods
Net Changes of Rank Differences for Apparel (Q5Q6:Q17Q18)
In the comparison of the rank differences of purchase frequencies between
markets across temporal periods (i.e., the analysis of net rank change in purchase
frequency between markets after the effects of the pandemic) for apparel, the difference
of median differences (i.e., change of median differences between markets after the
effects of the pandemic) is two, and the difference of mode differences (i.e., change of
mode differences between markets after the effects of the pandemic) is one (Tables 17
and 18). The net differences of rank difference (i.e., net changes of rank differences
between markets after the effects of the pandemic) are -5 for low ranks, -4 for Rank 4,
and nine for high ranks, indicating a net change of nine individual reports that increase
from low ranks and Rank 4 to high ranks after the effects of the pandemic (Tables 17 and
18; Figure 39). The changes in median difference and mode difference and the net change
of rank differences of purchase frequencies indicate a statistically significant difference
in the rank differences between markets across temporal periods for apparel, in which the

70
sample demonstrates higher purchase frequency for apparel through online retail than
BAM after the effects of the pandemic than before the effects of the pandemic.
Table 17. Net Changes of Rank, Median, and Mode Differences between Markets
Table 18. Q5Q6:Q17Q18 Net Changes of Rank Differences
Figure 39. Q5Q6:Q17Q18 Net Changes of Rank Differences
Q5Q6:Q17Q18 Q8Q9:Q20Q21 Q11Q12:Q23Q24 Q14Q15:Q26Q27
Net Low -5 -6 -8 -18
Net Mid -4 0 -1 -2
Net High 9 6 9 20
Median 2 0 2 2
Mode 1 1, 0 0 1
Net Changes of Rank, Median, and Mode Differences between Markets
Q5Q6 Q17Q18 Net Change
Rank 1 7 -2 -9
Rank 2 1 0 -1
Rank 3 -6 -1 5
Rank 4 4 0 -4
Rank 5 1 4 3
Rank 6 -5 -2 3
Rank 7 -2 1 3
Q5Q6:Q17Q18 Net Changes of Rank Differences

71
Net Changes of Rank Differences for Electronics (Q8Q9:Q20Q21)
In the analysis of net rank change in purchase frequency between markets across
temporal periods for electronics, the change of median difference between markets after
the effects of the pandemic is zero, and the changes of mode differences between markets
after the effects of the pandemic are one and zero (recall that the distribution of Q9 is
bimodal) (Tables 17 and 19). The net changes of rank difference between markets after
the effects of the pandemic are -6 for low ranks, zero for Rank 4, and six for high ranks,
indicating a net change of six individual reports that increase from low ranks to high
ranks after the effects of the pandemic (Tables 17 and 19; Figure 40). The change in
mode difference and the net change of rank differences of purchase frequencies indicate a
statistically significant difference in the rank differences between markets across
temporal periods for electronics, albeit without change in median difference, in which the
sample demonstrates slightly higher purchase frequency for electronics through online
retail than BAM after the effects of the pandemic than before the effects of the pandemic.
Table 19. Q8Q9:Q20Q21 Net Changes of Rank Differences
Q8Q9 Q20Q21 Net Change
Rank 1 3 -3 -6
Rank 2 -11 -16 -5
Rank 3 -3 2 5
Rank 4 3 3 0
Rank 5 9 7 -2
Rank 6 1 5 4
Rank 7 -2 2 4
Q8Q9:Q20Q21 Net Changes of Rank Differences

72
Figure 40. Q8Q9:Q20Q21 Net Changes of Rank Differences
Net Changes of Rank Differences for Groceries (Q11Q12:Q23Q24)
In the analysis of net rank change in purchase frequency between markets across
temporal periods for groceries, the change of median difference between markets after
the effects of the pandemic is two, and the change of mode difference between markets
after the effects of the pandemic is zero (Tables 17 and 20). The net changes of rank
difference between markets after the effects of the pandemic are -8 for low ranks, -1 for
Rank 4, and nine for high ranks, indicating a net change of nine individual reports that
increase from low ranks and Rank 4 to high ranks after the effects of the pandemic
(Tables 17 and 20; Figure 41). The change in median difference and the net change of
rank differences of purchase frequencies indicate a statistically significant difference in
the rank differences between markets across temporal periods for groceries, in which the
sample demonstrates slightly higher purchase frequency for groceries through online
retail than BAM after the effects of the pandemic than before the effects of the pandemic.

73
Table 20. Q11Q12:Q23Q24 Net Changes of Rank Differences
Figure 41. Q11Q12:Q23Q24 Net Changes of Rank Differences
Net Changes of Rank Differences in General (Q14Q15:Q26Q27)
In the analysis of net rank change in purchase frequency between markets across
temporal periods for general purchases, the change of median difference between markets
after the effects of the pandemic is two, and the change of mode difference between
markets after the effects of the pandemic is one (Tables 17 and 21). The net changes of
rank difference between markets after the effects of the pandemic are -18 for low ranks, -
2 for Rank 4, and 20 for high ranks, indicating a remarkable net of 20 individual reports
that increase from low ranks and Rank 4 to high ranks after the effects of the pandemic
Q11Q12 Q23Q24 Net Change
Rank 1 39 27 -12
Rank 2 7 9 2
Rank 3 -1 1 2
Rank 4 -1 -2 -1
Rank 5 -6 -1 5
Rank 6 -8 -11 -3
Rank 7 -30 -23 7
Q11Q12:Q23Q24 Net Changes of Rank Differences

74
(Tables 17 and 21; Figure 42). The changes in median difference and mode difference
and the net change of rank differences of purchase frequencies indicate a statistically and
practically significant difference in the rank differences between markets across temporal
periods for general purchases, in which the sample demonstrates remarkably higher
purchase frequency for general purchases through online retail than BAM after the effects
of the pandemic than before the effects of the pandemic.
Table 21. Q14Q15:Q26Q27 Net Changes of Rank Differences
Figure 42. Q14Q15:Q26Q27 Net Changes of Rank Differences
Q14Q15 Q26Q27 Net Change
Rank 1 5 2 -3
Rank 2 7 2 -5
Rank 3 8 -2 -10
Rank 4 -1 -3 -2
Rank 5 -1 2 3
Rank 6 -10 0 10
Rank 7 -8 -1 7
Q14Q15:Q26Q27 Net Changes of Rank Differences

75
Net Rank Changes within Markets between Temporal Periods
Change in Apparel through BAM (Q5:Q17)
In the comparison of purchase frequency for apparel through BAM across
temporal periods (i.e., before and after the effects of the pandemic; the analysis of
purchase frequency change after the effects of the pandemic), the difference of medians
and of modes is -1 (Tables 22 and 23). The net differences of rank (i.e., the net changes
of rank after the effects of the pandemic) are one for low ranks, one for Rank 4, and -2
for high ranks, indicating a net change of two individual reports that decrease from high
ranks to Rank 4 and low ranks (Tables 22 and 23; Figure 43). While the differences in
median and mode would typically suggest a statistically significant difference between
the reported purchases frequencies for apparel through BAM across temporal periods, the
net change of rank and nearly identical distribution patterns indicate no statistically
significant difference between the reported purchase frequencies for apparel through
BAM across temporal periods, in which the sample demonstrates no statistically or
practically significant difference in purchase frequency after the effects of the pandemic
from that before the effects of the pandemic. With no statistical difference between
temporal periods, the majority of the sample for both Q5 and Q17 report very low to low
purchase frequency.
Table 22. Net Changes of Rank, Median, and Mode after Effects of the Pandemic
Q5:Q17 Q6:Q18 Q8:Q20 Q9:Q21 Q11:Q23 Q12:Q24 Q14:Q26 Q15:Q27
Net Low 1 -4 4 -2 3 -5 16 -2
Net Mid 1 -3 0 0 0 -1 -3 -5
Net High -2 7 -4 2 -3 6 -13 7
Median -1 1 0 0 -1 1 -2 0
Mode -1 0 0 1, 0 0 0 -1 0
Net Changes of Rank, Median, and Mode after Effects of the Pandemic

76
Table 23. Q5:Q17 Net Changes of Rank
Figure 43. Q5:Q17 Net Changes of Rank
Change in Apparel through Online Retail (Q6:Q18)
In the analysis of purchase frequency change for apparel through online retail
after the effects of the pandemic, the difference of medians is one, and the difference of
modes is -1 (Tables 22 and 24). The net changes of rank after the effects of the pandemic
are -4 for low ranks, -3 for Rank 4, and seven for high ranks, indicating a net change of
seven individual reports that increase from low ranks and Rank 4 to high ranks (Tables
22 and 24; Figure 44). The changes of median and mode, the net change of rank, and the
changes of distribution patterns indicate a statistically significant difference between the
Q5 Q17 Net Change
Rank 1 4 9 5
Rank 2 20 23 3
Rank 3 23 16 -7
Rank 4 2 3 1
Rank 5 3 3 0
Rank 6 7 5 -2
Rank 7 2 2 0
Q5:Q17 Net Changes of Rank

77
reported purchase frequencies for apparel through online retail across temporal periods,
in which the sample demonstrates a slight increase in purchase frequency after the effects
of the pandemic.
Table 24. Q6:Q18 Net Changes of Rank
Figure 44. Q6:Q18 Net Changes of Rank
Change in Electronics through BAM (Q8:Q20)
In the analysis of purchase frequency change for electronics through BAM after
the effects of the pandemic, the difference of medians and of modes is zero (Tables 22
and 25). The net changes of rank after the effects of the pandemic are four for low ranks,
zero for Rank 4, and -4 for high ranks, indicating a net change of four individual reports
Q6 Q18 Net Change
Rank 1 11 7 -4
Rank 2 21 23 2
Rank 3 17 15 -2
Rank 4 6 3 -3
Rank 5 4 7 3
Rank 6 2 3 1
Rank 7 0 3 3
Q6:Q18 Net Changes of Rank

78
that decrease from high ranks to low ranks (Tables 22 and 25; Figure 45). No changes of
median and mode, the minimum requirement for significance in net change of rank, and
the similar distribution patterns indicate no statistically significant difference between the
reported purchase frequencies for electronics through BAM across temporal periods, in
which the sample demonstrates no statistically or practically significant difference in
purchase frequency after the effects of the pandemic from that before the effects of the
pandemic. With no statistical difference between temporal periods, the majority of the
sample for both Q8 and Q20 report very low to low purchase frequency.
Table 25. Q8:Q20 Net Changes of Rank
Figure 43. Q8:Q20 Net Changes of Rank
Q8 Q20 Net Change
Rank 1 8 13 5
Rank 2 25 29 4
Rank 3 17 12 -5
Rank 4 3 3 0
Rank 5 2 1 -1
Rank 6 3 1 -2
Rank 7 3 2 -1
Q8:Q20 Net Changes of Rank

79
Change in Electronics through Online Retail (Q9:Q21)
In the analysis of purchase frequency change for electronics through online retail
after the effects of the pandemic, the difference of medians is zero, and the differences of
modes are one and zero (recall the distribution of Q9 is bimodal) (Tables 22 and 26). The
net changes of rank after the effects of the pandemic are -2 for low ranks, zero for Rank
4, and two for high ranks, indicating a net change of two individual reports that increase
from low ranks to high ranks (Tables 22 and 26; Figure 46). No changes of median and
mode (there is technically a change of mode by one, but the change merely eliminates the
bimodality of Q9’s distribution without increasing mode past Rank 3), no significant net
change of rank, and the similar distribution patterns indicate no statistically significant
difference between the reported purchase frequencies for electronics through online retail
across temporal periods, in which the sample demonstrates no statistically or practically
significant difference in purchase frequency after the effects of the pandemic from that
before the effects of the pandemic. With no statistical difference between temporal
periods, the majority of the sample for both Q9 and Q21 report very low (as low as
“never” for nearly a third of reported low ranks) to moderate purchase frequency.
Table 26. Q9:Q21 Net Changes of Rank
Q9 Q21 Net Change
Rank 1 11 10 -1
Rank 2 14 13 -1
Rank 3 14 14 0
Rank 4 6 6 0
Rank 5 11 8 -3
Rank 6 4 6 2
Rank 7 1 4 3
Q9:Q21 Net Changes of Rank

80
Figure 46. Q9:Q21 Net Changes of Rank
Change in Groceries through BAM (Q11:Q23)
In the analysis of purchase frequency change for groceries through BAM after the
effects of the pandemic, the difference of medians is -1, and the difference of modes is
zero (Tables 22 and 27). The net changes of rank after the effects of the pandemic are
three for low ranks, zero for Rank 4, and -3 for high ranks, indicating a net change of
three individual reports that decrease from high ranks to low ranks (Tables 22 and 27;
Figure 47). No significant net change of rank and the nearly identical distribution patterns
indicate no statistically significant difference between the reported purchase frequencies
for groceries through BAM across temporal periods, in which the sample demonstrates
no statistically or practically significant difference in purchase frequency after the effects
of the pandemic from that before the effects of the pandemic. With no statistical
difference between temporal periods, the majority of the sample for both Q11 and Q23
report very high purchase frequency.

81
Table 27. Q11:Q23 Net Changes of Rank
Figure 47. Q11:Q23 Net Changes of Rank
Change in Groceries through Online Retail (Q12:Q24)
In the analysis of purchase frequency change for groceries through online retail
after the effects of the pandemic, the difference of medians is one, and the difference of
modes is zero (Tables 22 and 28). The net changes of rank after the effects of the
pandemic are -5 for low ranks, -1 for Rank 4, and six for high ranks, indicating a net
change of six individual reports that increase from low ranks and Rank 4 to high ranks
(Tables 22 and 28; Figure 48). The change of median, net change of rank, and changes in
distribution patterns indicate a statistically significant difference between the reported
Q11 Q23 Net Change
Rank 1 3 3 0
Rank 2 4 5 1
Rank 3 3 5 2
Rank 4 4 4 0
Rank 5 8 5 -3
Rank 6 8 13 5
Rank 7 31 26 -5
Q11:Q23 Net Changes of Rank

82
purchase frequencies for groceries through online retail across temporal periods, in which
the sample demonstrates a spread of increased ranks from low ranks, especially Rank 1
(Never), suggesting a minority of participants have increased purchase frequency for
groceries through online retail by varying rates (the mode of individual rank change is
one; the spread of increased rank change is at least one per rank increase of one through
six) while retaining a vast majority (72.13%) that report very low (22.95%) to no
(49.18%) purchase frequency.
Table 28. Q12:Q24 Net Changes of Rank
Figure 48. Q12:Q24 Net Changes of Rank
Q12 Q24 Net Change
Rank 1 42 30 -12
Rank 2 11 14 3
Rank 3 2 6 4
Rank 4 3 2 -1
Rank 5 2 4 2
Rank 6 0 2 2
Rank 7 1 3 2
Q12:Q24 Net Changes of Rank

83
Change in General Purchases through BAM (Q14:Q26)
In the analysis of purchase frequency change for general purchases through BAM
after the effects of the pandemic, the difference of medians is -2, and the difference of
modes is -1 (Tables 22 and 29). The net changes of rank after the effects of the pandemic
are 16 for low ranks, -3 for Rank 4, and -13 for high ranks, indicating a net change of 13
individual reports that decrease from high ranks and Rank 4 to low ranks (Tables 22 and
29; Figure 49). The changes of median and mode, net change of rank, and changes in
distribution patterns indicate a statistically significant difference between the reported
purchase frequencies for general purchases through BAM across temporal periods, in
which the sample demonstrates a remarkable decrease in ranks at varying rates that shifts
the median to low ranks, thereby skewing the distribution toward higher ranks,
suggesting the sample has decreased purchase frequency in general through BAM after
the effects of the pandemic.
Table 29. Q14:Q26 Net Changes of Rank
Q14 Q26 Net Change
Rank 1 0 3 3
Rank 2 5 12 7
Rank 3 11 17 6
Rank 4 13 10 -3
Rank 5 12 10 -2
Rank 6 12 7 -5
Rank 7 8 2 -6
Q14:Q26 Net Changes of Rank

84
Figure 49. Q14:Q26 Net Changes of Rank
Change in General Purchases through Online Retail (Q15:Q27)
In the analysis of purchase frequency change for general purchases through online
retail after the effects of the pandemic, the difference of medians and of modes is zero
(Tables 22 and 30). The net changes of rank after the effects of the pandemic are -2 for
low ranks, -5 for Rank 4, and seven for high ranks, indicating a net change of seven
individual reports that increase from low ranks and Rank 4 to high ranks (Tables 22 and
30; Figure 50). The net change of rank and changes in distribution patterns indicate a
statistically significant difference between the reported purchase frequencies for general
purchases through online across temporal periods, in which the sample demonstrates a
net increase in ranks that creates two peaks (not bimodal) from the unchanged ranks that
retain the median and mode and the net increase of ranks, suggesting a minority of the
sample has increased purchase frequency in general through online retail from low to
moderate purchase frequency to high purchase frequency after the effects of the
pandemic.

85
Table 30. Q15:Q27 Net Changes of Rank
Figure 50. Q15:Q27 Net Changes of Rank
Market Preference Changes between Temporal Periods
Market Preference Change for Apparel (Q7:Q19)
In the analysis of market preference change for apparel after the effects of the
pandemic, the majority preference, BAM, does not change. There is a statistically
significant difference in the proportion of market use after the effects of the pandemic, in
which there is a net change of five individual reports that previously preferred BAM or
failed to report a preference but now prefer online retail, of which four individual reports
are known to change from BAM to online retail, yet there is no practical change as the
majority preference for BAM to purchase apparel remains the same (Table 31).
Q15 Q27 Net Change
Rank 1 5 5 0
Rank 2 12 14 2
Rank 3 19 15 -4
Rank 4 12 7 -5
Rank 5 11 12 1
Rank 6 2 7 5
Rank 7 0 1 1
Q15:Q27 Net Changes of Rank

86
Table 31. Q7:Q19 Net Changes of Market Preference
Market Preference Change for Electronics (Q10:Q22)
In the analysis of market preference change for electronics after the effects of the
pandemic, the majority preference, online retail, does not change. There is no statistically
significant difference in the proportion of market use after the effects of the pandemic, in
which the majority preference for online retail to purchase electronics remains the same
(Table 32).
Table 32. Q10:Q22 Net Changes of Market Preference
Market Preference Change for Groceries (Q13:Q25)
In the analysis of market preference change for groceries after the effects of the
pandemic, the majority preference, BAM, does not change. There is no statistically
significant difference in the proportion of market use after the effects of the pandemic, in
which the majority preference for BAM to purchase groceries remains the same (Table
33).
Table 33. Q13:Q25 Net Changes of Preference
Q7 Q19 Net Change
BAM 46 42 -4
Online 13 18 5
N/A 2 1 -1
Q7:Q19 Net Changes of Preference
Q10 Q22 Net Change
BAM 22 21 -1
Online 38 39 1
N/A 1 1 0
Q10:Q22 Net Changes of Preference
Q13 Q25 Net Change
BAM 52 51 -1
Online 7 9 2
N/A 2 1 -1
Q13:Q25 Net Changes of Preference

87
Market Preference Change for General Purchases (Q16:Q28)
In the analysis of market preference change for general purchases after the effects
of the pandemic, the majority preference, BAM, does not change. There is no statistically
or practically significant difference in the proportion of market use after the effects of the
pandemic, as only two individual reports are known to change preferences and two
individual reports change to no preference reported (Table 34). With no statistically
significant difference between temporal periods, the majority preference for BAM to
purchase products in general remains the same.
Table 34. Q16:Q28 Net Changes of Preference
Q16 Q28 Net Change
BAM 38 34 -4
Online 23 25 2
N/A 0 2 2
Q16:Q28 Net Changes of Preference

88
Discussion
Research Questions
Research Question 1
In regard to a consensus market preference before the effects of the pandemic,
each product category demonstrates a consensus for a specific market. For apparel, a vast
majority of 46 (75.41%) respondents preferred BAM (H1). For electronics, a majority of
38 (62.30%) respondents preferred online retail (H2). For groceries, a vast majority of 52
(85.25%) respondents preferred BAM (H1). For general purchases, a majority of 38
(62.30%) respondents preferred BAM (H1).
Research Question 2
In regard to a consensus market preference after the effects of the pandemic, each
product category demonstrates a majority consensus for a specific market. For apparel, a
majority of 42 (68.85%) respondents prefer BAM (H1). For electronics, a majority of 39
(63.93%) respondents prefer online retail (H2). For groceries, a vast majority of 51
(83.61%) respondents prefer BAM (H1). For general purchases, a slim majority of 34
(55.74%) respondents prefer BAM (H1).
Research Question 3
In the analysis of a statistically significant difference in market preference
distribution between temporal periods (i.e., the analysis of market preference change after
the effects of the pandemic), only the market preference distribution for apparel
demonstrates a statistically significant difference between temporal periods, in which
there is a significant change in preference to reduce the disparity between BAM and
online retail; however, there is no practical change in consensus preference for any
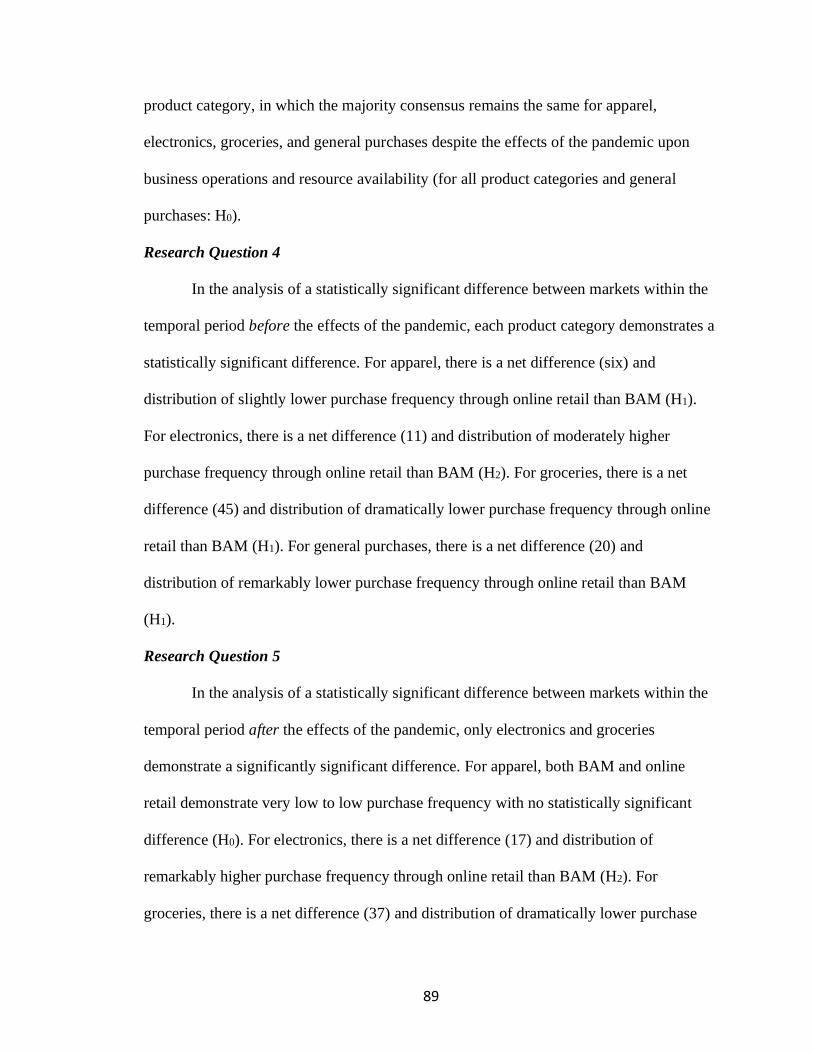
89
product category, in which the majority consensus remains the same for apparel,
electronics, groceries, and general purchases despite the effects of the pandemic upon
business operations and resource availability (for all product categories and general
purchases: H0).
Research Question 4
In the analysis of a statistically significant difference between markets within the
temporal period before the effects of the pandemic, each product category demonstrates a
statistically significant difference. For apparel, there is a net difference (six) and
distribution of slightly lower purchase frequency through online retail than BAM (H1).
For electronics, there is a net difference (11) and distribution of moderately higher
purchase frequency through online retail than BAM (H2). For groceries, there is a net
difference (45) and distribution of dramatically lower purchase frequency through online
retail than BAM (H1). For general purchases, there is a net difference (20) and
distribution of remarkably lower purchase frequency through online retail than BAM
(H1).
Research Question 5
In the analysis of a statistically significant difference between markets within the
temporal period after the effects of the pandemic, only electronics and groceries
demonstrate a significantly significant difference. For apparel, both BAM and online
retail demonstrate very low to low purchase frequency with no statistically significant
difference (H0). For electronics, there is a net difference (17) and distribution of
remarkably higher purchase frequency through online retail than BAM (H2). For
groceries, there is a net difference (37) and distribution of dramatically lower purchase

90
frequency (i.e., practically none) through online retail than BAM (H1). For general
purchases, both BAM and online retail demonstrate very low to moderate purchase
frequency with no statistically significant difference (H0).
Research Question 6
In the analysis of a statistically significant difference within markets between
temporal periods, there are four instances (of eight) that demonstrate a statistically
significant difference in purchase frequency distributions between temporal periods. For
apparel purchased through BAM, both distributions demonstrate very low to low
purchase frequency with no statistically significant difference (H0). For apparel
purchased through online retail, there is a net difference (seven) and distribution of
slightly higher purchase frequency after the effects of the pandemic (H1). For electronics
purchased through BAM, both distributions demonstrate very low to low purchase
frequency with no statistically significant difference (H0). For electronics purchased
through online retail, both distributions demonstrate very low (i.e., practically no) to
moderate purchase frequency with no statistically significant difference (H0). For
groceries purchased through BAM, both distributions demonstrate very high purchase
frequency with no statistically significant difference (H0). For groceries purchased
through online retail, there is a net difference (six) and spread of distribution into higher
ranks while retaining a majority reporting very low to no purchase frequency after the
effects of the pandemic (H2) (note: there is a statistically significant difference, but the
practical change is minimal). For general purchases transacted through BAM, there is a
remarkable net difference (16) and spread of distribution into lower ranks, forcing a skew
of ranks toward higher purchase frequencies (H2). For general purchases transacted

91
through online retail, there is a net difference (seven) and bidirectional spread of
distribution with an overall net increase of a minority from lower purchase frequencies
that creates a second, smaller peak in higher purchase frequencies (H1).
In the analysis of change in rank differences of purchase frequency between
markets and temporal periods, there are statistically significant differences for all product
categories. For apparel, there is a net difference (nine) and distribution of higher purchase
frequency through online retail than BAM after the effects of the pandemic than before
(H1). For electronics, there is a net difference (six) and distribution of slightly higher
purchase frequency through online retail than BAM after the effects of the pandemic than
before (H1). For groceries, there is a net difference (nine) and distribution of higher
purchase frequency through online retail than BAM after the effects of the pandemic than
before (H1). For general purchases, there is a net difference (20) and distribution of
remarkably higher purchase frequency through online retail than BAM after the effects of
the pandemic than before (H1).
Implications
The results of the survey suggest that the only broad product category of those
examined by this study that respondents prefer to purchase through online retail before
and after the effects of the global COVID-19 pandemic is electronics, and there are no
practical changes in respondents’ market preferences after the effects of the pandemic.
Despite the government mandates for health and safety protocols to restrict contagion that
have impacted business operations and resource availability, the sample’s consensus
market preferences have not changed, suggesting that most respondents have not been
influenced significantly by the effects of the pandemic to change preferences in

92
correspondence to adaptations to changes in customer requirements for a market;
furthermore, this implication suggests that any discrepancy in consensus market
preference and reported purchase frequency for a product category is not attributed to
change in customer requirements and market preference, rather it is attributed to
necessary adaptation to the effects of the pandemic to acquire products at a desired rate
(i.e., respondents were forced by necessity to alter the proportions of market use due to
the effects of the pandemic upon business operations and resource availability rather than
due to increased appeal of customer requirements and service of the less preferred
market).
With consideration that estimations of market use are predicted to be different for
each respondent, the proportions of market use before the effects of the pandemic are
different as expected. The only product category to demonstrate moderately higher
purchase frequency for online retail than BAM before the effects of the pandemic is
electronics, which is consistent with the sample’s consensus preference for electronics
(i.e., preference for online retail), suggesting that the majority of the sample desired
and/or prioritized the customer requirements and services offered by online retail for
electronics. There are a plethora of potential customer requirements and services through
online retail before the effects of the pandemic, especially if respondents consider digital
media a constituent of electronics, so those are likely consistent with literature, in which
online retail offers convenience for remote access to inventory, browsing products with
customer and professional reviews, remote orders of products/services for delivery of
tangible goods, instant gratification of digital-download purchases, automated customer
service options (e.g., telephone, e-mail, virtual assistants, etc.), simplified return policies,

93
e-coupons and sales, site subscriptions and entailed benefits (e.g., discounts, free
shipping, early access, etc.), and relative anonymity through the dissociation of personal
information and physical appearance. In regard to the purchase of electronics through
online retail before the effects of the pandemic specifically, respondents likely prioritized
the aforementioned customer requirements and considered them more convenient,
effective, and/or efficient than those entailed in purchases conducted through BAM; if
respondents consider digital media as electronics, then there is the factor of instant
gratification in digital purchases. If the collective customer requirements and services of
online retail are the causation of the consensus preference for online retail to purchase
electronics, than those in the minority (i.e., preference for BAM) likely prioritize the
local access to inventory relative to domicile, instant gratification of purchases,
consultation with employees, intuitive comparison of product features, tactile handling of
tangible objects, product demonstrations, instant gratification of returns (compared to
returns by shipping), local discounts and coupons (i.e., discounts on products localized to
specific BAM locations and coupons disseminated by postage or awarded through
purchases), and socialization offered by BAM for electronics purchases. Since the
consensus preference and estimated purchase frequency for electronics did not change
statistically or practically after the effects of the pandemic, the effects of the pandemic
appear to have had minimal to no influence on respondents’ consumer behaviors for
electronics in rate of purchases or prioritization as a necessity (i.e., respondents have
neither changed the rate at which they purchase electronics nor changed the importance
of electronics as a necessity; the effects of the pandemic have not significantly influenced
consumer behaviors for electronics in this sample). However, respondents have increased

94
their purchase frequency for electronics through online over BAM after the effects of the
pandemic (Q5Q6:Q17Q18), suggesting a statistically significant minority of the sample
has increased purchase frequency for electronics through online retail after the effects of
the pandemic, further implying that a minority of the sample has adapted to the effects of
the pandemic to rely more upon online retail to acquire electronics at the desired rate
without a majority of the sample changing purchase frequency.
With the consideration that two of the three product categories demonstrate a
consensus preference for BAM, the consensus preference for BAM to conduct general
purchases with a slim margin across both temporal periods is consistent with a
generalization of the other product categories; the implications of general purchases are
too broad to speculate customer requirements that are specific to products, so the lack of
statistically or practically significant difference in market preference between temporal
periods suggests that a majority of the sample still prioritizes traditional customer
requirements and services for purchases in general and that the effects of the pandemic
have had minimal to no influence on the customer requirements for general (i.e., all/total)
purchases in this sample. While customer requirements for general purchases appear not
to have changed or adapted on a significant scale due to a lack of change in consensus
preference for general purchases, there is a remarkable change in purchase frequency (20)
through online retail than BAM after the effects of the pandemic than before
(Q14Q15:Q26Q27), suggesting that a substantial proportion of the sample has adapted to
the effects of the pandemic to acquire products in general at the desired rate through
online retail rather than BAM while a majority has retained low to moderate purchase
frequency for general purchases through online retail and BAM.

95
While speculation of customer requirements and services specific to products is
minimal with general purchases, those that are likely causation for consensus market
preferences for apparel and groceries are more feasible to detect. The consensus market
preference for apparel was BAM before the pandemic, and, while the change was not
practically significant, a statistically significant minority of the sample has changed
preference to online retail after the effects of the pandemic. Furthermore, a statistically
significant minority of the sample has increased purchase frequency for apparel through
online retail over BAM after the effects of the pandemic than before (Q11Q12:Q23Q24),
suggesting a minority of the sample has relied more upon online retail to acquire apparel
at the desired rate. The consensus preference for BAM to purchase apparel and lower
purchase frequency for apparel through online retail before the effects of the pandemic
suggest that a majority of the sample preferred the customer requirements and services of
the capability to try on apparel for fit and aesthetic approval and instant gratification of
purchases and returns offered by BAM that are not possible through online retail, but a
minority of the sample has increased reliance upon online retail for apparel purchases due
to government mandates that prohibited the capability to try on apparel and reduced local
access to inventory due to mandates that have restricted customer occupancy sizes and
enforced social-distancing and mask requirements. Despite a minority that has adapted to
the effects of the pandemic, a majority of the sample still prefers BAM to purchase
apparel, and the purchase frequency for apparel across both markets and temporal periods
is very low to low.
As predicted due to customer requirements and consistency with literature, the
consensus market preference for groceries before the pandemic was BAM, but there is no

96
statistically or practically significant difference between temporal periods. Despite the
government mandates that have affected supermarkets and grocery stores comparably to
retail stores described in the preceding paragraph, the majority of the sample retains a
consensus preference for BAM to purchase groceries, suggesting the effects of the
pandemic have had minimal to no influence upon consumer habits for grocery purchases.
A minority of the sample has increased purchase frequency for groceries through online
retail after the effects of the pandemic than before, suggesting a minority of the sample
has adapted to the effects of the pandemic in order to acquire products at the desired rate
while retaining a majority that has very high purchase frequency for groceries through
BAM. Although supermarkets and grocery stores have begun to offer supplementary
services to deliver orders or prepare orders for pick-up by a customer or third party gig
services have arisen in recent years to facilitate pairing consumers with personal shoppers
who purchase and deliver groceries, the majority of the sample has and still prefers BAM
to purchase groceries, and the majority has higher purchase frequency for BAM than
online across both temporal periods, suggesting that a majority of the sample prioritizes
personal agency, intuitive comparison of foods and products, tactile handling of foods
and products, and instant gratification in purchases and returns when purchasing
groceries. Some respondents may have experimented with services utilizing online
platforms but were frustrated with the personal correspondence between customer and
personal shopper/store employee and/or disappointed with permitted substitutions or
unavailability of foods and products, thereby reinforcing customer requirements and
consumer habits prioritized for grocery purchases through BAM. Furthermore,
consumers within general populations that defy the representation within this sample may

97
have reacted to media reports about availability of foods and products and changes to
business operations at supermarkets and grocery stores by immediately adapting
consumer behaviors to increase reliance upon online retail to purchase groceries, creating
a dearth of food/product availability through online retail platforms that reinforces
reliance upon BAM as a more reliable, consistent market for food/product availability.
Despite the inconveniences of government mandates for business operations, the majority
of the sample still prefers and utilizes BAM more to purchase groceries because most
respondents prioritize customer requirements for BAM over online retail and product
availability for groceries has been more reliable and consistent than online platforms as a
moral, humanitarian imperative to guarantee local access to food and related products for
lower socioeconomic classes that may have restricted access to online retail and/or the
incapability to pay exorbitantly inflated prices or premiums for groceries online
(especially non-food products, e.g., toilet paper, isopropyl alcohol sanitizer, etc.). The
sample consists of college-educated adults who required access to the Internet to
participate in the survey, so the sample appears not to have experienced restricted access
to the Internet, but that assumption cannot suggest how participants had access to the
Internet, whether privately or publicly; considering the majority of the sample is 18-25
years old and has high school or an equivalent as the highest level of education
completed, there is a possibility that some individuals do not have private access to the
Internet due to cost, thereby requiring use of public access to Internet (e.g., WKU’s
campus). Nevertheless, there is still a minority of the sample that has increased reliance
on online retail (Q8Q9:Q20Q21), suggesting a minority of the sample has adapted to the
effects of pandemic by increasing purchase frequency of groceries through online retail to

98
acquire foods and related products at the desired rate, perhaps due to personal perception
of low food/product availability at local BAM or due to necessity from the reality of low
food/product availability at local BAM and/or the new inconvenience of local access
through BAM.
Conclusion
The results of the survey suggest that consensus market preferences have not changed
after the systemic effects of the pandemic upon societal operation (particularly business
operations and resource availability), the only product category to feature a consensus
market preference for online retail before and after the effects of the pandemic is
electronics, the consensus market preference for general purchases before and after the
effects is BAM, and purchase frequency through online retail for all product categories
and general purchases has increased for a minority of the sample after the effects of the
pandemic, suggesting only a minority of the sample for any given product category or
general purchases has been influenced significantly by the effects of the pandemic to
adapt consumer behaviors for proportion of market use, purchase frequency, and
prioritized customer requirements through increased reliance upon online retail to ensure
acquisition of products at a desired rate.
This study investigates subjective estimations of purchase frequency and, by
comparison of the reported purchase frequency estimations for each market type,
proportions of market use relative to market preference, thereby requiring nonparametric
descriptive statistics and net differences of rank and preference to assess statistically
significant differences between markets and/or changes between temporal periods. Thus,
future studies exploring similar changes in consumer behaviors due to the global

99
pandemic should utilize quantitative measurements and metrics and, when applicable,
parametric tests to acquire more objective and specific estimations for purchase
frequency and proportions of market use. The intent of this study is to investigate a
relative scale of difference between markets and change between temporal periods to
assess the potential evolution of consumer behaviors in an increasing trend toward a
greater preference, utilization, and reliance upon online retail after research literature
throughout 2020 indicated that the global COVID-19 pandemic has stressed societal
operations to near failure due to the lack of extant contingencies to adapt operations in
the event of global catastrophe, such as the social-distancing and ancillary/collateral
adaptations of the global pandemic. The study does not investigate the potential influence
of the systemic effects of the pandemic on purchase volume and, therefore, does not
indicate differences in the volume of products purchased through a market type, changes
in the volume of products purchased between temporal periods, or the proportion of
market utilization by purchase volume, rather the study can merely suggest a
difference/change in purchase volume for a given time frame if there is a
difference/change in purchase frequency for the same time frame; thus, future studies are
recommended to investigate differences between markets and changes between temporal
periods for purchase volume, especially those with more empirical research designs,
quantitative data, and parametric statistical analyses when applicable. Any future study is
recommended to acquire a significantly larger sample size to increase power and validity
of statistical analyses for the entire sample and to allow meaningful statistical analyses
for demographics variables with adequate power and validity.
100
References
Betsch, C., Korn, L., Sprengholz, P., Felgendreff, L., Eitze, S., Schmid, P., & Bӧhm, R.
(2020). Social and behavioral consequences of mask policies during the COVID-
19 pandemic. Proceedings of the National Academy of Sciences, 117(36): 21851-
21853.
Chiang, K. P., & Dholakia, R. R. (2003). Factors driving consumer intention to shop
online: an empirical investigation. Journal of Consumer Psychology, 13(1&2),
177-183.
Creswell, J. W. (2014). Research design: qualitative, quantitative, and mixed methods
approaches (4th ed.). Thousand Oaks, CA: SAGE Publications, Inc.
Duygun, A., & Şen, E. (2020). Evaluation of consumer purchasing behaviors in the
COVID-19 pandemic period in the context of Maslow’s hierarchy of needs.
Pazarlam Teorisi ve Uygulamalari Dergisi, 6(1): 45-68.
Hoenig, K., & Wenz, S. E. (2020). Education, health behavior, and working conditions
during the pandemic: Evidence from a German sample. European Societies, 22:
1-14.
Jeżewska-Zychowicz, M., Plichta, M., & Królak, M. (2020). Consumers’ fears regarding
food availability and purchasing behaviors during the COVID-19 pandemic: The
importance of trust and perceived stress. Nutrients, 12(9): 1-14.
Karim, R. A. (2013). Customer satisfaction in online shopping: a study into the reasons
for motivations and inhibitions. IOSR Journal of Business and Management,
11(6), 13-20.

101
Kaur, K., Kunasegaran, M., Singh, J., Salome, S., & Sandhu, S. K. (2020). Impact of the
first phase of movement order control during the COVID-19 pandemic in
Malaysia on purchasing behavior of Malaysian consumers. Journal of Humanities
and Social Sciences, 2(S): 131-144.
Kukar-Kinney, M., Scheinbaum, A. C., & Schaeffers, T. (2016). Compulsive buying in
online daily deal settings: an investigation of motivations and contextual
elements. Journal of Business Research, 69(2), 691-699.
Laato, S., Najmul Islam, A. K. M., Farooq, A., & Dhir, A. (2020). Unusual purchasing
behavior during the early stages of the COVID-19 pandemic: The stimulus-
organism-response approach. Journal of Retailing and Consumer Services, 57: 1-
12.
Larson, L. R. L., & Shin, H. (2018). Fear during natural disaster: Its impact on
perceptions of shopping convenience and shopping behavior. Services Marketing
Quarterly, 39(4): 293-309.
Liu, F., Xiao, B., Lim, E., & Tan, C. (2017). The art of appeal in electronic commerce:
understanding the impact of product and website quality on online purchases.
Internet Research, 27(4), 752-771.
Neger, M., & Uddin, B. (2020). Factors affecting consumers’ internet shopping behavior
during the COVID-19 pandemic: evidence from Bangladesh. Chinese Business
Review, 19(3): 91-104.
Nguyen, N. P. T., Hoang T. D., Tran, V. T., Vu, C. T., Fodjo, J. N. S., Colebunders, R.,
Dunne, M. P., & Vo, T. V. (2020). Preventative behavior of Vietnamese people in
response to the COVID-19 pandemic. PLoS Currents, 15(9): 1-11.

102
Pappas, I. O., Kourouthanassis, P. E., Giannakos, M. N., & Lekakos G. (2017). The
interplay of online shopping motivations and experiential factors on personalized
e-commerce: a complexity theory approach. Telematics and Informatics, 34, 730-
742.
Parlapani, E., Holeva, V., Voitsidis, P., Blekas, A., Gliatas, I., Porfyri, G. N., Golemis,
A., Papadopoulou, K., Dimitriadou, A., Chatzigeorgiou, A. F., Bairachtari, V.,
Patsiala, S., Skoupra, M., Papigkioti, K., Kafetzopoulou, C., & Diakogiannis, I.
(2020). Psychological and behavioral responses to the COVID-19 pandemic in
Greece. Frontiers in Psychiatry, 11(821): 1-17.
Petre, M., Minocha, S., & Roberts, D. (2006). Usability beyond the website: an
empirically-grounded e-commerce evaluation instrument for the total customer
experience. Behaviour & Information Technology, 25(2), 189-203.
Sheth, J. (2020). Impact of Covid-19 on consumer behavior: Will the old habits return or
die? Journal of Business Research, 117: 280-283.
Teng-Calleja, M., Caringal-Go, J. F., Manaois, J. O., Isidro, M. Q., & Zantua, R. M. S.
(2020). Examining organizational response and employee coping behaviors amid
the COVID-19 pandemic. The Journal of Behavioral Science, 3: 34-50.
Wachyuni, S. S., & Kusumaningrum, D. A. (2020). The effect of COVID-19 pandemic:
How are the future tourist behavior? Journal of Education, Society and
Behavioural Science, 33(4): 67-76.
Wang, E., An, N., Gao, Z., Kiprop, E., & Geng, X. (2020). Consumer food stockpiling
behavior and willingness to pay for food reserves in COVID-19. Food Security,
12(1): 1-9.