change the way we change - bombay stock exchangethat’s why we need to change the way we change....
TRANSCRIPT

CHANGETHE WAY WE CHANGE

TRULY,
CHANGE HAS CHANGED.
ARE WE CHANGING
AS FAST AS THE WORLD
AROUND US ?
THAT’S WHY WE NEED TO CHANGE THE WAY WE CHANGE.
CHANGING THE WAY WE CHANGE
We are surrounded by all sorts of things that are
changing at an exponential pace: the number of
mobile phones in the world, CO2 emissions, data
storage; the power of semiconductor chips, the
number of devices connected to the internet, the
number of genes that have been sequenced,
world energy consumption, and knowledge
itself.
We live in a world that seems to be all
punctuations and no equilibrium, where the
future is less and less an extrapolation of the past.
Change is multifaceted, relentless, seditious, and
occasionally shocking. In this maelstrom, long-
lived political dynasties, venerable institutions,
and hundred-year-old business models are all at
risk.
Today, the most important question for any
organization is this:
Most CEOs would have to answer ‘’No.” In Industry after industry, it’s the insurgents, not the incumbents, who’ve been
surfing the ways of change.
Given all this, the only thing that can be safely predicted is that sometime soon your organization will be challenged to
change in ways for which it has no precedent. Of course, change brings both promise and peril, but the proportion facing
any particular organization depends on its capacity to adapt. And therein lies the problem : our organizations were never
built to be adaptable. In large global companies, as in poorly governed dictatorships, deep change occurs belatedly and
convulsively. They ultimately require regime change and turnaround. A turnaround is a poor substitute for
a transformation.
We took our first steps to respond to the required pace of change in fiscal 2012. Among the key steps taken in both
Silvassa and Vapi facilities - We automated our dye house, made changes to our yarn manufacturing, revised material
movement and flow, installed equipments to reduce power consumption etc.

Board of Directors:
MADHUSUDAN JHUNJHUNWALA Chairman & Whole-Time DirectorKRISHNAKUMAR M. JHUNJHUNWALA Managing DirectorARUN VAID DirectorJIGAR A SHAH Director ANIL KUMAR JAIN Director
ARUN VAID Chairman
MADHUSUDAN JHUNJHUNWALA Member
JIGAR A SHAH Member
Audit Committee:
Chief Financial Officer & Company Secretary:
MAHENDRA SHETH
Auditors:
M/s. Sundarlal, Desai & Kanodia, Chartered Accountants, Mumbai
ANDHRA BANK CITIBANK N. A. DBS BANK LTD. STANDARD CHARTERED BANK YES BANK LTD.
Bankers:
Registered Office:
Survey No. 59/1/4, Amli Piparia Industrial Estate, Silvassa - 396 230, U.T. of Dadra & Nagar Haveli
1) Survey No. 59/1/4, Amli Piparia Industrial Estate, Silvassa - 396 230, U.T. of Dadra & Nagar Haveli
2) Survey No. 64/2/3/4,61/2, 62/5,63/5,63/7, Amli Piparia Industrial Estate, Silvassa - 396 230,
U.T. of Dadra & Nagar Haveli
3) Shed No. A1/48, 100 Sheds Area, GIDC, VAPI - 396 195.
Plants:
Corporate Office:
304, Arcadia, Nariman Point, Mumbai – 400 021.
Website:
www.sarlafibers.com
Registrars & Transfer Agents:
M/s. Sharex Dynamic (India) Pvt. Ltd.,Unit - 1, Luthra Ind. Premises, Safed Pool, Andheri Kurla Road, Andheri (E), Mumbai - 400 072.
C O N T E N T S :Board of Directors 01
Performance at a Glance 08
From the Desk of Managing Director 09
Directors Report 10
Corporate Governance Report 18
Auditors Report 24
Investors services e-mail id:
Balance Sheet 25
Profit and Loss Account 26
Cash Flow Statement 27
Notes to Balance Sheet 28
Consolidated Financial Statement 43
Notice 59
1

Some of the key changes
which we carried out in our operation are as under:
AUTOMATED CHEMICAL WEIGHING AND
DISPENSING SYSTEM Each recipe has a bar code signifying which chemicals are to be weighed and
delivered to the dye machine. The operator scans the barcode and the system
will automatically weigh and send to the dye machine. This ensures
the correct chemicals are weighed and sent to
the machine for improved batch to batch
repeatability. This will result in reduction in
wastage, savings in cost of dyes & chemicals, less
rejections by customers.
COMPUTERIZED DYE WEIGHING SYSTEMAfter the weighing and dispensing of the chemicals has been
completed the barcode on the recipe is again scanned in the dye
weighing kitchen. This assures that each dye is correctly weighed.
If too much or too little dye is weighed the system will not go to the
next dye or process. This ensures accuracy of the batch as well as
batch to batch repeatability.
2
FY 2011-12

DYE HOUSE
EXPANSION AND MACHINE REALIGNMENTThe dye house has undergone a major expansion with the addition of
dyeing equipment increasing the dyeing capacity 50%. With the expansion
now complete the operation is in a position to give our customers various dye
lot sizes to meet their requirements. Because of this expansion the dye
machines were repositioned to reduce movement of raw and dyed material to
improve machine efficiencies and reduce the time for the movement of material
in loading and unloading the machines.
ADDITION OF RF DRYERTo improve the feel of the yarn a decision was taken
to install an RF dryer for drying the yarn after the
dyeing process. The yarn is hydro extracted and
then dried in the RF dryer to ensure the product is
properly dried.
MATERIAL STORAGE AND MOVEMENTWith the renovation of the Vapi dyeing operations the movement and storage of material
was reviewed with the intent to reduce movement and simplify the movement of material.
Wheeled crates were designed in house using expended chemicals totes. Since the
implementation, material movement and material storage has been reduced by 50% as
compared to the previous handling system.
We now accept the fact that learning
is a lifelong process of keeping
abreast of change. And the most
pressing task is to teach people
how to learn.
3

EXPANSION OF
NYLON WINDING DEPARTMENTA major expansion is now complete for segregating the
winding of yarns by the products. Nylon and Polyester
products are now wound in different locations ensuring
proper winding of the various products supplied to
customers.
POLYESTER WINDING
NYLON WINDING
INSPECTION, PACKING & AUTOMATED TAPEING MACHINEInspection and packaging has been realigned to segregate products by yarn type
for inspecting and passing of the material. This ensures the quality of the products
meets the customer requirements
Innovation is the specific instrument
of entrepreneurship...
the act that endows resources with
a new capacity to create wealth.
4

AUTOMATED SYSTEM FOR
LOADING OF NYLON HANK (MUFF)
MATERIALAn automated conveyor system has been installed to reduce the
handling of nylon muffs for loading of the dye basket. When the
hank is put on the conveyor a sensor acknowledges and counts
the hank thus ensuring the correct number of hanks are loaded
into the dye basket for determining the weight of the dye basket
thus ensuring the KDA dye weighing system will weigh the proper
amount of dyes reducing if not eliminating the chance of any
reworks.
SHIFTING OF REELING MACHINES FROM SILVASSA
OPERATION TO DYEHOUSETo reduce the cost of transportation of nylon material from the factories in Silvassa to the Vapi
dyehouse the machines for winding of nylon yarn were shifted to the Vapi operations.
This implementation has reduced the number of trips required to move the nylon material by 50%.
LOW TWIST HIGH SPEED TWISTING MACHINES FOR
SEWING THREADSWith technology continuously changing twisters were installed to improve the performance and
cost of our sewing thread twisted products. With commissioning of these machines the production
capacity has increased by 100% while only installing half of the machines that would have been
required by past technology.
ECO FRIENDLY STEAM BOILERSay to reduce the dependence on fossil fuels a new boiler has been
installed and is being commisioned which will use a bio-degradable
fuel source for supplying power for the vapi dyeing operations. With
the start up of this boiler there will be no release of sulphers into the
atmosphere as with the burning of fossil fuels.
5

2002Expanded product portfolio to sewing thread from commodity polyester yarns.
2004Established 2ndmanufacturing unit in Silvassa.
2006lA change in the company’s name from Sarla Polyester Limited to Sarla Performance Fibers Limited (SPFL).
lEstablished its 1st joint venture overseas in Honduras, Central America under the name Savitex S.A. de C.V.
lSet up a spinning plant for conversion of nylon chips into high tenacity nylon 6 and nylon 66 industrial yarns.
6
DELIVERING VALUE OVER A DECADE(Rs. in Crores)
Debt-Equity Ratio
Long Term Debt-Equity Ratio
Current Ratio
Turnover Ratios
Fixed Assets Ratio
Inventory Ratio
Debtors Ratio
Interest Cover Ratio
PBIDTM (%)
PBITM (%)
PBDTM (%)
ROCE (%)
RONW (%)
Debtors Velocity (Days)
Creditors Velocity (Days)
0.71
0.17
1.42
1.83
5.45
2.82
2.27
13.32
10.81
8.55
11.17
7.84
57.00
34.00
KEY RATIOS 2002 03 2003 03 2004 03 2005 03
0.54
0.11
1.37
2.78
8.61
4.79
6.15
16.32
13.90
14.06
23.97
23.55
55.00
34.00
0.43
0.05
1.08
2.26
7.60
4.96
9.55
18.40
16.17
16.71
28.90
30.66
57.00
36.00
0.47
0.05
0.98
1.98
7.35
4.99
11.32
22.01
18.77
20.36
31.28
33.57
59.00
52.00
Equity Paid Up
Networth
Capital Employed
Gross Block
Net Working Capital
Net Sales
6.95
16.25
27.16
16.33
13.94
29.59
PROFIT & LOSS AND BALANCE SHEET 2002 03 2003 03 2004 03 2005 03
6.95
20.53
29.41
18.65
14.18
48.43
6.95
25.78
36.79
33.69
8.06
55.22
6.95
33.92
50.84
39.91
14.84
70.28
3.58 7.94 10.87 16.07Profit before Interest, Deprication, Tax
1.06 4.33 7.10 10.02Profit after Tax
23.38 29.54 37.09 48.81Book Value (Rs./Share)
4.87 6.29 11.33 43.79Market Capitalisation
1.53
0.00
0.00
0.00
6.23
0.00
0.00
0.00
9.91
24.00
1.67
24.24
14.09
24.00
1.67
17.06
Earning Per Share (Rs.)
Dividend (%)
Payout
Payout (%)
2007lCreated Sarla Overseas Holdings Limited (SOHL),a wholly owned subsidiary as a separate investment arm for the company.
lThe company’s shares were listed on the National Stock Exchange of India Limited (NSE).
lExpanded production capacities in Silvassa.
2005“BEST EXPORT UNIT AWARD”By Export Promotion Council-2005.
7
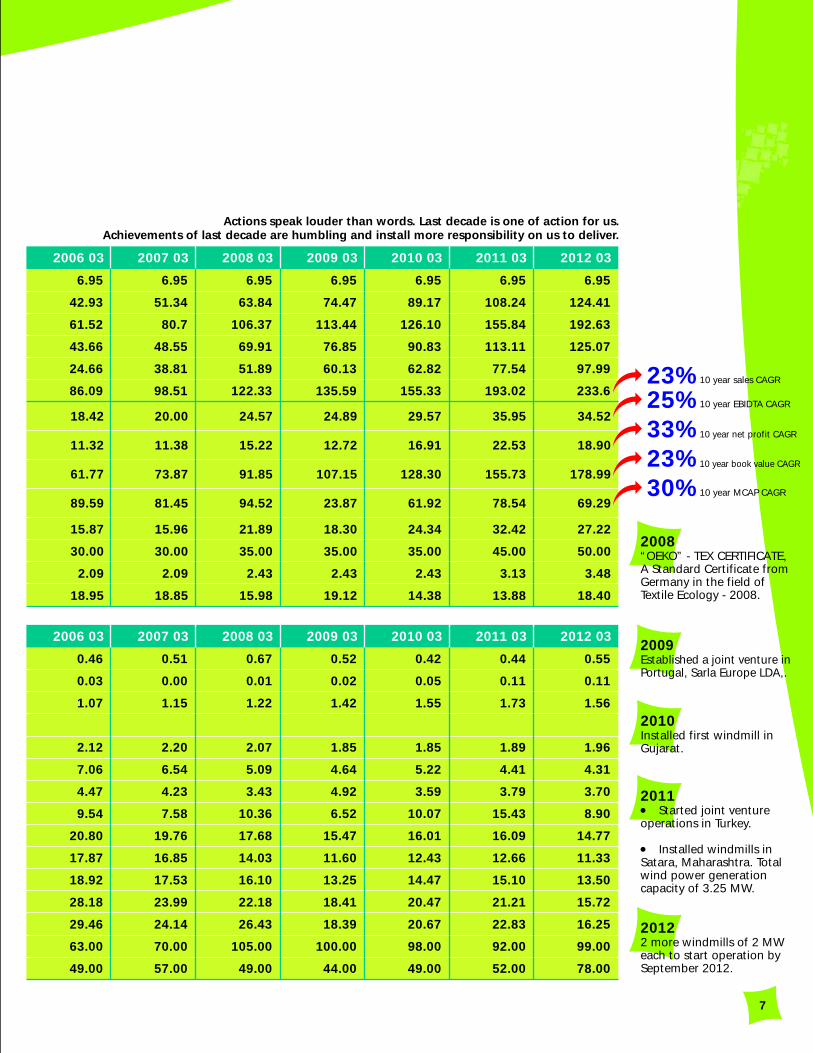
Actions speak louder than words. Last decade is one of action for us.Achievements of last decade are humbling and install more responsibility on us to deliver.
2009Established a joint venture in Portugal, Sarla Europe LDA,.
2011lStarted joint venture operations in Turkey.
lInstalled windmills in Satara, Maharashtra. Total wind power generation capacity of 3.25 MW.
20122 more windmills of 2 MW each to start operation by September 2012.
2012 032011 032010 032009 032008 032007 032006 03
0.52
0.02
1.42
1.85
4.64
4.92
6.52
15.47
11.60
13.25
18.41
18.39
100.00
44.00
0.42
0.05
1.55
1.85
5.22
3.59
10.07
16.01
12.43
14.47
20.47
20.67
98.00
49.00
0.44
0.11
1.73
1.89
4.41
3.79
15.43
16.09
12.66
15.10
21.21
22.83
92.00
52.00
0.55
0.11
1.56
1.96
4.31
3.70
8.90
14.77
11.33
13.50
15.72
16.25
99.00
78.00
0.46
0.03
1.07
2.12
7.06
4.47
9.54
20.80
17.87
18.92
28.18
29.46
63.00
49.00
0.51
0.00
1.15
2.20
6.54
4.23
7.58
19.76
16.85
17.53
23.99
24.14
70.00
57.00
0.67
0.01
1.22
2.07
5.09
3.43
10.36
17.68
14.03
16.10
22.18
26.43
105.00
49.00
2012 032011 032010 032009 032008 032007 032006 03
6.95
74.47
113.44
76.85
60.13
135.59
6.95
89.17
126.10
90.83
62.82
155.33
6.95
108.24
155.84
113.11
77.54
193.02
6.95
124.41
192.63
125.07
97.99
233.6
6.95
42.93
61.52
43.66
24.66
86.09
6.95
51.34
80.7
48.55
38.81
98.51
6.95
63.84
106.37
69.91
51.89
122.33
18.30
35.00
2.43
19.12
24.34
35.00
2.43
14.38
32.42
45.00
3.13
13.88
27.22
50.00
3.48
18.40
15.87
30.00
2.09
18.95
15.96
30.00
2.09
18.85
21.89
35.00
2.43
15.98
24.89 29.57 35.95 34.5218.42 20.00 24.57
12.72 16.91 22.53 18.9011.32 11.38 15.22
107.15 128.30 155.73 178.9961.77 73.87 91.85
23.87 61.92 78.54 69.2989.59 81.45 94.52
23%10 year EBIDTA CAGR25%10 year net profit CAGR33%10 year book value CAGR23%10 year MCAP CAGR30%
10 year sales CAGR
2010Installed first windmill in Gujarat.
2008“OEKO” - TEX CERTIFICATE,A Standard Certificate from Germany in the field of Textile Ecology - 2008.

PERFORMANCE AT A GLANCE
100
80
60
20
0
Rs.
Cro
res
March ‘12March ‘11March ‘10March ‘09March ‘08
40
94.52
23.87
61.92
78.54
69.29
MARKET CAPITALISATION
250
200
150
50
0
NET S
ALE
S -
Rs.
Cro
res
March ‘12March ‘11March ‘10March ‘09March ‘08
122.33135.59
155.33
193.02
100
233.60
SALES
200
150
50
0
Bo
ok V
alu
e -
Rs.
Per
Sh
are
March ‘12March ‘11March ‘10March ‘09March ‘08
100 91.85107.15
128.30
155.73
178.99
BOOK VALUE
40
30
10
0
PB
IDT -
Rs.
Cro
res
March ‘12March ‘11March ‘10March ‘09March ‘08
20
EBIDTA
24.57 24.89
29.57
35.95 35.90
25
20
15
5
0
Net
Pro
fit
- Rs.
Cro
res
March ‘12March ‘11March ‘10March ‘09March ‘08
10
NET PROFIT
15.22
12.72
16.91
22.53
18.90
8
20
15
5
0
(%)
March ‘12March ‘11March ‘10March ‘09March ‘08
10
15.98
19.12
14.38 13.88
18.40
DIVIDEND PAYOUT (%)

9CHANGE THE WAY WE CHANGE
Dear Shareholders,
“In our hearts, we know the future cannot be an extrapolation of the past. As the great-grandchildren of the industrial revolution, we have learned, at long last, that the heedless pursuit of more is unsustainable and ultimately unfulfilling. Our planet, our security, our sense of equanimity, and our very souls demand something better, something different.”
This year’s cover page theme of the annual report is nothing but thought provoking. I wish I had an answer in YES to the question ‘are we changing as fast as the world around us’ ! However, I am glad that we are at least moving in that direction. Throughout my communication and within this annual report we wish to convey how
Our value system is clear; focus on customer and rest will fall in place. Last year, I discussed about doing a ‘sensible growth’. Before I discuss our company in specific for the year gone by I want to touch upon the issue of big debate globally which is - value deficit ! The worst economic crisis since the 1930s wasn’t a banking crisis, a credit crisis, or a mortgage crisis - it was a moral crisis, willful negligence. And why blame the west alone, we saw it in India in past two years, more than at any other time ! Every institution rests on moral footings, and there is no force that can erode those foundations more rapidly than a cataract of self-interest.
Fortunately for us the happiness lies not in the mere possession of money; it lies in the joy of achievement, in the thrill of creative effort. This is our biggest strength as an organization which will help us in becoming adaptable to challenges posed by customers in the future because our attention is fully focused on them. We are not taking off our attention on long term goals to attain short term goals.
Satisfactory performance given global adversity. I am pleased to review the fiscal 2012 performance of your company. We delivered a 21% revenue growth and entered the Rs.2bn revenue club, in just 4 years after our first billion rupees of revenue. Our EBIDTA would have been higher than Rs.34 crores (slightly below Fiscal 2011) but for the exceptional FX loss and abnormal rise in the power and fuel cost. I draw your attention to per kg spread on product sold rather than focusing on the EBIDTA margin because EBIDTA margin percentage will fluctuate with change in RM prices. Our spread per kg has remained in the range of Rs.45 - Rs.48 per kg which is our constant area of focus. Overall, the return on capital employed at 16% still remains satisfactory. The lower net profit was mainly due to increased cost of interest, depreciation and tax. However, a robust underlying performance of your company prompted the board to consider a 5% higher dividend compared to last year. Our dividend pay-out will be now a healthy 36% vs 29% last year (on standalone basis).
Focus on repeat business from large customers; productivity led growth. Our growth in fiscal 2012 is attributable to focus towards repeat business from large customers. Some of our large customers reposed faith in us for supply of high quality raw white, dyed, and high tenacity nylon/polyester yarns. Most of the revenue growth came from volume increase and we expect it to remain that
WE ARE ‘DELIVERING VALUE’ TO ALL STAKEHOLDERS.
way in the current year too.
On the production front, our team has been doing a commendable job in improving efficiencies, though it is always a continuous process.
I am particularly glad about reducing wastages in the Nylon’6 product which is helping us increase production. By the end of this fiscal, we shall also put in place a higher quality product within our Nylon yarn segment due to installation of new equipments and processes. We have begun serious efforts to improve manpower productivity through training and processes which will help us in increasing both employee and customer satisfaction over the medium to long term (for more details on this please refer our special section - changing the way we change !).
Profitable wind power business. When we first invested in the wind power two years back, we remained skeptical if it was a good decision from a point of view of capital allocation. However, now our pay-off has begun. Our income from wind power increased by three times in fiscal 2012 vs fiscal 2011 due to increased utilization of our wind turbines and sale of renewable energy certificates. So far, our returns on investment in the wind power business are encouraging. We are evaluating more investment into this activity from the strong cash profits generated by yarn business where CAPEX requirements are not too challenging.
Encouraging start to FY13. The fiscal 2013 has begun on a good note for us. The sharp depreciation of INR vs the US$ is a positive for exporters like us. Notwithstanding the rupee depreciation, our volume growth too is robust due to strong demand from customers in US, Asia and Africa. Unlike the 2008 crisis period when we had sharp pressure on revenue and profitability, we believe the present European crisis period has not been troublesome for us.
Consistent growth in book value, dividends. The investor mood on textile sector and mid/small companies continued to remain sober and we are no exception. However, the growth in our book value over the past 5 years is noteworthy vis a vis our market value (178.99 vs 99.70). We have also been consistently one of the high yielding stocks, quoting between 4-5% yield (dividend yield on BSE Sensex stocks is 2%).
will require a shift in aspirations, behaviors, and management systems. Building a truly adaptable company is a lot of work. I hope to return to you next year with an strongly affirmative reply to the cover page theme of this year “ Are we changing as fast as the world around us” !
Till then, wish you all the very best.
KRISHNAKUMAR JHUNJHUNWALA
(MD and CEO)
CHANGING THE WAY WE CHANGE
From The Desk of
MANAGING DIRECTOR

SARLA PERFORMANCE FIBERS LIMITED
3. MANAGEMENT DISCUSSION & ANALYSIS
This section of the Directors’ Report has been included in adherence
to the spirit enunciated in the Code of Corporate Governance
approved by the Securities and Exchange Board of India.
Shareholders are cautioned that certain data and information
external to the Company is included in this section. Though these
data and information are based on sources believed to be reliable,
no representation is made on their accuracy or comprehensiveness.
Further, though utmost care has been taken to ensure that the
opinions expressed by the management herein contain their
perceptions on most of the important trends having a material
impact on the Company’s operations, no representation is made
that the following presents an exhaustive coverage on and of all
issues related to the same. The opinions expressed by the
management may contain certain forward looking statements in
the current scenario, which is extremely dynamic and increasingly
fraught with risks and uncertainties. Actual results, performances,
achievements or sequence of events may be materially different
from the views expressed herein. Shareholders are hence cautioned
not to place undue reliance on these statements, and are advised to
conduct their own investigation and analysis of the information
contained or referred to in this section before taking any action
with regard to their own specific objectives. Further, the discussion
following herein reflects the perceptions on major issues as on date
(Rs. in Lacs)
18,349.98
2,523.52
973.84
1,549.68
265.23
200.25
1,084.20
—
4,407.56
8.32
5,500.08
300.00
347.52
56.38
4,796.18
15,993.54
2,500.91
771.11
1,729.79
220.00
269.12
1,240.67
—
3,831.60
—
5,072.27
300.00
312.76
51.95
4,407.56
2011-12 2010-11
269.69
704.15
184.66
586.45
An adaptable company will be more proactive in
responding to emerging customer needs. It will take
the lead ion redefining customer expectations in
positive ways. The result: higher levels of customer
loyalty and better margins.
10
DIRECTORS’ REPORT
To,
The Members,
Your Directors have pleasure in presenting their Nineteenth Annual
Report on the business and operations of the Company together
with Audited statement of Accounts for the year ended 31st March,
2012.
1. FINANCIAL RESULTS
2. BUSINESS PERFORMANCE
Your directors are pleased to report performance of the Business
operations as follows:
OPERATIONS
During the year under review the sales of the Company were
Rs.18,205.72 Lacs as against Rs.15,868.70 Lacs in 2010-11
registering an annual growth of 14.73%. The FOB value of exports
increased by 28.29% from Rs.8,106.11 Lacs to Rs.10,398.97 Lacs .
PROFITABILITY
The profit before Depreciation, Interest & Tax was Rs.2,523.52 Lacs
as compared to Rs.2,500.91 Lacs in the previous year. After
providing for depreciation of Rs.704.15 Lacs (Previous Year
Rs.586.45 Lacs) & provision for taxation of Rs.465.48 Lacs (Previous
Year Rs.489.37 Lacs), there was a net profit of Rs.1084.20 as
compared to Rs.1,240.67 Lacs in the Previous Year.
DIVIDEND
Your Directors have pleasure in recommending dividend @ 50% for
the year ended 31st March 2012. We have increased the rate of
dividend and increased the pay out ratio to 36% from 29% in
previous year as a result of our confidence on long term prospects
of your company and shareholder value creation.
Total Income
Profit before Financial Charges and Depreciation
Less: Financial Charges
Depreciation
Profit before Tax
Less: Provision for Tax
Provision for Deferred Tax
Profit after Tax
Prior period Adjustments
Balance brought forward
Excess Provision of Income Tax of earlier years
Surplus available for appropriation
APPROPRIATION
Transfer to the General Reserve
Dividend @ 50% (P.Y. 45%)
Dividend Tax
Balance carried forwarded to the Balance Sheet
Particulars

11
and the opinions expressed here are subject to change without
notice. The company undertakes no obligation to publicly update
or revise any of the opinions or forward-looking statements
expressed in this section, consequent to new information, future
events, or otherwise.
A. Business at a Glance
Economy: The Indian economy is reeling under the pressure of
twin deficits i.e. high current account deficit and fiscal deficit. The
growth rate of GDP is down to 6.9% for FY12 and fell to the worst of
5.3% in the past 7 years during Q4FY12. There are many obvious
and hidden factors causing this systematic deceleration of growth
in the Indian economy. The myth of India & China’s decoupling from
the crisis in west has been busted. Globally, too, growth rate in US is
just crawling near 2% and Europe is on the brink of a recession.
However, time and again such a crisis results into increased out
sourcing by global corporations as their focus shifts to cost savings.
With the rupee depreciating by 20% in the past one year we are in a
more competitive position as a country and as a company. Also, a
loose monetary policy in India for the next one and a half to two
years should be positive for our cost of funds.
Business Overview: Sarla Performance Fibers Limited, is one of
the well established and niche companies exporting regular as well
as High Tenacity Polyester and Nylon Yarns. It started its operations
18 years back as a commodity manufacturer of Man Made Fiber.
However, in the last five years, it has successfully transformed its
business strategy and implemented a niche business model.
B. Opportunities and Threats:
The textile sector exports amounted to approximately Rs1.6tn in
FY12 , a growth of 12% per year for the past 5 years. Textile exports
now form 11% of India’s total exports.
For FY12, the growth in textile exports was driven ready made
garment, and man made fibers. In case of cotton, it was more
about the increase in demand for raw cotton. Growth in other
segments like cotton, jute and handloom continued to suffer.
Basically, India’s textile exports lack cost competitiveness both in
terms of labor and power/other infrastructure.
It has an installed capacity of 11900 tons per annum for
manufacturing yarns in Silvassa and 3200 tons per annum for a
Dyeing unit at Vapi. Besides this the company has a capacity of over
1200 tons through joint venture and subsidiary companies
overseas. The company’s emphasis has been to focus on niche end
user applications, higher value added yarns to leading global
apparel brands and companies. While it still manufactures some
commodity yarns, the major focus has been in the area of
Performance Fibers. The company exports to over 50 countries a
wide range of yarns used in Innerwear, Narrow Fabrics, Hosiery and
Sports wear. This segment contributes 44% of our revenue.
Two years back, we also started the business of wind power
generation by installing 3.25 MW of wind turbines in Gujarat and
Maharashtra. Our plant load factor for the fiscal year 2012 ranged
between 21% and 23%. Apart from enjoying better selling price of
power, we also benefitted from the sale of renewable energy
certificates. We evaluate opportunity to set up more wind turbines
from time to time.
Customer Segments and Growth: The company’s customer
segments can be divided into three parts.
1) Innerwear, Narrow Fabrics, Hosiery and Sportswear
2) Threads
3) Industrial Yarns
Of the above segments we witnessed higher demand in Threads
and Industrial Yarns segments for the fiscal year 2012.
(% of Total Sales)Segment Break-up
Innerwear, Narrow Fabrics, Hosiery and Sportswear
Threads
Industrial Yarns
Commodities
43.51
20.93
13.30
22.26
100.00
44.73
18.29
10.52
26.46
100.00
Particulars FY 2011-12 FY 2010-11
(% of Total Sales)Geographical Break-up
South, North & Central America
Middle East & Europe
Africa
Asia Pacific
31.10
51.82
4.80
12.28
100.00
13.73
32.81
2.22
51.24
100.00
Region FY 2011-12 FY 2010-11
In all, we export to over 50 countries and about 100 customers. Our customer concentration is well distributed and no one customer exceeds more than13.57% of our revenue.
CHANGE THE WAY WE CHANGE

power distribution sector has made an aggregate loss of
Rs1.5trillion. This will be made good through gov’t subsidy, bank
waivers and increase in tariff to consumers. Fortunately, we deal
with the Gujarat and Maharashtra electricity utilities which are in
good health so far and we do not face any major issues on our
collections, etc.
C Outlook: We are cautiously optimistic for FY13 because we
have built strong engines of growth. Our new facilities in Turkey and
Portugal as well as revamped dye house in India will drive volume.
An increase in the proportion of nylon yarn in the total volume may
boost gross spread. However, our key difficulty will be to absorb
high raw material cost and get price increase with customers in
time. A tight control over cost of finance and increased income
from wind energy will help offset the pressure on our profitability
this year.
D. Financial Performance:
Turnover: The company turnover grew by 10.46% in FY 11-12.
(excluding trading sales). This increase can be attributed to 6.87%
volume and 3.59% price growth.
Expenditure: The total expenditure increased by 14.35% in
FY2011-12. Apart from rising cost of raw material, there was a
sharp rise in cost of packaging and freight.
12
Textile sector has failed to attract foreign direct investment in India
since the onset of liberalization. In 20 years, the FDI in textile has
been a pathetic Rs34bn. This is because the gov’t measures/policies
are lacking in terms of attaining scalability in the sector. Gov’t
decision to remove tax benefits for Special economic zone and
export oriented units does not augur well for attracting future
investments. Most of the units are small and fragmented and
suffer from lack of automation. Due to poor logistics and power
supply their cost of production is very high and with these
deficiencies one cannot expect this sector to achieve economies of
scale like it has in China. Also, the emphasis on value addition is
missing. There is no additional benefit to those who are focusing on
value added production. Thus, structurally the sector will continue
to suffer until these gaps are addressed.
The opportunity for SPFL continue to remain bright as it exports
high value added nylon and polyester yarns to some of the largest
apparel companies in the world. We have manufacturing and
sourcing base around the world and a low cost of capital is allowing
us to carry out regular expansion and grab opportunities.
Apparently, there are no threats but we would like to strengthen
our internal systems and processes, generate better productivity to
attain a greater scale in time to come.
As regards, our wind power business, the health of state electricity
boards is a concern. Ultimately, these state electricity units pay us
our dues for selling them power. Media sources indicate that the
DIRECTORS’ REPORT
Rs. 8.77 Crores for textiles machinery and factory building.
Working Capital: Our working capital requirements increased
in tandem with the business. The average collection period
remained below 99 days and inventory period below 78 days.
Cash Flow: We generated operating free Cash Flow of Rs. 1.66
Crores.
Expansion: During the year, the company has invested
Rs. 6.77 Crores in Plant & Machinery and Building in the yarn
segment.
Raw Material Cost: Our raw material mainly consists of
polyester and nylon chips which are in turn made from PTA, MEG
and Caprolactum. Prices of all these raw material rose very sharply
last year. Our total raw material cost increased by 11.97% last year.
As a percentage of total cost it increased to 60% from 59% in FY11.
EBIDTA: EBIDTA margin at 13.91% was down 189 bps
compared to FY11.
Interest Cost and Debt: Total debt of the company increased by
36% to Rs. 62.9 Crores. Average cost of borrowings was below 7%.
Fixed Assets: The fixed assets during the year increased by
To thrive in turbulent times, organizations must become a bit more disorganized and unmanaged - less
structured, less hierarchical, and less routinized.
SARLA PERFORMANCE FIBERS LIMITED
Raw Material Cost
Expenditure
EBIDTA
Interest Cost and Debt
Fixed Assets (Gross Block)
Net Current Assets
Working Capital Finance
Cash & Bank Balances
10,888.71
5,691.36
2,523.52
269.69
11,335.81
2,645.70
5,249.70
1,137.85
9,191.56
4,794.63
2,501.16
184.66
10,458.54
2,129.99
3,473.79
919.30
18.46
18.70
0.89
46.05
8.39
24.21
51.13
23.77
Item 2011-12 2010-11 % Increase
Note: standalone performance comparison.
(Rs. in Lacs)

13
F. Internal Control System and Their Adequacy: The company
has in place reasonable internal control system both from the
business process and regulatory compliance point of view. The
system is reviewed and updated on regular basis. The company is
continuously upgrading its internal control systems by measures
such as strengthening of Information Technology infrastructure
and use of external management consultant services.
G. Human Resources/Industrial Relations: The company has
always valued and nurtured its human resources, nonetheless,
globalization, high growth of the Indian economy in recent times
and its ambitious growth targets have made talent attraction and
retention amongst the biggest challenges the company faces
today.
The company has in place a good appraisal system to motivate all
the employees of the company. The company believes in
continuous development for all its employees and for that company
is planning to frame a program wherein all the employees will be
provided training into related areas of skill development.
H. Capital Expansion and Investment: For current year, we
have outlined a CAPEX for new wind mills and balancing
equipments in the dye house. We expect CAPEX to go down as
compared to previous year. We do not envisage large CAPEX or
investment unless a substantial new opportunity emerges.
E. Risk and Concerns
Interest Rates: The company’s present Debt equity Ratio is
0.55 Long Term D/E Ratio is 0.11. Interest costs to revenue is 1% and
average cost of borrowings is 7%. All our borrowings are majorly
for working capital in the core synthetic yarn business.
Exchange Rate: 59% of company revenue is in foreign
currency and balance in local currency, deemed exports and
domestic tariff area. Also, we import 34.37% of total turnover, i.e.
including trading sales (63% of total raw material purchases)
creating a natural hedge to that extent. Apart from this, from time
to time forward cover is taken to hedge exposure in foreign
currency.
Inflation: The company does not sell to retail customers. Its
sales are to the business segment and hence it has been able to pass
on inflationary pressures. It does not expect any major impact due
to current high level of inflation.
Competition: The Company faces competition in India from
Chinese products. In the export market, our main competition is
with large global producers of high tenacity yarns. Our main
advantage is multiple low cost locations for manufacturing and
flexibility to offer customization. However, due to relatively small
size we do not have an edge in procurement of raw material.
D Value Added Statement (Rs. in Lacs)
Particulars FY 2008-09 FY 2007-08FY 2009-10FY 2010-11FY 2011-12
Income from Production/Operations
Add : Other Income
Corporate Output
Less :Cost of Raw Materials Consumed
Less : Cost of Traded Goods
Less : Other Manufacturing Expenses
Less : Administrative & Other Expenses
Equals Gross Value Added
Less : Depreciation & Amortisation
Less : Extra Ordinary/Prior Period Items
Equals Net Value Added
13,058.64
83.50
13,142.14
5,843.62
1,008.90
2,586.20
1,109.35
2,594.08
512.52
5.62
2,075.94
16,362.51
124.84
16,487.35
8,846.55
345.01
3,181.94
1,321.45
2,792.39
586.46
—
2,205.94
18,979.62
144.26
19,123.88
10,118.67
770.05
3,588.94
1,705.23
2,940.99
704.15
—
2,236.84
12,455.81
20.63
12,476.44
6,533.40
145.15
2,479.36
1,093.37
2,225.16
476.15
12.22
1,736.79
11,150.33
89.36
11,239.68
5,826.27
201.01
2,086.49
843.74
2,282.18
384.91
73.22
1,824.05
Allocation of Net Value Added
To Personnel
To Taxes(including tax on proposed dividend.)
To Creditors (via interest)
To Investors (via dividend)
To The Company (via retained earnings)
248.46
510.65
234.43
243.26
839.15
2,075.94
291.24
489.38
184.66
364.71
875.95
2,205.94
417.46
521.86
269.69
347.52
680.30
2,236.84
213.12
432.68
299.91
243.26
547.81
1,736.78
162.91
335.95
188.21
243.26
893.72
1,824.05
4. SUBSIDIARY COMPANIES AND JOINT VENTURES
Sarla Overseas Holdings Limited
Sarla Overseas Holdings Limited, a 100% wholly owned subsidiary
of the Company registered at British Virgin Islands during the year
2006-07. The parent company M/s Sarla Performance Fibers Limited
has invested in the capital of M/s Sarla Overseas Holding Limited, a
total of US$ 4,35,000 equivalent to Rs. 183.22 Lacs. The Subsidiary
Company is holding 40% stake in M/s Savitex, SA De CV, a Joint
Venture based at Honduras, holding 60% share in Sarla Europe
based at Portugal, holding 45% shares in Sarla Tekstil based in
Turkey and holding 33.33% shares in MRK SA De C.V., based at
Honduras, Central America..
Sarla Overseas Holdings Limited has made a total turnover of
Rs. 2,758.10 Lacs and earned a net profit of Rs. 604.90 Lacs. The
Joint Venture M/s Savitex, SA De CV has made a total turnover of
Rs 3,946.13 Lacs and earned a total net profit of Rs. 641.59 Lacs
CHANGE THE WAY WE CHANGE

14
DIRECTORS’ REPORT
after depreciation in the financial year 2011-12. This joint venture
of the company has established a strong presence in the growing
market of Central America, the biggest market for high tenacity
nylon and polyester products in the world.
Sarla Europe Lda
Sarla Europe Lda, a subsidiary of Sarla Overseas Holdings Limited
has made a total turnover of Rs. 356.10 Lacs and incurred a loss of
Rs. 33.98 Lacs. MRK SA De CV which has started the operations in
the Financial Year 2010-11, company has made a turnover Rs.
672.48 Lacs and earned a net profit of Rs. 95.73 Lacs. In Sarla
Europe Lda, Portugal, Sarla Overseas Holdings Limited is holding
60% share capital of its share capital.
Sarla Tekstil Filament Sanayi Ve Tic.
Sarla Tekstil Filament Sanayi Ve Tic., a joint venture company of
Sarla Overseas Holdings Limited, has started the operations in the
FY 2010-11, posted a turnover of Rs. 865.89 Lacs and incurred a loss
of Rs.164.44 Lacs. In Sarla Tekstil Filament Sanayi Ve Tic, Turkey,
Sarla Overseas Holdings Limited is holding 45% of its share capital.
The Consolidated income from operations and consolidated net
profit of Sarla Overseas Holdings Limited including its subsidiary
viz. Sarla Europe LDA and its joint venture companies, viz., Savitex
SA De C.V., MRK SA De C.V. and Sarla Tekstil Filament Sanayi, is Rs.
5164.02 Lacs and Rs. 799.59 Lacs respectively.
The Consolidated Income from Operations and consolidated net
Profit of Sarla Performance Fibers Limited including its subsidiary of
M/s Sarla Overseas Holding Limited, its share of profit in Joint
Venture in M/s Savitex, SA De CV, Sarla Tekstil and MRK SA De C.V.
and the Share of profit in Sarla Europe, a subsidiary of Sarla
Overseas Holdings Limited, were Rs. 23358.84 Lacs and Rs. 1891.57
Lacs p.a. Local Laws do not have mandatory requirement of the
Audit of the Accounts of Joint Venture Companies, viz. Savitex SA
De C.V. and MRK SA De C.V., but the company has employed
external auditor to give true and fair picture of the Accounts.
5. FIXED DEPOSIT:
The company has not accepted any fixed deposit from the public
during the Financial year ended under review.
6. PERSONNEL :
Particulars of employees within the meaning of Section 217(2A) of
the Companies Act, 1956, read with the Companies (Particulars of
Employees) Rules, 1975, as amended by the Companies
Amendment Act, 1988, are not applicable since there was no
employee who was in receipt of remuneration prescribed under the
said Rules.
7. AUDITORS’ & AUDITORS REPORT:
M/s. Sundarlal, Desai & Kanodia, Chartered Accountants, the
Statutory Auditors of the company hold office until the conclusion
of the ensuing Annual General Meeting and are recommended for
re-appointment.
The notes on Accounts referred to in the Auditors’ Report are self
explanatory and therefore, do not require any further comments.
8. CORPORATE GOVERNANCE:
As required by Clause 49 of the Listing Agreement with Stock
Exchanges, Corporate Governance Report is attached as Annexure
to this Report. Certificate of Auditors regarding compliance of the
conditions of Corporate Governance as stipulated in Clause 49 of
the Listing Agreement of the Stock Exchanges is also attached and
forms part of this Report.
9. DIRECTORS’ RESPONSIBILITY STATEMENT:
A Directors’ Responsibility Statement as required Under Section
217(2AA) of the Companies Act 1956 is given below:-
I. Directors have followed the applicable Accounting Standards
in the preparation of the Annual Accounts and proper explanation
relating to material departures have been given in Note no. 20 of
Notes on Accounts forming part of the accompanying Accounts
II. Directors have selected the Accounting Policies as given in
Note no. 26 on Accounts and applied them consistently and made
judgments and estimates that are reasonable and prudent so as to
give a true and fair view of the State of Affairs of the company as at
31st March, 2012 and of the profits of the company for the year
ended on that date.
III. Directors have taken proper and sufficient care for the
maintenance of adequate accounting records in accordance with
the provisions of Companies Act, 1956 for safeguarding the Asset
of the company and for preventing and detecting fraud and other
irregularities.
IV. Directors have prepared the Annual Accounts for the year
ended 31st March, 2012 on a Going Concern basis.
10. CONSOLIDATED FINANCIAL STATEMENTS
In compliance with the Accounting Standard 21 on Consolidated
Financial Statements, this Annual Report also includes
Consolidated Financial Statements for the financial year. From the
Consolidated Profit and Loss Account, it may be observed that the
net profit after tax stands at Rs.1891.57Lacs.
11. SUBSIDIARY
As required under the provisions of Section 212 of the Companies
Act, 1956, the statement giving the details under Section 212 is
given for Sarla Overseas Holdings Limited, a wholly owned
subsidiary of the Company and Salra Europe Lda, is a subsidiary of
Sarla Overseas Holdings Limited, in which Sarla Overseas Holdings
Limited holds 60% of its Share Capital.
The Ministry of Corporate Affairs, Government of India, vide its
Circular dated 8th February, 2011, has granted a general exemption
under 212 (8) of the Companies Act, 1956 from the requirement to
attach detailed financial statements of each subsidiary.
In compliance with the exemption granted, a statement containing
SARLA PERFORMANCE FIBERS LIMITED

15
(Rs. in Lacs)FORM ‘A’
A. Electricity
a) Purchased
Unit
Total Amount (Rs.)
Rate/Unit (Rs.)
b) Own Generation
1) Through diesel generator
Unit per ltr. Of diesel oil
Cost/Unit (Rs.)
2) Through steam turbine generator
B. Coal (Specify quantity & where used)
C. Furnace Oil
For Generating steam for Boiler - Kgs.
Total Amount (Rs.)
Cost/Ltr. (Rs.)
D. Gas
For Generating steam for Boiler - SCM
Total Amount (Rs.)
Cost/SCM (Rs.)
E. Others/Internal generation
2,27,13,666
9,64,39,553
4.25
8,71,706
3.41
10.80
—
—
1,26,000
45,43,753
36.06
6,27,511
1,65,64,327
26.40
—
2,27,33,040
7,65,89,009
3.37
8,27,978
3.40
9.26
—
—
1,50,200
38,86,505
25.88
4,18,266
82,10,703
19.63
—
Current Year 2011-12 Previous Year 2010-11
F. Consumption per unit of production
Product - Yarns (M.T.)
Electricity - Units
Furnace Oil - kgs.
Gas-scm
Coal (Specify quality)
Others (Specify)
—
—
—
—
—
—
11,165
2,034
198
194
—
—
11841
1920
205
181
—
—
Standard (if any) Current Year 2011-12 Previous Year 2010-11
brief financial details of the Company’s’ subsidiary (ies) for the
financial year ended 31st March, 2012 is included in the Annual
Report under Annexures to Directors’ Report.
The detailed financial statements and audit reports of the
subsidiary of the company is available for inspection at the
registered office of the company during office hours and upon
written request from a shareholder, your company will arrange to
send the financial statements of subsidiary companies to the said
shareholder.
12. ENERGY CONSERVATION, TECHNOLOGY ABSORPTION AND
FOREIGN EXCHANGE EARNINGS AND OUTGO.
As required under Section 217(1)(e) of the Companies Act, 1956
and the Rules made there under, the concerned particulars relating
to Energy Conversation, technology absorption and foreign
exchange earnings and outgo are given in Annexure, which is
attached hereto and forms part of the Report.
Building organizations that are as resilient as they are efficient may be the most fundamental business
challenge of our time. Adaptability really matters now.
CHANGE THE WAY WE CHANGE

16
FORM ‘B’Form for disclosure of particulars with respect to Technology Absorption, Research and Development (R&D)
Specific areas in which R & D is Carried out by the company New Product Development, process Development and optimising
process parameters.
1.
Benefits derived as a result of the above R & D Introduction of several new types of Polyester and Nylon Yarns.2.
Future Plan of Action To meet the increasing requirement of customers around the
world and development of new products.
3.
Expenditure on R & D.
a) Capital
b) Recurring
c) Total
All machineries are dedicated for operational as well as R & D
activities hence no separate accounts are maintained and as such
expenditure on R & D is not separately ascertainable.
d) Total R & D expenditure as per percentage of total Turnover. N.A.
Technology absorption, adoption and innovation.
1. Efforts in brief, made towards Technology absorption,
adoption and innovation products
Continuous efforts towards improvement of process equipment
and are made out to suit market requirements and to achieve
optimum operational efficiency.
4.
2. Benefit derived as a result of the above efforts e.g product
improvement, cost reduction, development, import
substitution etc.
Introduction of several new products.
3. In case of Imported Technology (imported during the last 5
years reckoned from the beginning of the financial year),
following information may be furnished.
a) Technology Imported
b) Year of Import
c) Has Technology been fully Absorbed ?
d) If not fully absorbed areas where this has not taken
place, reasons therefore and future plans of action.
N.A.
C) Export Plans & Foreign Exchange earnings and outgo:
The Company has now established a potential solid customer base
in European countries especially Italy, Spain, Romania, Turkey, U.
K.,etc., some countries in Central and North America and Asian
Countries like China, Hong Kong etc.
Israel, Jordan, Canada & South America countries like Argentina
and Brazil are the thrust areas for the future and a good beginning
has been made towards this.
FOREIGN EXCHANGE EARNED FOREIGN EXCHANGE USED
(Rs. in Lacs) (Rs. in Lacs)
Rs. 10,398.97 Rs. 72,33.43
13. ACKNOWLEDGMENT:
The Directors take this opportunity to place on record their
appreciation and sincere gratitude to the various Departments of
the Central and State Governments, Andhra Bank, Citibank N.A.,
Standard Chartered Bank, DBS Bank and Yes Bank for their valuable
assistance and support. The Management appreciates the
enthusiasm and co-operation of all Contractors/Agencies for their
continued support. The Directors also acknowledge the sincere
contribution by the workers and staff of the Company at various
levels and thank to Company’s Shareholders for their continued
support.
FOR & ON BEHALF OF BOARD OF DIRECTORS
MADHUSUDAN S. JHUNJHUNWALA Chairman & Whole Time Director
Place: Mumbai. Date : 29th May, 2012
For success, like happiness, cannot be pursued; it must ensue, and it only does so as the unintended
consequence of one's personal dedication to a cause greater than oneself.
DIRECTORS’ REPORT
SARLA PERFORMANCE FIBERS LIMITED

17
Annexure To The
1. PURSUANT TO THE EXEMPTION BY THE MINISTRY OF COMPANY AFFAIRS, GOVERNMENT OF INDIATHE COMPANY IS PRESENTING SUMMARY FINANCIAL INFORMATION ABOUT SUBSIDIARY AS AT 31ST MARCH, 2012.
Name of the Subsidiary
Holding Company’s Interest
Extent of Holding
Subsidiary Financial Year
Reporting Currency
Exchange Rate as on 31-03-2012
Share Capital (Rs. in Lacs)
Reserves & Surplus (Rs. in Lacs)
Total Assets (Rs. in Lacs)
Total Liabilities (Excl. 7&8) (Rs. in Lacs)
Investments (Other than in Subsidiary) (Rs. in Lacs)
Sales (Including Other Income) (Rs. in Lacs)
Profit before taxation (Rs. in Lacs)
Provision for Taxation (Rs. in Lacs)
Profit After Taxation (Rs. in Lacs)
Proposed Dividend (including dividend tax, if any)
(Rs. in Lacs)
Sarla Overseas
Holdings Limited
4,35,000 Shares
100%
31st March, 2012
USD
50.01
196.99
1,860.35
2,410.85
552.88
2,758.10
604.90
NIL
607.90
NIL
NIL
Sarla Europe Lda
(subsidiary of Sarla
Overseas Holdings Limited)
3 Shares
60%
31st March, 2012
EURO
66.36
3.31
-75.17
274.57
NIL
356.10
-33.08
-0.90
-33.98
NIL
NIL
CompanyParticularsS. No.
1
2
3
4
5
6
7
8
9
10
11
12
13
14
15
16
2. STATEMENT PURSUANT TO SECTION 212 OF THE COMPANIES ACT, 1956 RELATING TO SUBSIDIARY COMPANY
Name of the Subsidiary
Holding Company’s Interest
Extent of Holding
Subsidiary Financial Year
Net aggregate amount of subsidiary’s Profit/(Loss) not
dealt within the Holding Company’s accounts:
i) For the Financial Year of the Subsidiary (Rs. in lacs)
ii) For the previous financial years of the subsidiaries
since they become the holding company’s
subsidiaries (Rs. in lacs)
Net aggregate amount of subsidiary’s Profit/(Loss)
Dealt within the Holding Company’s accounts:
i) For the Financial Year of the Subsidiary (Rs. in lacs)
ii) For the previous financial years of the subsidiaries
since they become the holding company’s
subsidiaries (Rs. in lacs)
Sarla Overseas
Holdings Limited
4,35,000 Shares
100%
31st March, 2012
604.90
1,105.96
—
—
Sarla Europe Lda
(subsidiary of Sarla
Overseas Holdings Limited)
3 Shares
60%
31st March, 2012
(20.39)
(23.59)
—
—
CompanyParticularsS. No.
1
2
3
4
5
6
FOR & ON BEHALF OF BOARD OF DIRECTORS
MADHUSUDAN S. JHUNJHUNWALA Chairman
KRISHNAKUMAR M. JHUNJHUNWALAManaging Director
MAHENDRA SHETHCompany Secretary
Place: Mumbai. Date : 29th May, 2012
DIRECTORS’ REPORT
CHANGE THE WAY WE CHANGE
18
Annexure
INTRODUCTION
Sarla Performance Fibers Limited (SPFL) believes in fair business
and corporate practices while dealing with the shareholders,
employees, customers, creditors, lenders and others. The Company
always aims to build trust with shareholders, employees,
customers, suppliers and diverse stakeholders and to meet the
expectation of various elements of corporate environment. The
Company also believes in transparent and fair corporate actions
with adequate disclosure and total accountability.
SPFL has been discharging its statutory obligations and duties and
has always complied with the statutory and regulatory
requirements. Given below are the company’s corporate
governance policies and practices in accordance with the provisions
of Clause 49 of the Listing Agreement.
A report on the implementation of the Corporate Governance Code
of the Listing Agreement by the Company is furnished below :-
1. COMPANY’S PHILOSOPHY ON CORPORATE GOVERNANCE:
Corporate Governance is the combination of voluntary practices
and compliance with laws and regulations leading to effective
control and management of the organisation. Good Corporate
Governance leads to long term shareholder value and enhances
interest of other stakeholders. It brings into focus the fiduciary and
the trusteeship role of the Board to align and direct the actions of
the organisation towards creating wealth and shareholders value.
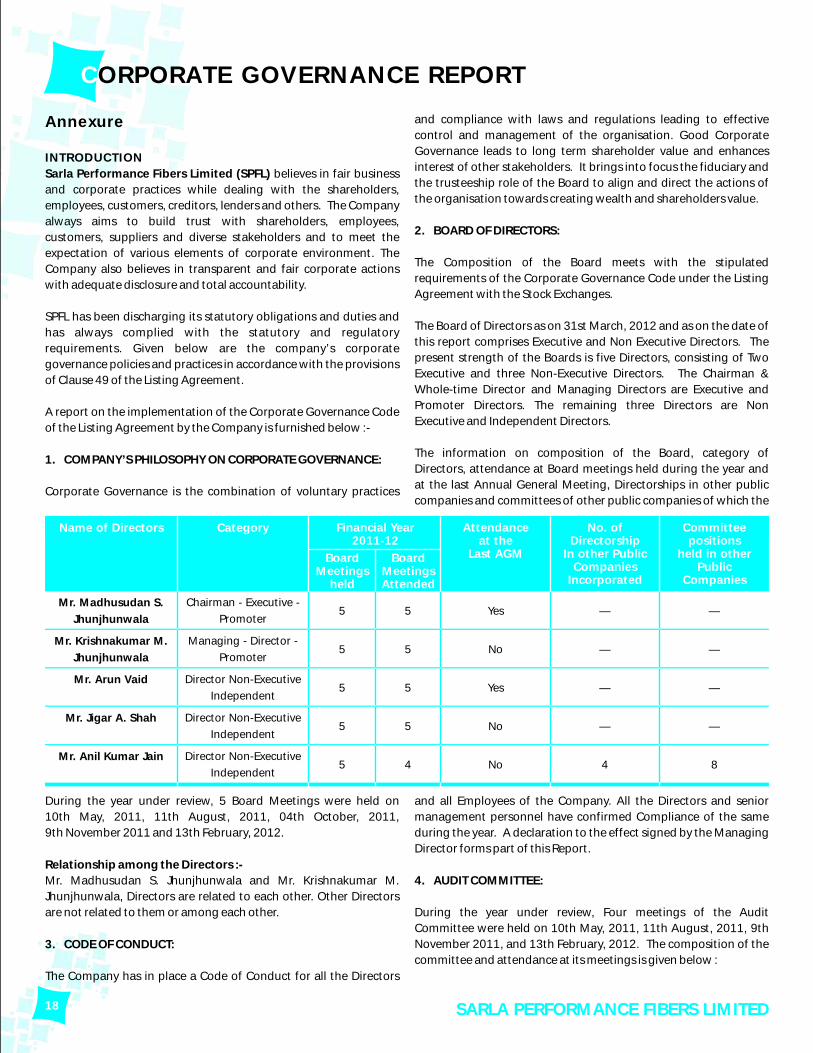
2. BOARD OF DIRECTORS:
The Composition of the Board meets with the stipulated
requirements of the Corporate Governance Code under the Listing
Agreement with the Stock Exchanges.
The Board of Directors as on 31st March, 2012 and as on the date of
this report comprises Executive and Non Executive Directors. The
present strength of the Boards is five Directors, consisting of Two
Executive and three Non-Executive Directors. The Chairman &
Whole-time Director and Managing Directors are Executive and
Promoter Directors. The remaining three Directors are Non
Executive and Independent Directors.
The information on composition of the Board, category of
Directors, attendance at Board meetings held during the year and
at the last Annual General Meeting, Directorships in other public
companies and committees of other public companies of which the
Name of Directors Financial Year2011-12
Attendanceat the
Last AGM
Mr. Madhusudan S.
Jhunjhunwala
Chairman - Executive -
Promoter5 5 Yes — —
Category No. ofDirectorship
In other PublicCompanies
Incorporated
Committeepositions
held in otherPublic
Companies
Board Meetings
held
Board MeetingsAttended
Mr. Krishnakumar M.
Jhunjhunwala
Managing - Director -
Promoter 5 5 No — —
Mr. Arun Vaid Director Non-Executive
Independent5 5 Yes — —
Mr. Jigar A. Shah Director Non-Executive
Independent5 5 No — —
Mr. Anil Kumar Jain Director Non-Executive
Independent5 4 No 4 8
During the year under review, 5 Board Meetings were held on
10th May, 2011, 11th August, 2011, 04th October, 2011,
9th November 2011 and 13th February, 2012.
Relationship among the Directors :-
Mr. Madhusudan S. Jhunjhunwala and Mr. Krishnakumar M.
Jhunjhunwala, Directors are related to each other. Other Directors
are not related to them or among each other.
3. CODE OF CONDUCT:
The Company has in place a Code of Conduct for all the Directors
and all Employees of the Company. All the Directors and senior
management personnel have confirmed Compliance of the same
during the year. A declaration to the effect signed by the Managing
Director forms part of this Report.
4. AUDIT COMMITTEE:
During the year under review, Four meetings of the Audit
Committee were held on 10th May, 2011, 11th August, 2011, 9th
November 2011, and 13th February, 2012. The composition of the
committee and attendance at its meetings is given below :
CORPORATE GOVERNANCE REPORT
SARLA PERFORMANCE FIBERS LIMITED

19
Name of Directors No. of MeetingsHeld
Mr. Madhusudan S. Jhunjhunwala - Member Executive 4 4
Category No. of MeetingsAttented
Mr. Arun Vaid - Chairman Non-Executive 4 4
Mr.Jigar A.Shah - Member Non-Executive 4 4
AGM for the Financial Year
2008-2009 29th September, 2009 11.30 a.m.
Date Time Venue
2009-2010 25th September, 2010 11.30 a.m.
2010-2011 29th September, 2011 11.30 a.m.
Registered Office of the Company:
Survey No. 59/1/4, Amli Piparia
Industrial Estate, Silvassa - 396 230
U.T. OF D. & N. HAVELI.
Service Contacts severance fees and Notice period with Managing
Director and Chairman & Whole Time Director:
Managing Director:
Period of Contract : 5 Years from 01st October 2009
Termination of Contract : By either party giving 3 Months notice
Severance Fees : Nil
Chairman & Whole Time Director:
Period of Contract : 5 Years from 01st August 2010
Termination of Contract : By either party giving 3 Months notice
Severance Fees : Nil
6. INVESTORS’ GRIEVANCE COMMITTEE
The Investors’ Grievance Committee of the Board has been
constituted to look into complaints of Shareholders.
The Committee is headed by Mr. Arun Vaid, Independent and Non-
Executive Director and other members are Mr. Madhusudan S.
Jhunjhunwala and Mr. Anil Kumar Jain.
During the year one meeting of Investors’ Grievances Committee
was held on 13th February, 2012.
The Compliance Officer of the Company, Mr. Mahendra Sheth can
be contacted on following address:
Sarla Performance Fibers Limited,
304, Arcadia, 195 Nariman Point, MUMBAI - 400 021
Tel: 2283 4116 / 4420 Fax: 2285 1728
E-mail: [email protected]
Website: www.sarlafibers.com
During the year, 2 complaints were received from the shareholders,
however, we have also received letters for re-validation of Dividend
Warrants, Non-Receipt of Dividend Warrants etc. and the same
have been attended within the stipulated time.
None of the Resolutions in above Annual General Meetings was required to be passed by postal ballot.
Terms of reference of the Audit Committee, the Committee’s
powers, role and functions are as stipulated at the Clause 49 of the
Listing Agreement and under Section 292A of the Companies Act,
1956. The role and functions of the Committee, inter-alia include
overseeing the Company’s financial reporting process, reviewing
with the management and external auditors key issues and
significant processes, statements and results before submission to
the Board, reviewing the adequacy of the internal control systems
and procedures, significant risk areas with the management,
internal auditors and external auditors, review of significant related
party transactions and internal audit reports, reviewing progress
made in implementation of recommendations made by the Internal
Audit Department, making recommendations for improvement in
internal control systems and reviewing issue related to risk
management and compliances, review of financial statements.
5. REMUNERATION COMMITTEE & REMUNERATION TO
DIRECTORS
Remuneration Committee of Board of Directors consists of
Mr. Arun Vaid, Mr. Jigar A. Shah and Mr. Anil Kumar Jain,
Independent Directors as members of the Committee. During the
year no meeting of Remuneration Committee was held because
there was no matter took place which required consideration by
Remuneration Committee during the year.
The details of sitting fees paid to the Directors during the year 2011-
2012 are given below:-
Company has paid a remuneration of Rs. 42,00,000.00 to
Mr. Krishnakumar M. Jhunjhunwala, Managing Director and
Rs. 34,00,000.00 to Mr. Madhusudan S. Jhunjhunwala, Chairman &
Whole Time Director of the Company during the financial year
2011- 2012.
Name of Directors Sitting Fees (Rs.)
Mr. Arun Vaid 25,000/-
Mr. Jigar A. Shah 25,000/-
Mr. Anil Kumar Jain 20,000/-
7. GENERAL BOARD MEETING - Location and time of last 3 Annual General Meetings:
CHANGE THE WAY WE CHANGE
CORPORATE GOVERNANCE REPORT
20
8. DISCLOSURES
Disclosure on materially significant related party transactions.
Please refer note 42 to the Accounts. These transactions do not
have any potential conflict with the interest of the Company at
large.
CEO/CFO Certification
A certificate from the CEO and CFO, in terms of Clause 49(V) of
the Listing Agreement was placed before the Board, at the Meeting
held on 29th May, 2012 to approve the Audited Annual Accounts
for the year ended March 31, 2012.
Non-Mandatory Requirements:
The status of Compliance with non-mandatory requirements
is as under:
A. The Chairman of the Board of Directors of the Company is an
Executive Director and None of the Independent Directors of the
Company has a tenure of exceeding nine years on the Board of the
Company except one Independent Director.
B. As the financial Results of the Company are published in the
leading Newspapers, Company is not sending half-yearly financial
results to each Shareholder of the Company.
C. During the financial year 2011-2012 there is no Audit
qualification in the Company’s financial Statements.
D. The Company has a Remuneration Committee which
conforms all the requirement of Corporate Governance.
E. The Company does not have any formal system to evaluate the
performance of non-executive Directors.
F. The Company has not established a whistle Blower Policy.
9. MEANS OF COMMUNICATION
The Quarterly and Half Yearly results are published in widely
circulating National and Local Dailies such as Economic Times, in
English (Mumbai & Ahmedabad,), Economic Times in Gujarati
(Ahmedabad) and Navbharat Times in Hindi.(Mumbai). The results
are not sent individually to the shareholders.
There were no presentations made to the Institutional investors or
Analysts during the year.
The Management Discussion and Analysis Report forms part of the
Annual Report and included in the Directors’ Report.
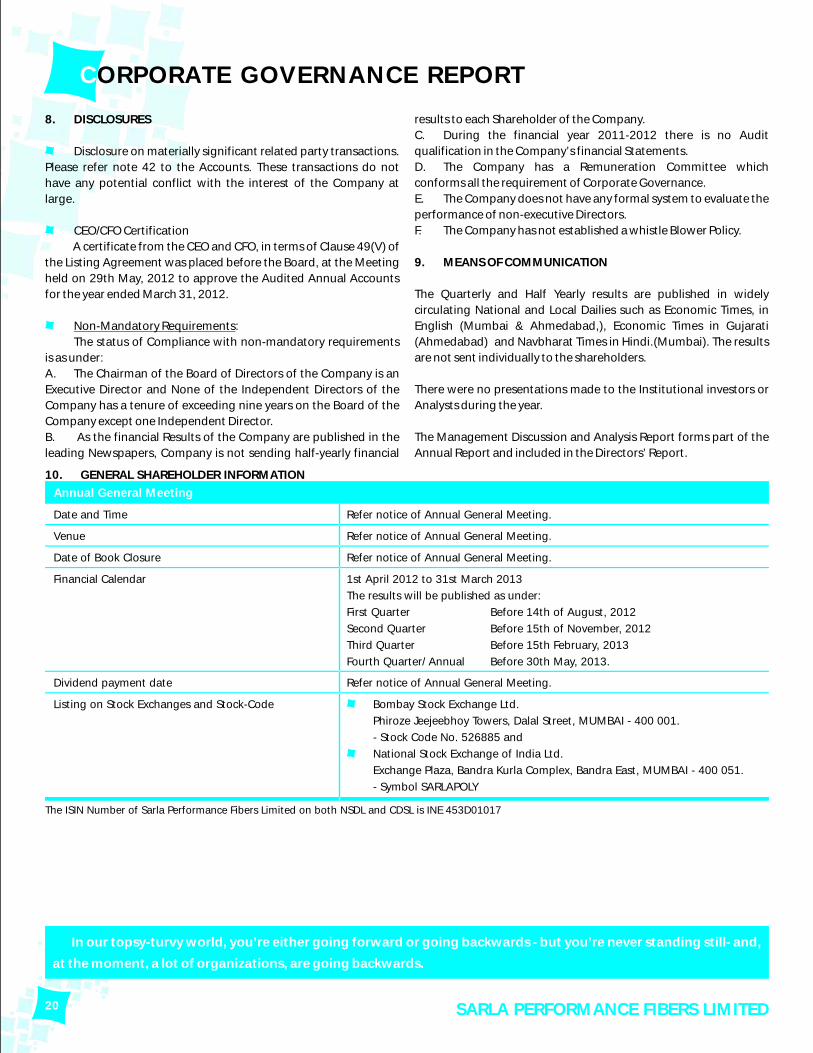
Annual General Meeting
Date and Time Refer notice of Annual General Meeting.
Venue Refer notice of Annual General Meeting.
Date of Book Closure Refer notice of Annual General Meeting.
Dividend payment date Refer notice of Annual General Meeting.
Financial Calendar 1st April 2012 to 31st March 2013
The results will be published as under:
First Quarter Before 14th of August, 2012
Second Quarter Before 15th of November, 2012
Third Quarter Before 15th February, 2013
Fourth Quarter/ Annual Before 30th May, 2013.
Listing on Stock Exchanges and Stock-Code Bombay Stock Exchange Ltd.
Phiroze Jeejeebhoy Towers, Dalal Street, MUMBAI - 400 001.
- Stock Code No. 526885 and
National Stock Exchange of India Ltd.
Exchange Plaza, Bandra Kurla Complex, Bandra East, MUMBAI - 400 051.
- Symbol SARLAPOLY
The ISIN Number of Sarla Performance Fibers Limited on both NSDL and CDSL is INE 453D01017
In our topsy-turvy world, you’re either going forward or going backwards - but you’re never standing still- and,
at the moment, a lot of organizations, are going backwards.
10. GENERAL SHAREHOLDER INFORMATION
SARLA PERFORMANCE FIBERS LIMITED

21
11. MARKET PRICE DATA
Monthly high/low during the year 2011-2012 on the Bombay Stock Exchange and National Stock Exchange:
AGM for the Financial Year
April 2011
May 2011
June 2011
July 2011
August 2011
September 2011
October 2011
November 2011
December 2011
January 2012
February 2012
March 2012
154.00
139.00
131.00
124.70
123.00
115.20
115.50
124.95
103.70
107.90
109.00
100.00
113.10
115.50
110.00
110.00
100.00
101.35
102.65
90.00
80.75
87.00
86.55
85.30
138.60
139.50
142.75
125.00
125.00
125.00
112.10
124.00
104.75
110.85
108.90
99.95
110.00
115.50
101.35
108.00
103.65
99.15
102.20
90.00
73.75
88.55
84.50
85.50
BSE NSE
High (Rs.) High (Rs.)Low (Rs.) Low (Rs.)
Apr 11
May
11
Jun
11
Jul 1
1
Aug 1
1
Sep 1
1
Oct
11
Nov
11
Dec
11
Jan
12
Feb 1
2
Mar
12
20,500.00
19,500.00
80.00
160.00
200.00
120.00
40.00
0.00
16,000.00
17,000.00
18,000.00
19,000.00
15,500.00
16,500.00
Chart of Company Share Prices compared to BSE Sensex.
Sh
are
Pri
ce o
f Sarl
a
BSE S
en
sex
Months
Sarla
BSE
20,000.00
18,500.00
17,500.00
Apr 11
May
11
Jun
11
Jul 1
1
Aug 1
1
Sep 1
1
Oct
11
Nov
11
Dec
11
Jan
12
Feb 1
2
Mar
12
60.00
160.00
120.00
100.00
140.00
40.00
0.00 4,600.00
Chart of Company Share Prices compared to NSE Nifty Index.
Sh
are
Pri
ce o
f Sarl
a
NSE N
ifty
Months
Sarla
NSE
20.00
80.00
4,800.00
5,000.00
5,200.00
5,400.00
5,600.00
5,800.00
6,000.00
6,200.00
CHANGE THE WAY WE CHANGE

CORPORATE GOVERNANCE REPORT
22
12. DISTRIBUTION OF SHAREHOLDING AS ON 31ST MARCH, 2012
38,15,050
9,27,120
11,72,480
9,19,250
3,84,630
4,82,380
20,46,650
5,97,55,440
6,95,03,000
5.49
1.33
1.69
1.32
0.55
0.70
2.94
85.98
100.00
Total Amount (Rs.)
Number % to Total
2,291
116
78
36
11
10
28
49
2,619
87.48
4.43
2.98
1.37
0.42
0.38
1.07
1.87
100.00
Shareholders
Number % to Total
1
5,001
10,001
20,001
30,001
40,001
50,001
5,000
10,000
20,000
30,000
40,000
50,000
1,00,000
Shares of Nominal Value (Rs.)
From To
1,00,001 and above
TOTAL
13. DISTRIBUTION OF SHAREHOLDING AS ON 31ST MARCH, 2012
63.570
0.029
0.001
0.058
0.418
6.630
26.994
2.285
0.015
100.000
%
44,18,276
2,000
50
4,000
29,083
4,60,814
18,76,193
1,58,850
1,034
69,50,300
No. of shares
Promoters
Mutual Funds & UTI
Fins / Banks
Venture Capital Funds
FII(S)
Private Corporate Bodies
Indian Public
NON RESIDENT INDIANS
Any other (Clearing Members)
Total
Category
14. DEMATERIALISATION OF SHARES:
96.23% of the total equity capital of the Company was held in
dematerialised form as on 31st March, 2012.
15. SHARE TRANSFER SYSTEM:
All Share Transfer and other Correspondence regarding share
Certificates, Change of Address, Dividends etc. should be addressed
to Registrar & Transfer Agent. Request for transfer of Share transfer
in physical form should also be lodged with the Registrar & Transfer
Agent.
16. ADDRESS FOR INVESTORS/ANALYST CORRESPONDENCE:
With the Company:
Sarla Performance Fibers Limited,
304, Arcadia, 195 Nariman Point, MUMBAI - 400 021
Tel: 2283 4116 / 2283 4420 Fax: 2285 1728
E-mail: [email protected] Website: www.sarlafibers.com
With the Registrar:
M/s. Sharex Dynamic (India) Pvt. Ltd.,
Unit - 1, Luthra Ind. Premises, Safed Pool, Andheri Kurla Road,
Andheri (E), Mumbai - 400 072.
Tel: 2851 5606 / 2851 5644 Fax: 2851 2885
E-mail: [email protected] Website: www.sharexindia.com
DECLARATION
I, Madhusudan Jhunjhunwala, Chairman & Whole-Time Director of the Company, hereby declare that all the Members of the Board of
Directors and Senior Management personnel of the Company have affirmed Compliance with the Code of Conduct for the year ended
31st March, 2012.
For SARLA PERFORMANCE FIBERS LIMITED,
(MADHUSUDAN S. JHUNJHUNWALA) Chairman & Whole Time Director
Place: Mumbai. Date : 29th May, 2012
SARLA PERFORMANCE FIBERS LIMITED
23
Governance. It is neither an audit nor an expression of opinion on
the financial statements of the company.
In our opinion and to the best of our information and according to
the explanation given to us, we certify that the Company has
complied with the conditions of Corporate Governance as
stipulated in the above-mentioned Listing Agreement.
We further state that such compliance is neither an assurance as to
the future viability of the Company nor the efficiency or
effectiveness with which the management has conducted the
affairs of the Company.
CERTIFICATE OF THE AUDITORS IN RESPECT OF COMPLIANCE OF CORPORATE GOVERNANCE
For
Chartered Accountants
Registration Number - 110560W
H. P. KANODIA
Partner
Membership No. 40617
SUNDARLAL, DESAI & KANODIA
To the Members of
SARLA PERFORMANCE FIBERS LIMITED
We have examined the compliance of conditions of corporate
governance by Sarla Performance Fibers Limited, for the year ended
31st March, 2012 as stipulated in clause 49 of the Listing
Agreement of the said Company with Stock Exchanges.
The compliance of conditions of corporate governance is the
responsibility of the management. Our examination was limited to
procedures and implementation thereof, adopted by the company
for ensuring the compliance of the conditions of the Corporate
Place: Mumbai.
Date : 29th May, 2012
CHANGE THE WAY WE CHANGE

24
AUDITORS’ REPORT
REPORT ON THE FINANCIAL STATEMENTS
We have audited the accompanying financial statements of Sarla
Performance Fibers Limited (the company), which comprise the
balance sheet as at 31 March 2012, and the statement of profit and
loss and cash flow statement for the year then ended, and a
summary of significant accounting policies and other explanatory
information.
MANAGEMENT’S RESPONSIBILITY FOR THE FINANCIAL
STATEMENTS
Management is responsible for the preparation of these financial
statements that give a true and fair view of the financial position,
financial performance and cash flows of the company in
accordance with the accounting principles generally accepted in
India, including accounting standards referred to in sub-section
(3C) of section 211 of the Companies Act, 1956 (“the Act”). This
responsibility includes the design, implementation and
maintenance of internal control relevant to the preparation and
presentation of the financial statements that give a true and fair
view and are free from material misstatement, whether due to
fraud or error.
AUDITORS’ RESPONSIBILITY
Our responsibility is to express an opinion on these financial
statements based on our audit. We conducted our audit in
accordance with the Standards on Auditing issued by the Institute
of Chartered Accountants of India. Those standards require that we
comply with ethical requirements and plan and perform the audit
to obtain reasonable assurance about whether the financial
statements are free from material misstatement.
An audit involves performing procedures to obtain audit evidence
about the amounts and disclosures in the financial statements. The
procedures selected depend on the auditor’s judgment, including
the assessment of the risks of material misstatement of the financial
statements, whether due to fraud or error. In making those risk
assessments, the auditor considers internal control relevant to the
company’s preparation and fair presentation of the financial
statements in order to design audit procedures that are appropriate
in the circumstances, but not for the purpose of expressing an
opinion on the effectiveness of the company’s internal control. An
audit also includes evaluating the appropriateness of accounting
policies used and the reasonableness of the accounting estimates
made by management, as well as evaluating the overall
presentation of the financial statements. We believe that the audit
evidence we have obtained is sufficient and appropriate to provide
a basis for our audit opinion.
OPINION
In our opinion and to the best of our information and according to
the explanations given to us, the financial statements give the
information required by the Act in the manner so required and give
a true and fair view in conformity with the accounting principles
generally accepted in India:
A. In the case of the balance sheet, of the state of affairs of the
company as at 31 March 2012.
B. In the case of the statement of profit and loss, of the profit for
the year ended on that date, and
C. In the case of the cash flow statement, of the cash flows for the
year ended on that date.
REPORT ON OTHER LEGAL AND REGULATORY REQUIREMENTS
1. As required by the Companies (Auditor’s Report) Order, 2003
(“the Order”) issued by the Central Government of India in terms of
sub-section (4A) of section 227 of the Act, we give in the Annexure a
statement on the matters specified in paragraphs 4 and 5 of the
Order.
2. As required by section 227(3) of the Act, we report that:
A. We have obtained all the information and explanations
which to the best of our knowledge and belief were necessary for
the purpose of our audit.
B. In our opinion proper books of account as required by law
have been kept by the company so far as appears from our
examination of those books.
C. The balance sheet, statement of profit and loss and cash
flow statement dealt with by this report are in agreement with the
books of account.
D. In our opinion, the balance sheet, statement of profit and
loss, and cash flow statement comply with the accounting
standards referred to in sub-section (3C) of section 211 of the
Companies Act, 1956.
E. On the basis of written representations received from the
directors as on 31 March 2012, and taken on record by the Board of
Directors, none of the directors is disqualified as on 31 March 2012,
from being appointed as a director in terms of clause (g) of sub-
section (1) of section 274 of the Companies Act, 1956.
Place: Mumbai.
Date : 29th May, 2012
For
Chartered Accountants
Registration Number - 110560W
H. P. KANODIAPartner
Membership No. 40617
SUNDARLAL, DESAI & KANODIA
SARLA PERFORMANCE FIBERS LIMITED

25
BALANCE SHEET AS AT 31ST MARCH, 2012 (Rs. in Lacs)
Current Year31st March 2012
Previous Year31st March 2011
EQUITY AND LIABILITIES:
1) SHARE HOLDERS FUNDS
Share Capital
Reserves & Surplus
2) NON-CURRENT LIABILITIES
Long-Term Borrowings
Deferred Tax Liabilities (Net)
3) CURRENT LIABILITIES
Short-Term Borrowings
Trade Payables
Other Current Liabilities
Short-Term Provisions
TOTAL
ASSETS:
1) NON-CURRENT ASSETS
Fixed Assets
i) Tangible Assets
ii) Intangible Assets
Non-Current Investments
Long Term Loans and Advances
2) CURRENT ASSETS
Current Investments
Inventories
Trade Receivables
Cash and Cash Equivalents
Short-term Loans and Advances
Other Current Assets
TOTAL
Significant accounting policies and Notes to accounts
Notes referred above forms integral part of the balance sheet
1
2
3
4
5
6
7
8
9
10
11
12
13
14
15
16
17
18
1 to 47
695.03
8,464.64
9,159.67
767.99
1,122.64
1,890.63
5,249.90
1,255.04
1,497.28
431.75
8,433.97
19,484.27
7,425.44
—
183.22
795.93
8,404.59
146.32
3,830.48
4,769.05
1,161.41
988.11
184.31
11,079.68
19,484.27
695.03
7,764.34
8,459.37
914.46
922.39
1,836.84
3,473.79
1,783.07
1,423.39
389.00
7,069.24
17,365.45
7,204.15
1.41
183.22
777.43
8,166.21
—
3,284.79
4,050.53
1,036.36
634.86
192.71
9,199.24
17,365.45
Note
FOR AND ON BEHALF OF BOARD OF DIRECTORS
MADHUSUDAN S. JHUNJHUNWALAChairman
KRISHNAKUMAR M. JHUNJHUNWALAManaging Director
MAHENDRA SHETHCompany Secretary
As per our annexed reportFor SUNDARLAL, DESAI & KANODIAChartered Accountants
H. P. KANODIAPartnerMembership No. 40617Place : MumbaiDate : 29th May, 2012
CHANGE THE WAY WE CHANGE

26
Statement of Profit and Loss for the
YEAR ENDED 31ST MARCH, 2012 (Rs. in Lacs)
Current Year31st March 2012
Previous Year31st March 2011
INCOME:
Revenue from operations
Less: Excise duty
Other income
EXPENSES:
Cost of materials consumed
Purchase of stock-in-trade
Changes in inventories of finished goods and work-in-
progress
Employee benefit expenses
Finance costs
Depreciation and amortization expenses
Other expenses
PROFIT BEFORE TAX
TAX EXPENSE:
Current tax (MAT)
Less: MAT Credit
Net Current Tax
Deferred tax
Tax adjustment of earlier years
PROFIT FOR THE PERIOD
EARNING PER EQUITY SHARE:
Basic
Diluted
Significant accounting policies and Notes to accounts
Notes referred above forms integral part of the statement
of profit and loss
19
20
21
22
23
24
9 & 10
25
1 to 47
18,739.53
533.81
18,205.72
144.26
18,349.98
10,118.67
770.05
-773.90
417.47
269.69
704.15
5,294.17
16,800.29
1,549.68
308.00
42.77
265.23
200.25
-8.32
1092.52
15.72
15.72
16,591.71
723.01
15,868.70
124.84
15,993.54
8,846.55
345.01
-493.81
357.24
184.66
586.46
4,437.65
14,263.75
1,729.79
220.00
—
220.00
269.12
—
1240.67
17.85
17.85
Note
As per our annexed reportFor SUNDARLAL, DESAI & KANODIAChartered Accountants
H. P. KANODIAPartnerMembership No. 40617Place : MumbaiDate : 29th May, 2012
FOR AND ON BEHALF OF BOARD OF DIRECTORS
MADHUSUDAN S. JHUNJHUNWALAChairman
KRISHNAKUMAR M. JHUNJHUNWALAManaging Director
MAHENDRA SHETHCompany Secretary
SARLA PERFORMANCE FIBERS LIMITED

27
YEAR ENDED 31ST MARCH, 2012 (Rs. in Lacs)
Current Year31st March 2012
Previous Year31st March 2011
CASH FLOW FROM THE OPERATING ACTIVITIES
Net Profit Before Tax and Extraordinary items
ADJUSTMENT FOR
Depreciation
Interest Paid
Interest Received
Capital Gain on Sale of Investment/Assets
Dividend Received
Operating Profit Before Working Capital Changes
ADJUSTMENT FOR CHANGES IN WORKING CAPITAL
Trade & Other Receivable
Inventories
Loans & Advances
Trade & Other Payable
Cash Generated From Operations
Prior Period Expenses/Extra Ordinary Items
Income Tax Paid
Deferred Tax Liabilities
Net Cash Flow from Operating Activities (1)
CASH FLOW FROM INVESTING ACTIVITIES
Purchase of Fixed Assets
Purchase of Investment
Dividend Received
Gain on Sale of Investment/Assets
Sale of Investment
Interest Received
Net Cash Flow from Investing Activities (2)
CASH FLOW FROM FINANCING ACTIVITIES
Preferential Warrants Issued
Net Fund Raised/(Repayment)
Dividend Paid
Dividend Tax Paid
Interest Paid
Net Cash Raised From Financing Activities (3)
Net Changes in Cash & Cash Equivalent (1+2+3)
Cash And Cash Equivalent - Opening Balance
Cash And Cash Equivalent - Closing Balance
1,730.04
744.32
2,474.37
(839.18)
1,635.19
(230.58)
1,404.61
(1,714.22)
(1,714.22)
586.45
586.45
276.84
759.51
1,036.35
586.46
241.89
(57.23)
(26.79)
—
(593.57)
(926.63)
235.12
445.90
—
(230.58)
—
(1,886.70)
—
—
26.79
88.46
57.23
—
1,112.00
(243.26)
(40.40)
(241.89)
1,549.68
939.73
2,489.41
(2,068.45)
420.96
(254.92)
166.04
(822.48)
(822.48)
781.50
781.50
125.06
1,036.35
1,161.41
704.15
361.74
(92.05)
(30.97)
(3.14)
(718.53)
(545.69)
(135.94)
(668.30)
—
(254.92)
—
(898.73)
(146.32)
3.14
30.97
96.41
92.05
—
1,507.95
(312.76)
(51.95)
(361.74)
Notes :1. The above Cash Flow Statement has been prepared under the “indirect Method” as set out in Accounting Standard - 3 on Cash Flow
Statement issued by the Institute of Chartered Accountants of India.2. Previous year’s figures have been regrouped/rearranged wherever necessary to conform to the current year’s presentations.
This is the Cash Flow statement referred to in our Report of even dateFor SUNDARLAL, DESAI & KANODIAChartered Accountants
H. P. KANODIAPartnerMembership No. 40617Place : MumbaiDate : 29th May, 2012
FOR AND ON BEHALF OF BOARD OF DIRECTORS
MADHUSUDAN S. JHUNJHUNWALAChairman
KRISHNAKUMAR M. JHUNJHUNWALAManaging Director
MAHENDRA SHETHCompany Secretary
Cash Flow Statement for the
CHANGE THE WAY WE CHANGE

Notes to Financial Statement for the
YEAR ENDED 31ST MARCH 2012 (Rs. in Lacs)
Current Year31st March 2012
Previous Year31st March 2011
NOTE 1: SHARE CAPITAL
AUTHORISED CAPITAL
1,00,00,000 Equity Shares Of Rs. 10/- Each
ISSUED, SUBSCRIBED AND PAID UP
69,50,300 (P.Y. 69,50,300) Equity Shares of Rs. 10/- each
TOTAL
1,000.00
695.03
695.03
1,000.00
695.03
695.03
Terms/rights attached to Equity Shares: The company has only one class of equity shares having par value of Rs. 10. Each holder of equity shares is entitled to one vote per share. The compnay delcares and pays dividend in Indian Rupees. The dividend proposed by the Board of Directors is subject to the approval of the shareholders in the ensuing annual general meeting.
During the year ended 31st March 2012, the amount of per share dividend recognised as distributions to equity shareholders was Rs. 5.00 (31st March 2011 Rs. 4.50)
In the event of liquidation of the company, the holders of the equity shares will be entitled to reecive remaining assets of the company, after distribution of all preferential amounts. The distribution will be in proportion to the number of equity shares held by the shareholders.
Opening as on 1st April
Add: Issued during the year
Less: Forfeited during the year
Closing as on 31st March
Details of Shareholders Holding More Than 5% of the Total Share Capital:
No. of shares as on 31st March 2012
No. of shares as on 31st March 2011
Sarladevi JhunjhunwalaSatidham Industries Private LimitedHindustan Cotton Company - Through its Partners
3,88,40012,41,05321,16,47937,45,932
3,88,40012,41,05321,16,47937,45,932
31st March 2012No of shares
31st March 2011No of shares
69,50,300
—
—
69,50,300
69,50,300
—
—
69,50,300
NOTE 2: RESERVES AND SURPLUS
CAPITAL RESERVES
Balance as per last balance sheet
Add: Capital subsidy
GENERAL RESERVE
Balance as per last balance sheet
Add: Transferred from profit & loss account
SURPLUS
Balance as per last balance sheet
Add: Profit for the period
Less: Appropriations:
Transferred to General reserve
Proposed Dividend
Tax on Dividend
Closing balance in statement of profit & loss
TOTAL
182.40
11.68
194.08
3,174.38
300.00
3,474.38
4,407.56
1,092.52
300.00
347.52
56.38
4,796.18
8,464.64
182.40
—
182.40
2,874.38
300.00
3,174.38
3,831.60
1,240.67
300.00
312.76
51.95
4,407.56
7,764.34
28
Name of the Shareholder
Reconciliation of Outstanding Shares
SARLA PERFORMANCE FIBERS LIMITED

29
(Rs. in Lacs)
Current Year31st March 2012
Previous Year31st March 2011
NOTE 3: LONG TERM BORROWING
TERM LOANS:
SECURED LOANS - FROM BANKS
From Andhra Bank Limited
(Exclusive charge on the machinery financed and 'personal guarantee of
managing director)
From Standard Chartered Bank
Foreign Currency Loan
(Exclusive charge on wind turbine generator financed and charge on wind turbine
generator situated at Baradia, Gujarat and personal guarantee of managing
director)
(Total loan of USD 20,00,000) (Repayment to start from June 2012)
(Repayable in 16 equal quarterly installment of USD 1,25,000 each. Rate of
interest is LIBOR plus 375 basis points.
Vehicle Loan - From HDFC Bank Limited
(Exclusive charge on vehicle financed)
TOTAL
NOTE 4: DEFERRED TAX LIABILITY (NET)
On account of depreciation
TOTAL
NOTE 5: SHORT TERM BORROWING
LOANS REPAYABLE ON DEMAND
Secured Loans
From Banks:
Packing Credit Loan
Post Shipment Credit
Foreign Documentary Bill Purchase/Bill Discounting
Buyers Credit
(All the above working capital facilities are secured against all the current assets
(present and future) of the company).
(These facilities are further secured by first charge on the fixed assets of the
company except the assets which are financed through term loan, on which the
consortium working capital facilities lenders will have second charge, except
Wind Turbine Generator and vehicles).
(These facilities are further secured by personal guarantee of Managing Director.)
TOTAL
—
760.20
7.79
767.99
1,122.64
1,122.64
2,754.89
30.60
1,881.67
582.75
5,249.90
4.17
891.90
18.39
914.46
922.39
922.39
1,627.56
113.10
919.45
813.68
3,473.79
CHANGE THE WAY WE CHANGE

Notes to Financial Statement for the
YEAR ENDED 31ST MARCH 2012 (Rs. in Lacs)
Current Year31st March 2012
Previous Year31st March 2011
NOTE 6: TRADE PAYABLES
TRADE PAYABLES
TOTAL
NOTE 7: OTHER CURRENT LIABILITIES
Current maturities of long-term debts
Unpaid dividend
Other Payables:
TDS payable
Sales tax payable
Other statutory dues payable
Excise duty payable
Sundry creditors
Advance from customers
Excess cheques drawn
TOTAL
NOTE 8: SHORT TERM PROVISIONS
FOR EMPLOYEE BENEFITS
Provision for gratuity (refer note 40)
Provision for leave encashment
Provision for bonus
Salaries and wages payable
FOR OTHERS
Provision for dividend
Provision for tax on dividend
Provision for Fringe benefit tax (net)
TOTAL
1,255.04
1,255.04
268.29
23.55
11.75
62.44
0.95
170.00
534.01
336.09
90.18
1,497.28
18.58
1.37
5.08
1.72
26.74
347.52
56.38
1.11
405.01
431.75
1,783.07
1,783.07
226.47
20.29
18.73
215.45
0.94
95.27
466.96
262.22
117.06
1,423.39
14.38
1.74
5.41
1.65
23.18
312.76
51.95
1.11
365.82
389.00
30 SARLA PERFORMANCE FIBERS LIMITED

31
Co
mp
ute
r So
ftw
are
TO
TAL
7.5
2
7.5
2
0.0
0
0.0
0
0.0
0
0.0
0
7.5
2
7.5
2
6.1
2
6.1
2
1.4
1
1.4
1
0.0
0
0.0
0
7.5
2
7.5
2
0.0
0
0.0
0
1.4
1
1.4
1
(R
s. in
Lacs
)N
OTE 1
0:
INTA
NG
IBLE A
SSETS
N
ET C
AR
RY
ING
AM
OU
NT
DEPR
EC
IATIO
NG
RO
SS C
AR
RY
ING
AM
OU
NT
PA
RTIC
ULA
RS
Add
itio
n/ad
just
men
tA
s on
01-0
4-20
11A
s on
31-0
3-20
12D
educ
tion
/ad
just
men
tU
pto
01-0
4-20
11U
pto
31-0
3-20
12Fo
rth
e Ye
arD
educ
tion
As
on31
-03-
2012
As
on31
-03-
2011
Freeh
old
Lan
d
Fact
ory
Bu
ildin
g
Pla
nt
an
d M
ach
inery
Ele
ctri
cal In
stallati
on
s
Off
ice E
qu
ipm
en
t
Co
mp
ute
rs
Veh
icle
s
Furn
itu
re &
Fix
ture
Win
d T
urb
ine G
en
era
tor
(#)
Oth
er
Fixe
d A
ssets
TO
TAL
76
.73
1,4
97
.61
6,4
05
.87
34
2.6
4
25
.29
54
.38
10
6.1
9
26
.81
1,8
58
.46
57
.05
10
,45
1.0
2
0.0
0
27
8.2
1
54
2.4
8
27
.59
3.1
8
1.5
9
13
.48
14
.86
12
1.7
0
17
.35
1,0
20
.44
0.0
0
0.0
0
14
3.1
8
0.0
0
0.0
0
0.0
0
0.0
0
0.0
0
0.0
0
0.0
0
14
3.1
8
76
.73
1,7
75
.83
6,8
05
.17
37
0.2
2
28
.48
55
.97
11
9.6
7
41
.67
1,9
80
.16
74
.40
11
,32
8.2
9
0.0
0
22
6.1
0
2,7
19
.97
14
9.7
8
9.1
4
49
.40
27
.97
10
.21
33
.88
20
.41
3,2
46
.87
0.0
0
55
.78
50
1.0
7
26
.87
1.3
0
2.3
4
10
.60
2.1
7
98
.13
4.4
9
70
2.7
4
0.0
0
0.0
0
46
.77
0.0
0
0.0
0
0.0
0
0.0
0
0.0
0
0.0
0
0.0
0
46
.77
0.0
0
28
1.8
8
3,1
74
.28
17
6.6
5
10
.43
51
.73
38
.58
12
.38
13
2.0
1
24
.90
3,9
02
.85
76
.73
1,4
93
.94
3,6
30
.88
19
3.5
8
18
.04
4.2
4
81
.09
29
.29
1,8
48
.15
49
.49
7,4
25
.44
76
.73
1,2
71
.51
3,6
85
.89
19
2.8
6
16
.16
4.9
8
78
.21
16
.60
1,8
24
.58
36
.63
7,2
04
.15
(R
s. in
Lacs
)N
OTE 9
: TA
NG
IBLE A
SSETS
N
ET C
AR
RY
ING
AM
OU
NT
DEPR
EC
IATIO
NG
RO
SS C
AR
RY
ING
AM
OU
NT
PA
RTIC
ULA
RS
Add
itio
n/ad
just
men
tA
s on
01-0
4-20
11A
s on
31-0
3-20
12D
educ
tion
/ad
just
men
tU
pto
01-0
4-20
11U
pto
31-0
3-20
12Fo
rth
e Ye
arD
educ
tion
As
on31
-03-
2012
As
on31
-03-
2011
(#)
Ad
dit
ion
in
clu
des
loss
of
Rs.
12
1.7
0 L
acs
on
rein
state
men
t o
f fo
reig
n c
urr
en
cy lo
an
taken
to
acq
uir
e t
he a
sset.
Fo
r d
eta
ils r
efe
r n
ote
28
CHANGE THE WAY WE CHANGE

Notes to Financial Statement for the
YEAR ENDED 31ST MARCH, 2012 (Rs. in Lacs)
Current Year31st March 2012
Previous Year31st March 2011
NOTE 11: NON-CURRENT INVESTMENT
(Valued at cost unless otherwise stated)
TRADE:
INVESTMENT IN EQUITY SHARES:
In susidiary company:
Sarla Overseas Holdings Limited (4,35,000 Shares of USD 1.00 each)
(Aggregate amount of Unquoted investment)
(Provision made for diminution of investment)
NOTE 12: LONG-TERM LOANS AND ADVANCE
(Unsecured, considered good)
Capital advances
Security deposits (#)
Other loans and advance
(#) Includes deposit of Rs. 2,25,00,000 given to Hindustan Cotton Company)
NOTE 13: CURRENT INVESTMENT
(Valued at cost or market value, whichever is lower)
Investment in mutual funds
HDFC Cash Management Fund - Treasury Advantage Plan - Weekly Dividend -
Reinvestment
(10,60,488.11 units, NAV as on 31.03.2012 Rs. 10.0396, PY Rs. Nil)
LIC Nomura FMP series - Growth Plan
(4,00,000 units, NAV as on 31.03.2012 Rs. 10.00, PY Rs. Nil)
(Aggregate amount of Unquoted investment)
(Provision made for diminution in value of investment)
NOTE 14: INVENTORIES
(As taken, valued and certified by the Management)
Raw Materials
Work-In -Progress
Finished Goods
Stores and Spares
Oil & Lubricant
Power & Fuel
Packing Materials
183.22
183.22
183.22
—
18.15
325.24
452.54
795.93
106.32
40.00
146.32
146.32
1,451.64
969.64
1,286.30
53.25
12.32
1.16
56.18
3,830.48
183.22
183.22
183.22
—
223.94
109.25
444.24
777.43
—
—
—
—
1,687.87
585.27
896.76
23.13
33.80
3.97
53.98
3,284.79
32 SARLA PERFORMANCE FIBERS LIMITED

33
(Rs. in Lacs)
Current Year31st March 2012
Previous Year31st March 2011
NOTE 15: TRADE RECEIVABLES
(Unsecured, considered good)
Outstanding for more than 6 months
Outstanding for less than 6 months
NOTE 16: CASH AND BANK BALANCES
CASH AND CASH EQUIVALENTS:
Balance with banks
Cash on hand
OTHER BANK BALANCES:
Balance in unpaid dividend account
Fixed deposits
[Fixed deposits of Rs. 5,47,94,289 (P.Y. Rs. 5,87,55,900) pledged as margin
money deposit]
NOTE 17: SHORT TERM LOANS AND ADVANCES
Loans and advances to related parties
Unsecured, considered good
Others
Unsecured, considered good
Advance Income Tax (Net of Provisions)
NOTE 18: OTHER CURRENT ASSETS
Entry tax receivable
Interest receivables
674.17
4,094.88
4,769.05
59.25
15.00
74.25
23.55
1,063.60
1,087.16
1,161.41
-0.73
—
-0.73
861.61
127.23
988.84
988.11
108.26
76.05
184.31
500.89
3,549.64
4,050.53
181.35
10.95
192.30
20.30
823.76
844.06
1,036.36
1.37
—
1.37
465.56
167.93
633.49
634.86
160.42
32.29
192.71
CHANGE THE WAY WE CHANGE

Notes to Financial Statement for the
YEAR ENDED 31ST MARCH, 2012 (Rs. in Lacs)
Current Year31st March 2012
Previous Year31st March 2011
NOTE 19: REVENUE FROM OPERATIONS
A) Sale of Products/ Services:
Local Sales
Export Sales
Deemed Export Sales
Trading Sales
Sale of Wind Power
B) Other Operating Revenues:
Export benefits
Sale of Waste yarn
REC income
Details of products sold:
Polyester, Polyamide (Nylon), Texturised, Twisted, Dyed, Medium/ High Tenacity
Nylon /Flat Yarns, Nylon /Monofilament Yarns, Polyester /Nylon, Spandex /Lycra
Yarn & Dyed Synthetics Yarn.
Plastic scrap and Prime Propylene
Wind Power
TOTAL
NOTE 20: OTHER INCOME
Dividend Income on Current investments
Net gain on sale of long term investments
Profit on sale of fixed assets
Exchange rate difference (Net)
Rent received
Duty drawbak
Miscellaneous Income
NOTE 21: COST OF MATERIALS CONSUMED
Inventory at the begnining of the year
Add: Purchase
Less: Inventory at the end of the year
Cost of materials consumed
5,703.02
11,106.67
713.65
791.86
303.66
18,618.86
63.17
21.71
35.79
120.67
18,739.53
17,523.34
791.86
303.66
18,618.86
3.14
—
30.97
—
—
96.24
13.91
—
144.26
1,687.87
9,882.44
11,570.31
1,451.64
10,118.67
6,599.89
8,759.64
688.32
358.47
91.78
16,498.10
52.50
41.11
—
93.61
16,591.71
16,047.85
358.47
91.78
16,498.10
—
25.38
1.57
76.30
21.60
—
-0.01
—
124.84
1,267.30
9,267.12
10,534.42
1,687.87
8,846.55
34 SARLA PERFORMANCE FIBERS LIMITED

35
(Rs. in Lacs)
Current Year31st March 2012
Previous Year31st March 2011
Details of materials consumed:
Polyester partially Oriented Yarn (POY), Nylon/ Polyester Filament/ Textured/
Twisted/ Nylon Chips/ Spandex/ Rubber/ Lycra.
Dyed & Chemical Consumed
TOTAL
Details of inventory:
Raw materials
Inventory at the begnining of the year:
Nylon/ polyester/ lycra/ spandex/ rubber and chips
Dyed & chemicals
Inventory at the end of the year:
Nylon/ polyester/ lycra/ spandex/ rubber and chips
Dyed & chemicals
NOTE 22: (INCREASE)/ DECREASE IN INVENTORIES
Inventories at the end of the year:
Work-in-progress
Finished goods
Inventories at the beginning of the year:
Work-in-progress
Finished goods
Details of purchase of traded goods:
Prime Propylene
Plastic Scrap
Details of inventory at the end:
Work-in-progress
Nylon
Polyster
Finished goods
Polyester
Nylon
Covered Yarn
RNC
NFY
Others
9,906.21
212.46
10,118.67
1,652.08
35.79
1,687.87
1,312.96
138.68
1,451.64
969.64
1,286.30
2,255.94
585.27
896.76
1,482.03
-773.90
381.13
388.92
770.05
456.59
513.05
969.64
574.76
422.05
200.19
22.88
55.03
11.38
1,286.30
8,541.68
304.87
8,846.55
1,235.26
32.04
1,267.30
1,652.08
35.79
1,687.87
585.27
896.76
1,482.03
377.03
611.19
9,88.22
-493.81
—
345.01
345.01
361.01
224.26
585.27
258.18
357.07
181.19
5.57
93.50
1.25
896.76
CHANGE THE WAY WE CHANGE

Notes to Financial Statement for the
YEAR ENDED 31ST MARCH, 2012 (Rs. in Lacs)
Current Year31st March 2012
Previous Year31st March 2011
NOTE 23: EMPLOYEE BENEFIT EXPENSES
Salaries, wages and bonus
Contribution to provident and other funds
Staff welfare expenses
NOTE 24: FINANCE COSTS
Interest expenses
Less: Interest income on bank deposits
Net interest expenses
Bank charges
NOTE 25: OTHER EXPENSES
Manufacturing expenses:
Consumption of stores and spare parts
Power and fuel
Consumption of packing materials
Consumption of oils and chemicals
Labour charges
Clearing and forwarding charges
Repairs and Maintenance:
Building
Machinery
Excise duty expenses (#)
Water, waste and effulient treatment charges
Administrative and selling expenses:
Rent
Repairs and Maintenance - Others
Insurance
Rates and taxes
Director sitting fees
Legal and professional fees
Miscellaneous expenses
Excahnge difference (net)
Payment to auditor:
As auditors:
Audit fee
Limited review
In other capacity:
Other services (certification fees)
Freight and forwarding charges
Commission on sales
Bad debts written off
Transmission charges
Sales tax assessment dues
344.13
31.97
41.36
417.47
185.08
92.05
93.03
176.67
269.69
218.21
1,163.88
772.98
280.14
773.16
187.61
12.96
34.08
110.36
35.56
8.25
30.03
24.08
5.30
0.65
41.75
307.66
167.38
6.75
0.30
0.30
840.85
221.17
20.31
13.52
16.92
5,294.17
303.13
25.05
29.06
357.24
128.31
57.23
71.08
113.58
184.66
281.29
935.52
755.72
219.07
615.41
212.43
26.60
73.49
28.12
34.29
5.00
29.48
26.08
38.06
0.24
29.57
219.54
—
5.75
0.30
0.20
710.78
142.98
33.47
14.27
—
4,437.65
# Excise duty expenses includes excise duty borne by the company and variation in excise duty on closing stock of finished goods
36 SARLA PERFORMANCE FIBERS LIMITED

37
NOTE 26: SIGNIFICANT ACCOUNTING POLICIES
ACCOUNTING CONVENTION: The Accounts are prepared on
accrual basis under the historical cost convention except for certain
fixed assets which are revalued in accordance with applicable
accounting standards and relevant provisions of the Companies
Act, 1956.
USE OF ESTIMATES: The preparation of financial statements in
conformity with the generally accepted accounting principles
requires estimates and assumptions to be made that affect the
reported amount of assets and liabilities on the date of the
financial statements and the reported amount of revenues and
expenses during the reporting period. Difference between the
actual result and estimates are recognised in the period in which the
results are known/materialized.
FIXED ASSETS: Fixed Assets including intangible assets are stated
at cost net of cenvat / value added tax and includes amount added
on revaluation less accumulated depreciation and impairment loss,
if any. All Cost is inclusive of Freight, Duties, (net of tax credits as
applicable) levies and any directly attributable cost till
commencement of commercial production. Adjustments arising
from Exchange Rate variations attributable to the Fixed Assets are
capitalised.
IMPAIRMENT OF ASSETS: Impairment is ascertained at each
balance sheet date in respect of Cash Generating Units.
An impairment loss is recognized whenever the carrying amount of
an asset exceeds its recoverable amount. The recoverable amount is
the greater of the net selling price and value in use. In assessing
value in use, the estimated future cash flows are discounted to their
present value based on an appropriate discount factor.
DEPRECIATION & AMORTISATION: Depreciation on fixed assets is
provided as per the straight line method (SLM) at the rate and in the
manner prescribed in schedule XIV of the Companies act, 1956 on
prorata basis. Fixed Assets are capitalized at cost inclusive of
expenses and interest wherever applicable.
Intangible Assets are amortized over their respective individual
estimated useful life on a straight line basis commencing from the
year the asset is available to the company for its use, not exceeding
five years.
INVESTMENTS: Non current investments are stated at cost.
Provision for diminution in the value of non current investment is
made only if, such a decline is other than temporary in the opinion
of management. Current Investments are carried at lower of cost
and fair value.
INVENTORIES:
A. Raw Materials and General Stores are valued at cost or
realisable value, whichever is less, excluding Cenvat and VAT credit,
by FIFO method.
B. Work in Process is valued at raw-material cost or
realisable value, whichever is less plus estimated overheads, but
excluding Cenvat and VAT.
C. Finished Goods are valued at cost including estimated
overheads or net realisable value, whichever is less. The value
includes excise duty paid/payable on such goods.
EXCISE DUTY & CENVAT CREDIT: Excise Duties wherever recovered
are included in Sales and shown separately in financial statement as
deduction from sales. Excise duty provision made in respect of
finished goods lying at factory premises are shown separately as
an item of manufacturing and other expenses and included in the
valuation of finished goods. Cenvat credit available on purchases
of service / materials / capital goods is accounted by reducing cost of
services / materials / capital goods. Cenvat credit availed of is
accounted by way of adjustment against excise duty payable on
dispatch of finished goods.
PROVISIONS, CONTINGENT LIABILITIES AND CONTINGENT
ASSETS: A provision is recognized when an enterprise has a present
obligation as a result of past events and it is probable that an outflow
of resources will be required to settle the obligation, in respect of
which a reliable estimate can be made. Provisions are determined
based on management estimate required to settle the obligation at
the balance sheet date. These are reviewed at each balance sheet
date and adjusted to reflect the current management estimates.
Contingent Assets are neither recognised nor disclosed in the
financial statements. Contingent liabilities are not recognised but
are disclosed by way of note on the balance sheet. Provision is made
in the accounts for those liabilities which are likely to materialise
after the year end till the finalisation of accounts and having effect
on the position stated in the balance sheet as at the year end.
FOREIGN EXCHANGE TRANSACTION:
A: Transactions entered into and those settled during the
year in foreign currency are recorded at the actual exchange rates
prevailing at the time of the transactions.
B: Foreign currency transactions remaining unsettled at the
year end and not covered by forward contract are translated at the
exchange rates prevailing at the year end.
C: In case of item which are covered by forward exchange
contract, the difference between the year end rate and rate on the
date of the contract is recognised as exchange difference and the
premium paid on forward contract is recognised over the life of the
contracts. Forward exchange contracts outstanding as at year end
are calculated at the year end rate and mark to market profit/loss is
dealt in the Profit & Loss Account.
REVENUE RECOGNITION:
A: Sales are recognized, net of returns and trade discounts,
on dispatch of goods to customers and are reflected in the
accounts at gross realizable value i.e. inclusive of excise duty. Inter-
unit sales/ purchases have been eliminated during the year. In case
of export sales, revenue is recognised when the risk and reward on
the goods is transferred to the customers.
CHANGE THE WAY WE CHANGE

E: The actuarial gain and losses arising during the year are
recognized in the profit and loss account of the year without
restoring to any amortization.
BORROWING COST: Borrowing cost that attributes to the
acquisition or construction of qualifying assets are capitalised as
part of the cost of such assets. A qualifying asset is one that
necessarily takes substantial period of time to set ready for
intended use. All other borrowing cost are charged to revenue.
PROPOSED DIVIDEND: Dividend proposed by the Board of
Directors is provided for in the accounts pending approval at the
Annual General Meeting.
NOTE 27: CONTINGENT LIABILITIES NOT PROVIDED FOR AND
CAPITAL COMMITMENTS
A. CONTINGENT LIABILITIES
1. Letter of credit: Letter of Credit issued by Banks on
behalf of the Company Rs. 2,493.31 Lacs (P.Y. Rs. 3,345.71 Lacs),
these are covered by the Charge created in favour of the
Company’s Bankers by way of Hypothecation of Stocks, Receivable
& Machineries/Assets of the Company.
2. Guarantees: Bank Guarantees issued by Banks on
behalf of the company Rs. 371.68 Lacs (P.Y. Rs. 361.69 Lacs). These
are secured by the charge created in favour of the company’s
bankers by way of pledge of Fixed Deposit Receipts.
3. The claim against Company not acknowledged as
debt, comprises of excise duty & Custom duty disputed by company
relating to issue of applicability of duty and classification of goods
aggregating to Rs. 2,201.97 Lacs (P.Y. Rs. 1,891.72 Lacs).
4. Bill discounted not matured Rs. 2007.36 Lacs (P.Y.
Rs. 1022.5 Lacs).
The contingent liabilities in respect of Bank Guarantees
and other matters arising in the ordinary course of business
from which it is anticipated that no material liabilities will arise.
5. CST liability in respect of invoice amount of Rs.
3069.57 Lacs (P.Y. Rs. 2518.59) for which C-Form are yet to be
collected from the customers.
6. Liability of Income Tax with respect to which appeal is
pending before ITAT amounting to Rs. 13.17 Lacs for A.Y. 2003-04,
and appeals pending before CIT Appeal for Rs. 6.28 Lacs for A.Y.
2009-10
B. CAPITAL COMMITMENTS
Estimated amounts of contracts remained to be executed
on capital account net of advance at the end of the year Rs. 18.14
Lacs (P.Y. Rs. 59.91 Lacs).
Notes to Financial Statement for the
YEAR ENDED 31ST MARCH, 2012
B: In appropriate circumstances, Revenue (Income) is
recognised when no significant uncertainty as to Measurability or
collectability exists. Export benefits/incentives are accounted on
accrual basis.
C: Interest income is recognised on time proportionate
method.
D: Dividend is accrued in the year in which it is declared
whereby a right to receive is established.
TAXATION:
A: Provision for current taxation is made for the current
accounting period (reporting period) on the basis of the taxable
profits computed in accordance with Income Tax Act 1961 for
the relevant assessment year.
B: Deferred Tax resulting from "timing differences" between
book and tax profits is accounted for under the liability method,
at the current rate of tax and tax laws that have been enacted or
substantively enacted at the Balance Sheet date, to the extent that
the timing differences are expected to crystalise, as deferred tax
charge / benefit in the Profit and Loss Account and as deferred
tax asset or liabilities in the Balance Sheet. The deferred tax assets is
recognised and carried forward only to the extent that there is a
virtual certainity that the assets will be realised in the future.
EMPLOYEE RETIREMENT BENEFITS:
A: Defined Contribution Plans: The company has defined
contribution plan for Post -employment benefits in the form of
Provident fund for all eligible employees; which is administered by
the Regional Provident Fund Commissioner. Provident Fund is
classified as defined contribution plan as the Company has no
further obligation beyond making contribution. The Company's
contribution to Defined Contribution Plan is charged to the Profit
and Loss Account as and when incurred.
B: Defined Benefits Plans: Funded Plan: The company has
a Defined Benefits Plan for Post employment benefits in the form of
gratuity for all employees and the liability for the defined benefit
plan of Gratuity is determined on the basis of actuarial valuation by
an independent actuary at the year end, which is calculated using
projected unit credit method. Actuarial gains and losses which
comprise experience adjustment and the effect of changes in
actuarial assumptions are recognised in the Profit and Loss
Account.
C : Leave Liability (Long Term Employee Benefits) : The
Employees of the company are entitled to leave encashment which
is encashed annually as per the leave policy of the company. Liability
for compensated absences (Unutilised leave benefit) is provided on
the basis of valuation, as at the Balance Sheet date, carried out by
an independent actuary.
D: Termination Benefit are recognized as an expenses as and
when incurred.
38 SARLA PERFORMANCE FIBERS LIMITED

NOTE 28:
The company has exercised option given in Companies (Accounting
Standard) Amendment Rules 2009 on Accounting Standard 11
issued by ICAI which was notified by MCA regarding accounting of
exchange rate difference related to foreign currency loan utilised
for acquisition of fixed assets by way of notification no. GSR 225(E)
dated 31.03.2009 read with notification no. GSR 913(E) dated
29.12.2011. On exercise of option referred above, foreign
exchange loss of Rs. 121.70 lacs is capitalised during the year.
NOTE 29: DEPRECIATION
A : The depreciation for the year has been provided on
"straight line method"as per Section 205 (2) of the Companies Act,
1956 at the rates prescribed in schedule XIV thereto.
B: Depreciation on additions / disposals of the fixed assets
during the year is provided on pro-rata basic according to the
period during which assets are put to use.
C: Intangible assets represents the cost of computer
software acquired for internal use, to be amortized equally over five
years based upon their estimated useful lives.
NOTE 30:
The company has invested USD 4,35,000 equivalent to
Rs. 183.22 Lacs for 100% share being 4,35,000 shares of Sarla
Overseas Holding Limited registered at British Virgin Islands as a
result the said company is Wholly Owned Subsidiary of the
Company.
39
(Rs. in Lacs)
(Rs. in Lacs)NOTE 32: STORES AND SPARES CONSUMED
Imported
Indigenous
TOTAL
28.90
189.31
218.21
13.24
86.76
100.00
43.88
237.41
281.29
15.60
84.40
100.00
Current Year Previous Year
Amount Amount% of Consumption % of Consumption
Imported
Indigenous
TOTAL
6,554.76
3,563.90
10,118.66
64.78
35.22
100.00
6,163.17
2,683.38
8,846.55
69.67
30.33
100.00
Current Year Previous Year
Amount Amount% of Consumption % of Consumption
(Rs. in Lacs)NOTE 33: C.I.F. VALUE OF IMPORTS
Capital Goods
Raw Materials
Trading Goods
Stores, packing materials and consumables
309.90
6,158.59
388.92
191.22
48.11
6,537.01
345.01
194.11
Current Year Previous Year
(Rs. in Lacs)NOTE 34: EXPENDITURE IN FOREIGN CURRENCY
Travelling
Commission on export sales
Interest
45.83
67.81
71.16
42.50
59.88
—
Current Year Previous Year
(Rs. in Lacs)NOTE 35: EARNINGS IN FOREIGN CURRENCY
F.O.B. value of exports 10,398.97 8,106.11
Current Year Previous Year
NOTE 36:
Managing Director’s remuneration is Rs. 42.00 Lacs (P.Y. Rs. 39.00
Lacs) & the whole time Director's remuneration is Rs. 34.00 Lacs ( P.Y.
Rs.27.00 Lacs) is in accordance with section 198 schedule XIII of the
Companies Act. 1956.
NOTE 37: TAXATION
Provision for taxation for the current year has been made, taking
into consideration benefits admissible under the provisions of the
Income Tax Act, 1961.
In accordance with AS-22 issued by the Institute of Chartered
Accountants of India on 'Accounting of Taxes on Income' net
deferred tax expenses on account of timing difference for current
year is Rs. 200.25 lacs (P.Y. Rs. 269.12 lacs) which is charged to profit
and loss account.
NOTE 31: RAW MATERIALS CONSUMED
CHANGE THE WAY WE CHANGE
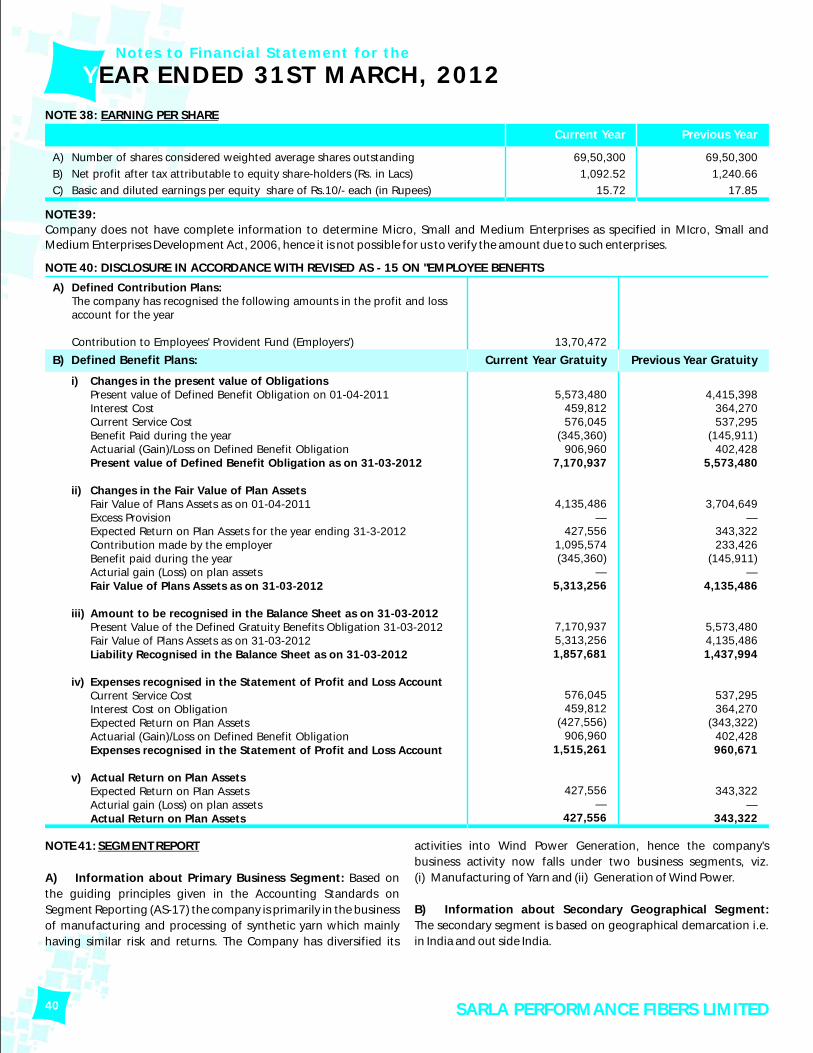
Notes to Financial Statement for the
YEAR ENDED 31ST MARCH, 2012
NOTE 39:
Company does not have complete information to determine Micro, Small and Medium Enterprises as specified in MIcro, Small and
Medium Enterprises Development Act, 2006, hence it is not possible for us to verify the amount due to such enterprises.
A) Number of shares considered weighted average shares outstanding
B) Net profit after tax attributable to equity share-holders (Rs. in Lacs)
C) Basic and diluted earnings per equity share of Rs.10/- each (in Rupees)
69,50,300
1,092.52
15.72
69,50,300
1,240.66
17.85
Current Year Previous Year
NOTE 40: DISCLOSURE IN ACCORDANCE WITH REVISED AS - 15 ON "EMPLOYEE BENEFITS
A) Defined Contribution Plans:The company has recognised the following amounts in the profit and lossaccount for the year
Contribution to Employees' Provident Fund (Employers')
i) Changes in the present value of ObligationsPresent value of Defined Benefit Obligation on 01-04-2011Interest CostCurrent Service CostBenefit Paid during the yearActuarial (Gain)/Loss on Defined Benefit ObligationPresent value of Defined Benefit Obligation as on 31-03-2012
ii) Changes in the Fair Value of Plan AssetsFair Value of Plans Assets as on 01-04-2011Excess ProvisionExpected Return on Plan Assets for the year ending 31-3-2012Contribution made by the employerBenefit paid during the yearActurial gain (Loss) on plan assetsFair Value of Plans Assets as on 31-03-2012
iii) Amount to be recognised in the Balance Sheet as on 31-03-2012Present Value of the Defined Gratuity Benefits Obligation 31-03-2012Fair Value of Plans Assets as on 31-03-2012Liability Recognised in the Balance Sheet as on 31-03-2012
iv) Expenses recognised in the Statement of Profit and Loss AccountCurrent Service CostInterest Cost on ObligationExpected Return on Plan AssetsActuarial (Gain)/Loss on Defined Benefit ObligationExpenses recognised in the Statement of Profit and Loss Account
v) Actual Return on Plan AssetsExpected Return on Plan AssetsActurial gain (Loss) on plan assetsActual Return on Plan Assets
5,573,480 459,812 576,045
(345,360) 906,960
7,170,937
4,135,486 —
427,556 1,095,574 (345,360)
— 5,313,256
7,170,937 5,313,256 1,857,681
576,045 459,812
(427,556) 906,960
1,515,261
427,556 —
427,556
4,415,398 364,270 537,295
(145,911) 402,428
5,573,480
3,704,649 —
343,322 233,426
(145,911) —
4,135,486
5,573,480 4,135,486 1,437,994
537,295 364,270
(343,322) 402,428 960,671
343,322 —
343,322
Current Year Gratuity Previous Year Gratuity
13,70,472
40
NOTE 38: EARNING PER SHARE
B) Defined Benefit Plans:
NOTE 41: SEGMENT REPORT
A) Information about Primary Business Segment: Based on
the guiding principles given in the Accounting Standards on
Segment Reporting (AS-17) the company is primarily in the business
of manufacturing and processing of synthetic yarn which mainly
having similar risk and returns. The Company has diversified its
activities into Wind Power Generation, hence the company's
business activity now falls under two business segments, viz.
(i) Manufacturing of Yarn and (ii) Generation of Wind Power.
B) Information about Secondary Geographical Segment:
The secondary segment is based on geographical demarcation i.e.
in India and out side India.
SARLA PERFORMANCE FIBERS LIMITED

41
(Rs. in Lacs)
* Trading Sales is High Seas Sales # Capital expenditure is on account of foreign currency fluctuation
NOTE 42: RELATED PARTY TRANSACTIONS
The Company has identified following related parties with whom
transactions have taken place during the year:
1) Associates
M/s Satidham Industries Private Ltd.
M/s Hindustan Cotton Co.
M/s. Shivchandrai Jhunjhunwala & Co.
2) Key Management Personnel
Madhusudan Jhunjhunwala - Chairman
Krishna Jhunjhunwala - Managing Director
3) Joint Ventures of Subsidiary Company
Savitex SA De C.V., Honduras
MRK SA De C.V., Honduras
Sarla Tekstil Filament Sanayi Ticaret A.S.
4) Subsidiary Companies
M/s Sarla Overseas Holding Ltd.
5) Subsidiary of subsidiary Company
M/s Sarla Europe, Lda
Current YearParticulars Previous Year
In India TotalOutside India
5,904.56
791.86
339.44
7,035.86
19,484.27
1,644.83
8,758.86
1,565.75
1,020.44
121.70
In India TotalOutside India
11,169.84
11,169.84
—
—
—
—
—
—
17,074.40
791.86
339.44
18,205.70
19,484.27
1,644.83
8,758.86
1,565.75
1,020.44
121.70
6,606.30
358.47
91.78
7,056.56
17,365.45
1,426.24
7,495.44
1,410.65
727.69
1,225.00
8,812.14
—
—
8,812.14
—
—
—
—
—
—
15,418.44
358.47
91.78
15,868.70
17,365.45
1,426.24
7,495.44
1,410.65
727.69
1,225.00
Segment Revenue (Gross)
Yarn:
Manufacturing:
Trading:*
Generation of Wind Power
Segment Assets
Yarn
Generation of Wind Power
Segment Liabilities
Yarn
Generation of Wind Power
Capital Expenditure
Yarn
Generation of Wind Power #
C) Information about primary and secondary segments are follows:
Number of 'Buy' ContractsAggregate Currency Amount (In Rs. Lacs)Number of 'Sell' ContractsAggregate Currency Amount (In Rs. Lacs)
Currency ExchangeSr. No.
1234
NILNIL28
2,483.32
NOTE 43: DERIVATIVE INSTRUMENTS
The Company uses forward exchange contracts to hedge against its
foreign currency exposures relating to the underlying transactions
and firm commitments. The Company does not enter into any
derivative instruments for trading or speculative purposes.
CHANGE THE WAY WE CHANGE
5.00
—
—
112.70
112.70
—
—
225.00
—
—
—
—
—
—
—
76.00
—
—
—
—
—
—
—
—
—
—
—
—
156.01
75.96
—
—
183.22
—
—
—
29.58
—
1,094.06
154.49
5.00
—
—
—
—
—
—
—
—
—
—
—
—
—
—
66.00
—
—
—
—
—
—
—
—
—
—
—
—
201.98
43.80
—
149.85
183.22
—
—
—
—
—
866.83
278.73
Rent paid
Unsecured Loan Received Back
Investment In Shares
Unsecured Loan Taken
Unsecured Loan Repaid
Managerial Remuneration
Advance Received
Security Deposit
Sale of Goods
Debtors
Note: Related party relationship is as identified by the Company and relied upon by the Auditors.
(Rs. in Lacs)
Subsidiary Co.Joint VenturesKey ManagementPersonnel
AssociatesEnterprises
CurrentYear
PreviousYear
CurrentYear
PreviousYear
CurrentYear
PreviousYear
CurrentYear
PreviousYear
Details of transactions with above related parties:

42
NOTE 44:
The company is of the view that there are no indications of material
impairment and the carrying amount of its fixed assets or where
applicable, the cash generating unit to which these assets belong,
do not exceed their recoverable amounts (i.e., the higher of the
assets’ net selling price and value in use). Hence, no impairment had
arisen during the year as per the recommendations of the
Accounting Standard - 28 on Impairment of Assets.
NOTE 45:
In the opinion of the Management, the Current Assets and Loans
and Advances as shown in the books are expected to realise at their
Book Value in the normal course of business and adequate
provision have been made in respect of all known liabilities.
NOTE 46:
Certain balances under the heads Sundry Debtors, Loans &
Advances and Sundry Creditors are subject to confirmations from
the respective parties and consequential reconciliation, if any.
NOTE 47:
Till the year ended 31st March 2011, the company was using pre-
revised schedule VI to the Companies Act, 1956, for preparation
and presentation of its financial statements. During the year ended
31st March 2012, the revised Schedule VI notified under the
Companies Act, 1956 has become applicable to the company. The
company has reclassified previous year figures to conform to this
year’s classification.
As per our annexed reportFor SUNDARLAL, DESAI & KANODIAChartered Accountants
H. P. KANODIAPartnerMembership No. 40617Place : MumbaiDate : 29th May, 2012
FOR AND ON BEHALF OF BOARD OF DIRECTORS
MADHUSUDAN S. JHUNJHUNWALAChairman
KRISHNAKUMAR M. JHUNJHUNWALAManaging Director
MAHENDRA SHETHCompany Secretary
Notes to Financial Statement for the
YEAR ENDED 31ST MARCH, 2012
SARLA PERFORMANCE FIBERS LIMITED

43
certified by the management, and our opinion on the consolidated
financial statements to the extent they have been derived from such
financial statements is based solely on such unaudited financial
statements received from the companies and certified by the
management.
5) We report that the consolidated financial statements have
been prepared by the company in accordance with the
requirements of Accounting Standard 21 on 'Consolidated
Financial Statements' and Accounting Standard 27 on 'Financial
Reporting of Interest in Joint Ventures' issued by the Institute of
Chartered Accountants of India and on the basis of the separate
audited financial statements of the company included in the
consolidated financial statements.
6) We report that on the basis of the information and according
to the explanations given to us, and on the consideration of the
separate audit report on individual audited financial statements of
the Sarla Group, we are of the opinion that the attached
Consolidated Financial Statement, read together with significant
accounting policies and notes thereon, give a true and fair view in
conformity with the accounting principles generally accepted in
India.
A. In case of the Consolidated Balance Sheet, of the
consolidated state of affairs of the company as at 31st March, 2012.
B. In the case of the Consolidated Statement of Profit and
Loss, of the consolidated results of operations of the company for
the year then ended; and
C. In the case of Consolidated Cash flow statements of the
consolidated cash flows of the company for the year then ended on
that date.
For
Chartered Accountants
Registration Number - 110560W
H. P. KANODIA
Partner
Membership No. 40617
SUNDARLAL, DESAI & KANODIA
CONSOLIDATED AUDITORS’ REPORT
TO THE BOARD OF DIRECTORS OF SARLA PERFORMANCE FIBERS
LIMITED ON THE CONSOLIDATED FINANCIAL STATEMENTS OF
SARLA PERFORMANCE FIBERS LIMITED
1) We have audited the attached consolidated Balance Sheet of
M/s. Sarla Performance Fibers Limited, Mumbai along-with its
wholly owned subsidiary company (the company) as at 31st March,
2012 and also related Consolidated Statement of Profit and Loss
and the Cash Flow Statement for the year ended on that date.
2) These financial statements are the responsibility of the
company's management. Our responsibility is to express an opinion
on these consolidated financial statements based on our audit.
3) We conducted our audit in accordance with generally
accepted auditing standards in India. These standards require that
we plan and perform the audit to obtain reasonable assurance
about whether the consolidated financial statements are free of
material misstatements. An audit includes examining, on a test
basis, evidence supporting the amount and disclosures in the
financial statements. An audit also includes assessing the
accounting principles used and significant estimates made by the
management, as well as evaluating the overall financial statement
presentation. We believe that our audit provides a reasonable basis
for our opinion.
4) We have carried out audit of standalone financial statements
of the company and standalone financial statements of its wholly
owned subsidiary company. Consolidated financial statements of
the wholly owned subsidiary company which are considered in
consolidated financial statement of the Sarla Group include
financial statements of its subsidiary and joint venture companies
whose financial statements are unaudited. These financial
statements and other financial information are unaudited and
Place: Mumbai.
Date : 29th May, 2012
CHANGE THE WAY WE CHANGE

44 SARLA PERFORMANCE FIBERS LIMITED
Consolidated
BALANCE SHEET AS AT 31ST MARCH, 2012 (Rs. in Lacs)
Current Year31st March 2012
Previous Year31st March 2011
EQUITY AND LIABILITIES:
1) SHARE HOLDERS FUNDS
Share Capital
Reserves & Surplus
2) NON-CURRENT LIABILITIES
Long-Term Borrowings
Deferred Tax Liabilities (Net)
3) CURRENT LIABILITIES
Short-Term Borrowings
Trade Payables
Other Current Liabilities
Short-Term Provisions
TOTAL
ASSETS:
1) NON-CURRENT ASSETS
Fixed Assets
i) Tangible Assets
ii) Intangible Assets
Long Term Loans and Advances
2) CURRENT ASSETS
Current Investments
Inventories
Trade Receivables
Cash and Cash Equivalents
Short-term Loans and Advances
Other Current Assets
TOTAL
Significant accounting policies and Notes to accounts
Notes referred above forms integral part of the balance sheet
1
2
3
4
5
6
7
8
9
10
11
12
13
14
15
16
17
1 to 38
695.03
11,746.19
12,441.22
1,079.84
1,122.64
2,202.47
5,474.99
2,194.81
1,623.35
431.75
9,724.90
24,368.60
8,232.55
—
964.43
9,196.98
146.32
5,418.76
6,452.83
1,274.27
1,645.44
234.00
15,171.62
24,368.60
695.03
10,132.01
10,827.04
1,059.97
922.39
1,982.36
3,510.02
2,323.95
1,450.77
389.00
7,673.74
20,483.14
7,784.47
1.41
881.31
8,667.19
—
4,377.29
5,080.54
1,351.43
765.49
241.20
11,815.95
20,483.14
Note
As per our annexed reportFor SUNDARLAL, DESAI & KANODIAChartered Accountants
H. P. KANODIAPartnerMembership No. 40617Place : MumbaiDate : 29th May, 2012
FOR AND ON BEHALF OF BOARD OF DIRECTORS
MADHUSUDAN S. JHUNJHUNWALAChairman
KRISHNAKUMAR M. JHUNJHUNWALAManaging Director
MAHENDRA SHETHCompany Secretary

45CHANGE THE WAY WE CHANGE
Consolidated Statement of Profit and Loss for the
YEAR ENDED 31ST MARCH, 2012
As per our annexed reportFor SUNDARLAL, DESAI & KANODIAChartered Accountants
H. P. KANODIAPartnerMembership No. 40617Place : MumbaiDate : 29th May, 2012
FOR AND ON BEHALF OF BOARD OF DIRECTORS
MADHUSUDAN S. JHUNJHUNWALAChairman
KRISHNAKUMAR M. JHUNJHUNWALAManaging Director
MAHENDRA SHETHCompany Secretary
(Rs. in Lacs)
Current Year31st March 2012
Previous Year31st March 2011
INCOME:
Revenue from operations
Less: Excise duty
Other income
EXPENSES:
Cost of materials consumed
Purchase of stock-in-trade
Changes in inventories of finished goods and work-in-
progress
Employee benefit expenses
Finance costs
Depreciation and amortization expenses
Other expenses
PROFIT BEFORE TAX
TAX EXPENSE:
Current tax (MAT)
Less: MAT Credit
Net Current Tax
Deferred tax
Tax adjustment of earlier years
PROFIT FOR THE PERIOD
EARNING PER EQUITY SHARE:
Basic
Diluted
Significant accounting policies and Notes to accounts
Notes referred above forms integral part of the statement
of profit and loss
18
19
20
21
22
23
9 & 10
24
1 to 38
23,892.66
533.81
23,358.85
155.14
23,513.99
11,682.48
2,797.12
-1,273.76
486.02
297.21
804.53
6,371.11
21,164.72
2,349.27
308.54
42.77
265.77
200.25
-8.32
1,891.57
27.22
—
20,024.54
723.01
19,301.53
175.31
19,476.83
9,758.14
1,499.63
-889.12
396.76
189.83
662.28
5,117.04
16,734.56
2,742.27
220.09
—
220.09
269.12
—
2,253.07
32.42
—
Note

46 SARLA PERFORMANCE FIBERS LIMITED
Consolidated Cash Flow Statement for the
YEAR ENDED 31ST MARCH, 2012
Notes :1. The above Cash Flow Statement has been prepared under the “indirect Method” as set out in Accounting Standard - 3 on Cash Flow
Statement issued by the Institute of Chartered Accountants of India.2. Previous year’s figures have been regrouped/rearranged wherever necessary to conform to the current year’s presentations.
This is the Cash Flow statement referred to in our Report of even dateFor SUNDARLAL, DESAI & KANODIAChartered Accountants
H. P. KANODIAPartnerMembership No. 40617Place : MumbaiDate : 29th May, 2012
FOR AND ON BEHALF OF BOARD OF DIRECTORS
MADHUSUDAN S. JHUNJHUNWALAChairman
KRISHNAKUMAR M. JHUNJHUNWALAManaging Director
MAHENDRA SHETHCompany Secretary
(Rs. in Lacs)
Current Year31st March 2012
Previous Year31st March 2011
CASH FLOW FROM THE OPERATING ACTIVITIES
Net Profit Before Tax and Extraordinary items
ADJUSTMENT FOR
Depreciation
Interest Paid
Interest Received
Capital Gain on Sale of Investment/Assets
Dividend Received
Operating Profit Before Working Capital Changes
ADJUSTMENT FOR CHANGES IN WORKING CAPITAL
Trade & Other Receivable
Inventories
Loans & Advances
Trade & Other Payable
Cash Generated From Operations
Prior Period Expenses/Extra Ordinary Items
Income Tax Paid
Deferred Tax Liabilities
Net Cash Flow from Operating Activities (1)
CASH FLOW FROM INVESTING ACTIVITIES
Purchase of Fixed Assets
Purchase Of Investment
Dividend Received
Gain on Sale of Investment/Assets
Sale of Investment
Foreign Exchange Reserve
Interest Received
Net Cash Flow from Investing Activities (2)
Net Cash Flow on Consolidation
CASH FLOW FROM FINANCING ACTIVITIES
Preferential Warrants Issued
Net Fund Raised/(Repayment)
Dividend Paid
Dividend Tax Paid
Interest Paid
Net Cash Raised From Financing Activities (3)
Net Changes in Cash & Cash Equivalent (1+2+3)
Cash And Cash Equivalent - Opening Balance
Cash And Cash Equivalent - Closing Balance
2,742.53
825.33
3,567.86
(1,470.93)
2,096.93
(230.58)
1,866.35
(2,010.48)
(2,010.48)
3.06
536.09
536.09
395.02
956.41
1,351.43
662.28
247.07
(57.23)
(26.79)
—
(777.52)
(1,404.29)
79.75
631.13
—
(230.58)
—
(2,228.24)
—
—
133.74
26.79
—
57.23
—
1,066.82
(243.26)
(40.40)
(247.07)
2,349.27
1,067.63
3,416.90
(3,245.41)
171.49
(254.92)
(83.43)
(1,102.89)
(1,102.89)
1,109.16
1,109.16
(77.16)
1,351.43
1,274.27
804.53
389.27
(92.06)
(30.97)
(3.14)
(1,372.29)
(1,041.46)
(660.40)
(171.26)
—
(254.92)
—
(1,179.14)
(146.32)
3.14
30.97
96.41
—
92.05
—
—
1,863.14
(312.76)
(51.95)
(389.27)

47
Notes to Consolidated Financial Statement for the
YEAR ENDED 31ST MARCH, 2012 (Rs. in Lacs)
Current Year31st March 2012
Previous Year31st March 2011
NOTE 1: SHARE CAPITAL
AUTHORISED CAPITAL
1,00,00,000 Equity Shares Of Rs. 10/- Each
ISSUED, SUBSCRIBED AND PAID UP
69,50,300 (P.Y. 69,50,300) Equity Shares of Rs. 10/- each
TOTAL
1,000.00
695.03
695.03
1,000.00
695.03
695.03
Terms/rights attached to Equity Shares: The company has only one class of equity shares having par value of Rs. 10. Each holder of equity shares is entitled to one vote per share. The compnay delcares and pays dividend in Indian Rupees. The dividend proposed by the Board of Directors is subject to the approval of the shareholders in the ensuing annual general meeting.
During the year ended 31st March 2012, the amount of per share dividend recognised as distributions to equity shareholders was Rs. 5.00 (31st March 2011 Rs. 4.50)
In the event of liquidation of the company, the holders of the equity shares will be entitled to reecive remaining assets of the company, after distribution of all preferential amounts. The distribution will be in proportion to the number of equity shares held by the shareholders.
Opening as on 1st April
Add: Issued during the year
Less: Forfeited during the year
Closing as on 31st March
Details of Shareholders Holding More Than 5% of the Total Share Capital:
No. of shares as on 31st March 2012
Name of the Shareholder No. of shares as on 31st March 2011
Sarladevi JhunjhunwalaSatidham Industries Private LimitedHindustan Cotton Company - Throurgh its partners
31st March 2012No of shares
31st March 2011No of shares
69,50,300
—
—
69,50,300
69,50,300
—
—
69,50,300
Reconciliation of Outstanding Shares
NOTE 2: RESERVES AND SURPLUS
CAPITAL RESERVES
Balance as per last balance sheet
Add: Capital subsidy
GENERAL RESERVE
Balance as per last balance sheet
Add: Transferred from profit & loss account
SURPLUS
Balance as per last balance sheet
Add: Profit for the period
Less: Appropriations:
Transferred to General reserve
Proposed Dividend
Tax on Dividend
Closing balance in statement of profit & loss
Foreign curreny transalation reserve
Profit on consolidation
TOTAL
226.05
11.68
237.73
3,174.38
300.00
3,474.38
6,744.38
1,891.57
300.00
347.52
56.38
7,932.05
98.97
3.06
11,746.19
226.05
0.00
226.05
2,874.38
300.00
3,174.38
5,156.03
2,253.07
300.00
312.76
51.95
6,744.38
-15.87
3.06
10,132.01
3,88,40012,41,05321,16,47937,45,932
3,88,40012,41,05321,16,47937,45,932
CHANGE THE WAY WE CHANGE

48
(Rs. in Lacs)
Current Year31st March 2012
Previous Year31st March 2011
NOTE 3: LONG TERM BORROWING
TERM LOANS:
SECURED LOANS - FROM BANKS
From Andhra Bank Limited
(Exclusive charge on the machinery financed and 'personal guarantee of
managing director)
From Standard Chartered Bank
Foreign Currency Loan
(Exclusive charge on wind turbine generator financed and charge on wind turbine
generator situated at Baradia, Gujarat and personal guarantee of managing
director)
(Total loan of USD 20,00,000) (Repayment to start form June 2012)
(Repayable in 16 equal quarterly installment of USD 1,25,000 each. Rate of
interest is LIBOR plus 375 basis points.
Vehicle Loan - From HDFC Bank Limited
(Exclusive charge on vehicle financed)
Unsecured Loans - From others
TOTAL
NOTE 4: DEFERRED TAX LIABILITY (NET)
On account of depreciation
TOTAL
NOTE 5: SHORT TERM BORROWING
LOANS REPAYABLE ON DEMAND
Secured Loans
From Banks:
Packing Credit Loan
Post Shipment Credit
Foreign Documentary Bill Purchase/Bill Discounting
Buyers Credit
(All the above working capital facilities are secured against all the current assets
(present and future) of the company).
(These facilities are further secured by first charge on the fixed assets of the
company except the assets which are financed through term loan, on which the
consortium working capital facilities lenders will have second charge, except
Wind Turbine Generator and vehicles).
(These facilities are further secured by personal guarantee of Managing Director.)
Unsecured Loans - From others
TOTAL
—
760.20
7.79
311.84
1,079.84
1,122.64
1,122.64
2,754.89
30.60
1,881.67
582.75
225.09
5,474.99
4.17
891.90
18.39
145.52
1,059.97
922.39
922.39
1,627.56
113.10
919.45
813.68
36.23
3,510.02
SARLA PERFORMANCE FIBERS LIMITED

49
Notes to Consolidated Financial Statement for the
YEAR ENDED 31ST MARCH, 2012 (Rs. in Lacs)
Current Year31st March 2012
Previous Year31st March 2011
NOTE 6: TRADE PAYABLES
TRADE PAYABLES
TOTAL
NOTE 7: OTHER CURRENT LIABILITIES
Current maturities of long-term debts
Unpaid dividend
Other Payables:
TDS payable
Sales tax payable
Other statutory dues payable
Excise duty payable
Sundry creditors
Advance from customers
Excess cheques drawn
TOTAL
NOTE 8: SHORT TERM PROVISIONS
FOR EMPLOYEE BENEFITS
Provision for gratuity (refer note 40)
Provision for leave encashment
Provision for bonus
Salaries and wages payable
FOR OTHERS
Provision for dividend
Provision for tax on dividend
Provision for Fringe benefit tax (net)
TOTAL
2,194.81
2,194.81
268.29
23.55
11.75
62.44
0.95
170.00
660.09
336.09
90.18
1,623.34
18.58
1.37
5.08
1.72
26.74
347.52
56.38
1.11
405.01
431.75
2,323.95
2,323.95
226.47
20.29
18.73
215.45
0.94
95.27
494.35
262.22
117.06
1,450.77
14.38
1.74
5.41
1.65
23.18
312.76
51.95
1.11
365.82
389.00
CHANGE THE WAY WE CHANGE

50
Notes to Consolidated Financial Statement for the
YEAR ENDED 31ST MARCH 2012
Co
mp
ute
r So
ftw
are
TO
TAL
7.5
2
7.5
2
1.7
0
1.7
0
0.0
0
0.0
0
9.2
3
9.2
3
6.1
2
6.1
2
1.4
1
1.4
1
0.0
0
0.0
0
7.5
2
7.5
2
1.7
0
1.7
0
1.4
1
1.4
1
(R
s. in
Lacs
)N
OTE 1
0:
INTA
NG
IBLE A
SSETS
N
ET C
AR
RY
ING
AM
OU
NT
DEPR
EC
IATIO
NG
RO
SS C
AR
RY
ING
AM
OU
NT
PA
RTIC
ULA
RS
Add
itio
n/ad
just
men
tA
s on
01-0
4-20
11A
s on
31-0
3-20
12D
educ
tion
/ad
just
men
tU
pto
01-0
4-20
11U
pto
31-0
3-20
12Fo
rth
e Ye
arD
educ
tion
As
on31
-03-
2012
As
on31
-03-
2011
Freeh
old
Lan
d
Fact
ory
Bu
ildin
g
Pla
nt
an
d M
ach
inery
Ele
ctri
cal In
stallati
on
s
Off
ice E
qu
ipm
en
t
Co
mp
ute
rs
Veh
icle
s
Furn
itu
re &
Fix
ture
Win
d T
urb
ine G
en
era
tor
(#)
Oth
er
Fixe
d A
ssets
TO
TAL
81
.62
1,4
97
.61
7,1
80
.52
35
6.3
0
25
.29
54
.38
11
5.2
0
75
.95
1,8
58
.46
58
.69
11
,30
4.0
5
0.0
0
55
4.7
6
59
0.4
1
27
.59
3.1
8
1.8
0
13
.67
15
.23
12
1.7
0
17
.57
1,3
45
.90
0.0
0
0.0
0
14
3.1
8
0.0
0
0.0
0
0.0
0
0.0
0
0.0
0
0.0
0
0.0
0
14
3.1
8
81
.62
2,0
52
.37
7,6
27
.75
38
3.8
9
28
.48
56
.18
12
8.8
7
91
.18
1,9
80
.16
76
.27
12
,50
6.7
7
0.4
1
22
6.1
0
2,9
55
.74
15
8.3
7
9.1
4
49
.40
33
.75
32
.36
33
.88
20
.41
3,5
19
.57
0.0
0
55
.78
59
1.3
5
29
.27
1.3
0
2.3
4
12
.55
6.3
3
98
.13
6.0
8
80
3.1
2
0.0
0
0.0
0
46
.77
0.0
0
0.0
0
0.0
0
0.0
0
0.0
0
0.0
0
0.0
0
46
.77
0.4
1
28
1.8
8
3,5
00
.32
18
7.6
4
10
.43
51
.73
46
.31
38
.70
13
2.0
1
26
.50
4,2
75
.93
81
.21
1,7
70
.49
4,1
27
.43
19
6.2
5
18
.04
4.4
4
82
.57
52
.49
1,8
48
.15
49
.77
8,2
30
.85
81
.21
1,2
71
.51
4,2
24
.78
19
7.9
3
16
.16
4.9
8
81
.45
43
.59
1,8
24
.58
38
.28
7,7
84
.47
(R
s. in
Lacs
)N
OTE 9
: TA
NG
IBLE A
SSETS
N
ET C
AR
RY
ING
AM
OU
NT
DEPR
EC
IATIO
NG
RO
SS C
AR
RY
ING
AM
OU
NT
PA
RTIC
ULA
RS
Add
itio
n/ad
just
men
tA
s on
01-0
4-20
11A
s on
31-0
3-20
12D
educ
tion
/ad
just
men
tU
pto
01-0
4-20
11U
pto
31-0
3-20
12Fo
rth
e Ye
arD
educ
tion
As
on31
-03-
2012
As
on31
-03-
2011
(#)
Ad
dit
ion
in
clu
des
loss
of
Rs.
12
1.7
0 L
acs
on
rein
state
men
t o
f fo
reig
n c
urr
en
cy lo
an
taken
to
acq
uir
e t
he a
sset.
SARLA PERFORMANCE FIBERS LIMITED

51
Notes to Consolidated Financial Statement for the
YEAR ENDED 31ST MARCH, 2012 (Rs. in Lacs)
Current Year31st March 2012
Previous Year31st March 2011
NOTE 11: LONG-TERM LOANS AND ADVANCE
(Unsecured, considered good)
Capital advances
Security deposits (#)
Other loans and advance
(#) Includes deposit of Rs. 2,25,00,000 given to Hindustan Cotton Company)
NOTE 12: CURRENT INVESTMENT
(Valued at cost or market value, whichever is lower)
Investment in mutual funds
HDFC Cash Management Fund - Treasury Advantage Plan - Weekly Dividend -
Reinvestment
(10,60,488.11 units, NAV as on 31.03.2012 Rs. 10.0396, PY Rs. Nil)
LIC Nomura FMP series - Growth Plan
(4,00,000 units, NAV as on 31.03.2012 Rs. 10.00, PY Rs. Nil)
(Aggregate amount of Unquoted investment)
(Provision made for diminution in value of investment)
NOTE 13: INVENTORIES
(As taken, valued and certified by the Management)
Raw Materials
Work-In -Progress
Finished goods
Stores and Spares
Oil & lubricant
Power & Fuel
Packing Materials
Other inventory
NOTE 14: TRADE RECEIVABLE
(Unsecured, considered good)
Outstanding for more than 6 months
Outstanding for less than 6 months
18.15
325.24
621.04
964.43
106.32
40.00
146.32
1,658.06
1,004.63
2,478.57
82.73
12.32
23.77
59.19
99.50
5,418.76
674.17
5,778.66
6,452.83
223.94
109.25
548.12
881.31
—
—
—
1,970.48
631.90
1,577.57
40.00
33.80
18.55
56.89
48.10
4,377.29
500.89
4,579.65
5,080.54
CHANGE THE WAY WE CHANGE

52
(Rs. in Lacs)
Current Year31st March 2012
Previous Year31st March 2011
NOTE 15: CASH AND BANK BALANCES
CASH AND CASH EQUIVALENTS:
Balance with banks
Cash on hand
OTHER BANK BALANCES:
Balance in unpaid dividend account
Fixed deposits
[Fixed deposits of Rs. 5,47,94,289 (P.Y. Rs. 5,87,55,900) pledged as margin
money deposit]
NOTE 16: SHORT TERM LOANS AND ADVANCES
Loans and advances to related parties
Unsecured, considered good
Others
Unsecured, considered good
Advance Income Tax (Net of Provisions)
NOTE 17: OTHER CURRENT ASSETS
Entry tax receivable
Interest receivables
Pre-operative expenses
Other receivables
NOTE 18: REVENUE FROM OPERATIONS
A) Sale of Products/ Services:
Local Sales
Export Sales
Deemed Export Sales
Trading Sales
Sale of Wind Power
172.05
15.06
187.10
23.55
1,063.61
1,087.17
1,274.27
-0.73
-0.73
1,518.94
127.23
1,646.17
1,645.44
108.26
76.05
47.44
2.25
234.00
8,098.05
11,106.67
713.65
3,549.95
303.66
23,771.99
496.32
11.05
507.37
20.30
823.76
844.06
1,351.43
1.37
1.37
596.19
167.93
764.12
765.49
160.42
32.29
47.44
1.04
241.20
8,105.83
8,759.64
688.32
2,285.36
91.78
19,930.93
SARLA PERFORMANCE FIBERS LIMITED

53
Notes to Consolidated Financial Statement for the
YEAR ENDED 31ST MARCH, 2012 (Rs. in Lacs)
Current Year31st March 2012
Previous Year31st March 2011
NOTE 18: REVENUE FROM OPERATIONS
B) Other Operating Revenues:
Export benefits
Sale of Waste yarn
REC income
NOTE 19: OTHER INCOME
Dividend Income on Current investments
Net gain on sale of long term investments
Profit on sale of fixed assets
Exchange rate difference (Net)
Rent received
Duty drawbak
Miscellaneous Income
NOTE 20: COST OF MATERIALS CONSUMED
Inventory at the begnining of the year
Add: Purchase
Less: Inventory at the end of the year
Cost of materials consumed
NOTE 21: (INCREASE)/ DECREASE IN INVENTORIES
Inventories at the end of the year:
Work-in-progress
Finished goods
Inventories at the beginning of the year:
Work-in-progress
Finished goods
NOTE 22: EMPLOYEE BENEFIT EXPENSES
Salaries, wages and bonus
Contribution to provident and other funds
Staff welfare expenses
63.17
21.71
35.79
120.67
23,892.66
3.14
—
30.97
—
—
96.24
24.79
155.14
2,052.94
11,442.47
13,495.41
1,812.93
11,682.48
1,004.63
2,478.60
3,483.23
631.90
1,577.57
2,209.47
-1,273.76
412.69
31.97
41.36
486.02
52.50
41.11
—
93.61
20,024.54
—
25.38
1.57
76.30
21.60
—
50.45
175.31
1,572.23
10,238.85
11,811.08
2,052.94
9,758.14
631.90
1,577.57
2,209.47
434.10
886.26
1,320.36
-889.12
342.65
25.05
29.06
396.76
CHANGE THE WAY WE CHANGE

54
(Rs. in Lacs)
Current Year31st March 2012
Previous Year31st March 2011
NOTE 23: FINANCE COSTS
Interest expenses
Less: Interest income on bank deposits
Net interest expenses
Bank charges
NOTE 24: OTHER EXPENSES
Manufacturing expenses:
Consumption of stores and spare parts
Power and fuel
Consumption of packing materials
Consumption of oils and chemicals
Labour charges
Clearing and forwarding charges
Repairs and Maintenance:
Building
Machinery
Excise duty expenses #
Water, waste and effulient treatment charges
Other direct expenses
Administrative and selling expenses:
Rent
Repairs and Maintenance - Others
Insurance
Rates and taxes
Director sitting fees
Legal and professional fees
Miscellaneous expenses
Excahnge difference (net)
Payment to auditor:
As auditors:
Audit fee
Limited review
In other capacity:
Other services (certification fees)
Freight and forwarding charges
Commission on sales
Bad debts written off
Transmission charges
Sales tax assessment dues
210.65
92.06
118.59
178.62
297.21
218.21
1,171.72
772.98
283.81
899.33
312.77
12.96
35.68
110.36
35.56
482.90
25.95
31.41
30.36
5.69
0.65
68.89
480.98
171.78
9.57
0.30
0.30
930.28
227.93
20.31
13.52
16.92
6,371.11
132.49
57.24
75.26
114.58
189.83
281.29
936.02
755.72
219.07
647.08
286.16
26.60
73.49
28.12
34.29
392.89
19.74
51.31
33.10
38.06
0.24
38.64
309.47
—
8.86
0.30
0.20
739.72
148.93
33.47
14.27
0.00
5,117.04
# Excise duty expenses includes excise duty borne by the company and variation in excise duty on closing stock of finished goods
SARLA PERFORMANCE FIBERS LIMITED

55
incorporated in Hongkong, B.V.I. is considered in the consolidated
financial statement of parent company which includes 60% share
of Subsidiary, Sarla Europe, LDA, Portugal,a share in joint ventures
to the extent of 40% in M/s Savitex SA De C.V., Honduras, 45% in
Sarla Tekstil Sanayi and 33.33% in MRK SA De CV, Honduras.
USE OF ESTIMATES: The preparation of financial statements in
conformity with the generally accepted accounting principles
requires estimates and assumptions to be made that affect the
reported amount of assets and liabilities on the date of the
financial statements and the reported amount of revenues and
expenses during the reporting period. Difference between the
actual result and estimates are recognised in the period in which the
results are known/materialized.
FIXED ASSETS: Fixed Assets including intangible assets are stated
at cost net of cenvat / value added tax and includes amount added
on revaluation less accumulated depreciation and impairment loss,
if any. All Cost is inclusive of Freight, Duties, (net of tax credits as
applicable) levies and any directly attributable cost till
commencement of commercial production. Adjustments arising
from Exchange Rate variations attributable to the Fixed Assets are
capitalised.
IMPAIRMENT OF ASSETS: Impairment is ascertained at each
balance sheet date in respect of Cash Generating Units.
An impairment loss is recognized whenever the carrying amount of
an asset exceeds its recoverable amount. The recoverable amount is
the greater of the net selling price and value in use. In assessing
value in use, the estimated future cash flows are discounted to
their present value based on an appropriate discount factor.
DEPRECIATION & AMORTISATION: Depreciation on fixed assets is
provided as per the straight line method (SLM) at the rate and in the
manner prescribed in schedule XIV of the Companies act, 1956 on
prorata basis. Fixed Assets are capitalized at cost inclusive of
expenses and interest wherever applicable.
Intangible Assets are amortized over their respective individual
estimated useful life on a straight line basis commencing from the
year the asset is available to the company for its use, not exceeding
five years.
INVESTMENTS: Non current investments are stated at cost.
Provision for diminution in the value of non current investment is
made only if, such a decline is other than temporary in the opinion
of management. Current Investments are carried at lower of cost
and fair value.
INVENTORIES:
A. Raw Materials and General Stores are valued at cost or
realisable value, whichever is less, excluding Cenvat and VAT credit,
by FIFO method.
B. Work in Process is valued at raw-material cost or
realisable value, whichever is less plus estimated overheads, but
excluding Cenvat and VAT.
YEAR ENDED 31ST MARCH, 2012Notes to Consolidated Financial Statement for the
NOTE 25: SIGNIFICANT ACCOUNTING POLICIES
ACCOUNTING CONVENTION: The Accounts are prepared on
accrual basis under the historical cost convention except for certain
fixed assets which are revalued in accordance with applicable
accounting standards and relevant provisions of the Companies
Act, 1956.
BASIS OF PREPARATION OF CONSOLIDATED FINANCIAL
STATEMENTS: The consolidated financial statements have been
prepared and presented under the historical cost convention, on
the accrual basis of accounting in accordance with the accounting
principles generally accepted in India ('Indian GAAP') and comply
with the Accounting Standards ('AS') issued by the Institute of
Chartered Accountants of India ('ICAI') and relevant provisions of
the Companies Act, 1956 to the extent applicable.
PRINCIPLES OF CONSOLIDATION: The consolidated financial
statements relate to Sarla Performance Fibers Limited (‘the
Company’) and its subsidiary company i.e. Sarla Overseas Holdings
Limited. The consolidated financial statements have been prepared
on the following basis:
A. The financial statements of the Company and its
subsidiary company are combined on a line-by-line basis by adding
together the book values of like items of assets, liabilities, income
and expenses, after fully eliminating intra-group balances and intra
group transactions in accordance with Accounting Standard (AS)
21 - “Consolidated Financial Statements
B. In case of foreign subsidiary, being non-integral foreign
operations, revenue items are consolidated at the average rate
prevailing during the year. All assets and liabilities are converted at
rates prevailing at the end of the year. Any exchange difference
arising on consolidation is recognised in the exchange fluctuation
reserve.
C. The financial statement of the subsidiary company
(consolidated with the Company) includes financial statements of
its subsidiary company i.e. step down subsidiary and its interest in
joint venture companies. Financial statements of subsidiary
company is combined on a line-by-line basis by adding together the
book values of like items of assets, liabilities, income and expenses,
after fully eliminating intra-group balances and intra group
transactions in accordance with Accounting Standard (AS) 21 -
“Consolidated Financial Statements”. Interest in joint venture have
been accounted by using proportionate consolidation method as
per Accounting Standard (AS) 27 - “Financial Reporting of Interest
in Joint Ventures”.
D. As far as possible, the consolidated financial statements
are prepared using uniform accounting policies for like transactions
and other events in similar circumstances and are presented in the
same manner as the Company’s separate financial statements.
E. The consolidated Financial Statements of M/s Sarla
Overseas Holdings Ltd, a wholly owned subsidiary company
CHANGE THE WAY WE CHANGE

YEAR ENDED 31ST MARCH, 2012Notes to Consolidated Financial Statement for the
56
C. Finished Goods are valued at cost including estimated overheads or net realisable value, whichever is less. The value includes excise duty paid/payable on such goods.
EXCISE DUTY & CENVAT CREDIT: Excise Duties wherever recovered are included in Sales and shown separately in financial statement as deduction from sales. Excise duty provision made in respect of finished goods lying at factory premises are shown separately as an item of manufacturing and other expenses and included in the valuation of finished goods. Cenvat credit available on purchases of service / materials / capital goods is accounted by reducing cost of services/ materials/ capital goods. Cenvat credit availed of is accounted by way of adjustment against excise duty payable on dispatch of finished goods.
PROVISIONS, CONTINGENT LIABILITIES AND CONTINGENT ASSETS: A provision is recognized when an enterprise has a present obligation as a result of past events and it is probable that an outflow of resources will be required to settle the obligation, in respect of which a reliable estimate can be made. Provisions are determined based on management estimate required to settle the obligation at the balance sheet date. These are reviewed at each balance sheet date and adjusted to reflect the current management estimates. Contingent Assets are neither recognised nor disclosed in the financial statements. Contingent liabilities are not recognised but are disclosed by way of note on the balance sheet. Provision is made in the accounts for those liabilities which are likely to materialise after the year end till the finalisation of accounts and having effect on the position stated in the balance sheet as at the year end.
FOREIGN EXCHANGE TRANSACTION:A: Transactions entered into and those settled during the
year in foreign currency are recorded at the actual exchange rates prevailing at the time of the transactions.
B: Foreign currency transactions remaining unsettled at the year end and not covered by forward contract are translated at the exchange rates prevailing at the year end.
C: In case of item which are covered by forward exchange contract, the difference between the year end rate and rate on the date of the contract is recognised as exchange difference and the premium paid on forward contract is recognised over the life of the contracts. Forward exchange contracts outstanding as at year end are calculated at the year end rate and mark to market profit/loss is dealt in the Profit & Loss Account.
REVENUE RECOGNITION:A: Sales are recognized, net of returns and trade discounts,
on dispatch of goods to customers and are reflected in the accounts at gross realizable value i.e. inclusive of excise duty. Inter-unit sales/ purchases have been eliminated during the year. In case of export sales, revenue is recognised when the risk and reward on the goods is transferred to the customers.
B: In appropriate circumstances, Revenue (Income) is recognised when no significant uncertainty as to Measurability or collectability exists. Export benefits/incentives are accounted on accrual basis.
C: Interest income is recognised on time proportionate method.
D: Dividend is accrued in the year in which it is declared whereby a right to receive is established.
TAXATION:A: Provision for current taxation is made for the current
accounting period (reporting period) on the basis of the taxable profits computed in accordance with Income Tax Act 1961 for the relevant assessment year.
B: Deferred Tax resulting from "timing differences" between book and tax profits is accounted for under the liability method, at the current rate of tax and tax laws that have been enacted or substantively enacted at the Balance Sheet date, to the extent that the timing differences are expected to crystalise, as deferred tax charge / benefit in the Profit and Loss Account and as deferred tax asset or liabilities in the Balance Sheet. The deferred tax assets is recognised and carried forward only to the extent that there is a virtual certainty that the assets will be realised in the future.
BORROWING COST: Borrowing cost that attributes to the acquisition or construction of qualifying assets are capitalised as part of the cost of such assets. A qualifying asset is one that necessarily takes substantial period of time to set ready for intended use. All other borrowing cost are charged to revenue.
PROPOSED DIVIDEND: Dividend proposed by the Board of Directors is provided for in the accounts pending approval at the Annual General Meeting.
NOTE 26: CONTINGENT LIABILITIES NOT PROVIDED FOR AND CAPITAL COMMITMENTS
A. CONTINGENT LIABILITIES1. Letter of credit: Letter of Credit issued by Banks on
behalf of the Company Rs. 2,493.31 Lacs (P.Y. Rs. 3,345.71 Lacs), these are covered by the Charge created in favour of the Company’s Bankers by way of Hypothecation of Stocks, Receivable & Machineries/Assets of the Company.
2. Guarantees: Bank Guarantees issued by Banks on behalf of the company Rs. 371.68 Lacs (P.Y. Rs. 361.69 Lacs). These are secured by the charge created in favour of the company’s bankers by way of pledge of Fixed Deposit Receipts.
3. The claim against Company not acknowledged as debt, comprises of excise duty & Custom duty disputed by company relating to issue of applicability of duty and classification of goods aggregating to Rs. 2,201.97 Lacs (P.Y. Rs. 1,891.72 Lacs).
4. Bill discounted not matured Rs. 2,007.36 Lacs (P.Y. Rs. 1,022.5 Lacs).
The contingent liabilities in respect of Bank Guarantees and other matters arising in the ordinary course of business from which it is anticipated that no material liabilities will arise.
5. CST liability in respect of invoice amount of Rs. 3,069.57 Lacs (P.Y. Rs. 2,518.59) for which C-Form are yet to be collected from the customers.
SARLA PERFORMANCE FIBERS LIMITED

57
B. Sarla Overseas Holdings Limited has an investment of USD 840,888 (equivalent to Rs. 380.80 lacs) for 16,000 shares of Savitex SA De C.V., Hunduras, out of the total capital of 40,000 shares in Savitex SA De C.V. Hunduras,, and EURO 3,000 (equivalent to 1.95 lacs) for 3 shares in Sarla Europe LDA, Portugal out of total capital of 5 Shares of Sarla Europe LDA and USD 280,000 in Sarla Tekstil Sanayi, Turkey towards 45% share capital of the company and USD 100,000 in MRK SA De C.V. towards 33.33% share capital of the company.
NOTE 30:
Managing Director’s remuneration is Rs. 42.00 Lacs (P.Y. Rs. 39.00 Lacs) & the whole time Director's remuneration is Rs. 34.00 Lacs ( P.Y.Rs.27.00 Lacs) is in accordance with section 198 schedule XIII of the Companies Act. 1956.
NOTE 31: RELATED PARTY TRANSACTIONS
The Company has identified following related parties with whom transactions have taken place during the year:
1) Associates
M/s Satidham Industries Private Ltd.
M/s Hindustan Cotton Co.
M/s. Shivchandrai Jhunjhunwala & Co.
2) Key Management Personnel
Madhusudan Jhunjhunwala - Chairman
Krishna Jhunjhunwala - Managing Director
3) Joint Ventures of Subsidiary Company
Savitex SA De C.V., Honduras
MRK SA De C.V., Honduras
Sarla Tekstil Filament Sanayi Ticaret A.S.
4) Subsidiary Companies
M/s Sarla Overseas Holding Ltd.
5) Subsidiary of subsidiary Company
M/s Sarla Europe, Lda
6. Liability of Income Tax with respect to which appeal is pending before ITAT amounting to Rs. 13.17 Lacs for A.Y. 2003-04, and appeals pending before CIT Appeal for Rs. 6.28 Lacs for A.Y. 2009-10
B. CAPITAL COMMITMENTS
Estimated amounts of contracts remained to be executed on capital account net of advance at the end of the year Rs. 18.14 Lacs (P.Y. Rs. 59.91 Lacs).
NOTE 27:
The company has exercised option given in Companies (Accounting Standard) Amendment Rules 2009 on Accounting Standard 11 issued by ICAI which was notified by MCA regarding accounting of exchange rate difference related to foreign currency loan utilised for acquisition of fixed assets by way of notification no. GSR 225(E) dated 31.03.2009 read with notification no. GSR 913(E) dated 29.12.2011. On exercise of option referred above, foreign exchange loss of Rs. 121.70 lacs is capitalised during the year.
NOTE 28: DEPRECIATION
A : The depreciation for the year has been provided on "straight line method"as per Section 205 (2) of the Companies Act, 1956 at the rates prescribed in schedule XIV thereto.
B: Depreciation on additions / disposals of the fixed assets during the year is provided on pro-rata basic according to the period during which assets are put to use.
C: Intangible assets represents the cost of computer software acquired for internal use, to be amortized equally over five years based upon their estimated useful lives.
NOTE 29:
A. The company has invested USD 4,35,000 equivalent to Rs. 183.22 Lacs for 100% share being 4,35,000 shares of Sarla Overseas Holding Limited registered at British Virgin Islands as a result the said company is Wholly Owned Subsidiary of the Company.
CHANGE THE WAY WE CHANGE
5.00
—
—
112.70
112.70
—
—
225.00
—
—
—
—
—
—
—
76.00
—
—
—
—
—
—
—
—
—
—
—
—
156.01
75.96
—
—
183.22
—
—
—
29.58
—
1,094.06
154.49
5.00
—
—
—
—
—
—
—
—
—
—
—
—
—
—
66.00
—
—
—
—
—
—
—
—
—
—
—
—
201.98
43.80
—
149.85
183.22
—
—
—
—
—
866.83
278.73
Rent paid
Unsecured Loan Received Back
Investment In Shares
Unsecured Loan Taken
Unsecured Loan Repaid
Managerial Remuneration
Advance Received
Security Deposit
Sale of Goods
Debtors
Note: Related party relationship is as identified by the Company and relied upon by the Auditors.
(Rs. in Lacs)
Subsidiary Co.Joint VenturesKey ManagementPersonnel
AssociatesEnterprises
CurrentYear
PreviousYear
CurrentYear
PreviousYear
CurrentYear
PreviousYear
CurrentYear
PreviousYear
Details of transactions with above related parties:
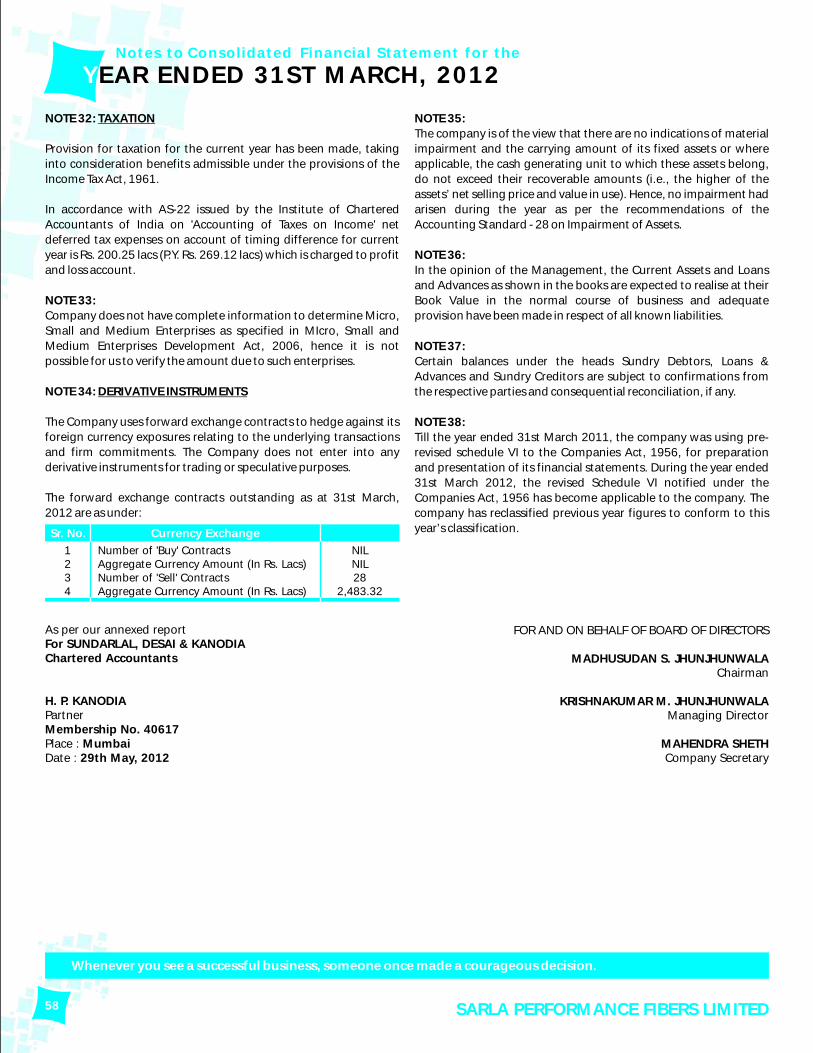
58
As per our annexed reportFor SUNDARLAL, DESAI & KANODIAChartered Accountants
H. P. KANODIAPartnerMembership No. 40617Place : MumbaiDate : 29th May, 2012
FOR AND ON BEHALF OF BOARD OF DIRECTORS
MADHUSUDAN S. JHUNJHUNWALAChairman
KRISHNAKUMAR M. JHUNJHUNWALAManaging Director
MAHENDRA SHETHCompany Secretary
YEAR ENDED 31ST MARCH, 2012Notes to Consolidated Financial Statement for the
NOTE 32: TAXATION
Provision for taxation for the current year has been made, taking
into consideration benefits admissible under the provisions of the
Income Tax Act, 1961.
In accordance with AS-22 issued by the Institute of Chartered
Accountants of India on 'Accounting of Taxes on Income' net
deferred tax expenses on account of timing difference for current
year is Rs. 200.25 lacs (P.Y. Rs. 269.12 lacs) which is charged to profit
and loss account.
NOTE 33:
Company does not have complete information to determine Micro,
Small and Medium Enterprises as specified in MIcro, Small and
Medium Enterprises Development Act, 2006, hence it is not
possible for us to verify the amount due to such enterprises.
NOTE 34: DERIVATIVE INSTRUMENTS
The Company uses forward exchange contracts to hedge against its
foreign currency exposures relating to the underlying transactions
and firm commitments. The Company does not enter into any
derivative instruments for trading or speculative purposes.
The forward exchange contracts outstanding as at 31st March,
2012 are as under:
Number of 'Buy' ContractsAggregate Currency Amount (In Rs. Lacs)Number of 'Sell' ContractsAggregate Currency Amount (In Rs. Lacs)
Currency ExchangeSr. No.
1234
NILNIL28
2,483.32
NOTE 35:
The company is of the view that there are no indications of material
impairment and the carrying amount of its fixed assets or where
applicable, the cash generating unit to which these assets belong,
do not exceed their recoverable amounts (i.e., the higher of the
assets’ net selling price and value in use). Hence, no impairment had
arisen during the year as per the recommendations of the
Accounting Standard - 28 on Impairment of Assets.
NOTE 36:
In the opinion of the Management, the Current Assets and Loans
and Advances as shown in the books are expected to realise at their
Book Value in the normal course of business and adequate
provision have been made in respect of all known liabilities.
NOTE 37:
Certain balances under the heads Sundry Debtors, Loans &
Advances and Sundry Creditors are subject to confirmations from
the respective parties and consequential reconciliation, if any.
NOTE 38:
Till the year ended 31st March 2011, the company was using pre-
revised schedule VI to the Companies Act, 1956, for preparation
and presentation of its financial statements. During the year ended
31st March 2012, the revised Schedule VI notified under the
Companies Act, 1956 has become applicable to the company. The
company has reclassified previous year figures to conform to this
year’s classification.
SARLA PERFORMANCE FIBERS LIMITED
Whenever you see a successful business, someone once made a courageous decision.

59
NOTICE
NOTICE is hereby given that the 19th Annual General Meeting of
the Members of SARLA PERFORMANCE FIBERS LIMITED will be
held on Thursday, the 20th September, 2012 at the Registered
office of the Company at Survey No.59/1/4, Amli Piparia Industrial
Estate, Silvassa – 396 230, U.T. of Dadra & Nagar Haveli, at 11.30
A.M. to transact the following businesses:
ORDINARY BUSINESS:
1. To consider and adopt the Audited Balance Sheet as at
31st March, 2012, the Statement of Profit & Loss for the year ended
on that date and the Reports of the Board of Directors and Auditors
thereon.
2. To declare a dividend on equity shares.
3. To appoint a Director in place of Mr. Jigar Shah, who
retires by rotation and being eligible offers himself for
re-appointment.
4. To appoint Auditors and fix their remuneration and in this
regard to consider and if thought fit, to pass, with or without
modification(s), the following resolution as an Ordinary Resolution:
“ RESOLVED THAT M/s Sundarlal, Desai & Kanodia, Chartered
Accountants (Registration No.110560W) be and are hereby
appointed as Auditors of the Company,to hold office from the
conclusion of this Annual General Meeting until the conclusion of
the next Annual General Meeting of the Company on such
remuneration as shall be fixed by the Board of Directors.”
SPECIAL BUSINESS:
5. To consider and if thought fit, to pass, with or without
modification(s), the following Resolution as a Special Resolution:
“RESOLVED THAT pursuant to the provisions of Section 314
of the Companies Act, 1956, consent of the Company be and is
hereby accorded to Ms. Neha Jhunjhunwala, a relative of
Mr. Madhusudan Jhunjhunwala and Mr. Krishnakumar
Jhunjhunwala, Directors of the Company to hold an office or place
of Profit as Vice President (Operations) of the Company with effect
from 1st June, 2011 on following Remuneration:
1. Basic Salary: Rs.50,000 p.m.
2. Bonus: As per Company Rules
3. Contribution to Provident Fund:- As applicable
4. Entitled to be reimbursed in respect of all the expenses
incurred by her including travelling, entertainment etc., for and on
behalf of the company.
5. Such increments as may be decided from time to time by
the Board of Directors of the Company provided that the total
monthly remuneration shall not exceed Rs.2,50,000/- per month
without obtaining prior approval of the Central Government ”
For & on behalf of Board of Directors
(MADHUSUDAN S. JHUNJHUNWALA)
Chairman & Whole Time Director
Place: Mumbai.
Date : 29th May, 2012
CHANGE THE WAY WE CHANGE
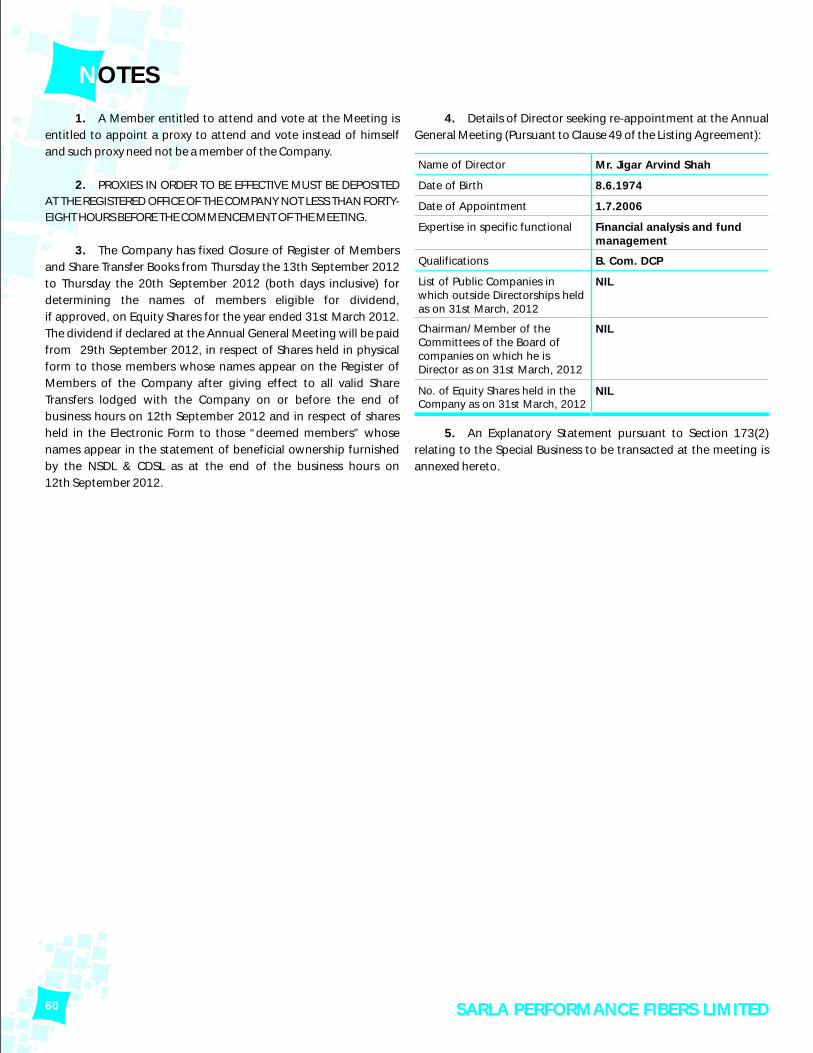
60
4. Details of Director seeking re-appointment at the Annual
General Meeting (Pursuant to Clause 49 of the Listing Agreement):
Name of Director Mr. Jigar Arvind Shah
Date of Birth 8.6.1974
Date of Appointment 1.7.2006
Qualifications B. Com. DCP
Expertise in specific functional Financial analysis and fund management
List of Public Companies in which outside Directorships held as on 31st March, 2012
NIL
No. of Equity Shares held in the Company as on 31st March, 2012
NIL
Chairman/ Member of the Committees of the Board of companies on which he is Director as on 31st March, 2012
NIL
5. An Explanatory Statement pursuant to Section 173(2)
relating to the Special Business to be transacted at the meeting is
annexed hereto.
NOTES
1. A Member entitled to attend and vote at the Meeting is
entitled to appoint a proxy to attend and vote instead of himself
and such proxy need not be a member of the Company.
2. PROXIES IN ORDER TO BE EFFECTIVE MUST BE DEPOSITED
AT THE REGISTERED OFFICE OF THE COMPANY NOT LESS THAN FORTY-
EIGHT HOURS BEFORE THE COMMENCEMENT OF THE MEETING.
3. The Company has fixed Closure of Register of Members
and Share Transfer Books from Thursday the 13th September 2012
to Thursday the 20th September 2012 (both days inclusive) for
determining the names of members eligible for dividend,
if approved, on Equity Shares for the year ended 31st March 2012.
The dividend if declared at the Annual General Meeting will be paid
from 29th September 2012, in respect of Shares held in physical
form to those members whose names appear on the Register of
Members of the Company after giving effect to all valid Share
Transfers lodged with the Company on or before the end of
business hours on 12th September 2012 and in respect of shares
held in the Electronic Form to those “deemed members” whose
names appear in the statement of beneficial ownership furnished
by the NSDL & CDSL as at the end of the business hours on
12th September 2012.
SARLA PERFORMANCE FIBERS LIMITED

61
A NNEXURE TO NOTICE
Item No. 5:
As required by Section 173 of the Companies Act, 1956, the
following Explanatory Statements set out all material facts relating
to the Special Business mentioned under Item No. 5 of the
accompanying Notice.
The Board of Directors of the Company has , subject to the approval
of members, appointed Ms. Neha Jhunjhunwala as Vice President
(Operations) of the Company w.e.f 1st June, 2011 on the
remuneration as mentioned in the proposed Resolution set out at
item no.5 of the Agenda.
Ms. Neha Jhunjhunwala has done her Graduation as Bachelors in
Management Studies from University of Mumbai. She also studied
Msc Marketing and Strategy with a focus on Marketing at Warwick
Business School , UK.
She has worked in Merchandising & Sourcing Department of
Pantaloon Retail, India during her internship. She is working as
Manager, Operations with the company since June, 2011.
The operations of Vapi Plant and overall Human Resource
Management is driven by her. Ms Jhunjhunwala has given
significant contribution for bringing productivity related changes in
the Company. Her current salary was not commensurate with the
role and responsibility carried out by her as the Vice President,
Operations. Accordingly, the board of directors in the their meeting
held on May 29, 2012 unanimously approved the revision in the
remuneration package of Ms Neha Jhunjhunwala and
re-designated her as the Vice President, Operations of the company.
As Ms. Neha Jhunjhunwala is a relative of Mr. Madhusudan
Jhunjhunwala and Mr. Krishnakumar Jhunjhunwala, Directors of
the Company, consent of the Members of the Company is required
for her appointment and payment of remuneration by a Special
Resolution as per the provisions of Section 314 of the Companies
Act, 1956.
The Resolution at Item No. 5 of the Notice is meant for this purpose.
Mr. Madhusudan Jhunjhunwala and Mr. Krishnakumar
Jhunjhunwala are deemed to be concerned or interested in the said
resolution as relatives of Ms Neha Jhunjhunwala. None of the other
directors of the company is deemed to be concerned or interested
in the said resolution.
The Board of Directors commends this Resolution for your approval.
For & on behalf of Board of Directors
(MADHUSUDAN S. JHUNJHUNWALA) Chairman & Whole Time Director
Place: Mumbai. Date : 29th May, 2012
CHANGE THE WAY WE CHANGE
Business has only two basic functions-marketing and innovation.

62
NOTES
SARLA PERFORMANCE FIBERS LIMITED

PROXY FORM
I/We___________________________________________________________________________________________________________
of__________________________________________________________in the district of_______________________________________
being member/members of SARLA PERFORMANCE FIBERS LIMITED hereby appoint___________________________________________
__________________________________________________________of_____________________in the district of__________________
or failing him___________________________________________of________________________in the district of___________________
_____________________________________________________________as my/our proxy to vote for me/us and on my/or behalf at the
Nineteenth Annual General Meeting of the Company to be held on Thursday, the 20th September, 2012 at 11.30 a.m. and at any
adjournment thereof.
Signed this_________________day of_________________2012.
Signature of Shareholder
AffixRe. 1/-
RevenueStamp
NOTE: This form duly completed should be deposited at the Registered Office of the Company before 48 hours of the meeting.
*DP ID ______________________
*Client ID ______________________ Regd. Folio No. ______________________
SARLA PERFORMANCE FIBERS LIMITEDRegistered Office: Survey No. 59/1/4, Amli Piparia Industrial Estate, Silvassa – 396 230.
U.T. of Dadra & Nagar Haveli
ATTENDANCE SLIP
(Shareholders attending the Meeting in person or by Proxy are requested to complete the attendance slip and hand over at the
entrance of the Meeting hall.)
I hereby record my presence at the Nineteenth Annual General Meeting of the Company at the Registered Office situated at 59/1/4,
Amli Piparia Industrial Estate, Silvassa - 396 230 U.T. of Dadra & Nagar Haveli, on Thursday, the 20th September, 2012 at 11.30 a.m
Full name of the Shareholder/Proxy______________________________________________________________________________________
(in block letters)
___________________________
Signature of Shareholder
Regd. Folio No. ______________________
*DP ID ______________________
*Client ID ______________________
No. of Share Hold ______________________
(PLEASE BRING THIS ATTENDANCE SLIP TO THE MEETING)
*Applicable for members holding shares in dematerialised form.
* Applicable for members holding shares in dematerialised form.
SARLA PERFORMANCE FIBERS LIMITEDRegistered Office: Survey No. 59/1/4, Amli Piparia Industrial Estate, Silvassa – 396 230.
U.T. of Dadra & Nagar Haveli

SOURCES OF FUNDS 2011 - 2012
Money borrowed from bank & others
Payable for goods & other liabilities
Proposed dividend
Deffered tax liability
Share Holders fund
6,823.12
3,577.71
403.9
1,122.63
12,441.22
24,368.58
(Rs. in Lacs)
14.68%
1.66%4.61%
28%
51.05%
APPLICATION OF FUNDS 2011 - 2012
Fixed Asset
Investment
Inventories
Receivable
Loans and Advances
Cash & Bank balance
8,232.55
146.31
5,418.76
6,452.83
2,843.87
1,274.27
24,368.59
(Rs. in Lacs)
0.60%22.24%
11.67%33.78%
26.48%
5.23%
DISTRIBUTION OF REVENUE 2011 - 2012
Material
Manufacturing expenses
Employees remuneration & Benefits
Administrative & other expenses
Interest & Finance Charges
Depreciation
Tax
Dividend(including tax)
Other
Retained Earnings
13,205.85
4,336.28
486.02
2,034.83
297.2
804.53
457.7
403.9
0.00
1,487.69
23,514.00
(Rs. in Lacs)
56.16%
18.44%
2.07%
8.65%
1.26%3.42%
6.34%
1.94%1.72%
HIGHLIGHTSOF THE YEAR
20000
15000
5000
0
Rs.
in
Lacs
10000
REVENUE
15,868.70
14.73%
FY11 FY12
18,205.72
2000
3000
1500
2500
500
0
Rs.
in
Lacs
1000
EBIDTA
2,501.16
0.89%
FY11 FY12
2,523.52
8000
10000
6000
2000
0
Rs.
in
Lacs
4000
NET WORTH
8.29%
FY11 FY12
8459.37
9159.67
(standalone)

Registered Office: Survey No. 59/1/4, Amli Piparia Industrial Estate, Silvassa - 396 230, U. T. of Dadra & Nagar Haveli
Corporate Office: 304, Arcadia, Nariman Point, Mumbai - 400 021 Phone No: + 91-22-2283 4116 Fax No: + 91-22-2285 1728
Website: www.sarlafibers.com
Investors services e-mail id: [email protected]
PRODUCTS AT GLANCE
TEXTURED POLYESTER YARN
SPFL Textured Polyester Yarn finds applications in Sewing Thread, Furniture & Automotive Upholstery, Narrow Fabrics and Tapes, Circular and Flat Knitted products
HIGH TENACITY YARN
SPFL High Tenacity Yarn has niche end applications such as Automotive Seat Belts, Trims & Air Bags, Dress, Casual & Athletic Footwear, Leather Goods & Soft Luggage.
TEXTURED NYLON YARN
SPFL Textured Nylon Yarn caters to end applications such as Active & Swim Wear, Narrow Fabrics and Tapes, Hosiery, Under Garments.
TEXTURED SEWING THREAD
SPFL Sewing Threads caters to end applications such as Apparels, Swim Wear, Lingerie, Fleece Goods, Towels and Wash Clothes, Table Cloths and Placemats, Sheets and Pillow Cases.
COVERED YARN
Narrow Tapes, Hosiery, Lingerie, Seamless Knitwear, Medical, Bandages, Knitted and Denim Facbrics are the primary end applications of SPFL’s range of Covered Yarn.