change - for our constant growth! - jyothy laboratories … report/annual...values that touched upon...
TRANSCRIPT

UJALA HOUSE, Ramkrishna Mandir Road, Kondivita, Andheri (East), Mumbai - 400 059.
Tel. No.: 022-6689 2800, Fax: 6689 2805, Website: www.jyothylaboratories.com
Des
ign
ed b
y A
dfa
ctor
s
ANNUAL REPORT 2012-13
Change - for our constant growth!

The only constant in life, they say, is change! Change for the better. Change as synonymous for
growth. Change as in reaching out to new territories and change that accrues with the
achievement of objectives.
Jyothy Laboratories Limited represents an example of this phenomenon of continuous change. A
company that began 30 years ago with idealistic values as its most important raw material!
Values that touched upon product features, customer satisfaction, innovativeness and financial
operations. Sure enough, the Jyothy basket of products reflected those values. Products that
clean, whiten, refresh, delight and protect.
It began with our flagship brand - Ujala - a liquid fabric whitener. A product that has become a
universal symbol of purity and integrity. This was followed by other products - each an offering
that touched the lives of consumers in a binding way. The cyclothrin powered mosquito repellent
'Maxo'. Utensil cleaners under the brand name 'Exo'. Fragrance Incense sticks called 'Maya'. A
range of personal care products under the brand name 'Jeeva'. And a new retail space has been
created for 'Fabric Spa', a laundry chain with brand extensions. Add to that the 'Henkel' brand
that was acquired by Jyothy, with their basket of product lines.
Each and every step in line with our mission of constantly changing to new and higher paradigms
of growth and diversification.
Corporate information 1
Letter from the Chairman . . . . . . . . . . . . . . . . . . . . . . . . . . . . . . . . . . . . . . . 2
A 360 degree View . . . . . . . . . . . . . . . . . . . . . . . . . . . . . . . . . . . . . . . . . . . . . 6
Financial Review . . . . . . . . . . . . . . . . . . . . . . . . . . . . . . . . . . . . . . . . . . . . . . . 9
Business Review . . . . . . . . . . . . . . . . . . . . . . . . . . . . . . . . . . . . . . . . . . . . . . . 10
CEO’s Viewpoint . . . . . . . . . . . . . . . . . . . . . . . . . . . . . . . . . . . . . . . . . . . . . . . 17
Excerpts from M.R.Jyothy . . . . . . . . . . . . . . . . . . . . . . . . . . . . . . . . . . . . . . 21
Management Discussion and Analysis . . . . . . . . . . . . . . . . . . . . . . . . . 24
Directors report. . . . . . . . . . . . . . . . . . . . . . . . . . . . . . . . . . . . . . . . . . . . . . . . 35
Report on Corporate Governance . . . . . . . . . . . . . . . . . . . . . . . . . . . . . . . .
Standalone Financials . . . . . . . . . . . . . . . . . . . . . . . . . . . . . . . . . . . . . . . . . . . .
Consolidated Financials . . . . . . . . . . . . . . . . . . . . . . . . . . . . . . . . . . . . . . . . . .
. . . . . . . . . . . . . . . . . . . . . . . . . . . . . . . . . . . . . . . . . . .
Index Corporate Information
Solicitors & Advocates
AZB Partners
Law & Prudence
V. Lakshmikumaran
Bankers
Axis Bank Ltd.
ICICI Bank Ltd.
The Federal Bank Ltd.
M. P. Ramachandran
Chairman & Managing Director
K. Ullas Kamath
Joint Managing Director
M. R. Jyothy
Whole-time Director
CFO & Company Secretary
M.L. Bansal
S. Raghunandan
Whole-time Director & CEO
Nilesh B. Mehta
Independent Director
K. P. Padmakumar
Independent Director
Bipin R. Shah
Independent Director
Statutory Auditors
S.R.Batliboi & Associates LLP
R. Lakshminarayanan
Independent Director
1
Corporate information 1
Letter from the Chairman . . . . . . . . . . . . . . . . . . . . . . . . . . . . . . . . . . . . . . . 2
A 360 degree View . . . . . . . . . . . . . . . . . . . . . . . . . . . . . . . . . . . . . . . . . . . . . 6
Financial Review . . . . . . . . . . . . . . . . . . . . . . . . . . . . . . . . . . . . . . . . . . . . . . . 9
Business Review . . . . . . . . . . . . . . . . . . . . . . . . . . . . . . . . . . . . . . . . . . . . . . . 10
CEO’s Viewpoint . . . . . . . . . . . . . . . . . . . . . . . . . . . . . . . . . . . . . . . . . . . . . . . 17
Excerpts from M.R.Jyothy . . . . . . . . . . . . . . . . . . . . . . . . . . . . . . . . . . . . . . 21
Management Discussion and Analysis . . . . . . . . . . . . . . . . . . . . . . . . . 24
Directors report. . . . . . . . . . . . . . . . . . . . . . . . . . . . . . . . . . . . . . . . . . . . . . . . 35
. . . . . . . . . . . . . . . . . . . . . . . . . . . . . . . . . . . . . . . . . . .
Index Corporate Information
Solicitors & Advocates
AZB Partners
Law & Prudence
V. Lakshmikumaran
Bankers
Axis Bank Ltd.
ICICI Bank Ltd.
The Federal Bank Ltd.
M. P. Ramachandran
Chairman & Managing Director
K. Ullas Kamath
Joint Managing Director
M. R. Jyothy
Whole-time Director
CFO & Company Secretary
M.L. Bansal
S. Raghunandan
Whole-time Director & CEO
Nilesh B. Mehta
Independent Director
K. P. Padmakumar
Independent Director
Bipin R. Shah
Independent Director
Statutory Auditors
S.R.Batliboi & Associates LLP
R. Lakshminarayanan
Independent Director
1
Report on Corporate Governance . . . . . . . . . . . . . . . . . . . . . . . . . . . . . 40
Standalone Financials . . . . . . . . . . . . . . . . . . . . . . . . . . . . . . . . . . . . . . . . . 50
Consolidated Financials . . . . . . . . . . . . . . . . . . . . . . . . . . . . . . . . . . . . . . . 89

efficiencies and garner full benefits of synergies on
account of the acquisition.
Once we have that in place, and I believe we are
not too far away from it, we will shift focus to
scalability. This sequence will ensure that benefits
of scalability percolate effectively to the bottom-
line and on a sustainable basis.
Early Signs of an Economic Revival
Asia’s third largest economy, saw urban consumers
spend less in calendar year 2012 due to high
inflation, muted salary hikes, and slowing economic
growth that affected both real wages and
sentiment.
We continue to face a tough economic
environment characterised by rising commodity
costs and high inflation. Most agencies have
forecasted an improvement in the GDP number for
FY 2013-14 and even more so for FY 2014-15. The
first signs of a turnaround are now visible as
inflation seem to be under control while private
consumption and investment growth have
increased.
As per the latest India Development Update of the
World Bank, it is estimated that the Indian
economy would grow by 6.1% in 2013-14 on
account of robust domestic demand, strong
savings and investment rate. Against the backdrop
of a normal monsoon projection this year, the
Dear Shareholders
“The world as we have created it is a process of
our thinking. It cannot be changed without
changing our thinking.”
~ Albert Einstein
The above quotation effectively captures what
each one of us at Jyothy Laboratories has been
focusing on during FY 2013. We have had a long
track record of success at creating brands and
achieving high market shares with a certain
business model that we had shaped up over the
years. We have defended our brands when they
were challenged by larger competitors based on
the insights we had of our customer’s
requirements. We used them effectively to build a
value for money portfolio for our consumers.
However, with the acquisition of Henkel India, we
needed to make big changes, since we moved into
a more competitive arena where we hope to cater
to a larger consumer base and diverse segments of
the market.
Our idea in FY 2012-13 was to optimise our
processes by fine-tuning our business to benefit an
entity of our size post Henkel and to compete in
the new categories we have entered into. We re-
visited each functional area of our business and
made the required changes to ensure operational
M. P. Ramachandran Founder, Chairman and Managing Director
Letter from the Chairman
3

While I discussed a lot of changes which we have
initiated, I must hasten to add here that at the
heart of our core business principle continues to be
that of providing value for the money that our
customers spend on the products across
categories. This remains our organisational goal
and all activities and efforts abide by this core
value.
The Road Ahead
During FY 2013-14, we hope to strengthen brands
which will encompass new creatives, marketing
spends and leveraging on the re-engineering
distribution system while maintaining production
efficiencies. Over a period of time, we hope to
grow in excess of the industry mean.
A Vote of Thanks
Although change is a constant phenomenon, it is
never easy to manage. The transitionary phase
through which our Company is passing too is
hence not an easy one by any yardstick. My
colleagues deserve a special mention here for
being the driving force behind the Company’s
achievements. I acknowledge and salute the high
level of commitment and dedication that they have
always brought to the table and this will continue
to be crucial in the future and even bigger
successes achieved by our company.
I also take this opportunity to thank each one of
our stakeholders who have reposed their trust in us
as we work towards a bigger and better tomorrow.
M. P. Ramachandran
(CMD)
necessarily mean a low price. It means offering
innovative products that are incremental,
transformational and in the nature of
breakthroughs.
Another important milestone and an outcome of
our integration with Henkel has been the
establishment of a Research and Development
Laboratory in Mumbai. This underlines our
commitment to provide constant development of
products. Going forward, this initiative will play a
big role in driving our Company’s growth in the
times to come.
Catalysts of Change
With a larger business to manage, we needed more
hands and particularly, experienced and expert
ones. The year saw the introduction of our CEO to
the Company supported by a strong team of 15
senior professionals across Marketing, Distribution,
Packaging, Manufacturing, Operations and all the
key functions that are present in every
multinational FMCG Company.
We have key brand managers now, who focus on
the brands. Along with new recruitments, our
existing team too is being groomed to take on
greater responsibilities. Setting up a second line
of management was necessary to induce fresh
thinking for the larger entity that Jyothy
Laboratories is now. Going forward, I strongly
believe that the long standing experience of the
Promoters and the complementing professional
skill sets of our second line of management will
ensure that we emerge further strong in FMCG
sector.
EBITDA Margins stood at 12.2% as opposed to
12.5% in the last year. Our EBITDA margins grew
steadily quarter on quarter, except for the Q4
where we undertook a one-time write off and also
reduced the supply of Ujala for almost 45 days, to
facilitate the New Shrink Packaged Ujala.
Given that Operating Profits and corresponding
margins had been the areas where we spent most
of the time during the year, we have managed to
set the ball rolling in a direction and manner
whereby the topline growth which we will achieve
hereon will be optimised.
We registered a Profit after Tax of ` 4,404 lakhs
after considering other income. We believe that
hereafter, with our focus on sales and a re-
engineered business model; we should see an
improvement in bottom-line growth.
Our Debt Equity Ratio stands at 0.66. We draw
comfort from the fact that we have real estate on
hand to sell and pay off to extinguish this debt,
though we are clear that we would do this only at
the right price and time. We are comfortably
servicing the same from internal cash accruals and
it is hence, fairly & comfortably manageable.
Having created a sustainable business model for
our size and scale, achieving scalability and driving
growth through higher market share should keep
us busy in FY 2013-14. Greater awareness and
visibility will be where most of the efforts will
remain concentrated.
Accelerating growth will require being smarter and
faster in everything we do. Today’s consumer is
very discerning and wants value, and value doesn’t
World Bank has indicated that India is regaining
economic momentum and growth is expected to
recover gradually and fulfil its high long-term
growth potential.
Compared with other sectors, the consumption
story remains intact, though the pace of growth
has slowed compared with previous years.
The FMCG sector continues to do well on the back
of robust consumption driven by the sheer size of
the Indian economy. We believe that the improving
macroeconomic trends are a positive sign for us.
Despite increasing short-term economic
uncertainty and GDP projections being revised
frequently, consumption in India is expected to
touch US$ 3,600 billion in 2020 from
US$ 900 billion in 2010, according to the CII and
Boston Consulting Group (BCG) report on Retail
and FMCG.
Translating our Efforts into Numbers
For FY 2012-13, Net Sales grew by 53.5%, to
` 1,01,738 lakhs on a standalone basis. In terms of
profitability the operating profits, which stood at
` 12,374 lakhs resulted in a growth of 48.8%. The
54
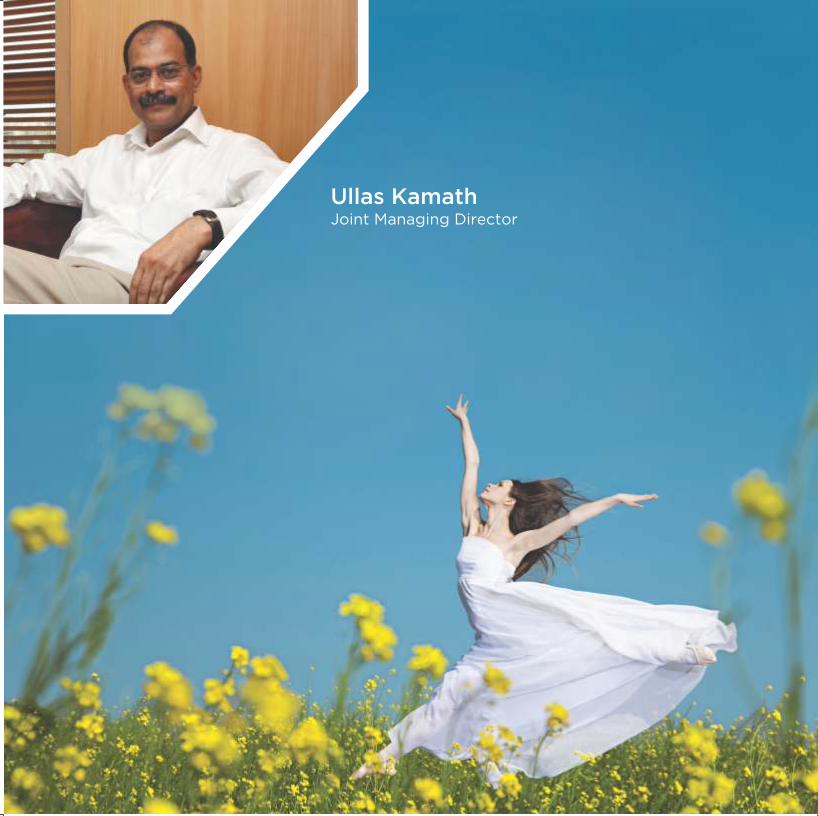
Ullas Kamath Joint Managing Director
7
made during FY 2012-13. “
“The core values of our Company remain intact,
which is to provide commensurate value for the
association our stakeholders have with our
Company, be it customers who spend on buying
our products, our vendor partners, our employees
or shareholders.”
On Adding New People….
“The Promoters of Jyothy Laboratories have a
long standing experience in the industry spanning
30 years. With Henkel, we grew in size and had
products which catered to a wider customer base
as well as different markets. Further, we were
convinced that given the stage which our
Company had reached, it was time to introduce
freshness into our thought process. Thus, we
brought in a CEO who would be responsible for
the fine tuning and functioning of the company as
a well oiled machinery and under him, we have a
professional team comprising functional heads for
various key division in the Company like
Manufacturing, Sourcing, Distribution and Brand
Management. “
Ullas Kamath shares his vision for Jyothy
Laboratories and his thoughts on the changes
happening at the Company and the rationale
behind the same.
On Change -- and why now ?
“Jyothy Laboratories has undergone a lot of
transformation in FY 2012-13. Let me first put this in
perspective from a management’s viewpoint. We
have had a glorious past with brand successes and
being market leaders and we had a certain way of
functioning which brought us to the stage where
we had reached.
“After we acquired Henkel, not only did we grow in
size, but we had to integrate the two organisations
such that as a combined entity it would function
like a well-oiled machine and derive optimal
benefits of the synergies be it sourcing,
manufacturing, distribution or marketing.”
More importantly it had to compete and thrive. For
this we had to shift away from the way we had
been functioning and incorporate the best industry
practices so as to be at par in the competitive
arena in which the merged entity operates. This
was the primary driver of the changes that we have
A 360 degree View From the desk of the Joint Managing Director

consumers.”“We were sure that if the synergies between
Henkel and Jyothy Laboratories were to fructify
optimally, we needed to deploy specialists in each
of the areas of operations, so that each functional
area gets its due attention and it could be run in
the most efficient way. It has also paved the way
for our organisation to become process driven in
as many ways as possible.”
“Notably, the introduction of this new team also
facilitates the grooming of our existing members
across the organisation. We believe that this fusion
gives us the best of both worlds as it combines the
passion and commitment of a family run entity and
the niche organisational skill sets of professionals.
Ultimately, our progress will be driven by people
who take personal ownership in both the results
and the process to get there. Each of us will play
an important role in ensuring we deliver excellent
results and achieve our goals.”
On what remains unchanged…
“We started the business in Kerala in 1983 and it
took us almost 17 years to grow from zero revenue
to ` 100 crore. However, it took us only 12 years to
grow from ` 100 crore to ` 1,000 crore. At Jyothy
Labs, we believe in simplicity. We never complicate
things and that is our success formula. Our values
remain the same and that is to ensure value for
what we provide and get paid for by our
98
Financial Review
(` in lacs)
Profit & Loss Account Balance Sheet
(` in lacs)
Particulars Standalone as on
31-03-2013 31-03-2012
Share Capital 1,612.64 806.32
Share Capital Suspense 5,527.92 -
Reserves and Surplus 65,261.73 66,544.25
Net Worth 72,402.29 67,350.57
Long Term borrowings 41,120.00 43,000.00
Deferred Tax Liabilities
(net) - 1,533.79
Long Term Liabilities 180.00 270.00
Long Term Provisions 917.68 631.76
Net Block 67,149.35 20,343.58
Capital Work in
Progress 326.71 281.81
Non Current
Investments 2,470.73 34,546.69
Long Term Loans
& Advances 49,626.42 54,857.92
Long Term Other
Assets 13.05 23.59
Cash and Bank
Balances 3,813.59 5,099.40
Current Assets
(Excluding Cash) 32,567.22 20,539.22
Current Liabilities 41,347.10 22,906.09
Particulars Standalone Year Ended
31-03-2013 31-03-2012
Net Sales 1,01,738 66,278
Other Income – Operating 136 66
Cost of Goods Sold 56,767 37,259
Employee cost 11,056 7,802
Advertisement and Sales Promotion 8,181 4,283
Other expenditure 13,496 8,686
Depreciation and Impairment 6,164 1,703
Interest 6,608 1,943
Other Income - Non Operating 4,985 5,654
Prior Period Item 183 -
Tax - 1,970
Total Income 1,01,874 66,344
EBITDA 12,374 8,314
EBITDA % to Net Sales 12.2% 12.5%
Profit before Prior Period 4,587 10,322
Profit Before Tax 4,404 10,322
Profit After Tax 4,404 8,352
Jyothy Laboratories
Awarded at the
Emerging India Awards
2013

1110
Business Review
Our Brands
Ujala
Henko
Mr. White
Chek
Fabric Care
Exo
Pril
Utensil Care
Margo
Fa
Neem
Personal Care
Region Sales (` In lacs)
Total % Distribution
EAST 21,230 21%
NORTH 19,449 19%
SOUTH 48,698 48%
WEST 10,500 10%
EXPORT 1,861 2%
Grand Total 1,01,738
Geographical Distribution Regional Presence for FY 2012-13
EAST
EXPORT
NORTH
SOUTH
WEST
21%
10%
48%
19%
2%
Household Insecticide
Maxo

Product Name : Ujala Fabric Whitener
Market Share by Value by Volumes Penetration
72.6% 59.06% 70.1%
Market Share Retail
Fabric Care Category Product Portfolio
Popular/Economy Check
Morelight
Mid-Premium Ujala
Mr.White
Premium Henko
Household Insecticide
Product
Name by Value by Volumes Penetration
Market Share Market Share Retail
Maxo Coils 16.2% 17.9% 25.4%
Maxo Liquid 4.8% 4.8% 16%
Segment Product Portfolio
Coil Maxo A Grade Green
Maxo A Grade Red
Maxo Low Smoke
Liquid
Vapouriser
Aerosol Maxo A Grade AIK
Maxo A Grade AIK

Utensil CareProduct Name by Value by Volumes Penetration
Market Share Market Share Retail
Exo Bar 11.1% 9.6% 18.1%
Exo Bar (South) 27.3% 24.4% 43.5%
Exo Liquid (South) 5.2% 5.2% 16.7%
Pril Liquid 20.8% 20.2% 25.3%
Category Product Portfolio
Utensil
Cleaning Bar Pril Perfect
Utensil Cleaning
Liquid Pril Perfect
Scrubber & Wipes ExoSafai
Floor Cleaner Exo Floor Shine
Exo Anti-Bacterial
Exo Anti-Bacterial
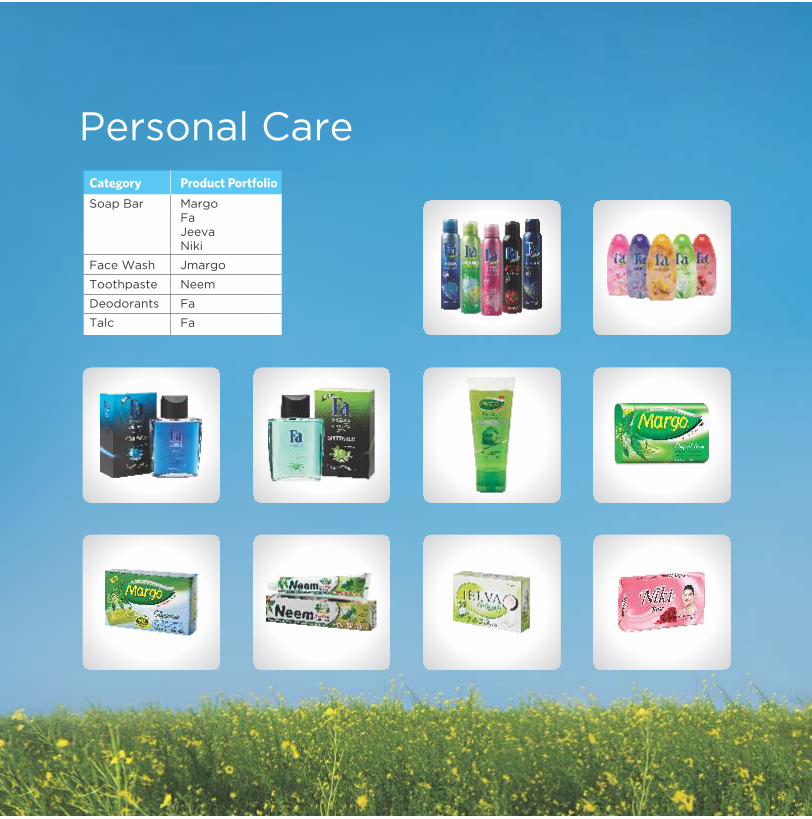
Personal CareCategory Product Portfolio
Soap Bar MargoFaJeevaNiki
Face Wash Jmargo
Toothpaste Neem
Deodorants Fa
Talc Fa
Utensil CareProduct Name by Value by Volumes Penetration
Market Share Market Share Retail
Exo Bar 11.1% 9.6% 18.1%
Exo Bar (South) 27.3% 24.4% 43.5%
Exo Liquid (South) 5.2% 5.2% 16.7%
Pril Liquid 20.8% 20.2% 25.3%
Category Product Portfolio
Utensil
Cleaning Bar Pril Perfect
Utensil Cleaning
Liquid Pril Perfect
Scrubber & Wipes ExoSafai
Floor Cleaner Exo Floor Shine
Exo Anti-Bacterial
Exo Anti-Bacterial
Personal CareCategory Product Portfolio
Soap Bar MargoFaJeevaNiki
Face Wash Jmargo
Toothpaste Neem
Deodorants Fa
Talc Fa

17
JFSL PRESENCE
Fabric SPA
Highlights:
• Country’s biggest laundry
chain with 103 retail outlets
• Current Operation in
Bangalore, Delhi, Mumbai,
Pune, Chennai, Jaipur and
Ahmedabad.
• Total turnover of
` 4427.95 lakhs as on
31st March, 2013. Map is indicative only & not to scale.
16
that are either Number 1 or Number 2 or strong
challenger brands in every category where it is
present. The bedrock of its success has been great
consumer insights, deep distribution reach, strong
execution capabilities, fiercely passionate
employees and an aggressive feet-on-street army
scouring all rural markets and distributing products
with great pride, vigour and passion.
When I joined this company, I realised that it had
all the necessary ingredients which can be
harnessed successfully. The acquisition of Henkel
had made the company a formidable player in the
FMCG domain. Business Model Re-engineering thus
became the order of the day. Each aspect of the
business was scrutinised in detail and then infused
with best practices primed to enhance both image
and market share. This "Fit to Complete" mantra
helped achieve excellence across all aspects of
business, in a highly competitive environment.
In the current year therefore, we as an organisation
are ready to be “Fit to Win” and our focus areas
Jyothy Laboratories currently has a formidable
array of brands with strong consumer equities,
excellent product quality and an amazingly loyal
consumer base. Ujala, Maxo, Exo , Pril , Margo, Fa
are household names in the country today. The
company has had a history of successful new
product launches, has had the gumption to enter
competitive market segments and create brands
CEO’s Viewpoint A Note from the CEO’s Desk
S. RaghunandanWholetime Director & Chief Executive Officer
1918
better” as a guiding philosophy and today we have
a single distributor selling all our products under
one unified umbrella.
The number of distributors has been rationalised.
Earlier, the company was functioning with owned
depots and Commercial Sales Agents whereas we
have now shifted our thrust to C&F outlets. The
top 20 per cent of our key distributors will be
covered by the company’s field force, while the
rest will be taken care of by the distributor’s
salesmen.
In the rural areas, we are distributing through a
super stockist. Zonal Commercial Structure has
been set up, to expedite business with distributors
and faster settlements. This will result in good
savings in distribution cost.
Automation of Secondary Sales and Order booking
has been implemented and eventually all
Distributor Claims and Secondary Schemes will be
automated through the same software by the end
of this financial year. We have rationalised our
channel margins in line with the competition.
now would be on great execution, harnessing and
motivating the Human resource talent that we
possess as an organisation, build strong systems
and processes, fine tune our manufacturing
strategy, improve our working capital
management, and more importantly grow our
brands to their potential and build a strong,
sustainable growth business for the future.
Last but not the least; we needed the power of an
organisation to realise our dreams. So, we focussed
on building a world class team which was capable
of dreaming and also achieving new frontiers.
Departmental heads supported by a dedicated
team have been put in place based on their
activities to ensure consistent efforts and results in
each business function.
I would now enumerate below in some detail on
the finer details of what we accomplished as a
team in the last year and more importantly give a
flavour of what we intend to focus on in the
coming year.
We needed to have a unified sales strategy in the
market place wherein we believed in “Bigger is
Distribution and Channel Management
Manufacturing & Packaging
When we set out to revamp the manufacturing
processes, our primary objective was to deliver
quality in a cost efficient manner. We also wanted
to consolidate our operations and ensure safety as
well as adherence to our manufacturing schedule
which has been aligned to scientific demand
forecasting. The process began with
standardisation and re-organisation of our
machinery across locations. Again, at each of our
locations we have commenced rationalisation of
processes such that products are processed at a
particular location till it is cost effective to do so.
The final stages of packaging, however, could
either be at the same unit or another unit which is
closer to the market and more cost effective.
We are working on the removal of overlaps and are
focusing on de-bottlenecking and higher capacity
utilisation to reduce the cost per ton of the
products we manufacture. We have also
commenced benchmarking the costs internally
across locations to ensure optimisation of
manufacturing activities.
We have worked on our packaging which has been
improved upon significantly to appeal to rural as
well as urban customers. We are implementing a
360 degree approach where we are keeping the
spotlight simultaneously on cost efficiency,
aesthetic appeal as well as the user friendliness of
our packaging.
Changes in the crucial Supply Chain Management
have been broadly undertaken at three levels –
strategic, tactical and operational. We have
deployed Information Technology to facilitate
Supply Chain Management
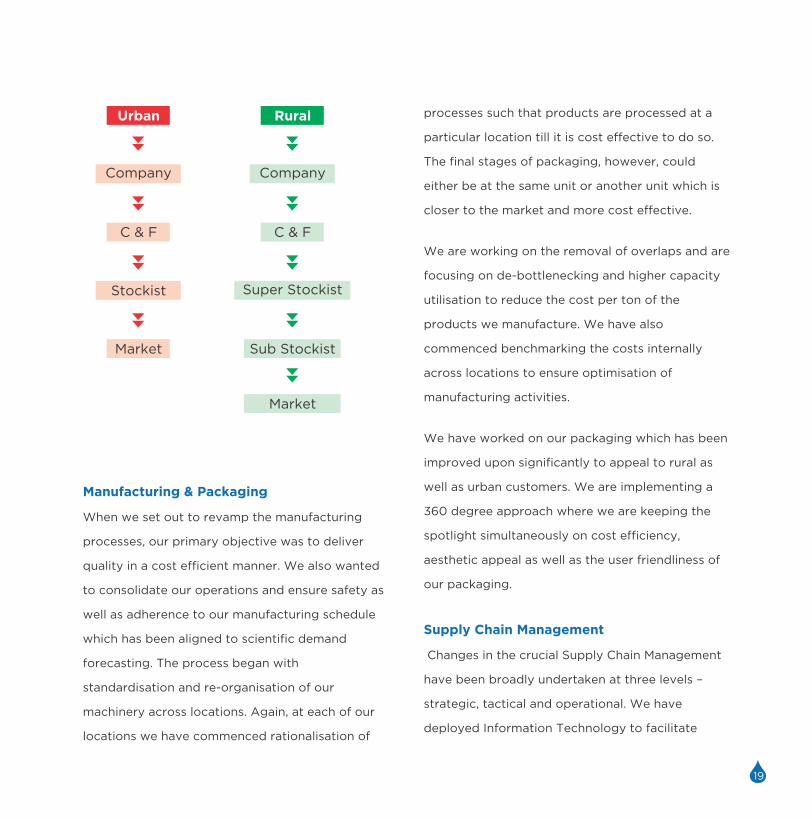
Urban
Company
C & F
Stockist
Market
Rural
Company
C & F
Super Stockist
Sub Stockist
Market
1918
better” as a guiding philosophy and today we have
a single distributor selling all our products under
one unified umbrella.
The number of distributors has been rationalised.
Earlier, the company was functioning with owned
depots and Commercial Sales Agents whereas we
have now shifted our thrust to C&F outlets. The
top 20 per cent of our key distributors will be
covered by the company’s field force, while the
rest will be taken care of by the distributor’s
salesmen.
In the rural areas, we are distributing through a
super stockist. Zonal Commercial Structure has
been set up, to expedite business with distributors
and faster settlements. This will result in good
savings in distribution cost.
Automation of Secondary Sales and Order booking
has been implemented and eventually all
Distributor Claims and Secondary Schemes will be
automated through the same software by the end
of this financial year. We have rationalised our
channel margins in line with the competition.
now would be on great execution, harnessing and
motivating the Human resource talent that we
possess as an organisation, build strong systems
and processes, fine tune our manufacturing
strategy, improve our working capital
management, and more importantly grow our
brands to their potential and build a strong,
sustainable growth business for the future.
Last but not the least; we needed the power of an
organisation to realise our dreams. So, we focussed
on building a world class team which was capable
of dreaming and also achieving new frontiers.
Departmental heads supported by a dedicated
team have been put in place based on their
activities to ensure consistent efforts and results in
each business function.
I would now enumerate below in some detail on
the finer details of what we accomplished as a
team in the last year and more importantly give a
flavour of what we intend to focus on in the
coming year.
We needed to have a unified sales strategy in the
market place wherein we believed in “Bigger is
Distribution and Channel Management
Manufacturing & Packaging
When we set out to revamp the manufacturing
processes, our primary objective was to deliver
quality in a cost efficient manner. We also wanted
to consolidate our operations and ensure safety as
well as adherence to our manufacturing schedule
which has been aligned to scientific demand
forecasting. The process began with
standardisation and re-organisation of our
machinery across locations. Again, at each of our
locations we have commenced rationalisation of
processes such that products are processed at a
particular location till it is cost effective to do so.
The final stages of packaging, however, could
either be at the same unit or another unit which is
closer to the market and more cost effective.
We are working on the removal of overlaps and are
focusing on de-bottlenecking and higher capacity
utilisation to reduce the cost per ton of the
products we manufacture. We have also
commenced benchmarking the costs internally
across locations to ensure optimisation of
manufacturing activities.
We have worked on our packaging which has been
improved upon significantly to appeal to rural as
well as urban customers. We are implementing a
360 degree approach where we are keeping the
spotlight simultaneously on cost efficiency,
aesthetic appeal as well as the user friendliness of
our packaging.
Changes in the crucial Supply Chain Management
have been broadly undertaken at three levels –
strategic, tactical and operational. We have
deployed Information Technology to facilitate
Supply Chain Management
Urban
Company
C & F
Stockist
Market
Rural
Company
C & F
Super Stockist
Sub Stockist
Market
21
Excerpts from M.R.Jyothy
UJALA
Ujala Supreme (fabric whitener):
Ujala Detergent Powder:
“The
brand has a legacy of market leadership
for over 20 years. In our pursuit to
attract new users and drive category
growth, we felt the brand needed a
complete makeover. However, we had to
be extremely careful in making any change to the
product or packaging, as we didn’t want to lose its
value proposition and identity amongst its loyal
customer base. This gave birth to the new
contemporary packaging for Ujala, an attractive
sleeved bottle, giving the brand the much needed
modern outlook.
The new advertising campaign showcases the new
look with a new TV Commercial titled ‘Safedi Ke
Aage Ujala’, built on the legacy of ‘Aaya Naya Ujala’
TV commercial first aired in the late 90’s. The TV
commercial attributes usage of the brand to
success. We believe these initiatives will help the
brand reinforce its value to current users and will
appeal to new users for its radiance which is
beyond whiteness.”
“We launched Ujala
IBF100, a mid-price segment
detergent powder in the four
southern states of India. It is the first
of its kind detergent powder in the
“We are in the process of rejuvenating most of our
brands in line with our marketing goals. The
categories we operate in offer great opportunities
to grow, and all our efforts are directed to ensure
our brands are positioned in a rightful and valuable
manner in all aspects to serve the discerning
consumer”
20
M.R.Jyothy
Executive Director and Marketing Head
at Jyothy Laboratories,
shares her vision for Jyothy brands
better planning of manufacturing schedules in
accordance with demand forecasting. It also helps
us source raw materials efficiently by availing of
economies of scale as we can place orders in bulk
at an integrated level. Resultantly, we are able to
place orders at the optimal time and Inventory and
Despatch of goods is also undertaken optimally.
The entire exercise is aimed at ensuring lower
blockage of funds in inventories, deriving benefits
on account of scale and timely transit of goods to
distributors. The icing on the cake comes in the
form of cost savings.
With centralised demand forecasting and co-
ordination of schedules for manufacturing, we are
also able to centrally source and leverage on our
scale and derive the benefits of Henkel’s
integration. We follow the simple but highly
effective cost plus model in terms of pricing. A
core purchase team has been put in place for
vendor management and their core functions
include negotiating with existing vendors, scouting
for new suppliers, engaging them etc. We have
implemented a request for quotation format where
we invite suppliers to a bidding process for the
Sourcing
supply of specific raw material, thereby ensuring
that we get best prices.
In today’s competitive landscape with increasing
consumer awareness, constant improvisation of the
product is a must. It is a step forward in quality
management and improvement as we will be
undertaking product testing, competition
benchmarking and cost reduction initiatives
through this route. Additionally we will have
accelerated storage stability facility to help us
forecast the long term stability of our products. We
will also be exploring tie-ups with external
laboratories, universities and suppliers to develop
technology for our innovations.
Research & Development
authentic Neem extracts. Neem is considered as a
natural anti-bacterial agent especially used in skin
care products. Margo is one of the largest selling
Neem oil based soaps in WB and has a sizeable
market share in the East and South regions of India.
Our last campaign on Margo gave us good results.
We consider our efforts to make the brand appeal
to younger women was successful. Going forward
we will ensure to keep up the momentum by
deploying the right marketing mix to communicate
the proposition of “clear skin is beautiful skin”.
“Fa is commonly known in
India as a women’s deodorant
brand. The deodorant
category for women in India
is pegged at ` 500 crore with
growth rates of over 30%.
Being an international brand,
we look to capitalise on this opportunity by
focusing on the product offering and reach.
We have introduced 4 new fragrances in a smaller
sized bottle that can easily fit into a ladies
handbag. The rationale here is that we’d be
focusing on women’s range of products for some
time now. ‘Fa Feel Fantastic’ is a global positioning
for the brand. Our recent campaign that beautifully
captures the feel fantastic moments expressed
through ‘Hugs’ has got us very good reviews and
results. Riding on the existing brand equity and our
continued efforts, we are very bullish about Fa
growing more than the category growth rates”.
FA : Deodorant
grease removal. Winning the ‘Product of the Year’
award stands testimony to the value Exo delivers.
Not the least, Exo was India’s first anti-bacterial
dish wash brand. Being the pioneers of this
property and the Round format, our efforts are to
ensure we make the product easily available across
India and let the consumers make an informed
choice.
The current campaign on the bar aims to educate
the consumer about the source of bacteria on
utensils and how Exo can help one stay healthy;
and the campaign for Exo Round showcases the
benefits that won the brand the coveted ‘Product
of the year’ title. We already have a sizeable
market share in South, with all the current activities
and the initiatives planned, we believe this brand
will soon become the most preferred dish wash bar
across India”
“Margo as a brand has been in
existence for over 95 years. It is one
of the few brands which contain
MARGO: Neem based Soap
brand logo, followed with packaging and the
introduction of the new liquid repellent with actor
R. Madhavan endorsing it, Maxo has set its foot to
become one amongst the top three liquid
vaporizer brands. With new products planned
there is a lot of excitement around the brand to be
unfolded”
“The Liquid Dish wash category is growing
at a healthy rate of 30%. Pril is India’s first
dish wash liquid brand. It enjoys high
saliency and our efforts have been
directed to make the product easily
available to the consumers in convenient
pack sizes. The advertising campaign attempts to
connect with the young and progressive
individuals. They see their better halves as their
equals; here the relationship takes precedence
over anything else. With our extensive
understanding of this category and the consumer,
new variants will be introduced as we go along to
strengthen the product offering. With these efforts
we believe Pril will soon reclaim its top position in
the liquid dish wash segment”
“Exo is one of the fastest growing
brands in our portfolio. We were the
first to offer the bar in a round format
inside a plastic container. Soon many
followed us, but none could offer the
quality and precision with which Exo delivers its
superior value of Zero Wastage and Effective
PRIL : Premium Dish Wash
EXO : Dish Wash Bars
country. It has a unique product feature called
‘Intense Brightness Factor’ that makes clothes
much brighter than any other product in the
segment. With a great value proposition of 100
watt brightness, we believe this product will only
grow with time”
“Henko failed to gain the desired traction and grow
in the premium detergent space
while it was with the erstwhile
Henkel team, owing to multiple
reasons. Yet it has high brand
saliency and equity amongst the
target consumers. Our initial efforts
were intended to capitalise on this
equity by making the product easily available. We
have further enhanced the product quality and
changed the positioning of the brand with a
promise to remove stains but without causing any
damage to the fabric. We want the consumers to
know this inherent feature of the product that
comes with ‘Oxygen Power’. The catchy phrase
“Daag Nikale Magar Pyar Se” seemed to have
already caught on.”
“Maxo is one of the top three
mosquito coil brands today, and with
an innovation in liquid repellent that
fits into any vapouriser machine, the
brand is poised to lead its way into
the competitive liquid space. The brand underwent
a complete overhaul last year, with change in the
HENKO : Premium Detergent
MAXO : Insect Repellent
2322
Exo wins product of the year 2013
Indians have been the most confident consumers
globally in the fourth quarter of 2012 according to
a recent study by Nielsen. Consumer confidence in
the country increased by 2 points to 121 between
Q4, 2012 and Q3, 2012. Indian consumer markets
which can be broadly categorised into rural and
urban markets – are primarily being driven by
factors like favourable demographics, higher
disposable incomes, rising middle class,
government support, internet revolution and
digitisation.
As per CII, the Indian FMCG sector is the fourth
largest sector in the economy with a total market
size in excess of US$ 13.1 billion. It has a strong
MNC presence and is characterised by a well-
established distribution network, intense
competition between the organised and
unorganised segments and low operational cost.
Availability of key raw materials, cheaper labour
The Fast Moving Consumer Goods (FMCG)
Industry
Macro Economic Scenario
The World Bank has revised India's growth
forecast to 6.1% for the current fiscal which is a
downward revision. This was largely due to the
decline in agriculture sector growth estimate which
is expected to grow at 2% during 2013-14 against
the previous estimate of 2.7%, despite a normal
monsoon projection. However, the multilateral
funding agency has opined that India is regaining
economic momentum and growth is expected to
recover gradually to help fulfil its strong long-term
potential.
Growth projections for 2013-14 have been arrived
at by taking into account present internal and
external factors. Growth is expected to increase
further to 6.7% in 2014-2015. Recent data point to
some improvements in economic activity: the
inflation and trade deficit came down in recent
months, while private consumption and investment
growth accelerated in the third quarter of
2012-2013.
25
Management Discussion And Analysis
24
Government. Urban expansion in India is
anticipated to pace-up unlike anything the country
or the world has seen before. It took nearly 40
years (from 1971 to 2008) for India’s urban
population to rise by nearly 230 million but it will
now take only half that time to add the next 250
million, according to a report by McKinsey.
At the same time, with about 70 per cent of the
Indian population residing in the hinterlands, the
rural markets too present a significant opportunity
for business conglomerates. Rural spending was
significantly higher at ` 3, 75, 000 crore
(US$ 69.44 billion) than urban consumption at
` 2, 99, 400 crore (US$ 55.44 billion) between
2009-10 and 2011-12; wherein rural consumption
per person outpaced its urban counterpart by 2
per cent, according to a study by CRISIL and
preliminary data released for 2011-12 by the
National Sample Survey Organisation (NSSO).
1. Inflationary Pressures cooling off marginally
The upward trend in raw material costs which has
been witnessed has tapered off towards the end of
the year. This has released some pressure on the
FMCG sector’s margins.
Key Industry Trends & Growth Drivers
costs and presence across the entire value chain
gives India a competitive advantage. The FMCG
market is set to treble from US$ 11.6 billion in 2003
to US$ 33.4 billion in 2015. Penetration level as well
as per capita consumption in most product
categories in India is low, indicating untapped
market potential. The rapidly growing Indian
population, particularly the middle class and the
rural segments, presents an opportunity to makers
of branded products to convert consumers to
branded products. Growth is also likely to come
from consumer 'upgradation' in the matured
product categories.
The urban markets in India are poised for
exponential growth in the coming years as the
urban population has been estimated to grow at
about 2.3 per cent between 2006-2016 while the
overall population is anticipated to grow at an
annual rate of about 1.4 per cent.Thus,
acknowledging urbanisation at such a massive
scale facilitates multiple opportunities to domestic
and foreign majors to invest and expand their
presence in the Indian urban markets.The urban
markets in India are primarily driven by the youth
and their growth is propagated by better
infrastructure and facilities disseminated by the

shopping experience, access to diverse categories
as well as a wide variety of brands under a single
roof and attractive prices.
4. Improving Macroeconomic Scenario to benefit
FMCG space
With the rise in disposable incomes, mid and high-
income consumers in urban areas have shifted their
purchasing trend from essential to premium
products. In response, firms have started
enhancing their premium products portfolio. Indian
and multinational FMCG players are leveraging
India as a strategic sourcing hub for cost-
competitive product development and
manufacturing to cater to international markets.
5. Reforms Initiatives required
The multiple taxation system in India is yet to be
overhauled and simplified. With implementation of
GST which has been facing delays, pricing is
expected to become more efficient.
2. Rural Demand continues to drive growth
The Government of India has been supporting the
rural population with higher minimum support
prices (MSPs), loan waivers, and disbursements
through the National Rural Employment Guarantee
Act (NREGA) programme. These measures have
helped in reducing poverty in rural India and have
thus propped up rural purchasing power.
Resultantly, Rural India continues to be the largest
market for FMCG Companies.
3. Modern Trade continues to gain momentum
Modern Trade (MT) has a market share of 9.2% in
overall FMCG sales. But MT still continues to be an
urban phenomenon. As per Nielsen, 17 key metros
account for a whopping 73% of overall modern
trade in India and accounted for a third of the
general trade's sales in those geographies. Further,
one in every five urban shoppers now frequents
Modern Trade in the form of super or hyper
markets. This growing importance of MT has also
resulted in FMCG companies setting up sales and
marketing teams dedicated only to MT. As per
Nielsen, the proportion of consumers who claim to
shop at MT "occasionally" has grown from 54% last
year to 66% in 2012. This growth is being fuelled by
many factors such as a comfortable and modern
26
Industry Size and Statistics (source: AC Neilson )
Liquid Blues - Volumes
in ‘0
00
Lit
res
April 2010 - March 2011
April 2011 - March 2012
April 2012 - March 2013
34,159
33,671
33,654
Total
13,433
14,149
14,531
Urban
20,726
19,522
19,123
Rural
35,000
30,000
25,000
15,000
10,000
-
5,000
20,000
40,000
Liquid Blues - Value
in `
in
Cro
res
500
400
300
100
-
April 2010 - March 2011
April 2011 - March 2012
April 2012- March 2013
449
490
524
Total
191
218
240
Urban
258
272
284
Rural
200
600
Coils - Volumes
in M
illio
n
7,000
6,000
5,000
3,000
2,000
April 2010 - March 2011
April 2011 - March 2012
April 2012- March 2013
6,005
6,571
6,858
Total
3,329
3,670
3,783
Urban
2,676
2,901
3,075
Rural
4,000
8,000
1,000
-
Coils - Value
in `
C
rore
s
1,400
1,200
1,000
600
400
April 2010 - March 2011
April 2011 - March 2012
April 2012- March 2013
1,203
1,346
1,482
Total
689
775
841
Urban
514
571
641
Rural
800
1,600
200
-
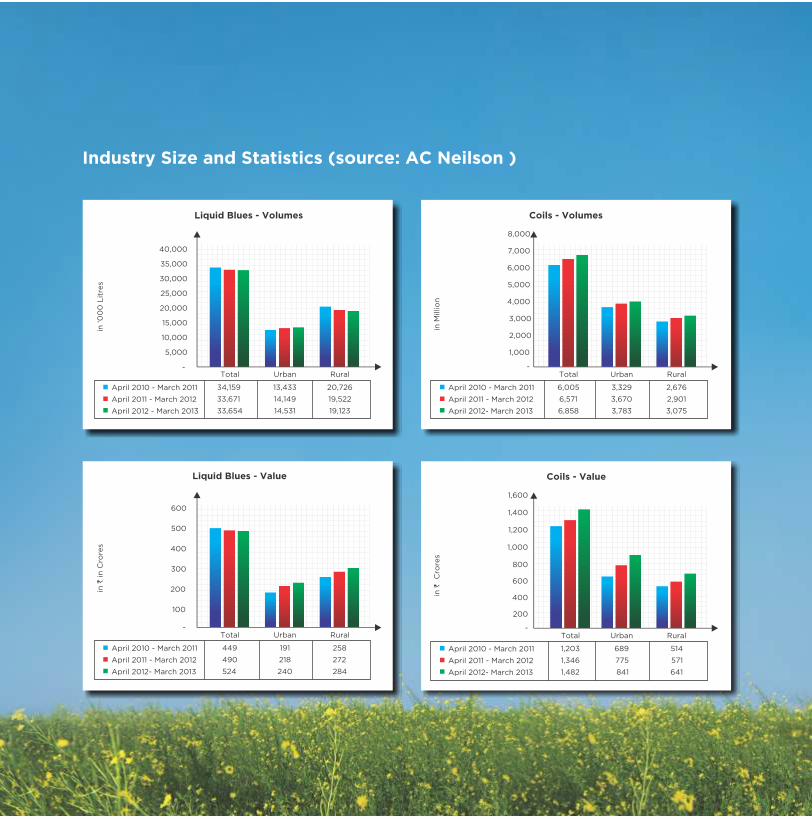

Dishwash Bars - Volumes
in T
on
s
250,000
200,000
150,000
50,000
April 2010 - March 2011
April 2011 - March 2012
April 2012- March 2013
208,947
236,888
262,766
Total
142,175
155,974
170,926
Urban
66,772
80,914
91,840
Rural
100,000
300,000
-
Dishwash Bars - Value
in `
Cro
res
1,500
1,200
900
300
April 2010 - March 2011
April 2011 - March 2012
April 2012- March 2013
1,004
1,217
1,543
Total
684
803
1,004
Urban
320
414
539
Rural
600
1,800
-
Washing Powder - Volumes
in T
on
s
2,000,000
1,500,000
1,000,000
April 2010 - March 2011
April 2011 - March 2012
April 2012- March 2013
1,949,794
1,927,088
2,024,762
Total
907,971
914,163
986,271
Urban
1,041,823
1,012,925
1,038,491
Rural
500,000
2,500,000
-
Washing Powder - Value
in `
Cro
res
10,000
8,000
6,000
2,000
April 2010 - March 2011
April 2011 - March 2012
April 2012- March 2013
8,223
9,162
11,090
4,403
4,949
6,079
3,820
4,213
5,011
4,000
12,000
-Total Urban Rural
Dish Wash Liquid - Volumes
in T
ons
200
150
100
April 2010 - March 2011
April 2011 - March 2012
April 2012- March 2013
119
149
206
Total
109
134
186
Urban
10
15
20
Rural
50
250
-
Dish Wash Liquid - Value
in `
Cro
res
12,000
10,000
8,000
4,000
April 2010 - March 2011
April 2011 - March 2012
April 2012- March 2013
8,485
10,082
12,939
Total
7,811
9,169
11,799
Urban
674
913
1,140
Rural
6,000
14,000
-
2,000
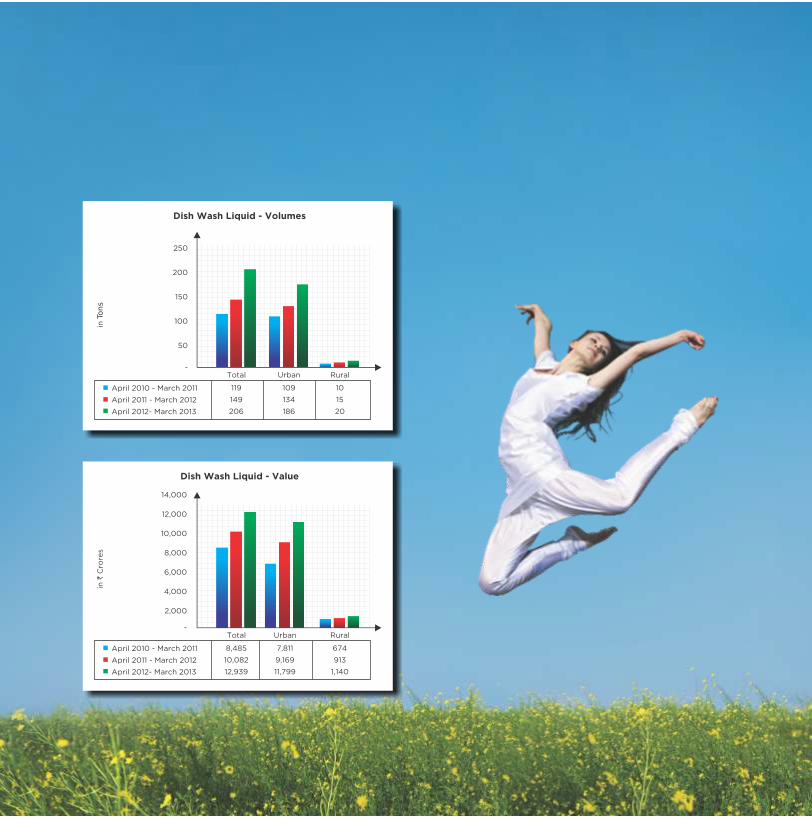

Risk Addressal
• Rising Input Costs: With the integration in
place, Jyothy is able to leverage on the
benefits provided by its scale. Further, the
Company has dedicated staff for vendor
management and purchases are made
through request for quotation format to
avail of the best prices.
• Flat growth in Maxo: Maxo is presently in the
highly competitive segment. The company
is working on the packaging for Aerosols
and different containers for Vapourisers
which are the key focus areas. Further, the
Company is implementing cost savings
measures on the production side. Achieved
15% growth in the year 2012-13.
• Supply Chain Management: With Henkel’s
integration completed, Jyothy has moved
towards a scientific process of demand
forecasting using Information Technology
and this is aligned with raw material
purchases, manufacturing etc which results
in better inventory management and is easy
in servicing distributors.
• Competition: Jyothy has moved into a very
competitive landscape. The Company will
Jyothy Laboratories’ Competitive
Positioning
• Renewed identity of the Company with a
professional team of second line
management backed by the long standing
experience of the promoters.
• Strong presence in Rural as well as Urban
markets with products available in 2.9
million outlets in India as of March 31, 2013,
alongside 1 million direct outlets
• Consolidated Distribution network of 1700
distributors in Urban and 200 Super
Stockists & 2000 Sub Stockists in Rural
across the country.
• Zonal Commercial Structures in place
with seven Zonal Sales Managers
encompassing 2 in South India, 2 in North,
2 in East and 1 in the West.
• Higher capacity utilization to reduce cost /
ton of product being worked upon.
Manufacturing Schedules closely co-
ordinate with scientific demand forecasting.
31
thus be investing in advertisements and
promoting brand awareness. 7 power
brands have been identified which will be
marketed aggressively with new
communication.
Accounting policy
The Company follows the Generally Accepted
Accounting Principles (GAAP) in India, applicable
accounting standards and other necessary
requirements of the Companies Act, 1956 for the
preparation of its financial statements. The
Company uses accrual basis of accounting except
in cases of assets for which provision for
impairment is made.
The Year 2012-13
Total Revenue rose by 48.4% at ` 1,06,859 on y-o-y
12 months period including non-operating income
of ` 4,985 lacs. Net Sales registered a 53.5%
growth at ` 1,01,738 lacs on standalone basis.
FINANCIAL PERFORMANCE
The following table indicates the category
wise growth rates for the 12 months period
April 1, 2012 to March 31, 2013.
Cost Analysis
Total cost (excluding interest and
depreciation) of the company grew by
54.2% to ` 89,500 lacs in the 12 months
period ended March 31, 2013 from ` 58,030
lacs in corresponding period of 2011-12 on
account of an increased operational scale.
30
Category Amount in Lac
2013 2012
`
Fabric Care 44,349 31,503
Household
Insecticide 16,902 14,773
Dishwashing 27,013 16,329
Personal Care 9,635 657
Others 3,839 3016
Total 1,01,738 66,278
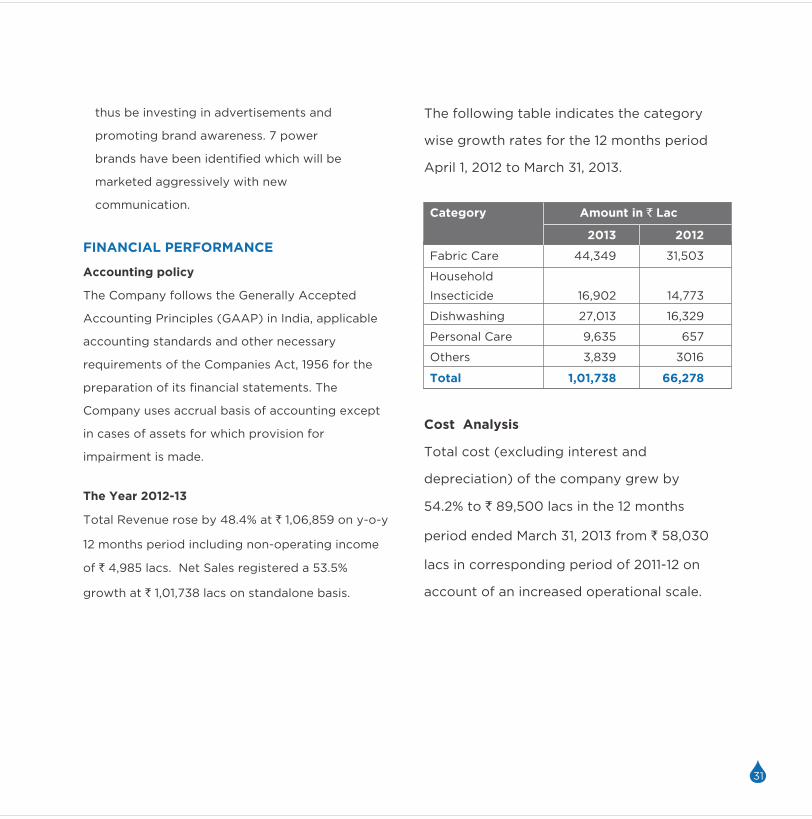
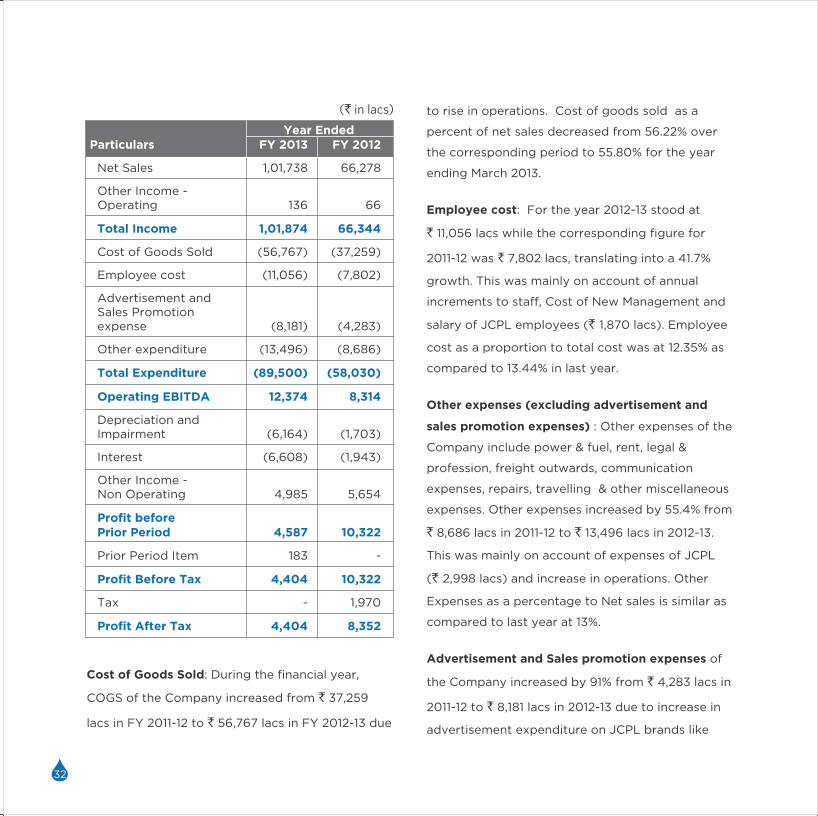
33
(` in lacs) to rise in operations. Cost of goods sold as a
percent of net sales decreased from 56.22% over
the corresponding period to 55.80% for the year
ending March 2013.
Employee cost: For the year 2012-13 stood at
` 11,056 lacs while the corresponding figure for
2011-12 was ` 7,802 lacs, translating into a 41.7%
growth. This was mainly on account of annual
increments to staff, Cost of New Management and
salary of JCPL employees (` 1,870 lacs). Employee
cost as a proportion to total cost was at 12.35% as
compared to 13.44% in last year.
Other expenses (excluding advertisement and
sales promotion expenses) : Other expenses of the
Company include power & fuel, rent, legal &
profession, freight outwards, communication
expenses, repairs, travelling & other miscellaneous
expenses. Other expenses increased by 55.4% from
` 8,686 lacs in 2011-12 to ` 13,496 lacs in 2012-13.
This was mainly on account of expenses of JCPL
(` 2,998 lacs) and increase in operations. Other
Expenses as a percentage to Net sales is similar as
compared to last year at 13%.
Advertisement and Sales promotion expenses of
the Company increased by 91% from ` 4,283 lacs in
2011-12 to ` 8,181 lacs in 2012-13 due to increase in
advertisement expenditure on JCPL brands like
Year Ended Particulars FY 2013 FY 2012
Net Sales 1,01,738 66,278
Other Income - Operating 136 66
Cost of Goods Sold (56,767) (37,259)
Employee cost (11,056) (7,802)
Advertisement and Sales Promotion expense (8,181) (4,283)
Other expenditure (13,496) (8,686)
Depreciation and Impairment (6,164) (1,703)
Interest (6,608) (1,943)
Other Income - Non Operating 4,985 5,654
Prior Period Item 183 -
Tax - 1,970
Total Income 1,01,874 66,344
Total Expenditure (89,500) (58,030)
Operating EBITDA 12,374 8,314
Profit before Prior Period 4,587 10,322
Profit Before Tax 4,404 10,322
Profit After Tax 4,404 8,352
32
from 67,351 lacs as on March 31st, 2012 to
` 72,402 lacs as on March 31st, 2013.
Return on net worth of the Company for 12 month
year ending March 2013 stood at 6.08% as
compared to 12.4% for the corresponding period of
the previous year.
Equity: The equity share capital (issued and
subscribed) of the Company consists of
161,264,000 equity shares of ` 1 each.
Reserves and surplus: The reserves and surplus of
the Company stood at ` 65,262 lacs.
Loan funds
The debt portfolio of the Company comprises of
bank overdraft, commercial paper, bank term loans
and secured redeemable non convertible
debentures amounting to ` 53,720 lacs.
Net block
The net block of the Company as on
31st March, 2013 stood at ` 67,149 lacs, which
includes asset taken over from JCPL of
` 37,874 lacs.
Net working capital of the Company stood at
` 3820.40 lacs as on March 31, 2013 as compared
to ` 6700.09 lacs as on March 31, 2012 due to
effective working capital management.
` Margo, Henko and Pril. Further, advertisement
expenditure as percentage to net sales have gone
up from 6% in 2011-12 to 8% in 2012-13 with a view
for generating better pull for all the Brands.
Margins
EBIDTA margin of the Company was 12.2% in
2012-13 as compared to 12.5% in 2011-12. This was
mainly on account of the business model re-
engineering exercise we undertook during the year.
Further, in 2011-12 the margins were for standalone
Jyothy Laboratories Limited whereas for 2012-13 it
included margins for Jyothy Consumer Products
Limited which was loss making in the previous
years.
PAT stood at ` 4404 lacs as compared to ` 8,352
lacs in the previous year on account of cascading
effect from the operational level and mainly due to
amortization of brand and goodwill to the tune of
` 4,471 lacs.
Capital employed (taken from segment wise
revenue and capital employed data)
Total capital employed stood at ` 72,402 lacs for
the 12-month year ending on March 31, 2013. For
the 12-month year March 2012, it stood at ` 67,351
lacs.
Own funds
The net worth of the Company increased by 7.5%
Cost of Goods Sold: During the financial year,
COGS of the Company increased from ` 37,259
lacs in FY 2011-12 to ` 56,767 lacs in FY 2012-13 due

Inventory:
Inventory of the company stood at 16,744.64 lacs
as on March 31, 2013 as compared to ` 7928.19 lacs
as on March 31, 2012. Inventory turnover for the
company stood at 108 days for 12 months year
ending March 2013 as against 78 days against the
corresponding period of 2011-12.
Sundry debtors:
Sundry debtors for the Company stood at
` 11,001.76 lacs for 12 month year ending
March 2013.
Debtor turnover stood at 22 days for 12-month
year ending March 2013. For the corresponding
period of the previous year, the same stood at
23 days.
Cash and bank balances:
Cash and bank balances for the Company stood at
` 3,813.59 lacs.
Loans and advances:
Loans and advances for the Company stood at
` 54,042.16 lacs as on 31st March, 2013 as against
` 59,771.93 lacs as on 31st March, 2012.
Other liabilities and provisions:
Other liabilities and provisions for the Company
stood at ` 18,344.34 lacs.
`
34
Sundry creditors for the Company stood at
` 11,500.16 lacs as on March 2013 as against
` 6,326.44 lacs as on March 31, 2012.
Dividend
The board has recommended a dividend @ ` 2.5/-
(250%) per share for the financial year 2012-2013
against the dividend of ` 2.5/- (250%) per share
paid for the year 2011-12.
Working Capital
Particulars 2013 2012
Current assets
32,567.22 17,314.93
Current Liabilities
28,746.82 10,614.84
Net working Capital 3,820.40 6,700.09
Inventories 16,744.64 7,928.19
Trade receivables 11,001.76 4,251.55
Loans and advances 4,415.74 4,914.01
Other assets 405.08 221.18
Trade payables 11,500.16 6,326.44
Other current liabilities 10,196.04 1,498.58
Provisions 7,050.62 2,789.82

Directors’ report
35 | Jyothy Laboratories Limited
To,
The Members,
Your Board of Directors is pleased to present the 22nd Annual Report together with the Audited Financial Statements for the year ended March 31, 2013 compared with previous financial year as follows:
(` in lacs)
Financial results FinancialYear ended
March 31, 2013
FinancialYear ended
March 31, 2012 Net SalesOther Income
101,737.67 305.56
66,278.15 517.63
Earnings before interest, tax, depreciation, amortization and impairment 12,543.48 8,765.36Interest & Finance Charges/(Income) Net 1,792.67 (3,259.35)Depreciation, Amortization and Impairment - TangiblesDepreciation and Amortization - Intangibles
1,516.244648.28
1,434.73268.46
Prior year items- ExpensesProfit before tax
182.714,403.58
-10,321.52
Provision for tax- Current tax - (MAT Payable)- MAT Credit (entitlement)
885.00(885.00)
2,010.00-
- Deferred tax charge/(reversal) - (40.04)Profit after tax 4,403.58 8,351.56Balance as per last Balance Sheet – Brought forward 6,745.54 2,736.79Balance available for appropriations 11,149.12 11,088.35Appropriations:Final Dividend on Equity Shares 4,150.59 2,015.80Corp. Dividend Tax 705.39 327.01Transfer to General Reserve 500.00 2,000.00Transfer to Debenture Redemption ReserveBalance Carried Forward (Profit and Loss Account)
1,250.004543.14
-6,745.54
Earning Per Share (Basic and Diluted) 2.65# 5.18@Cash ProfitCash EPS
10,568.106.37#
10,054.756.23@
Dividend Per Share 2.50# 1.25@# On post bonus and post merger equity capital.@ On post bonus pre merger equity capital.
Amalagamation of Jyothy Consumer Products Limited (Formerly Henkel India Limited) with the Company
Your Directors are pleased to inform that the process of amalgamation of Jyothy Consumer Products Limited (Transferor Company) (formerly known as Henkel India Limited) was completed on April 12, 2013, when the Honourable judge of Bombay High Court approved the Scheme of Amalgamation. Appointed Date was April 1, 2012, whereas compliances like filing of necessary e-Forms with Registrar of Companies were completed on May 13, 2013 and the amalgamation has become effective from that date.

36 | Jyothy Laboratories Limited
Your Directors had fixed May 28, 2013 as the ‘Record Date’ to determine eligibility of shareholders of the Transferor Company to get shares of the Company. Process of allotment and listing of shares is expected to be completed around June end, 2013. Directors welcome the shareholders of the Transferor Company.
Performance
The financials for the current financial year are not comparable with the previous financial year. Financials for the year under review reflect the affect of merger of Jyothy Consumer Products Limited (JCPL) with the Company for the full year. Financials for the financial year 2011-12 are in respect of the full year of the Company as it stood prior to the merger of JCPL.
During the financial year ended March 31, 2013, the Company recorded Net Sales at ` 1,01,737.67 lac compared to ` 66,278.15 lac in the previous financial year. In the financial year under review, Profit after Tax and Cash Profit compare as follows:
(` lac)
Particulars 2012-13 2011-12
Profit after tax but before depreciation and amortization of Goodwill, Copyrights and Trademarks acquired due to amalgamation of JCPL 8,874.12 8,351.56
Depreciation and amortization of Goodwill, Copyrights and Trademarks acquired due to amalgamation of JCPL 4,470.54 Nil
Profit after Tax 4,403.58 8,351.56
During the year under review, the sales of soaps and detergents was ` 75,594.59 lac compared to ` 44,554.67 lac in previous year and the sales in homecare segment grew to ` 24,490.86 lac compared to ` 21,785.18 lac in previous year. The sales and profit in soaps and detergents reflect the effect of amalgamation of JCPL as well. The profitability in homecare segment improved considerably from a segment loss of ` 1,594.59 lac in previous year to profit of ` 794.13 lac in the current year.
Finance
The borrowings as on March 31, 2013 was at ` 53,720.28 lac (previous year ` 55,291.25 lac). Net working capital as on March 31, 2013 was at ` 3,820.41 lac compared to ` 6,700.08 lac at the end of previous year.
Issue of Bonus Shares
During the year, the Board of Directors of your Company had issued and allotted bonus shares in the ratio of one new bonus equity share of face value of ` 1/- each for every one equity share held by the members as on July 16, 2012 (Record Date decided for the purpose). After bonus issue, paid up capital of the Company was augmented and stood at ` 16,12,64,000/-.
Dividend
For the financial year under review, the Board is pleased to recommend a dividend @ 250% of face Value of Equity Shares of ` 1/- each (i.e. ` 2.50 per equity share), aggregating to cash outlay of ` 4,855.98 lac including dividend distribution tax of ` 705.39 lac. The dividend is payable on the equity capital enhanced by the issue of bonus shares in the ratio of 1:1 and also on 47,59,496 equity shares of ` 1/- each of the Company to be issued to the shareholders of erstwhile JCPL consequent upon its amalgamation with the Company. In the previous financial year, the Board had recommend and paid a dividend @ 250% of face Value of Equity Shares of ̀ 1/- each (i.e. ̀ 2.50 per equity share) on pre- bonus equity capital of the Company involving cash outlay of ` 2,342.81 lac including dividend distribution tax of ` 327.01 lac.
The dividend will be paid to eligible members if approved by them at the ensuing Annual General Meeting of the Company.
New Developments & Initiatives
with the Company.
profitability across entire value chain.
� Better and packaging
� Supply Chain project to improve working capital management through business planning and improvements in operating processes
� Integration of sales and distribution of Henkel with the Company
� Consolidation of distribution network and movement toC & F model
� Rationalisation of channel margins
competitiveness through improvement in operational efficiencies and capacity debottlenecking.

Annual Report 2012-13 | 37
Bangladesh
financial year 2013-14.
Management Discussion & Analysis Report:
Management’s Discussion & Analysis Report is attached and forms part of this Directors’ Report.
Corporate Governance:
As per Clause 49 of the Listing Agreement with the stock exchanges, a Section on Corporate Governance is presented separately and forms part of this Report.
Consolidated Financial Statements
In accordance with Accounting Standard 21, issued by the Institute of Chartered Accountants of India, Consolidated Financial Statements have been provided in the Annual Report. These Consolidated Financial Reports provide financial information about your Company and its subsidiary companies as a single economic entity. The Consolidated Financial Statements form part of this Annual Report.
Subsidiary Companies
The Central Government vide General Circular No. 2/2011 dated February 8, 2011 has exempted the holding companies from attaching Annual Accounts and other documents in respect of its subsidiaries to the Annual Report of the holding companies from the financial years ended on or after March 31, 2011. As required vide above letter, statement in respect of each of its subsidiary, giving details of capital, reserves, total assets and liabilities, details of investments, turnover, profit before taxation and proposed dividend is attached to the Consolidated Balance Sheet. Annual accounts of the subsidiary companies and the related detailed information will be made available to the shareholders of the Company, seeking such information and will also be made available for inspection at the Registered Office of the Company.
Jyothy Fabricare Services Limited
Members are aware that the Company had started a new Value Added Service in fabric care segment to provide “World class laundry at affordable price at your doorstep” and other related services through its subsidiary company namely Jyothy Fabricare Services Limited (JFSL).
The Laundry Plant with 10 tons/day capacity at Ahmedabad, set up on BOOT model by JFSL – JLL (JV) for the Western Railways,
has commenced its operation in the month of January, 2013. By adopting improvised methods, the JV has achieved capital utilisation at 130% of its installed capacity. Further the BOOT project at Delhi International Airport is being pursued for commencing its operation in the month of April, 2014.
During the financial year 2012-13, JFSL focused on rationalising and improving financial efficiency in its operations at all levels after its expansion drive in previous financial year 2011-12. As a result, Loss before Interest, Tax and Depreciation & Amortization reduced by 28.24% at consolidated level and JFSL recorded a total consolidated turnover of ` 44.28 crore up by 16.50%, during the year under review.
For financial year 2013-14, JFSL has concrete plans for enhanced focus on retail; aligning the institutional & railway business and also concentrate to further increase volumes of the BOOT project and thereby improve profitability.
Employee Relations
Employee relations remained cordial during the year under review.
Fixed Deposits
The Company did not take any fixed deposits from the public and no fixed deposits were outstanding or unclaimed as on March 31, 2013.
Directors
In accordance with the requirements of the Companies Act, 1956, and the Articles of Association of the Company, Mr. K. P. Padmakumar and Mr. Bipin R. Shah, Directors of the Company will retire by rotation at the ensuing Annual General Meeting of the Company and being eligible have offered themselves for re-appointment. The Board recommends their re-appointment.
Auditors
During the year, they had informed the Company vide their letter dated April 2, 2013, that their firm has been converted into Limited Liability Partnership and now it would be known as “S. R. Batliboi & Associates LLP”.
M/s. S. R. Batliboi & Associates LLP, Chartered Accountants, Mumbai, having registration number 101049W, Statutory Auditors of the Company, continue to hold office until conclusion of the 22nd Annual General Meeting and being eligible offer themselves for re-appointment.
A certificate has been received from the Auditors to the effect that their appointment, if made, would be within the limits prescribed

38 | Jyothy Laboratories Limited
under Section 224 (1B) of the Companies Act, 1956. The Auditors have advised that they have subjected themselves to the peer review process of the Institute of Chartered Accountants of India (ICAI) and hold a valid certificate issued by the Peer Review Board of the ICAI.
Auditors’ Report
Auditors’ Report under heading ‘Emphasis of Matter’ has drawn attention to Note 41 to the Financial Statements of the Company (on stand- alone basis) which form part of this annual report. It is further stated that the managerial remuneration amounting to ` 1,113.72 lacs is paid/ provided during the year under review of which ` 921.72 lac is in excess of the limits prescribed under Schedule XIII of the Companies Act, 1956 (the said Act).
As explained in the Note 41 referred above, the maximum remuneration payable to Managerial Personnel amounts to ̀ 1025.37lacs, i.e. 10% of the profits computed under section 198 of the said Act as against ` 1113.72 lacs paid/provided during the year resulting in excess payment/provision of ̀ 88.35 lacs. The Company has applied to the Central Government seeking their approval and will also seek approval of its shareholders in the ensuing Annual General Meeting for the remuneration paid/ payable to the Whole Time Directors. Pending receipt of such approval from the Central Government, the excess amount paid, if any, shall be held in trust by such Directors.
Cost Auditors
In compliance with the Central Government’s order No. 52/26/CAB-2010 dated June 30, 2011, the Board has appointedM/s. R. Nanabhoy & Co., Cost Accountants, Mumbai to carry out the cost Audit in respect of various specified products of the Company for the financial year 2013-14. Cost Audit Report for the year 2011-12 was filed within due date. The due date for filing of the Cost Audit Report for the year 2012-13 is September 30, 2013.
Directors’ Responsibility Statement:
Pursuant to requirements of Section 217(2AA) of the Companies Act, 1956, your Directors confirm that:
1. in the preparation of the annual accounts for the financial year ended March 31, 2013, the applicable accounting standards have been followed;
2. the Directors have selected such accounting policies and applied them consistently and made judgments and estimates that are reasonable and prudent so as to give a true and fair view of the state of affairs of the Company as at March 31, 2013 and of the Profit of the Company for the financial year ended on that date;
3. the Directors have taken proper and sufficient care in the maintenance of adequate accounting records in accordance with the provisions of the Companies Act, 1956, for safeguarding the assets of the Company and for preventing and detecting fraud and other irregularities;
4. the Directors have prepared the annual accounts for the financial year ended March 31, 2013 on a ‘going concern’ basis.
Conservation of Energy & Technology Absorption
With regard to the requirements of Section 217(1)(e) of the Companies Act, 1956, read with the Companies (Disclosure of Particulars in the Report of the Board of Directors) Rules, 1988, the Company has nothing specific to report.
Foreign Exchange Earnings and Outgo
(` in Lacs)
Particulars 2012-13 2011-12Foreign exchange earnings 890.74 872.98Foreign exchange outgo 1,072.85 382.16
Particulars of Employees
Particular of employees as required under Section 217(2A) of the Companies Act, 1956, read with the Companies (Particulars of Employees) Rules, 1975, as amended and forming part of the Directors’ Report for the year ended March 31, 2013 are set out as an annexure to this report. However, as per provisions of Section 219(1)(b)(iv) of the Companies Act, 1956, the report and the accounts are being sent to all the shareholders excluding the aforesaid information. Any shareholder desirous of obtaining such particulars may write to the Company Secretary at the registered office of the Company.
Risk and Concerns
The high rate of inflation and depreciation of Rupee continue to cause anxiety about the growth of Indian economy and the performance of the Corporates including FMCG sector. The Company would continue to try to protect profitability by containing cost increases through greater efficiency in operation and judicious increase in prices. During the year, the Company increased the price of all its products including flagship brand ‘Ujala’ due to increase in prices of raw materials. The Company, to some extent, is protected from pressures like slow down of economy due to small unit values of consumer packs of its products. The Company continues to promote usage of white apparels, widen its products range and product appeal, introducing new variants of its products, brand extensions, create awareness and communicate utility value of its products to consumers through
Annual Report 2012-13 | 39
mass media advertisements and increasing geographical reach of its products.
The Company was perceived to depend for Turnover and Profits on a few products and that any adverse movement in sale or profitability of such products may compromise its performance. The Company, being aware of the matter, has been continuously extending its products range and geographical reach within India and reducing cost through greater operational efficiency without any compromise in quality. In the previous year, the Company had acquired 83.66% stake in Henkel India Limited (later renamed as Jyothy Consumer Products Limited), which has since been amalgamated with the Company. The consolidated operations after amalgamation, have further broad-based its product portfolio and consumers.
The management will continue to monitor the risks concerning the Company and will respond appropriately to every situation.
Internal Control Systems and its Adequacy
The Company has adequate internal control systems and procedures in place for effective and smooth conduct of business and to meet exigencies of operation and growth. The key business processes have been documented. The transactions are recorded and reported in conformity with generally accepted accounting practices. The internal control systems and procedures ensure reliability of financial reporting, compliance with the Company’s policies and practices,
governmental regulations and statutes. Internal Audit is conducted by independent firm of auditors. Internal Auditors regularly check the adequacy of the system, their observations are reviewed by the management and remedial measures, as necessary, are taken.
Cautionary Note
Certain statements in the “Management Discussion and Analysis” section may be ‘forward-looking’. Such ‘forward looking’ statements are subject to risks and uncertainties and therefore actual results could be different from what the Directors envisage in terms of future performance and outlook.
Acknowledgement
The Board of Directors express their sincere appreciation for the contribution and commitment of the employees of the Company and for the excellent support provided by the shareholders, customers, distributors, suppliers, bankers, media and other service providers, during the financial year under review.
For and on behalf of the Board of DirectorsFor Jyothy Laboratories Limited
M. P. RamachandranChairman & Managing Director
Mumbai, May 22, 2013

Report onCorporate Governance
40 | Jyothy Laboratories Limited
Company’s Philosophy on Corporate Governance
The Company’s philosophy is to conduct business and its dealings with all stakeholders in compliance with law and high standards of business ethics and to exceed the statutory requirements with regard to Corporate Governance. The Company would continue to strengthen its principles of transparency, fairness, and accountability to generate long-term value for its shareholders on a continuous and sustainable basis in harmony with the interests of all the other stakeholders.
The Company is in compliance with all the regulations stipulated by the Companies Act, 1956, and Securities and Exchange Board of India (SEBI) with regard to Corporate Governance. The following together with information contained in Management Discussion and Analysis and other parts of Annual Report constitutes the Company’s compliance with the Corporate Governance.
Board of Directors
Composition:
During the year, the Board comprised of 8 (Eight) Directors of whom 4 (Four) are Executive Directors and 4 (Four) are Non-Executive/ Independent Directors. Mr. M. P. Ramachandran is Promoter and the Chairman & Managing Director of the Company. In accordance with the provisions of Clause 49 of the Listing Agreement, not less than 50% of the Board consists of Non-Executive and Independent Directors.
The composition of the Board of Directors is as under:
Name of the Member of the Board Relationship with other DirectorsMr. M. P. Ramachandran Father of Ms. M. R. JyothyMr. K. Ullas Kamath NoneMs. M. R. Jyothy Daughter of Mr. M. P. RamachandranMr. S. Raghunandan Rao NoneMr. Nilesh B. Mehta NoneMr. K. P. Padmakumar NoneMr. Bipin R. Shah NoneMr. R. Lakshminarayanan None
Attendance of Directors at Board Meetings and Annual General Meeting:
There were five Board meetings held during the financial year under review:
On May 23, 2012, June 15, 2012, July 25, 2012, November 1, 2012, and on February 7, 2013. Details of attendance of Directors are as under:
Name of Director Number of Board Meetings attended
Last Annual General Meeting attended
Mr. M. P. Ramachandran 5 YesMr. K. Ullas Kamath 5 YesMr. S. Raghunandan Rao* 5 YesMs. M. R. Jyothy 5 YesMr. Nilesh B. Mehta 5 YesMr. K. P. Padmakumar 4 YesMr. Bipin R. Shah 3 YesMr. R. Lakshminarayanan* 3 Yes
*Joined the Board on May 23, 2012.
Board Members and their Directorships in other Public Limited Companies:
Name of Director Executive/Non-Executive/Independent
Directorships in other Public Limited Companies
Committee positions in otherPublic Limited Companies
(as Chairman)Mr. M. P. Ramachandran Executive 5 2 (1)Mr. K. Ullas Kamath Executive 3 3 (Nil)Mr. S. Raghunandan Rao Executive 1 0Ms. M. R. Jyothy Executive 4 1 (Nil)Mr. Nilesh B. Mehta Independent 5 3 (Nil)Mr. K. P. Padmakumar Independent 4 2 (0)Mr. Bipin R. Shah Independent 5 6 (2)Mr. R. Lakshminarayanan Independent 2 0
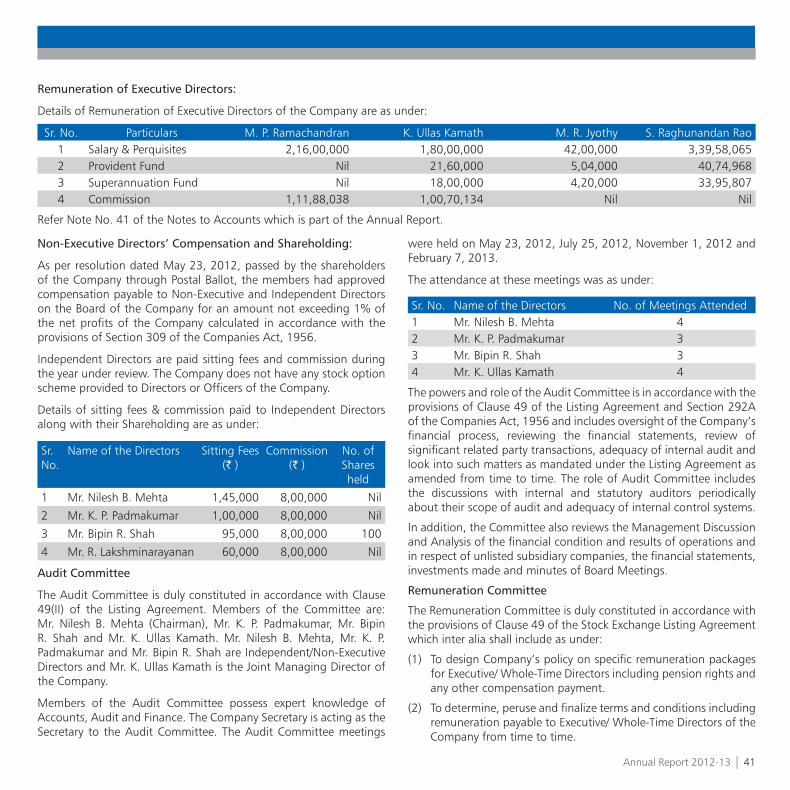
Annual Report 2012-13 | 41
Remuneration of Executive Directors:
Details of Remuneration of Executive Directors of the Company are as under:
Sr. No. Particulars M. P. Ramachandran K. Ullas Kamath M. R. Jyothy S. Raghunandan Rao1 Salary & Perquisites 2,16,00,000 1,80,00,000 42,00,000 3,39,58,0652 Provident Fund Nil 21,60,000 5,04,000 40,74,9683 Superannuation Fund Nil 18,00,000 4,20,000 33,95,8074 Commission 1,11,88,038 1,00,70,134 Nil Nil
Refer Note No. 41 of the Notes to Accounts which is part of the Annual Report.
Non-Executive Directors’ Compensation and Shareholding:
As per resolution dated May 23, 2012, passed by the shareholders of the Company through Postal Ballot, the members had approved compensation payable to Non-Executive and Independent Directors on the Board of the Company for an amount not exceeding 1% of the net profits of the Company calculated in accordance with the provisions of Section 309 of the Companies Act, 1956.
Independent Directors are paid sitting fees and commission during the year under review. The Company does not have any stock option scheme provided to Directors or Officers of the Company.
Details of sitting fees & commission paid to Independent Directors along with their Shareholding are as under:
Sr. No.
Name of the Directors Sitting Fees(` )
Commission(` )
No. ofSharesheld
1 Mr. Nilesh B. Mehta 1,45,000 8,00,000 Nil
2 Mr. K. P. Padmakumar 1,00,000 8,00,000 Nil
3 Mr. Bipin R. Shah 95,000 8,00,000 100
4 Mr. R. Lakshminarayanan 60,000 8,00,000 Nil
Audit Committee
The Audit Committee is duly constituted in accordance with Clause 49(II) of the Listing Agreement. Members of the Committee are: Mr. Nilesh B. Mehta (Chairman), Mr. K. P. Padmakumar, Mr. Bipin R. Shah and Mr. K. Ullas Kamath. Mr. Nilesh B. Mehta, Mr. K. P. Padmakumar and Mr. Bipin R. Shah are Independent/Non-Executive Directors and Mr. K. Ullas Kamath is the Joint Managing Director of the Company.
Members of the Audit Committee possess expert knowledge of Accounts, Audit and Finance. The Company Secretary is acting as the Secretary to the Audit Committee. The Audit Committee meetings
were held on May 23, 2012, July 25, 2012, November 1, 2012 and February 7, 2013.
The attendance at these meetings was as under:
Sr. No. Name of the Directors No. of Meetings Attended 1 Mr. Nilesh B. Mehta 42 Mr. K. P. Padmakumar 33 Mr. Bipin R. Shah 34 Mr. K. Ullas Kamath 4
The powers and role of the Audit Committee is in accordance with the provisions of Clause 49 of the Listing Agreement and Section 292A of the Companies Act, 1956 and includes oversight of the Company’s financial process, reviewing the financial statements, review of significant related party transactions, adequacy of internal audit and look into such matters as mandated under the Listing Agreement as amended from time to time. The role of Audit Committee includes the discussions with internal and statutory auditors periodically about their scope of audit and adequacy of internal control systems.
In addition, the Committee also reviews the Management Discussion and Analysis of the financial condition and results of operations and in respect of unlisted subsidiary companies, the financial statements, investments made and minutes of Board Meetings.
Remuneration Committee
The Remuneration Committee is duly constituted in accordance with the provisions of Clause 49 of the Stock Exchange Listing Agreement which inter alia shall include as under:
(1) To design Company’s policy on specific remuneration packages for Executive/ Whole-Time Directors including pension rights and any other compensation payment.
(2) To determine, peruse and finalize terms and conditions including remuneration payable to Executive/ Whole-Time Directors of the Company from time to time.
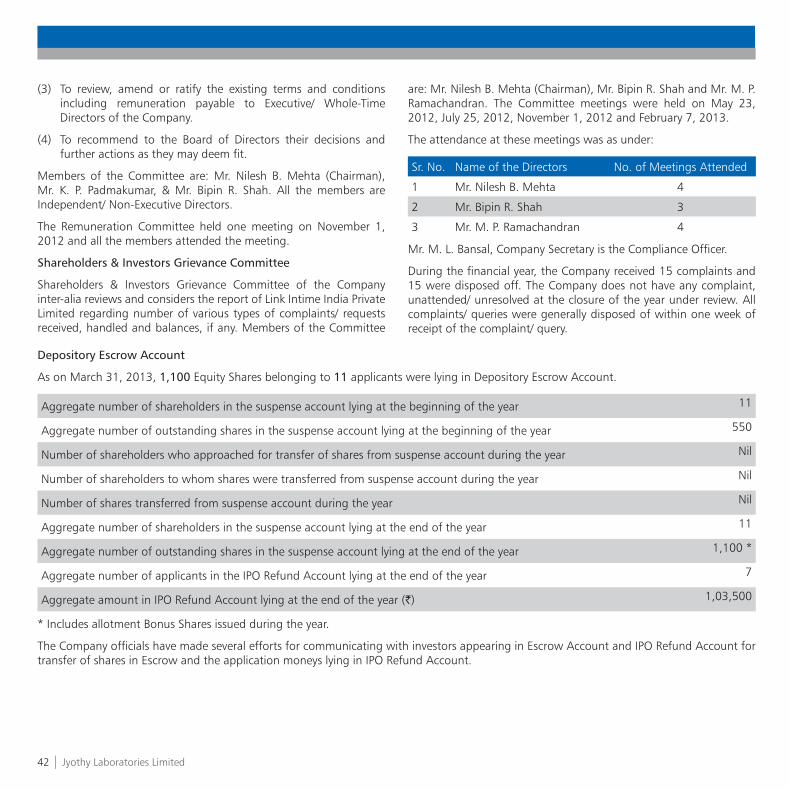
42 | Jyothy Laboratories Limited
(3) To review, amend or ratify the existing terms and conditions including remuneration payable to Executive/ Whole-Time Directors of the Company.
(4) To recommend to the Board of Directors their decisions and further actions as they may deem fit.
Members of the Committee are: Mr. Nilesh B. Mehta (Chairman), Mr. K. P. Padmakumar, & Mr. Bipin R. Shah. All the members are Independent/ Non-Executive Directors.
The Remuneration Committee held one meeting on November 1, 2012 and all the members attended the meeting.
Shareholders & Investors Grievance Committee
Shareholders & Investors Grievance Committee of the Company inter-alia reviews and considers the report of Link Intime India Private Limited regarding number of various types of complaints/ requests received, handled and balances, if any. Members of the Committee
are: Mr. Nilesh B. Mehta (Chairman), Mr. Bipin R. Shah and Mr. M. P. Ramachandran. The Committee meetings were held on May 23, 2012, July 25, 2012, November 1, 2012 and February 7, 2013.
The attendance at these meetings was as under:
Sr. No. Name of the Directors No. of Meetings Attended
1 Mr. Nilesh B. Mehta 4
2 Mr. Bipin R. Shah 3
3 Mr. M. P. Ramachandran 4
Mr. M. L. Bansal, Company Secretary is the Compliance Officer.
During the financial year, the Company received 15 complaints and 15 were disposed off. The Company does not have any complaint, unattended/ unresolved at the closure of the year under review. All complaints/ queries were generally disposed of within one week of receipt of the complaint/ query.
Depository Escrow Account
As on March 31, 2013, 1,100 Equity Shares belonging to 11 applicants were lying in Depository Escrow Account.
Aggregate number of shareholders in the suspense account lying at the beginning of the year 11
Aggregate number of outstanding shares in the suspense account lying at the beginning of the year 550
Number of shareholders who approached for transfer of shares from suspense account during the year Nil
Number of shareholders to whom shares were transferred from suspense account during the year Nil
Number of shares transferred from suspense account during the year Nil
Aggregate number of shareholders in the suspense account lying at the end of the year 11
Aggregate number of outstanding shares in the suspense account lying at the end of the year 1,100 *
Aggregate number of applicants in the IPO Refund Account lying at the end of the year 7
Aggregate amount in IPO Refund Account lying at the end of the year (`) 1,03,500
* Includes allotment Bonus Shares issued during the year.
The Company officials have made several efforts for communicating with investors appearing in Escrow Account and IPO Refund Account for transfer of shares in Escrow and the application moneys lying in IPO Refund Account.

Annual Report 2012-13 | 43
General Body Meeting
Last four Annual General Meetings of the Company were held at the venue and time as under:
Year Date of AnnualGeneral Meeting
Time ofMeeting
Numberof Special
Resolutions passed
Venue
2008-09 July 30, 2009 11.00 a.m. 1 Patkar Hall, Nathibai Thackersey Road, New Marine Lines, Mumbai - 400 020.
2009-10 July 27, 2010 11.00 a.m. 4 M. C. Ghia Hall, Indian Textile Accessories & Machinery Manufacturers’ Association, Bhogilal Hargovindas Building, 4th Floor, 18/20 K. Dubhash Marg, Kala Ghoda, Mumbai - 400 001
2010-11 September 20, 2011 11.00 a.m. 4 M. C. Ghia Hall, Indian Textile Accessories & Machinery Manufacturers’ Association, Bhogilal Hargovindas Building, 4th Floor, 18/20 K. Dubhash Marg, Kala Ghoda, Mumbai - 400 001
2011-12 August 14, 2012 10.30 a.m. 2 M. C. Ghia Hall, Indian Textile Accessories & Machinery Manufacturers’ Association, Bhogilal Hargovindas Building, 4th Floor, 18/20 K. Dubhash Marg, Kala Ghoda, Mumbai - 400 001
All special resolutions at the above Annual General Meetings were passed by show of hands.
Postal Ballot
During the year under review 5 (Five) Special and 1 (One) Ordinary Resolutions were passed through postal ballot process. Detail of voting conducted through Postal Ballot for the business stated in the Notice dated July 3, 2012 of the Company was in respect of the following Resolutions:
Sr. No.
Resolution - Description Valid Postal Ballotforms
received
Votes in favour of the Resolution
Votes against the Resolution
Invalid Postal Ballot forms
received
Results
1. Special Resolution under Sections 94(1)(a), 16 and 31 of the Companies Act, 1956 for increase in Authorised Share Capital to ` 17 Crore and making consequential amendments in Capital Clauses of Memorandum and Articles of Association of the Company
858 6,22,22,138 1,045 2,994 Approved
2. Special Resolution under Sections 198, 269, 309, 349 and 350 read with Schedule XIII to the Companies Act, 1956, for appointment of Mr. K. Ullas Kamath as Joint Managing Director of the Company
858 6,22,22,138 1,045 2,994 Approved
3 Special Resolution under Sections 198, 309, 349 and 350 of the Companies Act, 1956, for payment of remuneration by way of commission to Independent/ Non-Whole Time Directors of the Company.
858 6,10,04,231 6,553 12,15,393 Approved
4 Special Resolution for Re-appointment of Mr. M. P. Sidharthan as Production Manager of the Company.
858 6,09,72,257 15,833 12,38,087 Approved
5 Special Resolution for increase in remuneration payable to Mr. M. P. Divakaran, General Manager of the Company
858 6,09,68,343 19,206 12,38,628 Approved
6 Ordinary Resolution for issue of Bonus Shares 858 6,13,70,009 795 8,55,373 ApprovedNo other special resolution was proposed through postal ballot process during the year under review.
44 | Jyothy Laboratories Limited
Procedure for postal ballot:
Mr. Anish Gupta, Proprietor of Anish Gupta & Associates, Company Secretary conducted the postal ballot exercise. The Postal Ballot Forms and the draft Resolution(s) along with the Explanatory Statement pertaining to the said Resolution(s) explaining in detail the material facts and the self-addressed, postage prepaid envelope, were sent to all the members. The Company published advertisement in requisite newspapers specifying date of completion of dispatch of Postal Ballot, date of end of voting and other matters as specified in Rule 3 of Postal Ballot Rules. The Company did not avail e-voting facility.
The members were required to read the instructions printed in the Postal Ballot Form, give their assent or dissent on the resolution(s) at the end of the form and sign the same as per specimen signatures available with the Company or Depository Participant, as the case may be, and return the form duly completed in the self-addressed postage pre-paid envelope. The said envelope should have reached the scrutinizer before the close of working hours of the last date fixed for the purpose. Postal Ballot Forms received after that date were treated by the Scrutinizer as if the forms have not been received from the members.
Voting rights were reckoned on the basis of number of shares and paid-up value of shares registered in the name of shareholders as on the date of dispatch of the postal ballot notice.
The scrutinizer appointed for the purpose had scrutinized the postal ballot forms received and they submitted their report to the Company. Resolution(s) were deemed to have been passed as Special resolution if the votes cast in favour are at least three times the votes cast against and in case of Ordinary resolution, the resolution were deemed to have been passed, if votes cast in favor were more than the votes cast against.
The results of Postal Ballot were declared on July 3, 2012. Postal Ballot Register and Minutes were completed. Necessary forms/returns were filed on July 3, 2012.
Details of Directors Seeking Appointment/ Reappointment
(a) Mr. K. P. Padmakumar
Mr. K. P. Padmakumar, 69, is a Non-Executive, Independent Director of the Company since June 2007. A banker with nearly 42 years of association in India and abroad in Commercial Banking, Treasury Management, Capital Markets and Mutual Funds, is a Graduate in Agriculture and a Certified Associate of Indian Institute of Bankers CAIIB. During his long 27 years of service in State Bank of India, he had handled many operational assignments including Treasury
Managership of State Bank of India’s Bahrain Offshore Banking Unit and that of Fund Manager of State Bank of India Mutual Fund. He was Chairman of The Federal Bank Ltd for 6 years from 1999 to 2005 and was instrumental in the transformation of that Bank as a tech savvy vibrant Bank with commanding presence in the Indian Banking Universe.
Details of other companies in which directorships are held:
Name of Companies Nature of Interest
Muthoot Vehicle & Asset Finance Limited DirectorMuthoot Securities Limited DirectorMuthoot Commodities Limited DirectorJyothy Consumer Products Limited Director
(b) Mr. Bipin R. Shah
Mr. Bipin R. Shah, 81, is a Non-Executive, Independent Director of the Company since June 2007. He is a B.Com from Bombay University and a member of The Institute of Chartered Accountants of India. In 1956, he joined Hindustan Lever (subsidiary of Unilever) as Management Trainee. From 1958 to 1978 he held various Senior Commercial Assignments in Hindustan Lever Ltd., including Commercial Manager at its largest soaps, detergents and foods factory in Bombay, Chief Buyer Raw Materials and Head of Foods Business.
He became a Director of Hindustan Lever Ltd. in 1979. In that capacity he was responsible for Foods, Animal Feeds, Agri Products and Exports Businesses. In that capacity he was responsible for a very commendable turnaround of the Company’s dairy business.
In 1981, he was assigned the additional responsibility of being Chairman of another Unilever subsidiary Lipton India Ltd., which was facing considerable losses and financial crisis. Mr. Shah managed not only to turn around the Company but also to restore the confidence of the shareholders and employees. Under his stewardship Lipton India grew into a more diversified and profitable foods company with edible fats, dairy products and animal feeds which were added to the original tea business. As a result, the profitability of the company improved substantially and the share price of Lipton India which was quoted below its par value of ̀ 10/- in 1981 rose to be over ̀ 400/- by 1992 when he retired from its Chairmanship.
In addition to Lipton responsibilities, Mr. Shah was also Chairman of Export Business of four Unilever Companies in India viz., Hindustan Lever Ltd., Lipton India Ltd., Brooke Bond India Ltd. and Ponds India Ltd.

Annual Report 2012-13 | 45
In 1989 he attended Senior Executive Programme conducted by Sloan School of Business, Massachusetts Institute of Technology at Boston, USA.
On his retirement from the Lever Group of Companies in 1992, he joined Indus Venture Management Ltd. where he was the Vice Chairman until May, 2006.
Details of other companies in which directorships are held:
Name of Companies Nature of Interest
Dolphin Offshore Enterprises (India) Limited ChairmanKotak Mahindra Asset Management Co. Limited DirectorDolphin Shipping Company Limited ChairmanJyothy Consumer Products Limited DirectorGlobal Pharmatech Private Limited Director
Disclosures
(i) No transaction of material nature has been entered into by the Company with its Directors or Management and their relatives, etc., that may have potential conflict with the interests of the Company. The Register of Contracts/ Statement of Related Party transactions are placed before the Audit Committee/ Board regularly for their review/approval, with a confirmation that those contracts were in the ordinary course of business and on arm’s length basis. Transactions with related parties are disclosed in Note No. 31 to the Accounts in the Annual Report.
(ii) No penalties or strictures have been imposed on the Company by Stock Exchanges or SEBI or any statutory authority on any matter related to capital markets from December 19, 2007 (date of Listing of the Company’s equity shares) to March 31, 2013.
(iii) Company has fully complied with Mandatory requirements of the revised Clause 49 of the Listing Agreement. As regards, non-mandatory requirements, the Company has adopted Whistle Blower Policy and the same is posted on the website of the Company. No personnel have been denied access to the Ombuds person.
Risk Management
The Company has laid down procedures and appraised the Board of Directors regarding key risk assessment and risk mitigation mechanisms.
Code of Conduct
The Board has adopted the code of conduct for all its Directors and Senior Management which has been displayed on the Company’s website www.jyothylaboratories.com.
Means of communication
The Company publishes its Quarterly and Annual results in requisite newspapers. The said results are also available at the website of the Company. During the year, the Company has released official news of the Company as well as presentation was also made to institutional investor/ analysts and the same are available on website of the Company.
CEO/CFO Certificate
A certificate was obtained from the Managing Director (CEO), Joint Managing Director (COO) and Chief Financial Officer (CFO) in terms of Clause 49(V) of the Listing Agreement.
General Shareholder Information
a) Annual General Meeting of the Company will be held on August 12, 2013 at 10.30 a.m. at M. C. Ghia Hall, Indian Textile Accessories & Machinery Manufacturers’ Association, Bhogilal Hargovindas Building, 4th Floor, 18/20, K. Dubhash Marg, Kala Ghoda, Mumbai - 400 001
b) The Financial year covered by this Annual Report: April 1, 2012 to March 31, 2013.
c) Dates of Book Closure: From July 27, 2013 to August 12, 2013.
d) Dividend Payment: After August 12, 2013.
(Dividend @ ` 2.50 Per Equity Share shall also be payable on 47,59,496 Equity Shares of ` 1/- each of the Company to be allotted to erstwhile shareholders of Jyothy Consumer Products Limited, consequent upon its amalgamation with the Company).
e) Listing on Stock Exchanges and Stock Codes:
Bombay Stock Exchange Limited - 532926National Stock Exchange of India Limited - JYOTHYLAB
f) Dematerialization: ISIN Number INE668F01031
g) Registrars & Share Transfer Agents:
Link Intime India Private Limited C-13, Pannalal Silk Mills Compound, L. B. S. Marg, Bhandup (West), Mumbai 400 078, Phone: 0091 022 25946970, Fax: 0091 022 25946969E-mail: [email protected]
h) Share Transfer System:
Transfers are registered and returned within a period of 30 days from the date of receipt. The requests for dematerialization of shares are confirmed within 15 days from the date of receipt.
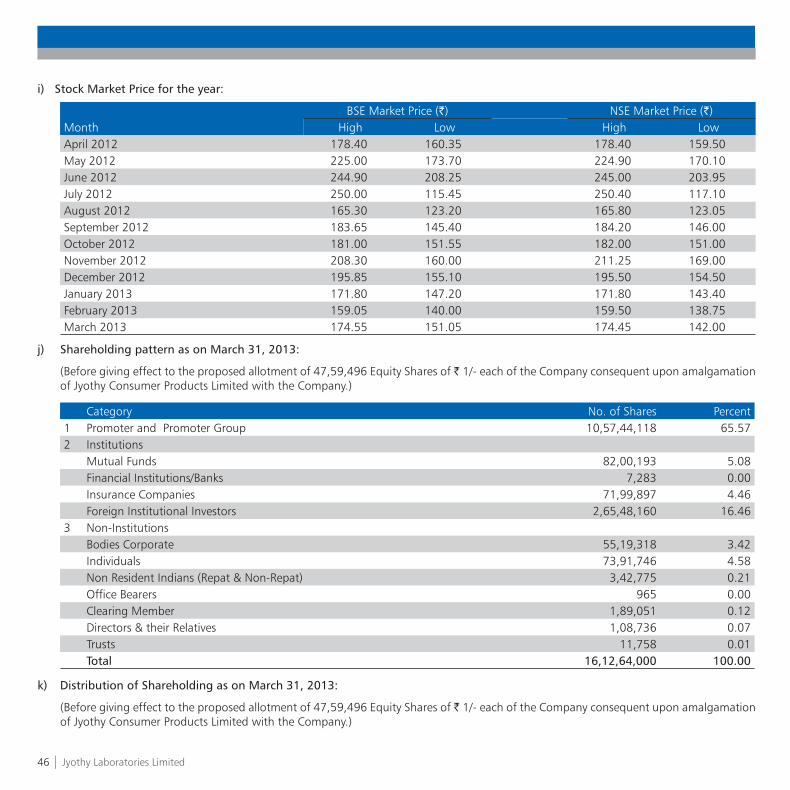
46 | Jyothy Laboratories Limited
i) Stock Market Price for the year:
MonthBSE Market Price (`) NSE Market Price (`)
High Low High LowApril 2012 178.40 160.35 178.40 159.50May 2012 225.00 173.70 224.90 170.10June 2012 244.90 208.25 245.00 203.95July 2012 250.00 115.45 250.40 117.10August 2012 165.30 123.20 165.80 123.05September 2012 183.65 145.40 184.20 146.00October 2012 181.00 151.55 182.00 151.00November 2012 208.30 160.00 211.25 169.00December 2012 195.85 155.10 195.50 154.50January 2013 171.80 147.20 171.80 143.40February 2013 159.05 140.00 159.50 138.75March 2013 174.55 151.05 174.45 142.00
j) Shareholding pattern as on March 31, 2013:
(Before giving effect to the proposed allotment of 47,59,496 Equity Shares of ` 1/- each of the Company consequent upon amalgamation of Jyothy Consumer Products Limited with the Company.)
Category No. of Shares Percent1 Promoter and Promoter Group 10,57,44,118 65.572 Institutions
Mutual Funds 82,00,193 5.08Financial Institutions/Banks 7,283 0.00Insurance Companies 71,99,897 4.46Foreign Institutional Investors 2,65,48,160 16.46
3 Non-InstitutionsBodies Corporate 55,19,318 3.42Individuals 73,91,746 4.58Non Resident Indians (Repat & Non-Repat) 3,42,775 0.21Office Bearers 965 0.00Clearing Member 1,89,051 0.12Directors & their Relatives 1,08,736 0.07Trusts 11,758 0.01Total 16,12,64,000 100.00
k) Distribution of Shareholding as on March 31, 2013:
(Before giving effect to the proposed allotment of 47,59,496 Equity Shares of ` 1/- each of the Company consequent upon amalgamation of Jyothy Consumer Products Limited with the Company.)

Annual Report 2012-13 | 47
Sr. No. Slab of shareholdingNo. of Equity shares held
Shareholders Shares ValueNum-bers In % Face Value
(`)In %
From To1. 1 5,000 39,134 99.4081 65,06,265 4.03452. 5,001 10,000 81 0.2058 6,20,629 0.38493. 10,001 20,000 47 0.1194 7,21,022 0.44714. 20,001 30,000 6 0.0152 1,56,142 0.09685. 30,001 40,000 12 0.0305 4,31,872 0.26786. 40,001 50,000 4 0.0102 1,81,930 0.11287. 50,001 1,00,000 16 0.0406 12,64,276 0.78408. 1,00,001 and above 67 0.1702 15,13,81,864 93.8721
Total 39367 100.0000 16,12,64,000 100.0000
l) Share Price (`) in comparison with BSE Sensex:
75
90
105
120
135
150
165
180
195
MarFebJanDecNovOctSeptAugJulyJuneMayApr15500
16000
16500
17000
17500
18000
18500
19000
19500
20000
20500
` pe
r Sh
are BSE Sensex
Annual Comparison of Company Share Price & BSE Sensex during 2012-13
Month
JLL Sensex
The Company issued bonus shares in the ration 1:1 on 11/07/2012 and accordingly prices of pre-bonus period have been adjusted
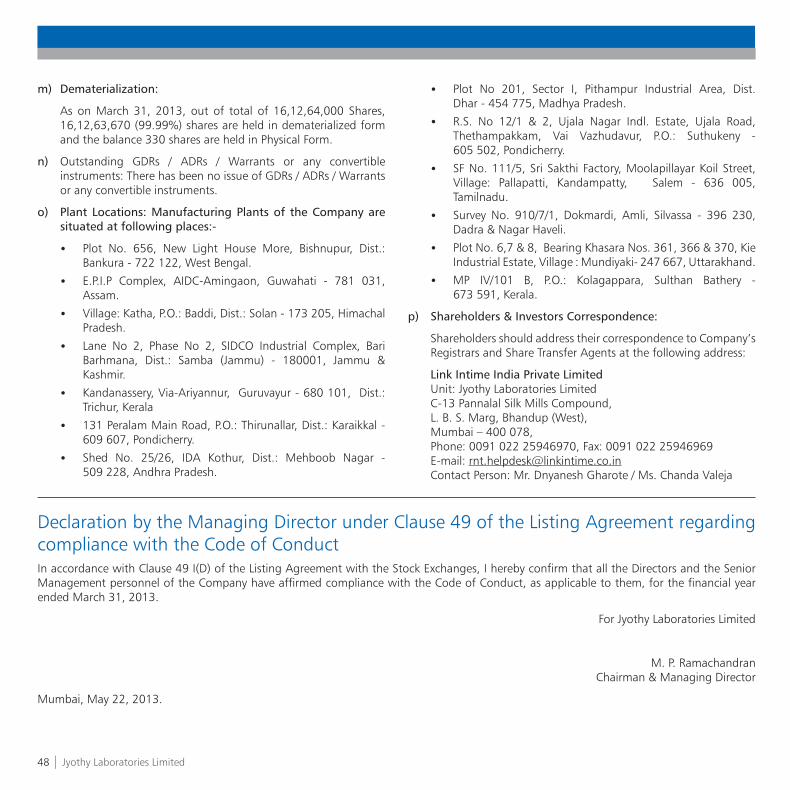
48 | Jyothy Laboratories Limited
m) Dematerialization:
As on March 31, 2013, out of total of 16,12,64,000 Shares, 16,12,63,670 (99.99%) shares are held in dematerialized form and the balance 330 shares are held in Physical Form.
n) Outstanding GDRs / ADRs / Warrants or any convertible instruments: There has been no issue of GDRs / ADRs / Warrants or any convertible instruments.
o) Plant Locations: Manufacturing Plants of the Company are situated at following places:-
Plot No. 656, New Light House More, Bishnupur, Dist.: Bankura - 722 122, West Bengal.
E.P.I.P Complex, AIDC-Amingaon, Guwahati - 781 031, Assam.
Village: Katha, P.O.: Baddi, Dist.: Solan - 173 205, Himachal Pradesh.
Lane No 2, Phase No 2, SIDCO Industrial Complex, Bari Barhmana, Dist.: Samba (Jammu) - 180001, Jammu & Kashmir.
Kandanassery, Via-Ariyannur, Guruvayur - 680 101, Dist.: Trichur, Kerala
131 Peralam Main Road, P.O.: Thirunallar, Dist.: Karaikkal - 609 607, Pondicherry.
Shed No. 25/26, IDA Kothur, Dist.: Mehboob Nagar -509 228, Andhra Pradesh.
Plot No 201, Sector I, Pithampur Industrial Area, Dist.Dhar - 454 775, Madhya Pradesh.
R.S. No 12/1 & 2, Ujala Nagar Indl. Estate, Ujala Road, Thethampakkam, Vai Vazhudavur, P.O.: Suthukeny -605 502, Pondicherry.
SF No. 111/5, Sri Sakthi Factory, Moolapillayar Koil Street, Village: Pallapatti, Kandampatty, Salem - 636 005, Tamilnadu.
Survey No. 910/7/1, Dokmardi, Amli, Silvassa - 396 230, Dadra & Nagar Haveli.
Plot No. 6,7 & 8, Bearing Khasara Nos. 361, 366 & 370, Kie Industrial Estate, Village : Mundiyaki- 247 667, Uttarakhand.
MP IV/101 B, P.O.: Kolagappara, Sulthan Bathery -673 591, Kerala.
p) Shareholders & Investors Correspondence:
Shareholders should address their correspondence to Company’s Registrars and Share Transfer Agents at the following address:
Link Intime India Private LimitedUnit: Jyothy Laboratories LimitedC-13 Pannalal Silk Mills Compound, L. B. S. Marg, Bhandup (West), Mumbai – 400 078, Phone: 0091 022 25946970, Fax: 0091 022 25946969E-mail: [email protected] Person: Mr. Dnyanesh Gharote / Ms. Chanda Valeja
Declaration by the Managing Director under Clause 49 of the Listing Agreement regarding compliance with the Code of ConductIn accordance with Clause 49 I(D) of the Listing Agreement with the Stock Exchanges, I hereby confirm that all the Directors and the Senior Management personnel of the Company have affirmed compliance with the Code of Conduct, as applicable to them, for the financial year ended March 31, 2013.
For Jyothy Laboratories Limited
M. P. RamachandranChairman & Managing Director
Mumbai, May 22, 2013.
Annual Report 2012-13 | 49
AUDITORS’ CERTIFICATE ON CORPORATE GOVERNANCE
To
The Members of Jyothy Laboratories Limited
We have examined the compliance of conditions of corporate governance by Jyothy Laboratories Limited, for the year ended on March 31, 2013, as stipulated in clause 49 of the Listing Agreement of the said Company with stock exchanges.
The compliance of conditions of corporate governance is the responsibility of the management. Our examination was limited to procedures and implementation thereof, adopted by the Company for ensuring the compliance of the conditions of the Corporate Governance. It is neither an audit nor an expression of opinion on the financial statements of the Company.
In our opinion and to the best of our information and according to the explanations given to us, we certify that the Company has complied with the conditions of Corporate Governance as stipulated in the above mentioned Listing Agreement.
We further state that such compliance is neither an assurance as to the future viability of the Company nor the efficiency or effectiveness with which the management has conducted the affairs of the Company.
For S.R. Batliboi & Associates LLPChartered Accountants
ICAI Firm registration number: 101049W
per Vikram MehtaPartner
Membership No.: 105938
MumbaiMay 22, 2013

50 | Jyothy Laboratories Limited
Independent Auditor’s Report
To,The Members ofJyothy Laboratories LimitedReport on the Financial StatementsWe have audited the accompanying financial statements of Jyothy Laboratories Limited (“the Company”), which comprise the Balance Sheet as at March 31, 2013, and the Statement of Profit and Loss and Cash Flow Statement for the year then ended, and a summary of significant accounting policies and other explanatory information. Management’s Responsibility for the Financial StatementsManagement is responsible for the preparation of these financial statements that give a true and fair view of the financial position, financial performance and cash flows of the Company in accordance with accounting principles generally accepted in India, including the Accounting Standards referred to in sub-section (3C) of section 211 of the Companies Act, 1956 (“the Act”). This responsibility includes the design, implementation and maintenance of internal control relevant to the preparation and presentation of the financial statements that give a true and fair view and are free from material misstatement, whether due to fraud or error.Auditor’s ResponsibilityOur responsibility is to express an opinion on these financial statements based on our audit. We conducted our audit in accordance with the Standards on Auditing issued by the Institute of Chartered Accountants of India. Those Standards require that we comply with ethical requirements and plan and perform the audit to obtain reasonable assurance about whether the financial statements are free from material misstatement. An audit involves performing procedures to obtain audit evidence about the amounts and disclosures in the financial statements. The procedures selected depend on the auditor’s judgment, including the assessment of the risks of material misstatement of the financial statements, whether due to fraud or error. In making those risk assessments, the auditor considers internal control relevant to the Company’s preparation and fair presentation of the financial statements in order to design audit procedures that are appropriate in the circumstances. An audit also includes evaluating the appropriateness of accounting policies used and the reasonableness of the accounting estimates made by management, as well as evaluating the overall presentation of the financial statements. We believe that the audit evidence we have obtained is sufficient and appropriate to provide a basis for our audit opinion.OpinionIn our opinion and to the best of our information and according to the explanations given to us, the financial statements give the information required by the Act in the manner so required and give a true and fair view in conformity with the accounting principles generally accepted in India:(a) in the case of the Balance Sheet, of the state of affairs of the
Company as at March 31, 2013;
(b) in the case of the Statement of Profit and Loss, of the profit for the year ended on that date; and
(c) in the case of the Cash Flow Statement, of the cash flows for the year ended on that date.
Emphasis of MatterWithout qualifying our report, we draw attention to Note 41 to the financial statements regarding managerial remuneration amounting to Rs 1,113 lacs paid / provided during the year of which Rs 921 lacs is in excess of the limits prescribed under Schedule XIII of the Companies Act, 1956. As informed to us, the Company has filed an application with the Central government and is in the process of obtaining necessary approval from shareholders for approval of such excess remuneration.Report on Other Legal and Regulatory Requirements1. As required by the Companies (Auditor’s Report) Order, 2003
(“the Order”) issued by the Central Government of India in terms of sub-section (4A) of section 227 of the Act, we give in the Annexure a statement on the matters specified in paragraphs 4 and 5 of the Order.
2. As required by section 227(3) of the Act, we report that: (a) We have obtained all the information and explanations
which to the best of our knowledge and belief were necessary for the purpose of our audit;
(b) In our opinion proper books of account as required by law have been kept by the Company so far as appears from our examination of those books;
(c) The Balance Sheet, Statement of Profit and Loss, and Cash Flow Statement dealt with by this Report are in agreement with the books of account;
(d) In our opinion, the Balance Sheet, Statement of Profit and Loss, and Cash Flow Statement comply with the Accounting Standards referred to in subsection (3C) of section 211 of the Companies Act, 1956;
(e) On the basis of written representations received from the directors as on March 31, 2013, and taken on record by the Board of Directors, none of the directors is disqualified as on March 31, 2013, from being appointed as a director in terms of clause (g) of sub-section (1) of section 274 of the Companies Act, 1956.
For S.R. Batliboi & Associates LLPChartered AccountantsICAI Firm Registration Number: 101049W
per Vikram MehtaPartnerMembership No.: 105938
Place of Signature: MumbaiDate: May 22, 2013
Annual Report 2012-13 | 51
Annexure to the Auditors’ Report
Annexure referred to in paragraph 1 of section “Report on Other Legal and Regulatory Requirements” of our report of even dateRe: Jyothy Laboratories Limited (‘the Company’)
(i) (a) The Company has maintained proper records showing full particulars, including quantitative details and situation of fixed assets.
(b) All fixed assets have not been physically verified by the management during the year but there is a regular programme of verification which, in our opinion, is reasonable having regard to the size of the Company and the nature of its assets. As informed, materialdiscrepancies were identified on such verification. These have been properly dealt with in the books of accounts.
(c) There was no disposal of a substantial part of fixed assets during the year.
(ii) (a) The inventory has been physically verified by the management during the year. In our opinion, the frequency of verification is reasonable except at one unit where physical verification was conducted only at year end.
(b) The procedures of physical verification of inventory followed by the management are reasonable and adequate in relation to the size of the Company and the nature of its business.
(c) The Company is maintaining proper records of inventory. Discrepancies noted on physical verification of inventories were material, and have been properly dealt with in the books of account.
(iii) (a) The Company has granted loan to two subsidiaries covered in the register maintained under section 301 of the Companies Act, 1956. The maximum amount involved during the year was ̀ 37,478 lacs and the year- end balance of loans granted to such parties was ` 36,925 lacs.
(b) In our opinion and according to the information and explanations given to us, the rate of interest and other terms and conditions for such loans are not prima facie prejudicial to the interest of the Company.
(c) The loans granted are either re-payable on demand or after a stipulated period of time for all subsidiaries. In respect of one subsidiary, the interest is payable on demand. We are informed that the Company has not demanded repayment of any such loan or interest during the year, and thus, there
has been no default on the part of the parties to whom the money has been lent. In respect of the other subsidary, the payment of interest has been regular.
(d) There is no overdue amount of loans granted to subsidiary companies listed in the register maintained under section 301 of the Companies Act, 1956.
(e) According to information and explanations given to us, the Company has not taken any loans, secured or unsecured, from companies, firms or other parties covered in the register maintained under section 301 of the Companies Act, 1956. Accordingly, the provisions of clause 4(iii)(e) to (g) of the Order are not applicable to the Company and hence not commented upon.
(iv) (a) In our opinion and according to the information and explanations given to us, there is an adequate internal control system commensurate with the size of the Company and the nature of its business, for the purchase of inventory and fixed assets and for the sale of goods. The activities of the Company do not involve rendering of services. During the course of our audit, we have not observed any major weakness or continuing failure to correct any major weakness in the internal control system of the Company in respect of these areas.
(v) (a) According to the information and explanations provided by the management, we are of the opinion that the particulars of contracts or arrangements referred to in section 301 of the Companies Act, 1956 that need to be entered into the register maintained under section 301 have been so entered.
(b) In our opinion and according to the information and explanations given to us, the transactions made in pursuance of such contracts or arrangements and exceeding the value of Rupees five lakhs have been entered into during the financial year at prices which are reasonable having regard to the prevailing market prices at the relevant time except in respect of sale of goods of ` 386 lacs to a subsidiary which are of specialized nature, where in the absences of the comparable prices, we are unable to comment whether the transactions were made at prevailing market prices at the relevant time.
(vi) The Company has not accepted any deposits from the public.
(vii) In our opinion, the Company has an internal audit system commensurate with the size of the Company and nature of its business except in respect of the erstwhile Jyothy Consumer Products Limited business where scope and coverage needs to be significantly enlarged.

52 | Jyothy Laboratories Limited
(viii) We have broadly reviewed the books of account maintained by the Company pursuant to the rules made by the Central Government for the maintenance of cost records under section 209(1)(d) of the Companies Act, 1956, and are of the opinion that prima facie, the prescribed accounts and records have been made and maintained. We have not, however, made a detailed examination of the same.
(ix) (a) The Company is regular in depositing with appropriate authorities undisputed statutory dues including employees’ state insurance, income-tax, sales-tax, wealth-tax, service tax, customs duty, excise duty, cess and other material statutory dues applicable to it. There are no amounts due in respect of investor education and protection fund.
(b) According to the information and explanations given to us, no undisputed amounts payable in respect of provident fund, investor education and protection fund, employees’ state insurance, income-tax, wealth-tax, service tax, sales-tax, customs duty, excise duty cess and other material statutory dues were outstanding, at the year end, for a period of more than six months from the date they became payable.
(c) According to the records of the Company, there are no dues of wealth tax, customs duty and cess which have not been deposited on account of any dispute. According to the records of the Company, the dues outstanding of income tax, sales tax, service tax and excise duty on account of any dispute, are as follows:
(` in lacs)Matter Year Forum where dispute is pending
Commissionerateand appellate
authorities
Tribunal High Court SupremeCourt
Total
Sales Tax 1998-022002-052005-062006-072007-082008-092009-112006-102011-122012-13
131918535349625609709358170
3
11213168123
39
1344
112
165355
25
131929792642748813
1,06435817028
Excise duty 1999-002000-042004-052005-062008-12
535
34225
63
535
637
225Income Tax AY 2011-12 80 8 0Service Tax 2005-10
2010-1131
10131
101Total 4,917 563 13 701 6,195
(x) The Company has no accumulated losses at the end of the financial year and it has not incurred cash losses in the current and immediately preceding financial year.
(xi) Based on our audit procedures and as per the information and explanations given by the management, we are of the opinion
that the Company has not defaulted in repayment of dues to a financial institution, bank or debenture holders.
(xii) According to the information and explanations given to us and based on the documents and records produced before us, the Company has not granted loans and advances on the basis
Annual Report 2012-13 | 53
of security by way of pledge of shares, debentures and other securities.
(xiii) In our opinion, the Company is not a chit fund or a nidhi / mutual benefit fund / society. Therefore, the provisions of clause 4(xiii) of the Order are not applicable to the Company.
(xiv) In our opinion, the Company is not dealing in or trading in shares, securities, debentures and other investments. Accordingly, the provisions of clause 4(xiv) of the Order are not applicable to the Company.
(xv) According to the information and explanations given to us, the Company has given guarantee for loans taken by others from banks, the terms and conditions whereof, in our opinion, are not prima-facie prejudicial to the interest of the Company. According to the information and explanations given to us, the Company has not given any guarantee for loans taken by others from financial institutions.
(xvi) Based on the information and explanations given to us by the management, term loans were applied for the purpose for which the loans were obtained.
(xvii) According to the information and explanations given to us and on an overall examination of the balance sheet of the Company, we report that no funds raised on short-term basis have been used for long-term investment.
(xviii)The Company has not made any preferential allotment of shares to parties or companies covered in the register maintained under section 301 of the Companies Act, 1956.
(xix) According to the information and explanations given to us, the Company had issued 500 secured redeemable non-convertible debentures of Rs 1,00,000/- each during the period covered by our audit report. The Company has created a security in favour of the debenture trust for the period the debentures are outstanding.
(xx) The Company has not raised money through public issues during the year.
(xxi) Based upon the audit procedures performed for the purpose of reporting the true and fair view of the financial statements and as per the information and explanations given by the management, we report that no fraud on or by the Company has been noticed or reported during the year.
For S.R. Batliboi & Associates LLPChartered AccountantsICAI Firm Registration Number: 101049W
per Vikram MehtaPartnerMembership No.: 105938
Place of Signature: MumbaiDate: May 22, 2013

54 | Jyothy Laboratories Limited
Balance Sheet As at March 31, 2013
As per our report of even dateFor S.R. Batliboi & Associates LLP For and on behalf of the Board of Directors ofChartered Accountants Jyothy Laboratories LimitedICAI Firm Registration No. 101049W
per Vikram Mehta M.P. Ramachandran K. Ullas KamathPartner Chairman and Managing Director Joint Managing DirectorMembership No.: 105938
Place: Mumbai M.L. Bansal Place: MumbaiDate: May 22, 2013 Company Secretary Date: May 22, 2013
` In LacsNote 2013 2012
EQUITY AND LIABILITIESShareholders’ fundsShare capital 4 1,612.64 806.32 Share capital suspense (Refer Note 36) 5,527.92 - Reserves and surplus 5 65,261.73 66,544.25
72,402.29 67,350.57 Non-current liabilitiesLong-term borrowings 6 41,120.00 43,000.00 Deferred tax liabilities (Net) 7 - 1,533.79 Other Long-term liabilities 8 180.00 270.00 Provisions 9 917.68 631.76
42,217.68 45,435.55 Current liabilitiesShort-term borrowings 10 12,600.28 12,291.25 Trade payables 11 11,500.16 6,326.44 Other current liabilities 12 10,196.04 1,498.58 Provisions 9 7,050.62 2,789.82
41,347.10 22,906.09 TOTAL 155,967.07 135,692.21
ASSETSNon-current assetsFixed assets 13(i) Tangible assets 26,160.90 19,472.20 (ii) Intangible assets 40,988.45 871.38 (iii) Capital work-in-progress 326.71 281.81 Non-current investments 14 2,470.73 34,546.69 Loans and advances 15 49,626.42 54,857.92 Other assets 16 13.05 23.59
119,586.26 110,053.59 Current assetsCurrent investments 17 - 3,224.29 Inventories 18 16,744.64 7,928.19 Trade receivables 19 11,001.76 4,251.55 Cash and Bank balances 20 3,813.59 5,099.40 Loans and advances 15 4,415.74 4,914.01 Other assets 16 405.08 221.18
36,380.81 25,638.62 TOTAL 155,967.07 135,692.21
Summary of significant accounting policies 3
The accompanying notes are an integral part of the financial statements.

Annual Report 2012-13 | 55
As per our report of even date
For S.R. Batliboi & Associates LLP For and on behalf of the Board of Directors ofChartered Accountants Jyothy Laboratories LimitedICAI Firm Registration No. 101049W
per Vikram Mehta M.P. Ramachandran K. Ullas KamathPartner Chairman and Managing Director Joint Managing DirectorMembership No.: 105938
Place: Mumbai M.L. Bansal Place: MumbaiDate: May 22, 2013 Company Secretary Date: May 22, 2013
Statement of Profit and Loss For the year ended March 31, 2013
` In LacsNOTE 2012-13 2011-12
REVENUESales (net of trade discount) 106,452.04 68,835.43 Less: Excise duty (4,714.37) (2,557.28)Net sales 101,737.67 66,278.15 Other operating income 21 136.03 66.53 Revenue from operations 101,873.70 66,344.68 Other income 22 169.53 451.10 Total Revenue (I) 102,043.23 66,795.78EXPENSESCost of raw material and components consumed 23 32,439.61 22,488.80 Purchase of traded goods 30,022.12 14,726.18 (Increase)/decrease in inventories of finished goods, work-in-progress and traded goods 24 (5,694.77) 43.82 Employee benefits expense 25 11,056.18 7,802.18 Other expenses 26 21,676.61 12,969.44 Total Expense (II) 89,499.75 58,030.42 EARNINGS BEFORE INTEREST, TAX, DEPRECIATION,AMORTISATION AND IMPAIRMENT (EBITDA) (I) – (II) 12,543.48 8,765.36 Depreciation, amortisation and impairment 13 6,164.52 1,703.19 Finance Costs 27 6,608.27 1,943.25 Interest Income 28 4,815.60 5,202.60 Profit before prior period items and tax 4,586.29 10,321.52 Prior period items 40 182.71 - PROFIT BEFORE TAX 4,403.58 10,321.52 Current tax (MAT Payable) 885.00 2,010.00 Less MAT credit entitlement (885.00) - - Net Current Tax - 2,010.00 - Deferred tax charge/(reversal) - (40.04)PROFIT AFTER TAX 4,403.58 8,351.56 EARNINGS PER SHARE (EPS) 42Basic and Diluted (`) 2.65 5.18 Nominal value per share (`) 1 1 Summary of significant accounting policies 3
The accompanying notes are an integral part of the financial statements.

56 | Jyothy Laboratories Limited
Cash Flow Statement For the year ended March 31, 2013
` In Lacs2012-13 2011-12
A. CASH FLOWS PROVIDED BY/(USED IN) OPERATING ACTIVITIES: Profit before Tax 4,403.58 10,321.52 Adjustments to reconcile profit before tax to net cash flows : Depreciation, amortisation and impairment (net) 6,164.52 1,703.19 Loss on fixed assets discarded 8.12 166.62 Profit on sale of fixed assets (5.80) (2.83)Interest and finance charges 6,608.27 1,943.25 Interest on fixed deposit (259.45) (392.11)Interest earned on Loans to subsidiary company (4,494.67) (4,751.36)Excess provision written back (45.47) - Profit on sale of investments - (430.65)Provision for doubtful debts 22.93 28.22 Provision for doubtful advances 30.96 - Operating profit before working capital changes 12,432.99 8,585.85 Movements in working capital : Increase/(decrease) in trade payables (1.53) 2,373.74 Increase/(decrease) in provisions 396.12 174.11 Increase/(decrease) in other liabilities 1,053.68 160.85 Decrease/(increase) in trade receivables (3,125.74) 6,070.12 Decrease/(increase) in inventories (5,422.65) (1,093.50)Decrease/(increase) in Loans and advances (2,773.37) (1,668.86)Decrease/(increase) in other current assets (148.12) (59.84)Cash generated from operations 2,411.38 14,542.47 Taxes paid (net) (1,642.93) (2,004.17)Net cash (used in)/generated from operating activities (A) 768.45 12,538.30
B. CASH FLOWS PROVIDED BY/(USED IN) INVESTING ACTIVITIES: Purchase of fixed assets including capital work-in-progress and capital advances (893.00) (1,369.31)Proceeds from sale of fixed assets 28.58 21.38 Maturity/(Investment) in fixed deposit (having original maturity of more than three months) (785.24) 15,006.04 Investment in shares of subsidiaries (435.29) (29,738.51)Investment in partnership firm (73.75) (37.50)Proceeds from Sale of investment - 431.65 Loan given to subsidiary company (5,109.45) (82,245.80)Proceeds of loan given to subsidiary company 2,302.06 33,605.82 Interest received on fixed deposits 250.43 453.48 Interest received on loans to subsidiaries 4,494.67 4,751.36 Net cash used in investing activities (B) (220.99) (59,121.39)
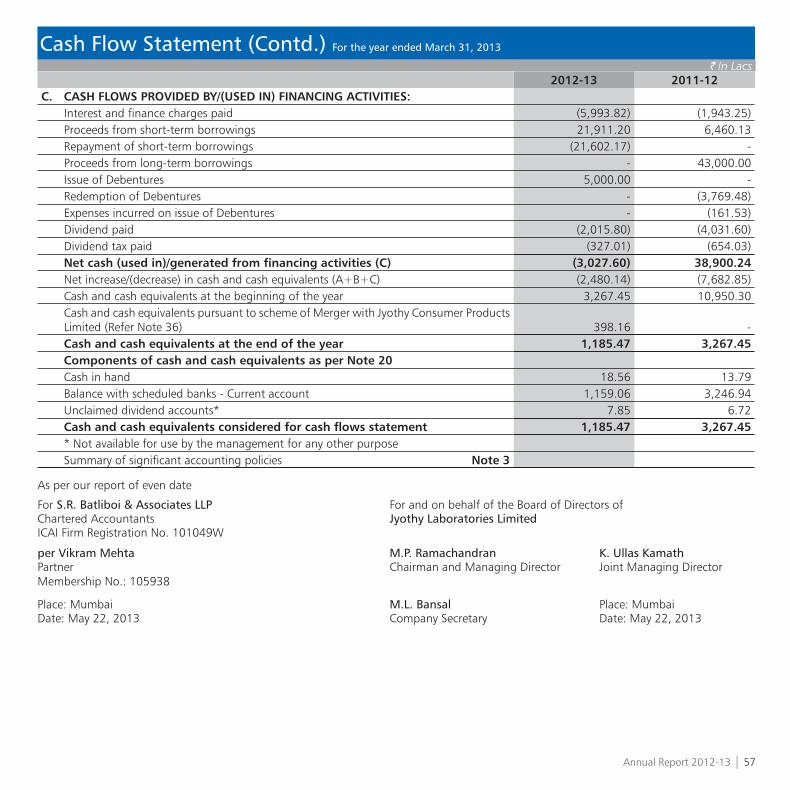
Annual Report 2012-13 | 57
Cash Flow Statement (Contd.) For the year ended March 31, 2013
` In Lacs2012-13 2011-12
C. CASH FLOWS PROVIDED BY/(USED IN) FINANCING ACTIVITIES: Interest and finance charges paid (5,993.82) (1,943.25)Proceeds from short-term borrowings 21,911.20 6,460.13 Repayment of short-term borrowings (21,602.17) - Proceeds from long-term borrowings - 43,000.00 Issue of Debentures 5,000.00 - Redemption of Debentures - (3,769.48)Expenses incurred on issue of Debentures - (161.53)Dividend paid (2,015.80) (4,031.60)Dividend tax paid (327.01) (654.03)Net cash (used in)/generated from financing activities (C) (3,027.60) 38,900.24 Net increase/(decrease) in cash and cash equivalents (A+B+C) (2,480.14) (7,682.85)Cash and cash equivalents at the beginning of the year 3,267.45 10,950.30 Cash and cash equivalents pursuant to scheme of Merger with Jyothy Consumer Products Limited (Refer Note 36) 398.16 - Cash and cash equivalents at the end of the year 1,185.47 3,267.45Components of cash and cash equivalents as per Note 20Cash in hand 18.56 13.79 Balance with scheduled banks - Current account 1,159.06 3,246.94 Unclaimed dividend accounts* 7.85 6.72 Cash and cash equivalents considered for cash flows statement 1,185.47 3,267.45 * Not available for use by the management for any other purpose Summary of significant accounting policies Note 3
As per our report of even date
For S.R. Batliboi & Associates LLP For and on behalf of the Board of Directors ofChartered Accountants Jyothy Laboratories LimitedICAI Firm Registration No. 101049W
per Vikram Mehta M.P. Ramachandran K. Ullas KamathPartner Chairman and Managing Director Joint Managing DirectorMembership No.: 105938
Place: Mumbai M.L. Bansal Place: MumbaiDate: May 22, 2013 Company Secretary Date: May 22, 2013
58 | Jyothy Laboratories Limited
Notes to Financial Statements For the year ended March 31, 2013
Note 1 BACKGROUND
Jyothy Laboratories Limited (‘the Company’) is public company incorporated on January 15, 1992 under the provisions of the Companies Act, 1956. The Company is principally engaged in manufacturing and marketing of fabric whiteners, soaps, detergents, mosquito repellents, scrubber, bodycare and incense sticks.
Note 2 BASIS OF PREPARATION
The financial statements of the Company have been prepared in accordance with generally accepted accounting principles in India (Indian GAAP). The Company has prepared these financial statements to comply in all material respects with the accounting standards notified under the Companies (Accounting Standards) Rules, 2006 (as amended) and the relevant provisions of the Companies Act, 1956. The financial statements have been prepared under the historical cost convention on an accrual basis except in case of assets which has been recorded on fair value and assets for which provision for impairment is made. The accounting policies have been consistently applied by the Company and are consistent with those used in the previous year.
Note 3 SUMMARY OF SIGNIFICANT ACCOUNTING POLICIES
The significant accounting policies are as follows:
a) Use of estimate
The preparation of financial statements, in conformity with Indian GAAP requires management to make judgments, estimates and assumptions that affect the reported amounts of revenues, expenses, assets, liabilities and disclosure of contingent liabilities at the end of the reporting period. Although these estimates are based upon management’s best knowledge of current events and actions, uncertainty about these assumptions and estimates could result in the outcomes requiring a material adjustment to the carrying amounts of assets or liabilities in future periods.
b) Tangible fixed assets
Fixed assets are initially recorded at cost. Cost comprises the purchase price and any directly attributable cost of bringing the asset to its working condition for its intended use. The cost of the tangible assets acquired in an amalgamation in the nature of purchase is their fair value as at the date of amalgamation. Following initial recognition, tangible assets are carried at cost less accumulated depreciation and impairment losses, if any.
Gains or losses arising from derecognition of tangible assets are measured as the difference between the net disposal proceeds and the carrying amount of the asset and are recognised in the statement of profit and loss when the asset is derecognised.
c) Intangible assets
Intangible assets acquired separately are measured on initial recognition at cost. The cost of the intangible assets acquired in an amalgamation in the nature of purchase is their fair value as at the date of amalgamation. Following initial recognition, intangible assets are carried at cost less accumulated amortization and accumulated impairment losses, if any. Intangible assets are amortized on a straight line basis over the estimated useful economic life. The Company uses a rebuttable presumption that the useful life of an intangible asset will not exceed ten years from the date when the asset is available for use.
Gains or losses arising from derecognition of an intangible asset are measured as the difference between the net disposal proceeds and the carrying amount of the asset and are recognized in the statement of profit and loss when the asset is derecognized
d) Depreciation and amortization
Depreciation is provided using the Straight Line Method as per the useful lives of the tangible assets estimated by the management, or at the rates prescribed under Schedule XIV of the Companies Act, 1956 whichever is higher. Intangible assets are amortized on straight line basis on the estimated useful economic life.

Annual Report 2012-13 | 59
Notes to Financial Statements For the year ended March 31, 2013
Note 3 SUMMARY OF SIGNIFICANT ACCOUNTING POLICIES (Contd.)
The estimated useful life of the assets is as follows:
Category Estimated useful life (in years)Factory Buildings 10-30Building (Other than Factory Building) 10-60Plant and machinery 13-21Furniture and fixtures 5-16Dies and moulds 3Computers 6Office equipments 5-21Vehicles 6-10Know-how 3-5Trademarks and Copyrights 9-10Brands 10Softwares and Licences 10
Goodwill purchased is not amortized but tested for impairment every year. The goodwill arising on amalgamation is amortized to the statement of profit and loss over 10 years.
Assets costing less then ̀ 5,000 are depreciated at the rate of 100%. Leasehold land is amortized over the period of the lease on a straight-line basis which ranges between 60-90 years.
The amortization/depreciation period and the amortization/depreciation method are reviewed at least at each financial year end. If the expected useful life of the asset is significantly different from previous estimates, the amortization/depreciation period is changed accordingly. If there has been a significant change in the expected pattern of economic benefits from the asset, the amortization/depreciation method is changed to reflect the changed pattern. Such changes are accounted for in accordance with AS 5 Net Profit or Loss for the Period, Prior Period Items and Changes in Accounting Policies.
e) Impairment
i. The Company assesses at each reporting date whether there is an indication that an asset may be impaired. If any indication exists, or when annual impairment testing for an asset is required, the Company estimates the asset’s recoverable amount. An asset’s recoverable amount is the higher of an asset’s or cash-generating unit’s (CGU) net selling price and its value in use. The recoverable amount is determined for an individual asset, unless the asset does not generate cash inflows that are largely independent of those from other assets or groups of assets. An impairment loss is recognized wherever the carrying amount of an asset exceed its recoverable amount. The recoverable amount is the greater of the assets net selling price and value in use. In assessing value in use, the estimated future cash flows are discounted to their present value at the pre-tax discount rate.
ii. After impairment, depreciation is provided on the revised carrying amount of the assets over its remaining useful life.
iii. A previously recognized impairment loss is reversed only if there has been a change in the assumptions used to determine the asset’s recoverable amount since the last impairment loss was recognized. The reversal is limited so that the carrying amount of the asset does not exceed its recoverable amount, nor exceed the carrying amount that would have been determined, net of depreciation, had no impairment loss been recognized for the asset in prior years.
60 | Jyothy Laboratories Limited
Note 3 SUMMARY OF SIGNIFICANT ACCOUNTING POLICIES (Contd.)
f) Borrowing Costs
Borrowing costs consist of interest and amortization of ancillary costs incurred in connection with the arrangement of borrowings. Borrowing costs directly attributable to the acquisition, construction or production of an asset that necessarily takes a substantial period of time to get ready for its intended use or sale are capitalized as part of the respective asset. All other borrowing costs are expensed in the period they occur.
g) Operating Leases
i. Where the Company is a lessee;
Leases, where the lessor effectively retains substantially all the risks and benefits of ownership of the leased item, are classified as operating leases. Lease payments on operating leases are recognized as an expense in the statement of profit and loss on a straight-line basis, over the lease term.
ii. Where the Company is a lessor;
Leases in which the Company does not transfer substantially all the risks and benefits of ownership of the asset are classified as operating leases. Assets subject to operating leases are included in fixed assets. Lease income on an operating lease is recognized in the statement of profit and loss on a straight-line basis over the lease term. Costs, including depreciation, are recognized as an expense in the statement of profit and loss. Initial direct costs such as legal costs, brokerage costs, etc. are recognized immediately in the statement of profit and loss.
h) Government grants and subsidies
Grants and subsidies from the government are recognized when there is reasonable assurance that the grant/subsidy will be received and all attaching conditions will be complied with. When the grant or subsidy relates to revenue item, it is recognized as income over the periods necessary to match them on a systematic basis to the costs, which it is intended to compensate. Where the grant or subsidy relates to an asset, its value is deducted from the gross value in arriving at the carrying amount of the related asset. Government grant in the nature of promoters’ contribution is credited to the investment subsidy reserve.
i) Investment
Investments that are readily realisable and intended to be held for not more than one year from the date on which such investments are made are classified as current investments. All other investments are classified as long-term investments. On initial recognition, all investments are measured at cost. The cost comprises purchase price and directly attributable acquisition charges such as brokerage, fees and duties and other costs that arise on acquisition of investment.
Current investments are carried at lower of cost and fair value determined on an individual investment basis.
Long-term investments are carried at cost. However, provision for diminution in value is made to recognise a decline other than temporary in the value of the investments.
An investment in land or building, which is not intended to be occupied substantially for use by, or in the operations of the Company is classified as investment property. Investment properties are stated at cost, net of accumulated depreciation and impairment losses, if any.
j) Inventories
Inventories of raw materials, packing materials, work-in-progress, finished goods, stores and consumables items are valued at cost or net realizable value, whichever is lower. However, materials and other items held for use in the production of inventories are not written down below cost if the finished products in which they will be incorporated are expected to be sold at or above cost.
Notes to Financial Statements For the year ended March 31, 2013

Annual Report 2012-13 | 61
Note 3 SUMMARY OF SIGNIFICANT ACCOUNTING POLICIES (Contd.)
Cost is ascertained on First-in-First out (‘FIFO’) basis and includes all applicable costs incurred in bringing goods to their present location and condition. Cost of work-in-progress, manufactured packing material and finished goods includes materials and all applicable manufacturing overheads. The Company accrues for excise duty liability in respect of manufactured finished goods/intermediary inventories lying in the factory.
Traded goods are valued at lower of cost and net realizable value. Cost includes cost of purchase and other costs incurred in bringing the inventories to their present location and condition. Cost is determined on a FIFO basis.
Net realisable value is the estimated selling price in the ordinary course of business, less estimated cost of completion and estimated cost necessary to make the sale.
k) Revenue recognition
Revenue is recognized to the extent that it is probable that the economic benefits will flow to the Company and the revenue can be reliably measured. The following specific criteria must also be met before revenue is recognized;
Sale of Goods
Revenue is recognized when all the significant risks and rewards of ownership of the goods have passed to the buyer, usually on delivery of the goods. Excise Duty, Sales Tax and VAT deducted from turnover (gross) is the amount that is included in the amount of turnover (gross) and not the entire amount of liability arised during the year. The Company collects sales taxes and value added taxes (VAT) on behalf of the government and, therefore, these are not economic benefits flowing to the Company. Hence, they are excluded from revenue. Revenue includes the amount of excise duty refund received / due in accordance with incentive scheme. Revenue is net of trade discount given.
Interest
Revenue is recognized on a time proportion basis taking into account the amount outstanding and the rate applicable.
l) Foreign currency translation
i. Initial Recognition
Foreign currency transactions are recorded in the reporting currency, by applying to the foreign currency amount the exchange rate between the reporting currency and the foreign currency at the date of the transaction.
ii. Conversion
Foreign currency monetary items are reported using the exchange rate prevailing at the reporting date.
Non-monetary items which are carried in terms of historical cost denominated in a foreign currency are reported using the exchange rate at the date of the transaction. Non-monetary items, which are measured at fair value or other similar valuation denominated in a foreign currency, are translated using the exchange rate at the date when such value was determined.
iii. Exchange Differences
Exchange differences arising on the settlement of monetary items or on reporting Company’s monetary items at rates different from those at which they were initially recorded during the year, or reported in previous financial statements, are recognized as income or as expenses in the year in which they arise.
Notes to Financial Statements For the year ended March 31, 2013

62 | Jyothy Laboratories Limited
Note 3 SUMMARY OF SIGNIFICANT ACCOUNTING POLICIES (Contd.)
m) Retirement and other employee benefits
i. Retirement benefit in the form of provident fund and superannuation fund is a defined contribution scheme. The Company has no obligation, other than the contribution payable to the respective fund. The Company recognizes contribution payable to the provident fund/super annuation scheme as an expenditure, when an employee renders the related service.
ii. Gratuity benefit is defined benefit obligation and is provided for on the basis of an actuarial valuation on projected unit credit method made at the end of each financial year.
iii. Accumulated leave, which is expected to be utilized within the next 12 months, is treated as short-term employee benefit. The Company measures the expected cost of such absences as the additional amount that it expects to pay as a result of the unused entitlement that has accumulated at the reporting date.
iv. The Company treats accumulated leave expected to be carried forward beyond twelve months, as long-term employee benefit for measurement purposes. Such long-term compensated absences are provided for based on the actuarial valuation using the projected unit credit method at the year-end.
v. Actuarial gains/losses are immediately taken to the statement of profit and loss and are not deferred.
n) Sales promotion items
Sales promotion items are valued at cost. Cost is ascertained on First-in-First out (‘FIFO’) basis and includes all applicable costs incurred in bringing goods to their present location and condition.
o) Income-tax
Tax expense comprises of current and deferred tax. Current income tax is measured at the amount expected to be paid to the tax authorities in accordance with the Indian Income tax Act. Deferred income taxes reflects the impact of current year timing differences between taxable income and accounting income for the year and reversal of timing differences of earlier years.
Deferred tax is measured based on the tax rates for deductible timing differences and the tax laws enacted or substantively enacted at the balance sheet date. Deferred tax assets are recognized only to the extent that there is reasonable certainty that sufficient future taxable income will be available against which such deferred tax assets can be realized. In situations where the Company has unabsorbed depreciation or carry forward tax losses, all deferred tax assets are recognized only if there is virtual certainty supported by convincing evidence that they can be realized against future taxable profits.
In the situations where the Company is entitled to a tax holiday under the Income-tax Act, 1961 enacted in India or tax laws prevailing in the respective tax jurisdictions where it operates, no deferred tax (asset or liability) is recognized in respect of timing differences which reverse during the tax holiday period, to the extent the Company’s gross total income is subject to the deduction during the tax holiday period. Deferred tax in respect of timing differences which reverse after the tax holiday period is recognized in the year in which the timing differences originate. However, the Company restricts recognition of deferred tax assets to the extent that it has become reasonably certain or virtually certain, as the case may be, that sufficient future taxable income will be available against which such deferred tax assets can be realized. For recognition of deferred taxes, the timing differences which originate first are considered to reverse first.
At each balance sheet date the Company re-assesses unrecognized deferred tax assets. It recognizes unrecognized deferred tax assets to the extent that it has become reasonably certain or virtually certain, as the case may be that sufficient future taxable income will be available against which such deferred tax assets can be realized.
The carrying amount of deferred tax assets are reviewed at each balance sheet date. The Company writes-down the carrying amount of a deferred tax asset to the extent that it is no longer reasonably certain or virtually certain, as the case may be, that sufficient future taxable income will be available against which deferred tax asset can be realised. Any such write-down is reversed to the extent that it becomes reasonably certain or virtually certain, as the case may be, that sufficient future taxable income will be available.
Notes to Financial Statements For the year ended March 31, 2013
Annual Report 2012-13 | 63
Note 3 SUMMARY OF SIGNIFICANT ACCOUNTING POLICIES (Contd.)
Minimum alternative tax (MAT) paid in a year is charged to the statement of profit and loss as current tax. MAT credit is recognized as an asset only when and to the extent there is convincing evidence that the Company will pay normal income tax during the specified period. In the year in which the MAT credit becomes eligible to be recognized as an asset in accordance with the Guidance Note on Accounting for credit Available in respect of Minimum Alternate Tax under the Income tax Act, 1961, the said asset is created by way of a credit to the statement of profit and loss and shown as MAT Credit Entitlement. The Company reviews the MAT credit entitlement at each balance sheet date and writes down the carrying amount of MAT Credit Entitlement to the extent there is no longer convincing evidence to the effect that Company will pay normal Income tax during the specified period.
p) Provisions
A provision is recognized when the Company has a present obligation as a result of past event; it is probable that an outflow of resources will be required to settle the obligation, in respect of which a reliable estimate can be made.
Provisions are not discounted to its present value and are determined based on best estimate required to settle the obligation at the balance sheet date. These are reviewed at each balance sheet date and adjusted to reflect the current best estimates.
q) Excise duty
Excise duty on turnover is reduced from turnover. Excise duty relating to the difference between the opening stock and closing stock is recognized as income/expense as the case may be, separately in the statement of profit and loss.
r) Segment Reporting
Identification of segments: The Company’s operating businesses are organized and managed separately according to the nature of products, with each segment
representing a strategic business unit that offers different products and serves different markets.
The analysis of geographical segments is based on the areas in which major operating divisions of the Company operate.
Segment accounting policies: The Company prepares its segment information in conformity with the accounting policies adopted for preparing and presenting the
financial statements of the Company as a whole.
Intersegment transfer:The Company generally accounts for inter segment sales and transfers as if the sales or transfer were to third parties at market price.
Allocation of common costs:Common allocable costs are allocated to each segment according to the relative contribution of each segment to the total common costs.
Unallocated items:It includes general corporate income and expense items which are not allocated to any business segment.
s) Earnings per Share
Basic earnings per share are calculated by dividing the net profit or loss for the year attributable to equity shareholders by the weighted average number of equity shares outstanding during the year. The weighted average number of equity shares outstanding during the year are adjusted for event of bonus issue, bonus element in a rights issue to existing shareholders, share split, and reverse share split that have changed the number of equity shares outstanding, without a corresponding change in resources.
For the purpose of calculating diluted earnings per share, the net profit or loss for the period attributable to equity shareholders and the weighted average number of shares outstanding during the period are adjusted for the effects of all dilutive potential equity shares.
Notes to Financial Statements For the year ended March 31, 2013
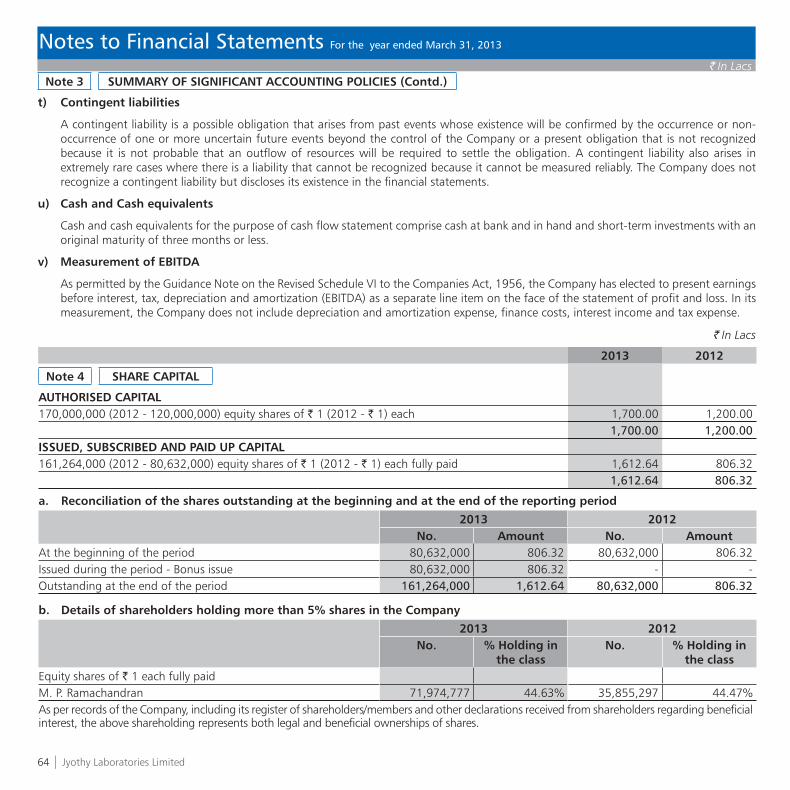
64 | Jyothy Laboratories Limited
Note 3 SUMMARY OF SIGNIFICANT ACCOUNTING POLICIES (Contd.)
t) Contingent liabilities
A contingent liability is a possible obligation that arises from past events whose existence will be confirmed by the occurrence or non-occurrence of one or more uncertain future events beyond the control of the Company or a present obligation that is not recognized because it is not probable that an outflow of resources will be required to settle the obligation. A contingent liability also arises in extremely rare cases where there is a liability that cannot be recognized because it cannot be measured reliably. The Company does not recognize a contingent liability but discloses its existence in the financial statements.
u) Cash and Cash equivalents
Cash and cash equivalents for the purpose of cash flow statement comprise cash at bank and in hand and short-term investments with an original maturity of three months or less.
v) Measurement of EBITDA
As permitted by the Guidance Note on the Revised Schedule VI to the Companies Act, 1956, the Company has elected to present earnings before interest, tax, depreciation and amortization (EBITDA) as a separate line item on the face of the statement of profit and loss. In its measurement, the Company does not include depreciation and amortization expense, finance costs, interest income and tax expense.
Notes to Financial Statements For the year ended March 31, 2013
2013 2012
Note 4 SHARE CAPITAL
AUTHORISED CAPITAL170,000,000 (2012 - 120,000,000) equity shares of ` 1 (2012 - ` 1) each 1,700.00 1,200.00
1,700.00 1,200.00 ISSUED, SUBSCRIBED AND PAID UP CAPITAL161,264,000 (2012 - 80,632,000) equity shares of ` 1 (2012 - ` 1) each fully paid 1,612.64 806.32
1,612.64 806.32
a. Reconciliation of the shares outstanding at the beginning and at the end of the reporting period
2013 2012No. Amount No. Amount
At the beginning of the period 80,632,000 806.32 80,632,000 806.32Issued during the period - Bonus issue 80,632,000 806.32 - - Outstanding at the end of the period 161,264,000 1,612.64 80,632,000 806.32
b. Details of shareholders holding more than 5% shares in the Company
2013 2012No. % Holding in
the classNo. % Holding in
the classEquity shares of ` 1 each fully paidM. P. Ramachandran 71,974,777 44.63% 35,855,297 44.47%As per records of the Company, including its register of shareholders/members and other declarations received from shareholders regarding beneficial interest, the above shareholding represents both legal and beneficial ownerships of shares.
` In Lacs
` In Lacs
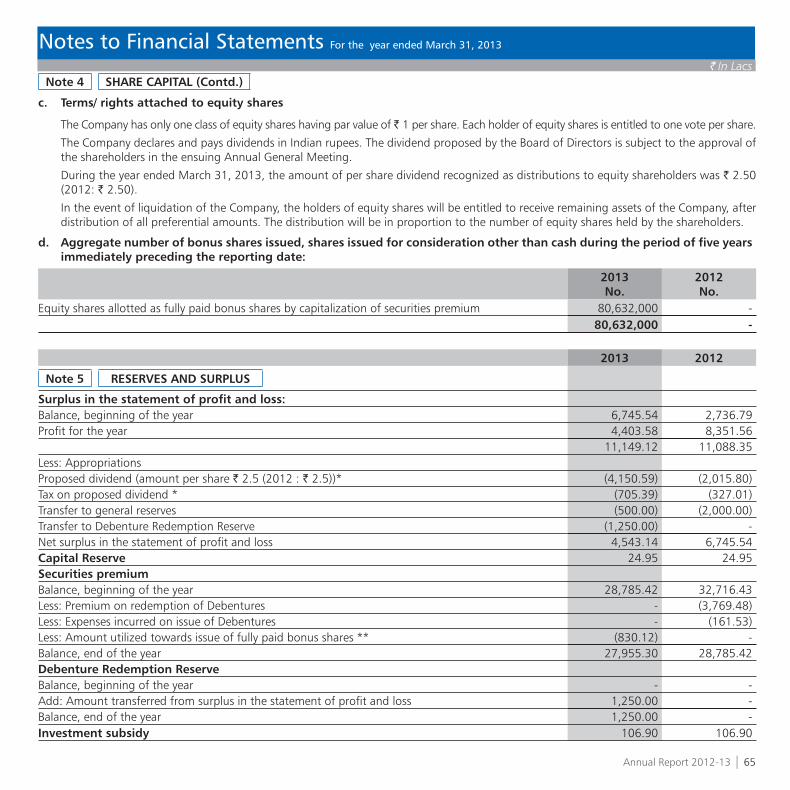
Annual Report 2012-13 | 65
Note 4 SHARE CAPITAL (Contd.)
c. Terms/ rights attached to equity shares
The Company has only one class of equity shares having par value of ` 1 per share. Each holder of equity shares is entitled to one vote per share.
The Company declares and pays dividends in Indian rupees. The dividend proposed by the Board of Directors is subject to the approval of the shareholders in the ensuing Annual General Meeting.
During the year ended March 31, 2013, the amount of per share dividend recognized as distributions to equity shareholders was ` 2.50 (2012: ` 2.50).
In the event of liquidation of the Company, the holders of equity shares will be entitled to receive remaining assets of the Company, after distribution of all preferential amounts. The distribution will be in proportion to the number of equity shares held by the shareholders.
d. Aggregate number of bonus shares issued, shares issued for consideration other than cash during the period of five years immediately preceding the reporting date:
2013No.
2012No.
Equity shares allotted as fully paid bonus shares by capitalization of securities premium 80,632,000 - 80,632,000 -
2013 2012
Note 5 RESERVES AND SURPLUS
Surplus in the statement of profit and loss:Balance, beginning of the year 6,745.54 2,736.79 Profit for the year 4,403.58 8,351.56
11,149.12 11,088.35 Less: AppropriationsProposed dividend (amount per share ` 2.5 (2012 : ` 2.5))* (4,150.59) (2,015.80)Tax on proposed dividend * (705.39) (327.01)Transfer to general reserves (500.00) (2,000.00)Transfer to Debenture Redemption Reserve (1,250.00) - Net surplus in the statement of profit and loss 4,543.14 6,745.54 Capital Reserve 24.95 24.95 Securities premiumBalance, beginning of the year 28,785.42 32,716.43 Less: Premium on redemption of Debentures - (3,769.48)Less: Expenses incurred on issue of Debentures - (161.53)Less: Amount utilized towards issue of fully paid bonus shares ** (830.12) - Balance, end of the year 27,955.30 28,785.42 Debenture Redemption ReserveBalance, beginning of the year - - Add: Amount transferred from surplus in the statement of profit and loss 1,250.00 - Balance, end of the year 1,250.00 - Investment subsidy 106.90 106.90
Notes to Financial Statements For the year ended March 31, 2013
` In Lacs

66 | Jyothy Laboratories Limited
2013 2012
Note 5 RESERVES AND SURPLUS (Contd.)
General reservesBalance, beginning of the year 30,881.44 28,881.44 Add: Amount transferred from surplus balance in the statement of profit and loss 500.00 2,000.00 Balance, end of the year 31,381.44 30,881.44
65,261.73 66,544.25 * Includes Proposed dividend and tax on proposed dividend of ` 118.99 lacs and ` 20.22 lacs respectively pertaining to equity shares
pending to be allotted to shareholders of Jyothy Consumer Products Limited as per the scheme of amalgamation.
** Includes ` 23.80 lacs pertaining to bonus shares to be alloted to shareholders of Jyothy Consumer Products Limited (Refer Note 36).
Non-Current Current2013 2012 2013 2012
Note 6 LONG-TERM BORROWINGS
Term loans from Bank (secured) 36,120.00 43,000.00 6,880.00 - 10.25% Secured Redeemable Non Convertible Debentures 5,000.00 - - - Deferred sales tax loan (Unsecured) - - 17.45 17.45 Amount disclosed under ‘Other Current Liabilities’ (Note 12) - - (6,897.45) (17.45)
41,120.00 43,000.00 - - Details of loana) Term Loan has been taken from Banks during the financial year 2011-12 and carries interest @ 11.25% p.a. payable monthly. Interest
rate is fixed for period of one year and floating thereafter. Term loan to be repaid in 16 quarterly installment starting from June 30, 2013. The term loan is secured against first charge on the immovable properties, trademarks of Maxo and Exo, all the rights, title, interest, benefits, claims and demands of the Company in respect of all document, agreements, contracts, clearance, insurance contract entered both present and future and all rights, claims and benefits to all monies receivable thereunder and all other claims thereunder which description shall include all properties of the above whether presently in existence or acquired hereafter and second charge on all the inventories, current assets, all monies, securities, contractor guarantees, performance bonds, cash flows and receivables, revenues, bank accounts together with investment, fixed deposits and book debts, stock in trade and all the properties mentioned above.
b) 10.25% Debentures are redeemable at par at the end of 3 years and 7 days from the date of allotment i.e. November 7, 2012. The Debentures are secured by first charge on all movable fixed assets, property and fixtures, movable plant and machinery and all other equipment of the Company.
c) Deferred sales tax loan is interest free and is due for payment.
2013 2012
Note 7 DEFERRED TAX LIABILITY (Net)
a) Deferred tax liabilityDepreciation 3,043.88 2,055.98 Gross Deferred tax liability 3,043.88 2,055.98
b) Deferred tax assetsTechnical royalty 2.77 2.82 Provision for gratuity 311.92 204.97 Provision for doubtful debts 50.66 21.07
Notes to Financial Statements For the year ended March 31, 2013
` In Lacs

Annual Report 2012-13 | 67
` In Lacs
Notes to Financial Statements For the year ended March 31, 2013
2013 2012
Note 7 DEFERRED TAX LIABILITY (Net) (Contd.)
Provision for doubtful advances 459.56 - Provision for leave encashment 181.37 106.39 Provision for impairment losses 140.62 160.07 Disallowance u/s 40 a (ia) of the Income Tax Act 8.84 8.11 Disallowance u/s 43B of the Income Tax Act 19.65 18.76 Carry forward losses and unabsorbed depreciation 1,868.49 - Gross Deferred tax assets 3,043.88 522.19 Net Deferred Tax Liabilities - 1,533.79
Non-Current Current2013 2012 2013 2012
Note 8 OTHER LONG-TERM LIABILITIES
Deferred Payment Liability (Unsecured) 180.00 270.00 180.00 90.00 Amount disclosed under ‘Other Current Liabilities’ (Note 12) - - (180.00) (90.00)
180.00 270.00 - -
2013 2012 2013 2012
Note 9 PROVISIONS
Provision for employee benefitsProvision for leave encashment - - 533.59 327.90 Provision for gratuity (Note 29) 917.68 631.76 - -
917.68 631.76 533.59 327.90 Other provisionsProvision for wealth tax - - 4.13 3.00 Provision for income tax (net of advance tax) - - 15.00 116.11 Provision for contingencies - - 1,641.92 - Proposed dividend - - 4,150.59 2,015.80 Tax on proposed dividend - - 705.39 327.01
- - 6,517.03 2,461.92 917.68 631.76 7,050.62 2,789.82
Provision for contingencies:During the year, management has reviewed all the excise and VAT cases pending at various levels and accordingly believes that outflow of resources embodying economics benefits is probable for certain cases and the estimated amount of outflow is ` 1,641.92 lacs.
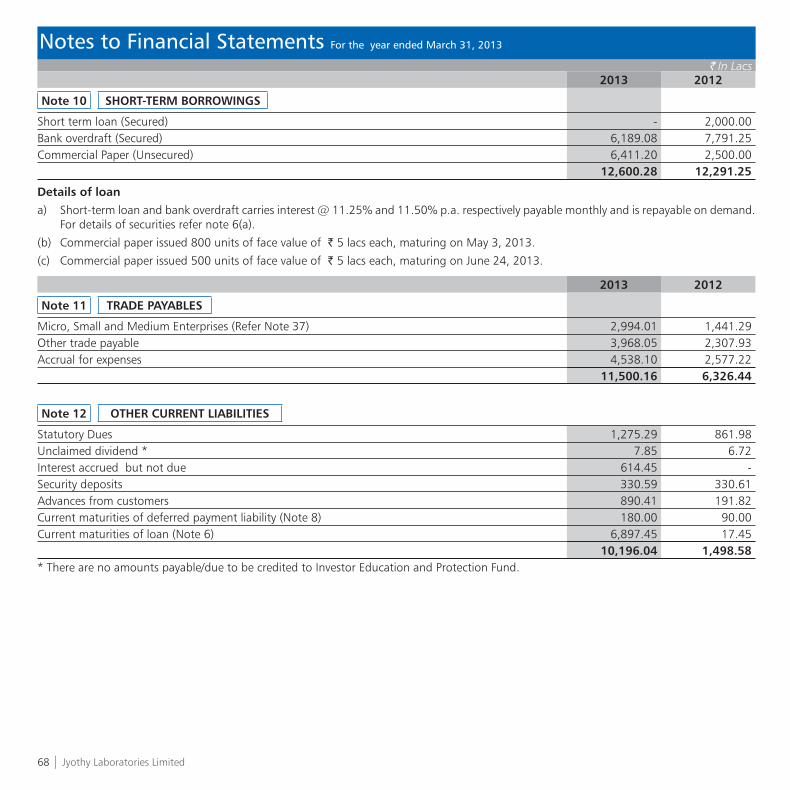
68 | Jyothy Laboratories Limited
Notes to Financial Statements For the year ended March 31, 2013
` In Lacs2013 2012
Note 10 SHORT-TERM BORROWINGS
Short term loan (Secured) - 2,000.00 Bank overdraft (Secured) 6,189.08 7,791.25 Commercial Paper (Unsecured) 6,411.20 2,500.00
12,600.28 12,291.25
Details of loana) Short-term loan and bank overdraft carries interest @ 11.25% and 11.50% p.a. respectively payable monthly and is repayable on demand.
For details of securities refer note 6(a).
(b) Commercial paper issued 800 units of face value of ` 5 lacs each, maturing on May 3, 2013.
(c) Commercial paper issued 500 units of face value of ` 5 lacs each, maturing on June 24, 2013.
2013 2012
Note 11 TRADE PAYABLES
Micro, Small and Medium Enterprises (Refer Note 37) 2,994.01 1,441.29 Other trade payable 3,968.05 2,307.93 Accrual for expenses 4,538.10 2,577.22
11,500.16 6,326.44
Note 12 OTHER CURRENT LIABILITIES
Statutory Dues 1,275.29 861.98 Unclaimed dividend * 7.85 6.72 Interest accrued but not due 614.45 - Security deposits 330.59 330.61 Advances from customers 890.41 191.82 Current maturities of deferred payment liability (Note 8) 180.00 90.00 Current maturities of loan (Note 6) 6,897.45 17.45
10,196.04 1,498.58 * There are no amounts payable/due to be credited to Investor Education and Protection Fund.

Annual Report 2012-13 | 69
Particulars
Gross Block Depreciation and Amortization Impairment Net Block
As at April 1, 2012
Additionspursuant to Scheme of
Amalgamationwith Jyothy Consumer
Products Limited (Refer Note 36)
Addition DeletionsAs at
March 31, 2013
As at April 1, 2012
For the year Deletions
As at March 31,
2013
As at April 1, 2012
Charge/(Reversal)For the year*
As at March 31,
2013
As at March 31,
2013
As at March 31,
2012
Intangible assets
Goodwill on Amalgamation - 14,339.41 - - 14,339.41 - 1,433.94 - 1,433.94 - - - 12,905.47 -
- - - - - - - - - - - -
Goodwill 301.60 - - - 301.60 - - - - 51.50 - 51.50 250.10 250.10
301.60 - - - 301.60 - - - - - 51.50 51.50
Brands - 30,366.00 - - 30,366.00 - 3,036.60 - 3,036.60 - - - 27,329.40 -
- - - - - - - - - - - -
Trademarks and Copyrights$ 580.81 - - - 580.81 342.27 46.54 - 388.81 23.68 - 23.68 168.32 214.86
580.81 - - - 580.81 281.15 61.12 - 342.27 - 23.68 23.68
Know-how 647.12 - - - 647.12 335.45 120.00 - 455.45 - - - 191.67 311.67
647.12 - - - 647.12 211.69 123.76 - 335.45 - - -
Softwares and Licences 103.35 - 59.94 - 163.29 8.60 11.20 - 19.80 - - - 143.49 94.75
47.70 - 55.65 - 103.35 0.20 8.40 - 8.60 - - -
Total intangible assets 1,632.88 44,705.41 59.94 - 46,398.23 686.32 4,648.28 - 5,334.60 75.18 - 75.18 40,988.45 871.38
1,577.23 - 55.65 - 1,632.88 493.04 193.28 - 686.32 - 75.18 75.18 871.38
Tangible assets
Freehold land 1,842.34 3,773.00 - - 5,615.34 - - - - - - - 5,615.34 1,842.34
1,842.34 - - - 1,842.34 - - - - - - -
Leasehold land 274.83 - - - 274.83 26.34 3.75 - 30.09 - - - 244.74 248.49
274.83 - - - 274.83 21.79 4.55 - 26.34 - - -
Building# 11,486.79 1,184.96 53.61 - 12,725.36 2,006.99 423.08 - 2,430.07 - - - 10,295.29 9,479.80
11,431.25 - 150.20 94.66 11,486.79 1,703.49 331.62 28.12 2,006.99 - - -
Plant and machinery @ 10,273.42 2,451.81 500.53 71.09 13,154.67 3,272.39 847.96 61.80 4,058.55 402.11 (4.48) 397.63 8,698.49 6,598.92
9,705.25 - 1,072.49 504.32 10,273.42 2,909.34 758.74 395.69 3,272.39 297.96 104.15 402.11
Dies and moulds 530.68 - 32.10 3.47 559.31 405.76 66.28 0.21 471.83 - - - 87.48 124.92
418.97 - 125.74 14.03 530.68 344.98 74.81 14.03 405.76 - - -
Furniture and fixture 684.55 38.34 23.34 0.49 745.74 251.88 49.40 0.26 301.02 1.07 - 1.07 443.65 431.60
554.02 - 135.19 4.66 684.55 211.87 42.33 2.32 251.88 6.27 (5.20) 1.07
Office equipments 748.14 35.65 59.98 5.02 838.75 378.19 63.62 3.41 438.40 14.09 - 14.09 386.26 355.86
705.34 - 51.28 8.48 748.14 327.23 60.27 9.31 378.19 14.83 (0.74) 14.09
Vehicle 679.15 24.02 58.51 42.97 718.71 287.97 66.63 26.45 328.15 0.91 - 0.91 389.65 390.27
663.55 - 40.65 25.05 679.15 237.72 66.80 16.55 287.97 3.51 (2.60) 0.91
Total tangible assets 26,519.90 7,507.78 728.07 123.04 34,632.71 6,629.52 1,520.72 92.13 8,058.11 418.18 (4.48) 413.70 26,160.90 19,472.20
25,595.55 - 1,575.55 651.20 26,519.90 5,756.42 1,339.12 466.02 6,629.52 322.57 95.61 418.18 19,472.20 -
Total 28,152.78 52,213.19 788.01 123.04 81,030.94 7,315.84 6,169.00 92.13 13,392.71 493.36 (4.48) 488.88 67,149.35 20,343.58
Previous year 27,172.78 - 1,631.20 651.20 28,152.78 6,249.46 1,532.40 466.02 7,315.84 322.57 170.79 493.36 20,343.58 -
$ Includes trademarks and copyrights of ` 315.63 (2012 - 315.63) pending for registration in the name of the Company.# Includes ` 452.19 (2012 ` 452.19) represented by unquoted fully paid shares at cost in various co-operative societies. Further, also refer Note 33.@ Addition in plant and machinery includes Salary and wages of ` 47.37 (2012 - ` Nil) and Power and Fuel ` 2.72 (2012 - ` Nil) pertaining to revenue expenses capitalized during the year.* Charge for the previous year includes impairment provision of ` 95.61 lacs and ` 75.18 lacs for the Pithampur washing powder unit and Ruby Brand respectively. The same was included in the soaps and detergent in Note 31.Figures in italics are in respect of the previous year.
Note 13 FIXED ASSETS
Notes to Financial Statements For the year ended March 31, 2013
` In lacs

70 | Jyothy Laboratories Limited
2013 2012
Note 14 NON CURRENT INVESTMENTS (at cost)
Trade Investments (Quoted)Investment in subsidiaries -Jyothy Consumer Products Ltd. (Formerly Henkel India Limited) - 31,548.66 Nil (2012 - 97,426,487) equity shares of Nil (2012 - ` 10) each fully paid upTrade Investments (Unquoted)Investment in subsidiaries -Associated Industries Consumer Products Private Limited4,970,000 (2012 - 4,970,000) equity shares of ` 10 (2012 - ` 10) each fully paid up 497.00 497.00 Jyothy Fabricare Services Limited 9,750,000 (2012 - 9,750,000) equity shares of ` 10 (2012 - ` 10) each fully paid up 1,275.00 1,275.00 Jyothy Kallol Bangladesh Limited6,597,000 (2012 - 37,500) equity shares of BDT 10 (2012 - BDT 10) each fully paid up 437.59 2.30 Jyothy Consumer Products Ltd (Formerly Henkel India Limited)Nil (2012- 28,000,000) 9% Redeemable Non-Cumulative Preference Shares of Nil (2012- ` 10) each fully paid up - 1,038.64 Jyothy Consumer Products Marketing Ltd (Formerly Henkel Marketing India Limited)*825,550 (2012 - Nil) equity shares of ` 10 (2012- ` Nil) each fully paid up 0.00 - Investments in OthersHenkel SPIC Employees Co-operative Thrift and Credit Society Limited 2.00 - 2,000 (2012 - Nil) equity shares of ` 100 (2012 - ` Nil) each fully paid upCapexil (Agencies) Ltd*5 (2012 - Nil) equity shares of ` 10,000 (2012- ` Nil) each fully paid up 0.00 - Madras Industrial Cooperative Analytical Laboratory Limited*2 (2012 - Nil) equity shares of ` 500 (2012- ` Nil) each fully paid up 0.00 - Ambattur Industrial Estate Manufacturers Service Industrial Cooperative Society Ltd*1 (2012 - Nil) equity shares of ` 100 (2012- ` Nil) each fully paid up 0.00 -
2,211.59 34,361.60 Investments in Partnership Firm M/s JFSL - JLL (Refer Note -39) 111.25 37.50
Non-Trade Investment (Unquoted)Investment in Government Securities Indira Vikas Patra 0.02 0.02 National Saving Certificates (Pledged with Government authorities) 0.57 0.27
0.59 0.29 Investment property 147.30 147.30
2,470.73 34,546.69 Aggregate amount of unquoted investments 2,470.73 2,998.03Aggregate amount of quoted investments - 31,548.66Market Value of quoted investments - 23,577.21* Investment has been fair valued on amalgamation at a nominal value of ` 1/-
Notes to Financial Statements For the year ended March 31, 2013
` In lacs

Annual Report 2012-13 | 71
` In lacsNon-Current Current
2013 2012 2013 2012
Note 15 LOANS AND ADVANCES
Unsecured, considered good unless otherwise stated Capital Advances 1,139.00 1,078.92 - - Advances and loans to subsidiaries (Refer Note - 38) 40,484.98 50,632.54 301.84 1,551.29 Inter corporate deposit to third parties - - 514.79 519.97 Advance to suppliers 419.83 419.83 2,403.90 1,226.68 Balance with excise and VAT authorities - - 1,350.87 542.28 MAT Credit entitlement 1,584.11 - - 600.00 Deposits 552.49 302.33 - - Balance with government authorities 4,250.44 2,424.30 - - Prepaid Expenses - - 415.28 291.73 Advance income tax (net of provisions) 704.07 - - 10.45 Other receivables 623.00 - 649.60 171.61 Less: Provisions for doubtful advances (131.50) - (1,220.54) -
49,626.42 54,857.92 4,415.74 4,914.01 Note: Advances to suppliers, Balance with excise and VAT authorities, Deposits and Other receivables include ` 309.72 (2012 - Nil), ` 881.50 (2012 - Nil), ` 58.74 (2012 - Nil) and ` 102.08 (2012 - Nil) respectively, considered doubtful and fully provided for.
Note 16 OTHER ASSETS
Unsecured, considered good Inventory-Sales Promotions Items - - 374.43 199.54 Interest accrued but not due - - 30.65 21.64 Fixed deposit with Banks having original maturity of more than 12 months (Refer Note 20) 13.05 23.59 - -
13.05 23.59 405.08 221.18
2013 2012
Note 17 CURRENT INVESTMENTS (Cost or fair value whichever is lower)
Jyothy Consumer Products Ltd (Formerly Henkel India Limited) - 3,224.29 Nil (2012 - 40,000,000) 4% redeemable cumulative preference shares of Nil (2012- `10 each fully paid up)
- 3,224.29
Note 18 INVENTORIES (Valued at lower of cost or net realisable value)
Raw and packing materials (including goods in transit ` Nil (2012- ` 1.93)) 4,322.55 3,358.52 Work in progress 946.66 717.89 Finished goods manufactured 5,027.25 1,998.15 Traded Goods (including goods in transit ` 2.89 (2012 - ` 66.38)) 6,049.50 1,258.71 Stores and spare parts 395.76 273.78 Inventory for Capital Goods 2.92 321.14
16,744.64 7,928.19
Notes to Financial Statements For the year ended March 31, 2013
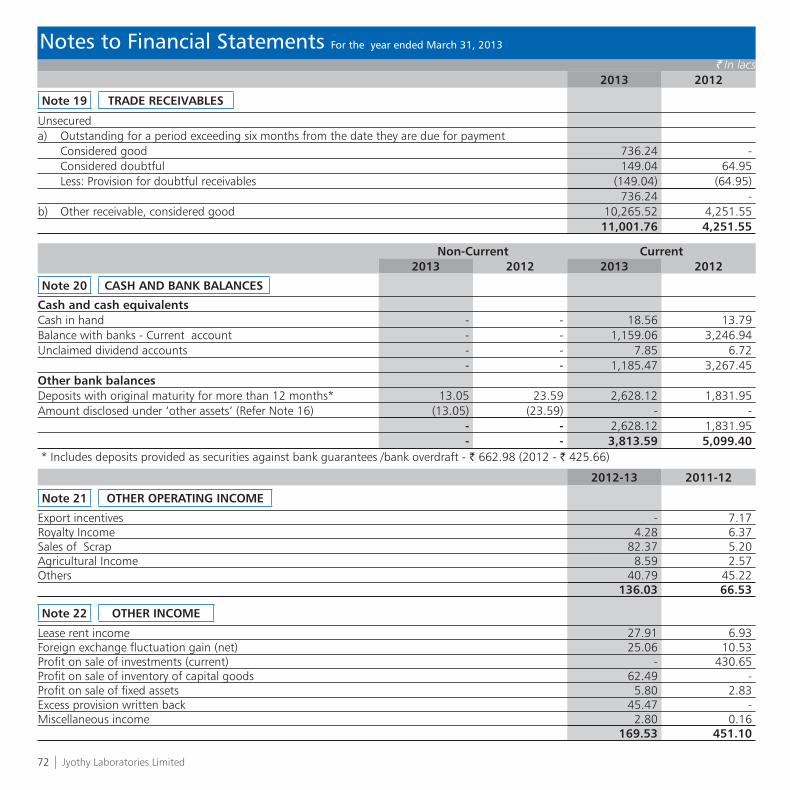
72 | Jyothy Laboratories Limited
` In lacs
Notes to Financial Statements For the year ended March 31, 2013
2013 2012
Note 19 TRADE RECEIVABLES
Unsecureda) Outstanding for a period exceeding six months from the date they are due for payment
Considered good 736.24 - Considered doubtful 149.04 64.95 Less: Provision for doubtful receivables (149.04) (64.95)
736.24 - b) Other receivable, considered good 10,265.52 4,251.55
11,001.76 4,251.55
Non-Current Current2013 2012 2013 2012
Note 20 CASH AND BANK BALANCES
Cash and cash equivalentsCash in hand - - 18.56 13.79 Balance with banks - Current account - - 1,159.06 3,246.94 Unclaimed dividend accounts - - 7.85 6.72
- - 1,185.47 3,267.45 Other bank balancesDeposits with original maturity for more than 12 months* 13.05 23.59 2,628.12 1,831.95Amount disclosed under ‘other assets’ (Refer Note 16) (13.05) (23.59) - -
- - 2,628.12 1,831.95 - - 3,813.59 5,099.40
* Includes deposits provided as securities against bank guarantees /bank overdraft - ` 662.98 (2012 - ` 425.66)
2012-13 2011-12
Note 21 OTHER OPERATING INCOME
Export incentives - 7.17 Royalty Income 4.28 6.37 Sales of Scrap 82.37 5.20 Agricultural Income 8.59 2.57 Others 40.79 45.22
136.03 66.53
Note 22 OTHER INCOME
Lease rent income 27.91 6.93 Foreign exchange fluctuation gain (net) 25.06 10.53 Profit on sale of investments (current) - 430.65 Profit on sale of inventory of capital goods 62.49 - Profit on sale of fixed assets 5.80 2.83 Excess provision written back 45.47 - Miscellaneous income 2.80 0.16
169.53 451.10

Annual Report 2012-13 | 73
` In lacs
Notes to Financial Statements For the year ended March 31, 2013
2012-13 2011-12
Note 23 COST OF RAW MATERIALS AND COMPONENTS CONSUMED
Opening stock 3,358.52 2,252.40 Opening stock pursuant to Scheme of amalgamation with Jyothy Consumer Products Limited (Refer Note 36) 1,235.85 - Add: Cost of purchases 32,167.78 23,594.92
36,762.15 25,847.32 Less: Closing stock 4,322.54 3,358.52
32,439.61 22,488.80
Note 24 (INCREASE)/ DECREASE IN INVENTORIES OF FINISHED GOODS,WORK IN PROGRESS AND TRADED GOODS
Closing stock Finished goods 5,027.25 1,998.15 Traded Goods 6,049.50 1,258.71 Work in progress 946.66 717.89
12,023.41 3,974.75 Opening stock Finished goods 1,998.15 2,011.07 Traded Goods 1,258.71 1,750.37 Work in progress 717.89 257.94
3,974.75 4,019.38 Opening stock pursuant to Scheme of amalgamation with Jyothy Consumer Products Limited (Refer Note 36)Finished goods 309.98 - Traded Goods 1,804.96 - Work in progress 90.16 -
2,205.10 - Sub-total (A) (5,843.56) 44.63
(Increase)/decrease in excise dutyExcise duty on closing stock 186.13 37.34 Excise duty on opening stock 37.34 38.15
Sub-total (B) (148.79) 0.81 Total (A-B) (5,694.77) 43.82
Note 25 EMPLOYEE BENEFITS EXPENSES
Salaries, wages and bonus 8,450.26 5,717.24 Contribution to provident and other funds (Refer Note 29) 605.03 513.19 Gratuity (Refer Note 29) 239.68 166.25 Staff welfare expenses 477.67 373.06 Directors’ remuneration (Refer Note 41) 901.13 440.26 Commission to directors (Refer Note 41) 212.59 391.69 Field staff incentives 169.82 200.49
11,056.18 7,802.18

74 | Jyothy Laboratories Limited
` In lacs
Notes to Financial Statements For the year ended March 31, 2013
2012-13 2011-12
Note 26 OTHER EXPENSES
Power and fuel expenses 2,114.69 1,489.32 Rent 930.85 511.90 Insurance 93.77 19.72 Repairs and maintenance - Building 55.49 24.45 - Plant and machinery 202.97 53.63 - Others 152.07 78.55 Consumption of stores and spares 197.56 329.73 Research and development 23.75 14.67 Excise duty 233.85 192.01 Printing and stationery 83.25 47.71 Communication costs 243.99 156.41 Legal and professional fees (Refer Note 30(E)) 1,029.00 667.68 Rates and taxes 502.79 286.48 Directors’ sitting fees 5.65 3.65 Vehicle maintenance 189.13 158.34 Donation (Refer Note 30(F)) 9.18 4.75 Loss on fixed assets discarded 8.12 166.62 Provision for doubtful debts 22.93 28.22 Provision for doubtful advances 30.96 - Advertisement and publicity 5,584.31 3,044.17 Sales promotion and schemes 2,596.25 1,238.86 Carriage outwards 3,970.78 2,305.08 Field staff expenses 940.92 994.52 Travelling and conveyance 486.54 203.81 Brokerage on sales 513.61 468.37 Royalty 153.03 - Miscellaneous expenses 1,301.17 480.79
21,676.61 12,969.44
Note 27 FINANCE COST
Interest expense 5,751.64 1,807.65 Other Borrowing Cost 856.63 135.60
6,608.27 1,943.25
Note 28 INTEREST INCOME
Interest on fixed deposit 259.45 392.11 Interest on loans to subsidiaries 4,494.67 4,751.36 Interest on intercorporate deposit 61.48 59.13
4,815.60 5,202.60
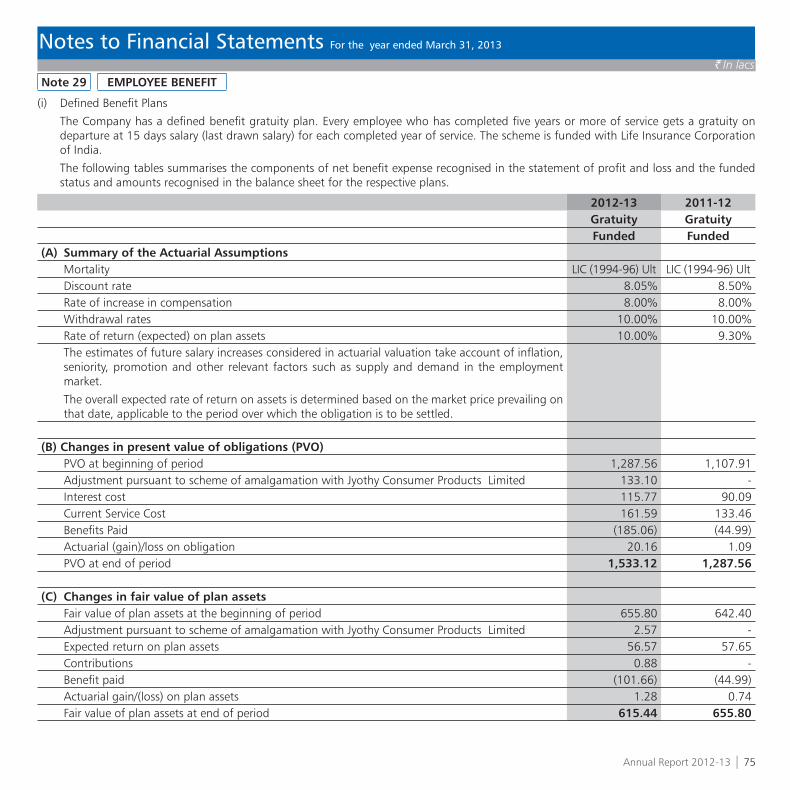
Annual Report 2012-13 | 75
` In lacs
Notes to Financial Statements For the year ended March 31, 2013
Note 29 EMPLOYEE BENEFIT
(i) Defined Benefit Plans
The Company has a defined benefit gratuity plan. Every employee who has completed five years or more of service gets a gratuity on departure at 15 days salary (last drawn salary) for each completed year of service. The scheme is funded with Life Insurance Corporation of India.
The following tables summarises the components of net benefit expense recognised in the statement of profit and loss and the funded status and amounts recognised in the balance sheet for the respective plans.
2012-13 2011-12Gratuity GratuityFunded Funded
(A) Summary of the Actuarial AssumptionsMortality LIC (1994-96) Ult LIC (1994-96) UltDiscount rate 8.05% 8.50%Rate of increase in compensation 8.00% 8.00%Withdrawal rates 10.00% 10.00%Rate of return (expected) on plan assets 10.00% 9.30%
The estimates of future salary increases considered in actuarial valuation take account of inflation, seniority, promotion and other relevant factors such as supply and demand in the employment market.
The overall expected rate of return on assets is determined based on the market price prevailing on that date, applicable to the period over which the obligation is to be settled.
(B) Changes in present value of obligations (PVO)PVO at beginning of period 1,287.56 1,107.91 Adjustment pursuant to scheme of amalgamation with Jyothy Consumer Products Limited 133.10 - Interest cost 115.77 90.09 Current Service Cost 161.59 133.46 Benefits Paid (185.06) (44.99)Actuarial (gain)/loss on obligation 20.16 1.09 PVO at end of period 1,533.12 1,287.56
(C) Changes in fair value of plan assetsFair value of plan assets at the beginning of period 655.80 642.40 Adjustment pursuant to scheme of amalgamation with Jyothy Consumer Products Limited 2.57 - Expected return on plan assets 56.57 57.65 Contributions 0.88 - Benefit paid (101.66) (44.99)Actuarial gain/(loss) on plan assets 1.28 0.74 Fair value of plan assets at end of period 615.44 655.80

76 | Jyothy Laboratories Limited
` In lacs
Notes to Financial Statements For the year ended March 31, 2013
2012-13 2011-12
Note 29 EMPLOYEE BENEFIT (Contd.)
(D) Net Assets/(Liabilities) recognised in the balance sheetPVO at end of period (1,533.12) (1,287.56)Fair value of plan assets at end of period 615.44 655.80 Funded status (deficit in plan assets over fair value of PVO) (917.68) (631.76)Net assets / (Liability) recognised in the balance sheet (917.68) (631.76)
(E) Expenses recognised in the statement of profit and lossCurrent service cost 161.59 133.46 Interest cost 115.77 90.09 Expected return on plan assets (56.57) (57.65)Net Actuarial (Gain)/Loss recognised for the period 18.89 0.35 Expense recognised in the statement of profit and loss 239.68 166.25
(F) The major categories of plan assets as a percentage of the fair value of total plan assets are as follows:Investment with insurer 100.00% 100.00%
(G) Amounts for the current and previous four periods are as follows:April to
March 2013April to
March 2012April to
March 2011April to
March 2010July to
March 2009Defined benefit obligation 1,533.12 1,287.56 1,107.91 861.58 710.67 Plan assets 615.44 655.80 642.40 406.50 296.15 Surplus/(Deficit) 917.68 631.76 465.51 455.08 414.52 Experience adjustment on plan liabilities 20.16 1.09 129.73 17.27 57.26 Experience adjustment on plan assets 1.28 0.74 8.49 4.01 12.43
(H) The Company expects to contribute ` Nil (2012- ` Nil) to gratuity fund and ` 76.70 (2012 - ` 37.03) to Superannuation fund in the next year.
(ii) Defined Contribution Plans - Amount of ` 728.58 (2012 - ` 553.63 ) is recognised as an expense and included in Note 25 in the Statement of profit and loss.

Annual Report 2012-13 | 77
` In lacs
Notes to Financial Statements For the year ended March 31, 2013
2012-13 2011-12
Note 30 SUPPLEMENTARY INFORMATION
A) Earnings in foreign currency (accrual basis):FOB value of exports 890.74 872.98
B) Expenditure in foreign currency (accrual basis):i) Royalty 153.03 - ii) Travelling And Conveyance 60.60 7.50
C) CIF value of imports(i) Raw material 764.07 20.91 (ii) Capital goods 4.74 6.57
D) Unhedged foreign currency exposure:
Particulars Foreign Currency
2012-13 2011-12` in Lacs Amount
in Foreign Currency
` in Lacs Amountin Foreign Currency
Export trade receivables US $ 45.61 83,852 100.32 196,110Advance and Investment in Jyothy Kallol Bangladesh Limited BDT 437.59 65,970,000 347.18 52,500,000
E) Payment to auditors2012-13 2011-12
i) As Auditors 50.40 45.00 ii) In other capacity
- Tax audit fees 9.55 9.83 - Certification 3.66 1.65
iii) Reimbursement of expenses 2.56 3.07 66.17 59.55
F) Donations to political parties2012-13 2011-12
Name of the PartyCommunist Party of India - 0.01 Congress Party - 0.02 Bharatiya Janata Party 0.07 0.01 LDF Election Fund - 0.03
0.07 0.07

78 | Jyothy Laboratories Limited
` In lacs
Notes to Financial Statements For the year ended March 31, 2013
H) Value of Imported and Indigenous Raw Materials, Packing Materials, Stores and Spare Parts ConsumedParticulars Raw Materials Stores and Spare parts
2012-13 2011-12 2012-13 2011-12Value % Value % Value % Value %
Imported 138.53 0.43% 5.14 0.02% 0.29 0.15% 0.52 0.16%Indigenous 32,301.08 99.57% 22,483.66 99.98% 197.27 99.85% 329.21 99.84%Total 32,439.61 22,488.80 197.56 329.73
Note 30 SUPPLEMENTARY INFORMATION (Contd.)
G) Details of Raw and packing material consumed:Particulars Consumption
Value2012-13 2011-12
Synthetic Dye 550.68 647.17Soap Noodles 86.34 273.39 Dyes & Chemicals 6,600.53 4,833.10Fatty Oils, Powder & Perfumes 11,159.59 7,510.85Plastic 2,082.33 2,287.60Others 4,455.28 1,775.76Packing materials 7,504.86 5,160.93Total 32,439.61 22,488.80
I) Value of opening stock , purchases , sales and closing stockItem Type Opening
InventoryPurchases Sales Closing
InventoryHome Care Traded 878.51 9,743.78 11,021.17 1,787.05
10,303.25 12,301.32Manufactured 474.73 13,468.61 2,070.43
9,504.55 Soaps & Detergents Traded 394.18 19,305.22 35,506.67 3,889.15
4,422.93 5,590.33 Manufactured 1,509.44 40,082.51 2,956.82
38,892.95 Others Traded - 973.12 1,658.71 373.30
- (11.00)Total 3,256.86 30,022.12 101,737.67 11,076.75
14,726.18 66,278.15 Figures in italics are in respect of the previous year
J) Value of closing stock of work in progessParticulars 2013 2012Home Care 227.54 370.68Soaps & Detergents 719.12 347.21Total 946.66 717.89

Annual Report 2012-13 | 79
` In lacs
Notes to Financial Statements For the year ended March 31, 2013
Note 31 SEGMENT REPORTING
Business segments:The primary segment of the Company has been determined on the basis of business segment. The Company is organized into following business segments - Soaps and Detergents, Home Care and others. Segments have been identified taking into account the nature of the products, the differing risks and returns, the organization structure and the internal reporting system.
Soaps and Detergents includes fabric whiteners, fabric detergents, dish wash bar and soaps including ayurvedic soaps. Home Care products include incense sticks, scrubber, dhoop and mosquito repellents. Others includes bodycare, tea and coffee.
Secondary segment:The Company mainly caters to the needs of the domestic market. The export turnover is not significant in the context of total turnover. As such, there is only one reportable geographical segment.
Segment revenue and result:The income/ expense that are not directly attributable to the business segments are shown as unallocated corporate costs.
Segment assets and liabilities:Segment assets include all operating assets used by a segment and consist principally of debtors, inventories, advances and fixed assets. Assets at corporate level are not allocable to segments on a reasonable basis and thus the same have not been allocated.
Segment liabilities include all operating liabilities and consist principally of creditors and accrued liability.
Information about Business Segments
Soaps and Detergents Home care Others Eliminations Total
2012-13 2011-12 2012-13 2011-12 2012-13 2011-12 2012-13 2011-12 2012-13 2011-12
Revenue
External Revenue 75,589.18 44,498.59 24,489.78 21,787.40 1,658.71 (7.84) - - 101,737.67 66,278.15
Inter Segment Revenue 5.41 56.08 1.08 (2.22) - - (6.49) (53.86) - -
Net Revenue 75,594.59 44,554.67 24,490.86 21,785.18 1,658.71 (7.84) (6.49) (53.86) 101,737.67 66,278.15
Segment Result 7,654.71 9,085.97 794.13 (1,594.59) 43.69 1.22 - - 8,492.53 7,492.60
Unallocated expenditure (2,301.38) (869.38)
Unallocated Income 5,003.41 5,641.55
Interest and finance expenses (6,608.27) (1,943.25)
Profit before tax and prior period items 4,586.29 10,321.52
Prior Period Items (182.71) -
Profit before tax 4,403.58 10,321.52
Provision for tax - (1,969.96)
Profit after tax 4,403.58 8,351.56
Other Information
Segment assets 68,454.45 19,672.40 12,380.75 10,069.06 3,336.56 - - - 84,171.76 29,741.46
Unallocated assets 71,795.31 105,950.75
Total assets 155,967.07 135,692.21
Segment liabilities 12,821.05 5,147.24 3,714.65 3,568.37 507.67 - - - 17,043.37 8,715.61
Unallocated liabilities 66,521.41 59,626.03
Total liabilities 83,564.78 68,341.64
Segment capital expenditure(including capital work in progress) 584.98 438.33 48.66 285.81 - - - - 633.64 724.14
Unallocated capital expenditure(including capital work in progress) 199.27 172.71
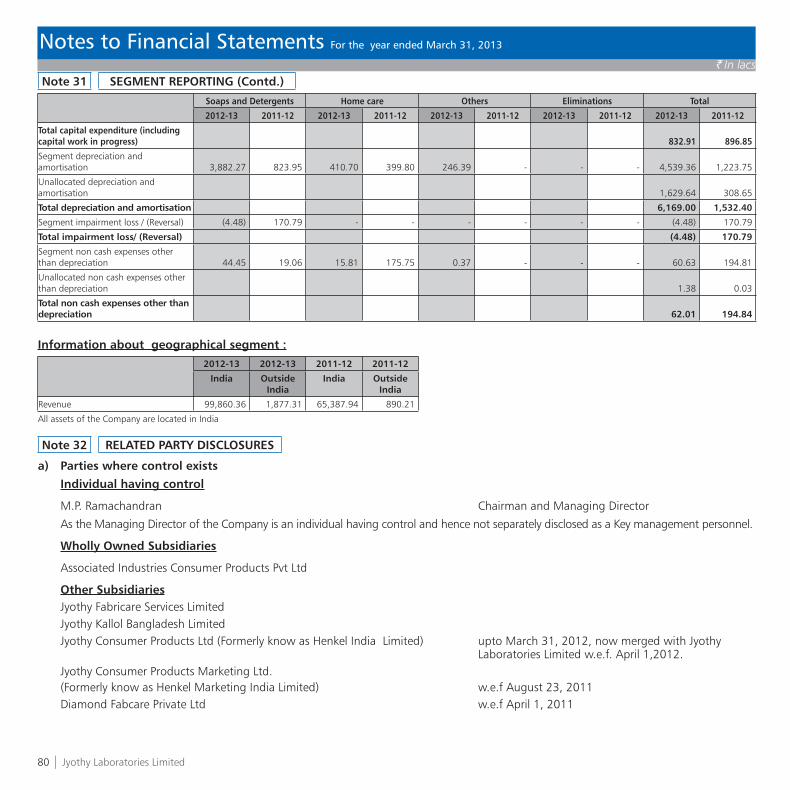
80 | Jyothy Laboratories Limited
` In lacs
Notes to Financial Statements For the year ended March 31, 2013
Note 31 SEGMENT REPORTING (Contd.)
Soaps and Detergents Home care Others Eliminations Total
2012-13 2011-12 2012-13 2011-12 2012-13 2011-12 2012-13 2011-12 2012-13 2011-12
Total capital expenditure (including capital work in progress) 832.91 896.85
Segment depreciation and amortisation 3,882.27 823.95 410.70 399.80 246.39 - - - 4,539.36 1,223.75
Unallocated depreciation and amortisation 1,629.64 308.65
Total depreciation and amortisation 6,169.00 1,532.40
Segment impairment loss / (Reversal) (4.48) 170.79 - - - - - - (4.48) 170.79
Total impairment loss/ (Reversal) (4.48) 170.79
Segment non cash expenses other than depreciation 44.45 19.06 15.81 175.75 0.37 - - - 60.63 194.81
Unallocated non cash expenses other than depreciation 1.38 0.03
Total non cash expenses other than depreciation 62.01 194.84
Information about geographical segment :
2012-13 2012-13 2011-12 2011-12
India OutsideIndia
India OutsideIndia
Revenue 99,860.36 1,877.31 65,387.94 890.21
All assets of the Company are located in India
Note 32 RELATED PARTY DISCLOSURES
a) Parties where control exists Individual having control
M.P. Ramachandran Chairman and Managing Director
As the Managing Director of the Company is an individual having control and hence not separately disclosed as a Key management personnel.
Wholly Owned Subsidiaries
Associated Industries Consumer Products Pvt Ltd
Other SubsidiariesJyothy Fabricare Services LimitedJyothy Kallol Bangladesh Limited Jyothy Consumer Products Ltd (Formerly know as Henkel India Limited) upto March 31, 2012, now merged with Jyothy
Laboratories Limited w.e.f. April 1,2012. Jyothy Consumer Products Marketing Ltd.(Formerly know as Henkel Marketing India Limited) w.e.f August 23, 2011 Diamond Fabcare Private Ltd w.e.f April 1, 2011

Annual Report 2012-13 | 81
` In lacs
Notes to Financial Statements For the year ended March 31, 2013
Note 32 RELATED PARTY DISCLOSURES (Contd.)
Akash Cleaners Private Limited w.e.f April 1, 2011
Four Seasons Drycleaning Company Private Limited w.e.f. February 15, 2012
Fab Clean & Care Private Limited w.e.f June 1, 2011
Snoways Laundrers & Drycleaners Private Limited
b) Related party relationships where transactions have taken place during the yearPartnership firm
M/S JFSL-JLL (JV)
Firm / HUF in which the relatives of individual having control are partners / members / proprietor.Beena Agencies
Quilon Trading Co.
Travancore Trading Corp.
Sree Guruvayurappan Agencies
M.P. Agencies
Tamil Nadu Distributors
Deepthy Agencies
Sahyadri Agencies
Sreehari Stock Suppliers
Sujatha Agencies
M.P. Divakaran - H.U.F.
M.P. Sidharthan - H.U.F.
Relative of individual having controlM.P. Sidharthan
M.R. Jyothy (Director)
M.R. Deepthi
Ananth Rao T
Ravi Razdan
M. G. Santhakumari
M.P. Divakaran
Enterprises significantly influenced by key management personnel or their relativesSahyadri Agencies Ltd.
Key management personnelK. Ullas Kamath Joint Managing Director
S.Raghunandan Whole Time Director & CEO
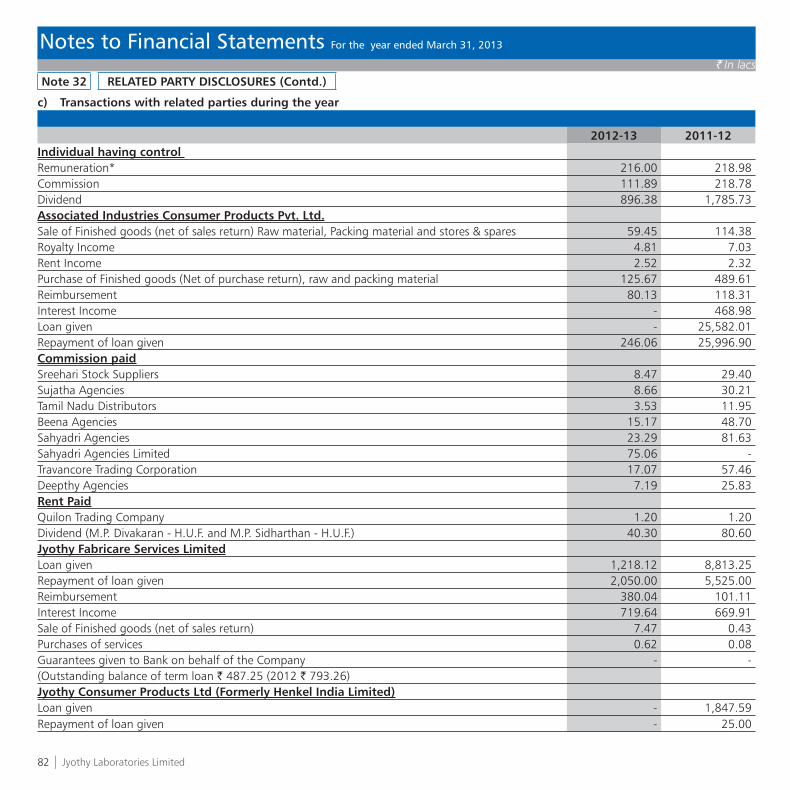
82 | Jyothy Laboratories Limited
` In lacs
Notes to Financial Statements For the year ended March 31, 2013
Note 32 RELATED PARTY DISCLOSURES (Contd.)
c) Transactions with related parties during the year
2012-13 2011-12Individual having control Remuneration* 216.00 218.98 Commission 111.89 218.78 Dividend 896.38 1,785.73 Associated Industries Consumer Products Pvt. Ltd.Sale of Finished goods (net of sales return) Raw material, Packing material and stores & spares 59.45 114.38 Royalty Income 4.81 7.03 Rent Income 2.52 2.32 Purchase of Finished goods (Net of purchase return), raw and packing material 125.67 489.61 Reimbursement 80.13 118.31 Interest Income - 468.98 Loan given - 25,582.01 Repayment of loan given 246.06 25,996.90 Commission paidSreehari Stock Suppliers 8.47 29.40 Sujatha Agencies 8.66 30.21 Tamil Nadu Distributors 3.53 11.95 Beena Agencies 15.17 48.70 Sahyadri Agencies 23.29 81.63 Sahyadri Agencies Limited 75.06 - Travancore Trading Corporation 17.07 57.46 Deepthy Agencies 7.19 25.83 Rent PaidQuilon Trading Company 1.20 1.20 Dividend (M.P. Divakaran - H.U.F. and M.P. Sidharthan - H.U.F.) 40.30 80.60 Jyothy Fabricare Services LimitedLoan given 1,218.12 8,813.25 Repayment of loan given 2,050.00 5,525.00 Reimbursement 380.04 101.11 Interest Income 719.64 669.91 Sale of Finished goods (net of sales return) 7.47 0.43 Purchases of services 0.62 0.08 Guarantees given to Bank on behalf of the Company - - (Outstanding balance of term loan ` 487.25 (2012 ` 793.26)Jyothy Consumer Products Ltd (Formerly Henkel India Limited)Loan given - 1,847.59 Repayment of loan given - 25.00

Annual Report 2012-13 | 83
` In lacs
Notes to Financial Statements For the year ended March 31, 2013
Note 32 RELATED PARTY DISCLOSURES (Contd.)
c) Transactions with related parties during the year (Contd.)
2012-13 2011-12Sale of Finished goods (net of sales return) - 1,086.84 Purchase of Finished goods (Net of purchase return) - 515.91 Interest Income - 1,190.88 Other reimbursement - 141.42 Reimbursement of expenses - 604.40 Jyothy Consumer Products Marketing Ltd (Formerly Henkel Marketing India Limited)Repayment of loan given # - 2,037.42 Interest Income 3,450.00 2,275.96 Reimbursement of expenses 308.62 - Other reimbursement 609.24 - Purchase of Finished goods (Net of purchase return) 131.04 - Sale of Finished goods (net of sales return) 17,369.08 - # Loan given before August 23, 2011.Diamond Fabcare Private Ltd.Sales of finished goods 0.34 - Loan given 2,603.00 70.00 Repayment of loan given 2.50 - Interest Income 258.24 0.44 Akash Cleaners Private LimitedLoan given 231.50 446.50 Repayment of loan given 3.50 21.50 Sales of Finished goods - 0.09 Interest Income 66.79 1.64 Jyothy Kallol Bangladesh LimitedInvestment in share capital 435.29 - Sale of inventory of capital goods 386.06 - Share application Money - 346.89 Relatives of individuals having controlRemuneration*M. R. Jyothy (Director) 56.28 31.36 M. P. Sidharthan 20.00 12.00 M. R. Deepthi 20.16 15.01 Ananth Rao T 26.49 20.16 Ravi Razdan 20.16 15.90 M. P. Divakaran 20.00 11.00 Dividend 362.38 710.08
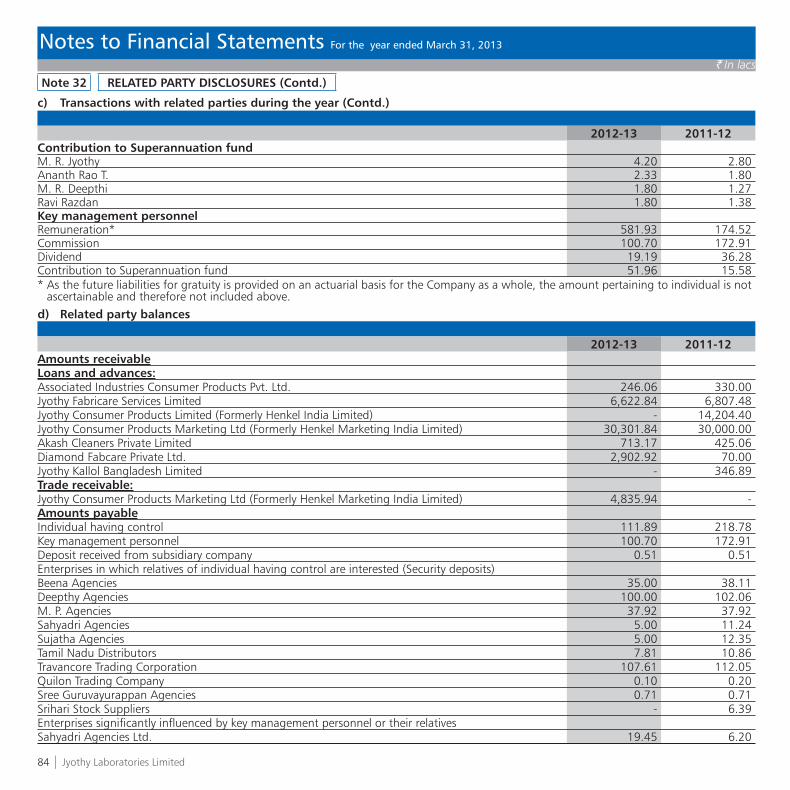
84 | Jyothy Laboratories Limited
` In lacs
Notes to Financial Statements For the year ended March 31, 2013
Note 32 RELATED PARTY DISCLOSURES (Contd.)
c) Transactions with related parties during the year (Contd.)
2012-13 2011-12Contribution to Superannuation fundM. R. Jyothy 4.20 2.80 Ananth Rao T. 2.33 1.80 M. R. Deepthi 1.80 1.27 Ravi Razdan 1.80 1.38 Key management personnelRemuneration* 581.93 174.52 Commission 100.70 172.91 Dividend 19.19 36.28 Contribution to Superannuation fund 51.96 15.58 * As the future liabilities for gratuity is provided on an actuarial basis for the Company as a whole, the amount pertaining to individual is not
ascertainable and therefore not included above.d) Related party balances
2012-13 2011-12Amounts receivableLoans and advances:Associated Industries Consumer Products Pvt. Ltd. 246.06 330.00 Jyothy Fabricare Services Limited 6,622.84 6,807.48 Jyothy Consumer Products Limited (Formerly Henkel India Limited) - 14,204.40 Jyothy Consumer Products Marketing Ltd (Formerly Henkel Marketing India Limited) 30,301.84 30,000.00 Akash Cleaners Private Limited 713.17 425.06 Diamond Fabcare Private Ltd. 2,902.92 70.00 Jyothy Kallol Bangladesh Limited - 346.89 Trade receivable:Jyothy Consumer Products Marketing Ltd (Formerly Henkel Marketing India Limited) 4,835.94 -Amounts payableIndividual having control 111.89 218.78 Key management personnel 100.70 172.91 Deposit received from subsidiary company 0.51 0.51 Enterprises in which relatives of individual having control are interested (Security deposits)Beena Agencies 35.00 38.11 Deepthy Agencies 100.00 102.06 M. P. Agencies 37.92 37.92 Sahyadri Agencies 5.00 11.24 Sujatha Agencies 5.00 12.35 Tamil Nadu Distributors 7.81 10.86 Travancore Trading Corporation 107.61 112.05 Quilon Trading Company 0.10 0.20 Sree Guruvayurappan Agencies 0.71 0.71 Srihari Stock Suppliers - 6.39 Enterprises significantly influenced by key management personnel or their relativesSahyadri Agencies Ltd. 19.45 6.20

Annual Report 2012-13 | 85
` In lacs
Notes to Financial Statements For the year ended March 31, 2013
Note 33 OPERATING LEASES
In case of assets taken on leaseThe Company has entered into Lease agreements for premises, which expire at various dates over the next five years. Certain agreements provide for increase in rent. Lease rental expense for the year ended March 31, 2013 was ` 930.85 (2012 - ` 511.90). There are no restrictions imposed by lease arrangements.
2012-13 2011-12Future lease payment under non - cancellable operating leases are as follows:Payable not later than one year 53.76 41.85 Payable later than one year and not later than five years 44.96 37.93 Payable later than five years - -
98.72 79.78
In case of assets given on leaseThe Company has leased out few of its premises on operating lease. The Gross carrying amount and accumulated depreciation as at March 31, 2013 is ` 105.98 and ` 19.94 (2012 - ` 147.98 and ` 21.27) respectively. Lease rent income for the year ended March 31, 2013 was ` 27.91 (2012 – ` 6.93). There is no escalation clause in the lease agreement and the lease is cancellable in nature. There are no restrictions imposed by lease arrangements.
Note 34 CONTINGENT LIABILITIES
2013 2012Contingent liabilities not probable and hence not provided by the Company in respect of:(i) Amount outstanding in respect of corporate guarantees 1,975.75 1,301.35(ii) Tax matters
(a) Disputed sales tax demands – matters under appeal 6,295.13 3,274.03(b) Disputed excise duty and service tax demand - matter under appeal 2,438.36 1,867.85(c) Disputed income tax demands – matters under appeal 79.56 -
(iii) Other statutory dues 8.00 20.11 (iv) Claims against the Company not acknowledged as debt - 120.00
Note 35 CAPITAL COMMITMENTS (NET OF ADVANCES)
2013 2012Estimated amount of contracts remaining to be executed on capitalaccount and not provided for 270.45 310.22
270.45 310.22
Note 36
The Honorable High Court of Mumbai, on April 12, 2013, approved the scheme of amalgamation (the scheme) under sections 391 to 394 of the Companies Act, 1956. In accordance with the scheme, Jyothy Consumer Products Limited (transferor Company) merged with the Company with effect from 1 April 2012. The transferor Company was engaged in the business of manufacturing and sale of body care, soap and detergent. The amalgamation is expected to channelize synergies and lead to better utilization of available resources and result in greater economies of scale.
The salient features of the scheme is as given below:-
a. The Company has accounted for the amalgamation under the purchase method and recognised assets and liabilities acquired at fair value.b. The investments held by the Company in the Transferor Company has been cancelled.

86 | Jyothy Laboratories Limited
` In lacs
Notes to Financial Statements For the year ended March 31, 2013
Note 36 (Contd.)
c. The inter-corporate investments and inter-corporate deposits / loans and advances outstanding between the Company and the Transferor Company has been cancelled.
d. The excess of the purchase consideration paid by the Company over the value of net assets of the Transferor Company and after giving effect to point b) and c) above has been treated as goodwill.
Goodwill arising above has been amortised over a period of 10 years from the date of amalgamation as management believes that benefits due to acquisition in form of distribution synergies, economies of scale, overheads optimisation and brand category expansion shall be available for at least 10 years.
The purchase consideration is to be discharged through issue of 23,79,748 equity shares. Pending such allotment, the fair value of the consideration of ` 5,504.12 lacs has been shown under ‘Share capital suspense account’ in the balance sheet. Further, the shareholders of the transferor Company are also entitled to equivalent number of bonus shares. Accordingly, an amount of ` 23.80 lacs has been utilised from securities premium and disclosed under ‘Share capital suspense account’.
The assets and liabilities of Jyothy Consumer Products Limited:-
Particulars ` in LacsAssets Taken Over Tangible fixed assets 7,507.78 Intangible assets 30,366.00 Investments 2.30 Deferred tax assets 1,533.79 Loans and advances 1,322.91 Other assets 27.17 Inventories 3,393.81 Trade receivables 3,647.39 Cash and bank balances 398.16 Total Assets 48,199.31
Liabilities Taken Over Borrowings 14,204.40 Trade payables 5,175.25 Other liabilities 59.35 Provisions 1,784.01 Total Liabilities 21,223.01
Net assets 26,976.30
Investment in Jyothy Consumer Products Limited 35,811.59 Purchase consideration 5,504.12
41,315.71 Goodwill 14,339.41
Note 37 MICRO, SMALL AND MEDIUM ENTERPRISES DEVELOPMENT ACT, 2006 (‘MSMED’)
The disclosure pursuant to the said Act is as under :2013 2012
Principal amount due to suppliers under MSMED Act 2,994.01 1,441.29 Interest accrued and due to suppliers under Section 16 of MSMED Act, 2006 on the above amount, unpaid 64.67 - Interest paid to suppliers under the MSMED Act - - Interest due and payable towards suppliers under MSMED Act towards payment already made - - Interest accrued and remaining unpaid at the end of accounting year 64.67 - The above information has been determined to the extent such parties have been identified on the basis of information available with the Company.

Annual Report 2012-13 | 87
` In lacs
Notes to Financial Statements For the year ended March 31, 2013
Note 38 DETAILS OF LOAN / ADVANCES GIVEN TO SUBSIDIARY COMPANIES
Particulars As atMarch 31, 2013
Maximumbalance during
the year
As at March 31,2012
Maximumbalance during
the yearAssociated Industries Consumer Products Pvt. Ltd. 246.06 302.78 330.00 25,819.67Jyothy Fabricare Services Limited 6,622.84 6,976.19 6,807.48 8,613.98Jyothy Consumer Products Ltd. (Formerly known as Henkel India Limited) - - 14,204.40 14,204.40Jyothy Consumer Products Marketing Ltd (Formerly known as Henkel Marketing India Limited) 30,301.84 30,501.90 30,000.00 30,881.44Akash Cleaners Private Limited 713.17 713.17 425.06 426.08Diamond Fabcare Private Ltd. 2,902.92 2,902.92 70.00 70.00
Note 39 DETAILS OF INVESTMENTS IN PARTNERSHIP FIRM
Share of partner in profits (%)2013 2012
Name of PartnerShare of partner in profits (%)Jyothy Fabricare Services Limited 75.00% 75.00%Jyothy Laboratories Limited 25.00% 25.00%Total capital of the firm 445.00 150.00
Note 40 PRIOR PERIOD ITEM
2012-13 2011-12Provision for leave encashment 182.71 -
182.71 -
Note 41 MANAGERIAL REMUNERATION
Employee benefit expenses include ` 1,113.72 lacs paid / payable during the year towards remuneration payable to its Whole Time Directors. The maximum remuneration payable under Para (1) (B) of Section II of Part II of Schedule XIII of the Companies Act, 1956 (‘Act’) is ` 192 lacs. Based on the legal advice received by the Company, management has computed the maximum remuneration payable to its Whole Time Directors amounting to ` 1,025 lacs.The Company has filed an application with the Central government and is in the process of obtaining necessary approval from shareholders for remuneration payable to its Whole Time Directors. Pending receipt of such approval, the excess remuneration paid to the Directors is held in trust by the said Directors.
Note 42 EARNING’S PER SHARE
2013 2012Net Profit for calculation of basic and diluted EPS 4,403.58 8,351.56 Weighted average number of shares for calculation of basic and diluted EPS * 166,023,496 8,06,32,000Basic and Diluted EPS (`) ** 2.65 5.18 * Current year includes 23,79,748 equity shares pending to be alloted to shareholders of Jyothy Consumer Products Limited as per the scheme of
amalgamation and equivalent bonus thereon.** 8,06,32,000 bonus shares issued in current year have been considered for calculation of basic and diluted EPS of the previous year.

88 | Jyothy Laboratories Limited
` In lacs
Notes to Financial Statements For the year ended March 31, 2013
Note 43
As per the Notification no. 32/99-CE dated July 8, 1999, the Company was entitled to refund of excise duty in Guwahati and Jammu units equivalent to the amount of the duty paid through Personal Ledger Account (‘PLA’). During an earlier year, the Government issued notifications no. 17/2008-CE and 19/2008-CE dated March 27, 2008 restricting the refund amount to a maximum percentage specified in the notification. The Company had filed a writ petition in the Guwahati High Court and the Jammu and Kashmir High Court against the respective notifications and obtained stay orders from both the High Courts. During the previous years, the Guwahati High Court has given a favourable order in case of a similar matter against which the Department has filed an appeal in the Supreme Court. Further, the Jammu High Court has also given favourable order. Based on the orders of High Court, the Company has accrued an additional benefit of ` 438.50 lacs (2012 - ` 186.54) in the current year.
Note 44
In the previous year, the Company has entered into an option agreement dated May 5, 2011 with Henkel AG & Co. KGaA (Henkel AG) whereby the Company has granted Henkel AG a firm and irrevocable option, at its sole discretion at any time after the beginning of the fifth year and ending upon the expiry of the sixth year of the said agreement or such other mutually extended period, to acquire a maximum of 26% of the issued equity share capital of the Company at a price which will be mutually determined by the parties at a later date.
Note 45 PREVIOUS YEAR FIGURES
Previous year figures have been regrouped / reclassified , where necessary, to conform to this year classification.
Signatures to Notes 1 to 45
As per our report of even date
For S.R. Batliboi & Associates LLP For and on behalf of the Board of Director ofChartered Accountants Jyothy Laboratories LimitedICAI Firm Registration No. 101049W
per Vikram Mehta M.P. Ramachandran K. Ullas KamathPartner Chairman and Managing Director Joint Managing DirectorMembership No.: 105938
Place: Mumbai M.L. Bansal Place: MumbaiDate: May 22, 2013 Company Secretary Date: May 22, 2013

Annual Report 2012-13 | 89
Auditors’ Report on Consolidated Financial Statements
To the Board of Directors of
Jyothy Laboratories Limited
We have audited the accompanying consolidated financial statements of Jyothy Laboratories Limited (“the Company”) and its subsidiaries (collectively referred to as ‘the Group’), which comprise the consolidated Balance Sheet as at March 31, 2013, and the consolidated Statement of Profit and Loss and the consolidated Cash Flow Statement for the year then ended, and a summary of significant accounting policies and other explanatory information.
Management’s Responsibility for the Consolidated Financial Statements
Management is responsible for the preparation of these consolidated financial statements that give a true and fair view of the consolidated financial position, consolidated financial performance and consolidated cash flows of the Company in accordance with accounting principles generally accepted in India. This responsibility includes the design, implementation and maintenance of internal control relevant to the preparation and presentation of the consolidated financial statements that give a true and fair view and are free from material misstatement, whether due to fraud or error.
Auditor’s Responsibility
Our responsibility is to express an opinion on these consolidated financial statements based on our audit. We conducted our audit in accordance with the Standards on Auditing issued by the Institute of Chartered Accountants of India. Those Standards require that we comply with ethical requirements and plan and perform the audit to obtain reasonable assurance about whether the consolidated financial statements are free from material misstatement.
An audit involves performing procedures to obtain audit evidence about the amounts and disclosures in the consolidated financial statements. The procedures selected depend on the auditor’s judgement, including the assessment of the risks of material misstatement of the consolidated financial statements, whether due to fraud or error. In making those risk assessments, the auditor considers internal control relevant to the Company’s preparation and presentation of the consolidated financial statements that give a true and fair view in order to design audit procedures that are appropriate in the circumstances. An audit also includes evaluating the appropriateness of accounting policies used and the reasonableness of the accounting estimates made by management, as well as evaluating the overall presentation of the consolidated financial statements. We believe that the audit evidence we have obtained is sufficient and appropriate to provide a basis for our audit opinion.
Opinion
In our opinion and to the best of our information and according to the explanations given to us, the consolidated financial statements give a true and fair view in conformity with the accounting principles generally accepted in India:
(a) in the case of the consolidated Balance Sheet, of the state of affairs of the Company as at March 31, 2013;
(b) in the case of the consolidated Statement of Profit and Loss, of the profit for the year ended on that date; and
(c) in the case of the consolidated Cash Flow Statement, of the cash flows for the year ended on that date.
Emphasis of Matter
Without qualifying our report, we draw attention to Note 40 to the consolidated financial statements regarding managerial remuneration amounting to Rs 1,113 lacs paid / provided during the year of which Rs 921 lacs is in excess of the limits prescribed under Schedule XIII of the Companies Act, 1956. As informed to us, the Company has filed an application with the Central government and is in the process of obtaining necessary approval from shareholders for approval of such excess remuneration.
Other Matter
We did not audit total assets of Rs. 3,910 lacs as at March 31, 2013, total revenues of Rs. 3,126 lacs and net cash outflows amounting to Rs. 105 lacs for the year then ended, included in the accompanying consolidated financial statements in respect of certain subsidiaries, whose financial statements and other financial information have been audited by other auditors and whose reports have been furnished to us. Our opinion, in so far as it relates to the affairs of such subsidiaries is based solely on the report of other auditors. Our opinion is not qualified in respect of this matter.
For S.R. Batliboi & Associates LLPChartered AccountantsICAI Firm Registration Number: 101049W
per Vikram MehtaPartnerMembership No.: 105938
Place of Signature: MumbaiDate: May 22, 2013

90 | Jyothy Laboratories Limited
Consolidated Balance Sheet as at March 31, 2013
As per our report of even date
For S.R. Batliboi & Associates LLP For and on behalf of the Board of Directors ofChartered Accountants Jyothy Laboratories LimitedICAI Firm Registration No. 101049W
per Vikram Mehta M.P. Ramachandran K. Ullas KamathPartner Chairman and Managing Director Joint Managing DirectorMembership No.: 105938
Place: Mumbai M.L. Bansal Place: MumbaiDate: May 22, 2013 Company Secretary Date: May 22, 2013
` In LacsNote 2013 2012
EQUITY AND LIABILITIESShareholders’ fundsShare capital 4 1,612.64 806.32 Share capital suspense (Refer Note 37) 5,527.92 - Reserves and surplus 5 56,714.44 60,435.71
63,855.00 61,242.03 Minority Interest 488.11 668.59 Non-current liabilitiesLong-term borrowings 6 42,500.42 43,794.47 Deferred tax liabilities (Net) 7 91.34 1,610.16 Other Long term liabilities 8 180.00 270.00 Provisions 9 1,021.66 831.18
43,793.42 46,505.81 Current liabilitiesShort-term borrowings 10 12,678.47 12,366.84 Trade payables 11 12,347.98 15,451.44 Other current liabilities 12 11,091.16 2,827.42 Provisions 9 7,670.47 2,871.52
43,788.08 33,517.22 TOTAL 151,924.61 141,933.65
ASSETSNon-current assetsFixed assets 13 (i) Tangible assets 29,959.72 32,100.55 (ii) Intangible assets 76,277.33 70,926.92 (iii) Capital work-in-progress 729.94 308.62 Non-current investments 14 149.89 149.89 Loans and advances 15 9,798.59 5,377.83 Other assets 16 157.15 186.09
117,072.62 109,049.90 Current assetsInventories 17 17,216.88 12,197.84 Trade receivables 18 8,078.70 8,072.36 Cash and Bank balances 19 4,631.43 6,622.18 Loans and advances 15 4,432.87 5,562.22 Other assets 16 492.11 429.15
34,851.99 32,883.75 TOTAL 151,924.61 141,933.65
Summary of significant accounting policies 3The accompanying notes are an integral part of the financial statements.
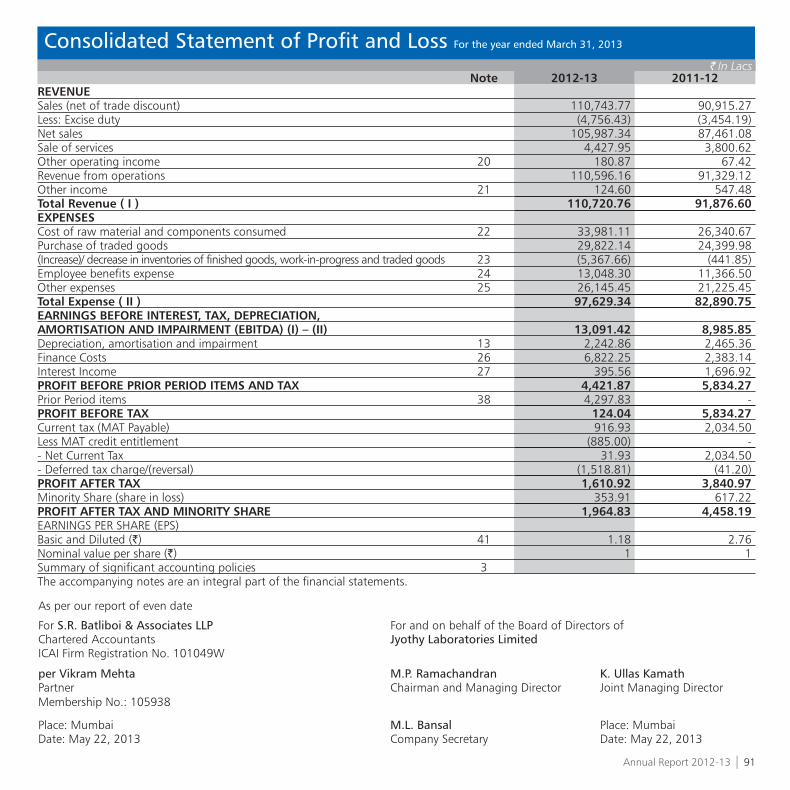
Annual Report 2012-13 | 91
Consolidated Statement of Profit and Loss For the year ended March 31, 2013
` In LacsNote 2012-13 2011-12
REVENUESales (net of trade discount) 110,743.77 90,915.27 Less: Excise duty (4,756.43) (3,454.19)Net sales 105,987.34 87,461.08 Sale of services 4,427.95 3,800.62 Other operating income 20 180.87 67.42 Revenue from operations 110,596.16 91,329.12 Other income 21 124.60 547.48 Total Revenue ( I ) 110,720.76 91,876.60 EXPENSESCost of raw material and components consumed 22 33,981.11 26,340.67 Purchase of traded goods 29,822.14 24,399.98 (Increase)/ decrease in inventories of finished goods, work-in-progress and traded goods 23 (5,367.66) (441.85)Employee benefits expense 24 13,048.30 11,366.50 Other expenses 25 26,145.45 21,225.45 Total Expense ( II ) 97,629.34 82,890.75 EARNINGS BEFORE INTEREST, TAX, DEPRECIATION,AMORTISATION AND IMPAIRMENT (EBITDA) (I) – (II) 13,091.42 8,985.85 Depreciation, amortisation and impairment 13 2,242.86 2,465.36 Finance Costs 26 6,822.25 2,383.14 Interest Income 27 395.56 1,696.92 PROFIT BEFORE PRIOR PERIOD ITEMS AND TAX 4,421.87 5,834.27 Prior Period items 38 4,297.83 - PROFIT BEFORE TAX 124.04 5,834.27 Current tax (MAT Payable) 916.93 2,034.50 Less MAT credit entitlement (885.00) - - Net Current Tax 31.93 2,034.50 - Deferred tax charge/(reversal) (1,518.81) (41.20)PROFIT AFTER TAX 1,610.92 3,840.97 Minority Share (share in loss) 353.91 617.22 PROFIT AFTER TAX AND MINORITY SHARE 1,964.83 4,458.19 EARNINGS PER SHARE (EPS)Basic and Diluted (`) 41 1.18 2.76 Nominal value per share (`) 1 1Summary of significant accounting policies 3The accompanying notes are an integral part of the financial statements.
As per our report of even date
For S.R. Batliboi & Associates LLP For and on behalf of the Board of Directors ofChartered Accountants Jyothy Laboratories LimitedICAI Firm Registration No. 101049W
per Vikram Mehta M.P. Ramachandran K. Ullas KamathPartner Chairman and Managing Director Joint Managing DirectorMembership No.: 105938
Place: Mumbai M.L. Bansal Place: MumbaiDate: May 22, 2013 Company Secretary Date: May 22, 2013

92 | Jyothy Laboratories Limited
Consolidated Cash Flow Statements For the year ended March 31, 2013
` In Lacs2012-13 2011-12
A. CASH FLOWS PROVIDED BY/(USED IN) OPERATING ACTIVITIES:Profit before Tax 124.04 5,834.27 Adjustment to reconcile profit before tax to net cash flowDepreciation, amortisation and impairment (net) 2,242.86 2,465.36 Prior Period Item 4,297.83 - Loss on fixed assets discarded 33.03 173.77 Profit on sale of fixed assets (5.80) (78.93)Interest expenses 6,822.25 2,383.14 Interest income on fixed deposit (334.08) (433.09)Interest income on loans given - (1,204.70)Excess provision written back (61.66) (18.77)Profit on sale of investments - (430.65)Bad debt written off 4.64 0.44 Provision for doubtful debts 75.09 104.03 Provision for doubtful advances 58.58 55.00 Operating profit before working capital changes 13,256.78 8,849.87 Movements in working capital :Increase/ (decrease) in trade payables (2,138.32) (10,679.23)Increase / (decrease) in provisions 2,377.24 402.51 Increase/ (decrease) in other liabilities 592.95 263.56 Decrease / (increase) in trade receivables (86.07) 16,046.21 Decrease / (increase) in inventories (5,276.95) (1,215.37)Decrease / (increase) in Loans and advances (4,268.37) 1,041.69 Decrease / (increase) in other current assets 32.73 27.63 Cash generated from operations 4,489.99 14,736.87 Taxes paid (net) (1,711.15) (2,278.95)Net cash (used in) / generated from operating activities (A) 2,778.84 12,457.92
B. CASH FLOWS PROVIDED BY/(USED IN) INVESTING ACTIVITIES:Purchase of fixed assets including capital work-in-progress and Capital Advances (2,785.52) (2,465.92)Acquisition of subsidiaries - (33,508.63)Proceeds from sale of fixed assets 46.49 130.06 Proceeds from sale of investment in current mutual funds - 431.65 Loan given to subsidiary company (pre acquisition) - (42,538.57)Maturity/(Investment) in fixed deposit (having original maturity of more than three months) (425.45) 14,745.55 Interest received on fixed deposits 318.97 488.74 Interest received on Loans - 1,204.70 Net cash (used in) / generated from investing activities (B) (2,845.51) (61,512.42)
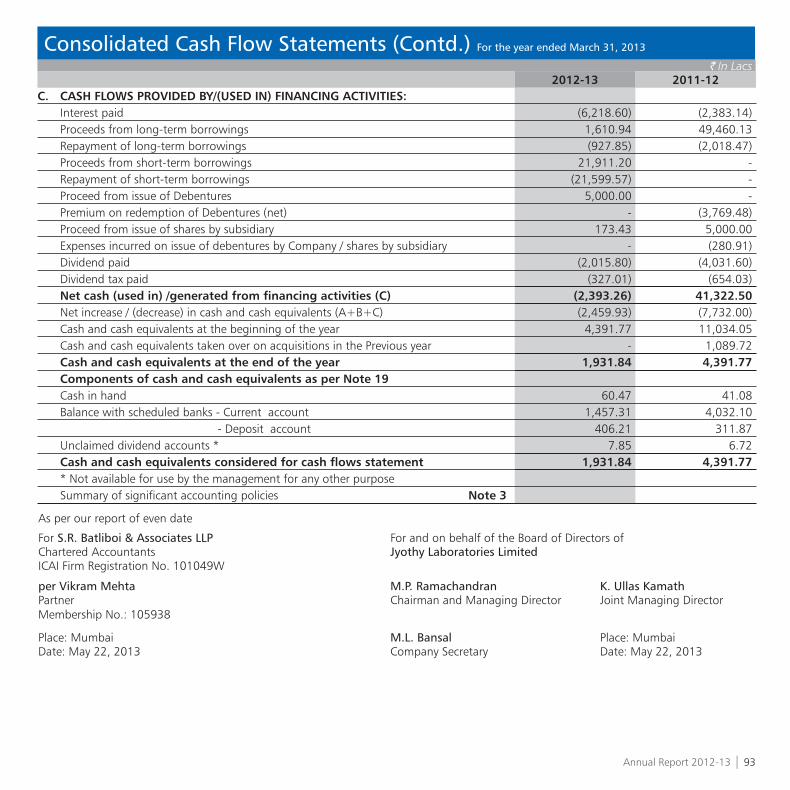
Annual Report 2012-13 | 93
Consolidated Cash Flow Statements (Contd.) For the year ended March 31, 2013
` In Lacs2012-13 2011-12
C. CASH FLOWS PROVIDED BY/(USED IN) FINANCING ACTIVITIES:Interest paid (6,218.60) (2,383.14)Proceeds from long-term borrowings 1,610.94 49,460.13Repayment of long-term borrowings (927.85) (2,018.47)Proceeds from short-term borrowings 21,911.20 -Repayment of short-term borrowings (21,599.57) -Proceed from issue of Debentures 5,000.00 -Premium on redemption of Debentures (net) - (3,769.48)Proceed from issue of shares by subsidiary 173.43 5,000.00Expenses incurred on issue of debentures by Company / shares by subsidiary - (280.91)Dividend paid (2,015.80) (4,031.60)Dividend tax paid (327.01) (654.03)Net cash (used in) /generated from financing activities (C) (2,393.26) 41,322.50Net increase / (decrease) in cash and cash equivalents (A+B+C) (2,459.93) (7,732.00)Cash and cash equivalents at the beginning of the year 4,391.77 11,034.05Cash and cash equivalents taken over on acquisitions in the Previous year - 1,089.72Cash and cash equivalents at the end of the year 1,931.84 4,391.77Components of cash and cash equivalents as per Note 19Cash in hand 60.47 41.08Balance with scheduled banks - Current account 1,457.31 4,032.10 - Deposit account 406.21 311.87Unclaimed dividend accounts * 7.85 6.72Cash and cash equivalents considered for cash flows statement 1,931.84 4,391.77* Not available for use by the management for any other purposeSummary of significant accounting policies Note 3
As per our report of even date
For S.R. Batliboi & Associates LLP For and on behalf of the Board of Directors ofChartered Accountants Jyothy Laboratories LimitedICAI Firm Registration No. 101049W
per Vikram Mehta M.P. Ramachandran K. Ullas KamathPartner Chairman and Managing Director Joint Managing DirectorMembership No.: 105938
Place: Mumbai M.L. Bansal Place: MumbaiDate: May 22, 2013 Company Secretary Date: May 22, 2013
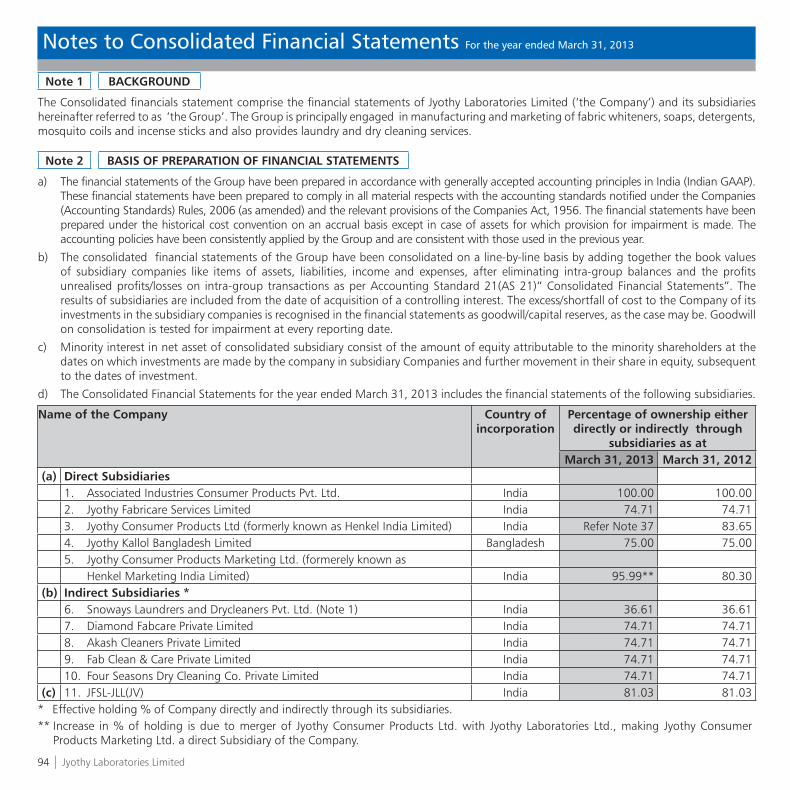
94 | Jyothy Laboratories Limited
Notes to Consolidated Financial Statements For the year ended March 31, 2013
Note 1 BACKGROUND
The Consolidated financials statement comprise the financial statements of Jyothy Laboratories Limited (‘the Company’) and its subsidiaries hereinafter referred to as ‘the Group’. The Group is principally engaged in manufacturing and marketing of fabric whiteners, soaps, detergents, mosquito coils and incense sticks and also provides laundry and dry cleaning services.
Note 2 BASIS OF PREPARATION OF FINANCIAL STATEMENTS
a) The financial statements of the Group have been prepared in accordance with generally accepted accounting principles in India (Indian GAAP). These financial statements have been prepared to comply in all material respects with the accounting standards notified under the Companies (Accounting Standards) Rules, 2006 (as amended) and the relevant provisions of the Companies Act, 1956. The financial statements have been prepared under the historical cost convention on an accrual basis except in case of assets for which provision for impairment is made. The accounting policies have been consistently applied by the Group and are consistent with those used in the previous year.
b) The consolidated financial statements of the Group have been consolidated on a line-by-line basis by adding together the book values of subsidiary companies like items of assets, liabilities, income and expenses, after eliminating intra-group balances and the profits unrealised profits/losses on intra-group transactions as per Accounting Standard 21(AS 21)“ Consolidated Financial Statements”. The results of subsidiaries are included from the date of acquisition of a controlling interest. The excess/shortfall of cost to the Company of its investments in the subsidiary companies is recognised in the financial statements as goodwill/capital reserves, as the case may be. Goodwill on consolidation is tested for impairment at every reporting date.
c) Minority interest in net asset of consolidated subsidiary consist of the amount of equity attributable to the minority shareholders at the dates on which investments are made by the company in subsidiary Companies and further movement in their share in equity, subsequent to the dates of investment.
d) The Consolidated Financial Statements for the year ended March 31, 2013 includes the financial statements of the following subsidiaries.
Name of the Company Country of incorporation
Percentage of ownership either directly or indirectly through
subsidiaries as atMarch 31, 2013 March 31, 2012
(a) Direct Subsidiaries1. Associated Industries Consumer Products Pvt. Ltd. India 100.00 100.002. Jyothy Fabricare Services Limited India 74.71 74.713. Jyothy Consumer Products Ltd (formerly known as Henkel India Limited) India Refer Note 37 83.654. Jyothy Kallol Bangladesh Limited Bangladesh 75.00 75.005. Jyothy Consumer Products Marketing Ltd. (formerely known as
Henkel Marketing India Limited) India 95.99** 80.30(b) Indirect Subsidiaries *
6. Snoways Laundrers and Drycleaners Pvt. Ltd. (Note 1) India 36.61 36.617. Diamond Fabcare Private Limited India 74.71 74.718. Akash Cleaners Private Limited India 74.71 74.719. Fab Clean & Care Private Limited India 74.71 74.7110. Four Seasons Dry Cleaning Co. Private Limited India 74.71 74.71
(c) 11. JFSL-JLL(JV) India 81.03 81.03* Effective holding % of Company directly and indirectly through its subsidiaries.** Increase in % of holding is due to merger of Jyothy Consumer Products Ltd. with Jyothy Laboratories Ltd., making Jyothy Consumer
Products Marketing Ltd. a direct Subsidiary of the Company.

Annual Report 2012-13 | 95
Notes to Consolidated Financial Statements For the year ended March 31, 2013
Note 2 BASIS OF PREPARATION OF FINANCIAL STATEMENTS (Contd.)
Note :
1. Jyothy Fabricare Services Limited has 49% share in Snoways Laundrers & Drycleaners Pvt. Ltd. and has entered into agreement which enable it to control the composition of the Board of Directors of the latter, making it a subsidiary company of Jyothy Fabricare Services Limited.
Note 3 SUMMARY OF SIGNIFICANT ACCOUNTING POLICIES
The significant accounting policies adopted by the Group, in respect of the consolidated financial statements are as follows:a) Use of estimates The preparation of financial statements, in conformity with Indian GAAP requires management to make judgments, estimates and assumptions
that affect the reported amounts of revenues , expenses ,assets, liabilities and disclosure of contingent liabilities at the end of the reporting period. Although these estimates are based upon management’s best knowledge of current events and actions, uncertainty about these assumptions and estimates could result in the outcomes requiring a material adjustment to the carrying amounts of assets or liabilities in future periods.
b) Tangible fixed assets Fixed assets are stated at cost, less accumulated depreciation amortisation and impairment losses if any. Cost comprises the purchase price
and any directly attributable cost of bringing the asset to its working condition for its intended use. Gains or losses arising from derecognition of tangible assets are measured as the difference between the net disposal proceeds and the
carrying amount of the asset and are recognized in the statement of profit and loss when the asset is derecognized.c) Intangible assets Intangible assets acquired separately are measured on initial recognition at cost. Following initial recognition, intangible assets are carried
at cost less accumulated amortization and accumulated impairment losses, if any. Intangible assets are amortized on a straight line basis over the estimated useful economic life. The Group uses a rebuttable presumption that the useful life of an intangible asset will not exceed ten years from the date when the asset is available for use.
Gains or losses arising from derecognition of an intangible asset are measured as the difference between the net disposal proceeds and the carrying amount of the asset and are recognized in the statement of profit and loss when the asset is derecognized.
d) Depreciation and amortisation Depreciation is provided using the Straight Line Method as per the useful lives of the assets estimated by the management, or at the rates
prescribed under schedule XIV of the Companies Act, 1956 whichever is higher.
The estimated useful life of the assets is as follows:
Category Estimated useful life (in years)Factory Buildings 10-30Building (Other than Factory Building) 10-60Plant and machinery 13-21Furniture and fixtures 5-16Leasehold Improvements - Outlets on lease 3 - Others 9Dies and moulds 3Computers 6Office equipment’s 5-21Vehicles 6-10Know-how 3-5Trademarks and Copyrights 9-10Software’s and Licences 5-10
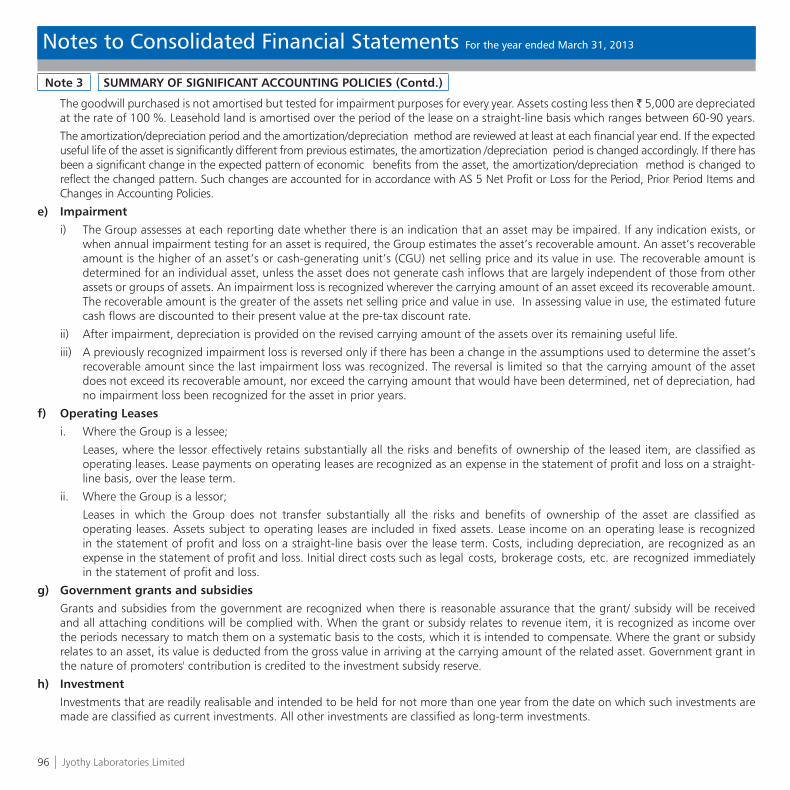
96 | Jyothy Laboratories Limited
Notes to Consolidated Financial Statements For the year ended March 31, 2013
Note 3 SUMMARY OF SIGNIFICANT ACCOUNTING POLICIES (Contd.)
The goodwill purchased is not amortised but tested for impairment purposes for every year. Assets costing less then ̀ 5,000 are depreciated at the rate of 100 %. Leasehold land is amortised over the period of the lease on a straight-line basis which ranges between 60-90 years.
The amortization/depreciation period and the amortization/depreciation method are reviewed at least at each financial year end. If the expected useful life of the asset is significantly different from previous estimates, the amortization /depreciation period is changed accordingly. If there has been a significant change in the expected pattern of economic benefits from the asset, the amortization/depreciation method is changed to reflect the changed pattern. Such changes are accounted for in accordance with AS 5 Net Profit or Loss for the Period, Prior Period Items and Changes in Accounting Policies.
e) Impairmenti) The Group assesses at each reporting date whether there is an indication that an asset may be impaired. If any indication exists, or
when annual impairment testing for an asset is required, the Group estimates the asset’s recoverable amount. An asset’s recoverable amount is the higher of an asset’s or cash-generating unit’s (CGU) net selling price and its value in use. The recoverable amount is determined for an individual asset, unless the asset does not generate cash inflows that are largely independent of those from other assets or groups of assets. An impairment loss is recognized wherever the carrying amount of an asset exceed its recoverable amount. The recoverable amount is the greater of the assets net selling price and value in use. In assessing value in use, the estimated future cash flows are discounted to their present value at the pre-tax discount rate.
ii) After impairment, depreciation is provided on the revised carrying amount of the assets over its remaining useful life.
iii) A previously recognized impairment loss is reversed only if there has been a change in the assumptions used to determine the asset’s recoverable amount since the last impairment loss was recognized. The reversal is limited so that the carrying amount of the asset does not exceed its recoverable amount, nor exceed the carrying amount that would have been determined, net of depreciation, had no impairment loss been recognized for the asset in prior years.
f) Operating Leases
i. Where the Group is a lessee;
Leases, where the lessor effectively retains substantially all the risks and benefits of ownership of the leased item, are classified as operating leases. Lease payments on operating leases are recognized as an expense in the statement of profit and loss on a straight-line basis, over the lease term.
ii. Where the Group is a lessor;
Leases in which the Group does not transfer substantially all the risks and benefits of ownership of the asset are classified as operating leases. Assets subject to operating leases are included in fixed assets. Lease income on an operating lease is recognized in the statement of profit and loss on a straight-line basis over the lease term. Costs, including depreciation, are recognized as an expense in the statement of profit and loss. Initial direct costs such as legal costs, brokerage costs, etc. are recognized immediately in the statement of profit and loss.
g) Government grants and subsidies Grants and subsidies from the government are recognized when there is reasonable assurance that the grant/ subsidy will be received
and all attaching conditions will be complied with. When the grant or subsidy relates to revenue item, it is recognized as income over the periods necessary to match them on a systematic basis to the costs, which it is intended to compensate. Where the grant or subsidy relates to an asset, its value is deducted from the gross value in arriving at the carrying amount of the related asset. Government grant in the nature of promoters' contribution is credited to the investment subsidy reserve.
h) Investment Investments that are readily realisable and intended to be held for not more than one year from the date on which such investments are
made are classified as current investments. All other investments are classified as long-term investments.

Annual Report 2012-13 | 97
Notes to Consolidated Financial Statements For the year ended March 31, 2013
Note 3 SUMMARY OF SIGNIFICANT ACCOUNTING POLICIES (Contd.)
On initial recognition, all investments are measured at cost. The cost comprises purchase price and directly attributable acquisition charges such as brokerage, fees and duties and other costs that arise on acquisition of investment.
Current investments are carried at lower of cost and fair value determined on an individual investment basis. Long-term investments are carried at cost. However, provision for diminution in value is made to recognise a decline other than temporary in the value of the investments.
An investment in land or building, which is not intended to be occupied substantially for use by, or in the operations of the Group is classified as investment property. Investment properties are stated at cost, net of accumulated depreciation and impairment losses, if any.
i) Inventories Inventories of raw materials, packing materials, work-in-progress, finished goods, operating supplies, stores and consumables items are
valued at cost or net realizable value, whichever is lower. However, materials and other items held for use in the production of inventories are not written down below cost if the finished products in which they will be incorporated are expected to be sold at or above cost.
Cost is ascertained on First-in-First out ('FIFO') basis and includes all applicable costs incurred in bringing goods to their present location and condition. Cost of work in progress, manufactured packing material and finished goods includes materials and all applicable manufacturing overheads. The Group accrues for excise duty liability in respect of manufactured finished goods/intermediary inventories lying in the factory.
Traded goods are valued at lower of cost and net realizable value. Cost includes cost of purchase and other costs incurred in bringing the inventories to their present location and condition. Cost is determined on a FIFO basis.
Operating supplies are items in circulation. Cost is ascertained on First-in-First out (‘FIFO’) basis and includes all applicable cost incurred in bringing goods to their present location and then written off over their estimated period of usage.
Net realisable value is the estimated selling price in the ordinary course of business, less estimated cost of completion and estimated cost necessary to make the sale.
j) Revenue recognition Revenue is recognised to the extent that it is probable that the economic benefits will flow to the Group and the revenue can be reliably
measured. The following specific criteria must also be met before revenue is recognised;
Sale of Goods :
Revenue is recognised when the significant risks and rewards of ownership of the goods have passed to the buyer, usually on delivery of the goods. Excise Duty, Sales Tax and VAT deducted from turnover (gross) is the amount that is included in the amount of turnover (gross) and not the entire amount of liability arising during the year. The Group collects sales taxes and value added taxes (VAT) on behalf of the government and, therefore, these are not economic benefits flowing to the Group. Hence, they are excluded from revenue. Revenue includes the amount of excise duty refund received / due in accordance with incentive scheme. Revenue is net of trade discount given.
Sale of Services :
Service revenue is recognised on completion of services and where no significant uncertainty exists regarding the amount of the consideration that will be derived from rendering the service. Service revenue are net of service tax.
Interest :
Revenue is recognised on a time proportion basis taking into account the amount outstanding and the rate applicable.
k) Foreign currency translation(i) Initial Recognition
Foreign currency transactions are recorded in the reporting currency, by applying to the foreign currency amount the exchange rate between the reporting currency and the foreign currency at the date of the transaction.

98 | Jyothy Laboratories Limited
Notes to Consolidated Financial Statements For the year ended March 31, 2013
Note 3 SUMMARY OF SIGNIFICANT ACCOUNTING POLICIES (Contd.)
(ii) Conversion
Foreign currency monetary items are reported using the exchange rate prevailing at the reporting date. Non-monetary items which are carried in terms of historical cost denominated in a foreign currency are reported using the exchange rate at the date of the transaction.
(iii) Exchange Differences
Exchange differences arising on the settlement of monetary items or on reporting monetary items at rates different from those at which they were initially recorded during the year, or reported in previous financial statements, are recognised as income or as expenses in the year in which they arise.
l) Retirement and other employee benefitsi) Retirement benefit in the form of provident fund and super annuation fund is a defined contribution scheme. The Group has no
obligation, other than the contribution payable to the respective fund. The Group recognizes contribution payable to the provident fund/ super annuation scheme as an expenditure, when an employee renders the related service.
ii) Gratuity liability is defined benefit obligation and is provided for on the basis of an actuarial valuation on projected unit credit method made at the end of each financial year.
iii) Accumulated leave, which is expected to be utilized within the next 12 months, is treated as short-term employee benefit.
The Group measures the expected cost of such absences as the additional amount that it expects to pay as a result of the unused entitlement that has accumulated at the reporting date.
iv) The Group treats accumulated leave expected to be carried forward beyond twelve months, as long-term employee benefit for measurement purposes. Such long-term compensated absences are provided for based on the actuarial valuation using the projected unit credit method at the year-end.
v) Actuarial gains/losses are immediately taken to the statement of profit and loss and are not deferred.
m) Sales promotion items Sales promotion items are valued at cost. Cost is ascertained on First-in-First out ('FIFO') basis and includes all applicable costs incurred in
bringing goods to their present location and condition.
n) Income-tax Tax expense comprises of current and deferred tax. Current income tax is measured at the amount expected to be paid to the tax
authorities in accordance with the Indian Income Tax Act. Deferred income taxes reflects the impact of current year timing differences between taxable income and accounting income for the year and reversal of timing differences of earlier years.
Deferred tax is measured based on the tax rates and the tax laws enacted or substantively enacted at the balance sheet date. Deferred tax assets are recognised only to the extent that there is reasonable certainty that sufficient future taxable income will be available against which such deferred tax assets can be realised. In situations of unabsorbed depreciation or carry forward tax losses, all deferred tax assets are recognised only if there is virtual certainty supported by convincing evidence that they can be realised against future taxable profits.
At each balance sheet date unrecognised deferred tax assets are re-assessed. It recognises unrecognised deferred tax assets to the extent that it has become reasonably certain or virtually certain, as the case may be that sufficient future taxable income will be available against which such deferred tax assets can be realised.
The carrying amount of deferred tax assets are reviewed at each balance sheet date. Write-down of the carrying amount of a deferred tax asset is done to the extent that it is no longer reasonably certain or virtually certain, as the case may be, that sufficient future taxable income will be available against which deferred tax asset can be realised. Any such write-down is reversed to the extent that it becomes reasonably certain or virtually certain, as the case may be, that sufficient future taxable income will be available.
Minimum Alternative Tax (MAT) credit is recognised as an asset only when and to the extent there is convincing evidence that normal income tax will be paid during the specified period. In the year in which the MAT credit becomes eligible to be recognized as an asset

Annual Report 2012-13 | 99
Notes to Consolidated Financial Statements For the year ended March 31, 2013
Note 3 SUMMARY OF SIGNIFICANT ACCOUNTING POLICIES (Contd.) in accordance with the Guidance Note on Accounting for credit available in respect of Minimum Alternate Tax under the Income Tax
Act, 1961, the said asset is created by way of a credit to the statement profit and loss and shown as MAT Credit Entitlement. MAT credit entitlement is reviewed at each balance sheet date and is written down to the extent there is no longer convincing evidence to the effect that normal Income Tax will be paid during the specified period.
o) Provisions A provision is recognised when there is a present obligation as a result of past event; it is probable that an outflow of resources will be
required to settle the obligation, in respect of which a reliable estimate can be made. Provisions are not discounted to its present value and are determined based on best estimate required to settle the obligation at the balance sheet date. These are reviewed at each balance sheet date and adjusted to reflect the current best estimates.
p) Excise duty Excise duty on turnover is reduced from turnover. Excise duty relating to the difference between the opening stock and closing stock is
recognised as income/expense as the case may be, separately in the statement of profit and loss.q) Segment Reporting
Identification of segments: The Group’s operating businesses are organized and managed separately according to the nature of products, with each segment
representing a strategic business unit that offers different products and serves different markets. The analysis of geographical segments is based on the areas in which major operating divisions of the Group operate.Segment accounting policies :
The Group prepares its segment information in conformity with the accounting policies adopted for preparing and presenting the financial statements of the Group as a whole.Intersegment transfer :The Group generally accounts for inter segment sales and transfers as if the sales or transfer were to third parties at market price.Allocation of common costs:
Common allocable costs are allocated to each segment according to the relative contribution of each segment to the total common costs.Unallocated items:It includes general corporate income and expense items which are not allocated to any business segment.
r) Earnings per Share Basic earnings per share are calculated by dividing the net profit or loss for the year attributable to equity shareholders by the weighted
average number of equity shares outstanding during the year. The weighted average number of equity shares outstanding during the year are adjusted for event of bonus issue, bonus element in a rights issue to existing shareholders, share split, and reverse share split that have changed the number of equity shares outstanding, without a corresponding change in resources.
For the purpose of calculating diluted earnings per share, the net profit or loss for the year attributable to equity shareholders and the weighted average number of shares outstanding during the year are adjusted for the effects of all dilutive potential equity shares.
s) Cash and Cash equivalents Cash and cash equivalents for the purpose of cash flow statement comprise cash at bank and in hand and short-term investments with an
original maturity of three months or less.t) Borrowing Costs Borrowing costs consist of interest and amortisation of ancillary costs incurred in connection with the arrangement of borrowings.
Borrowing costs directly attributable to the acquisition, construction or production of an asset that necessarily takes a substantial period of time to get ready for its intended use or sale are capitalized as part of the respective asset. All other borrowing costs are expensed in the period they occur.
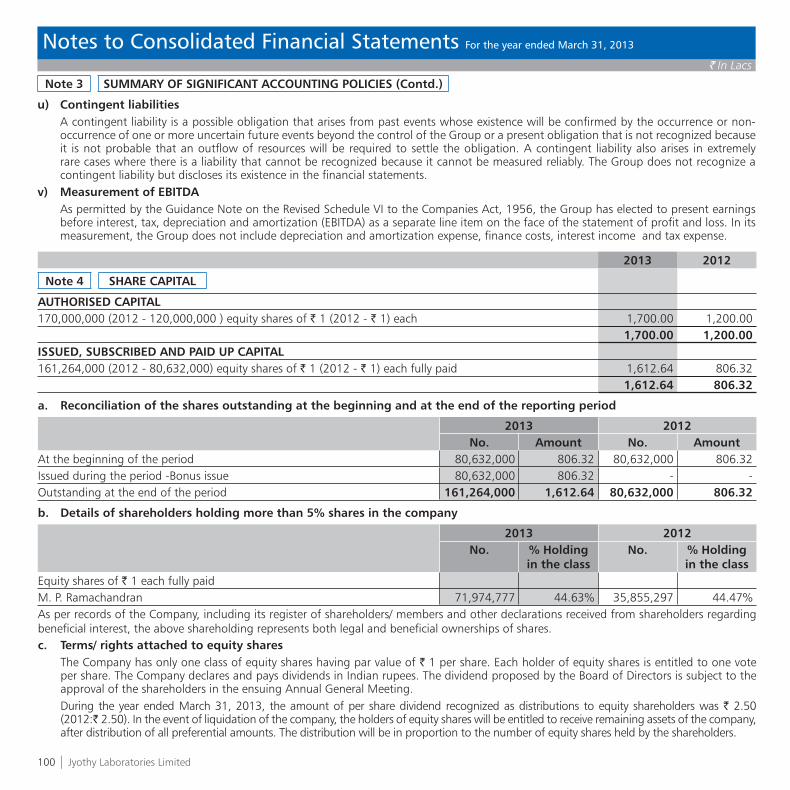
100 | Jyothy Laboratories Limited
` In Lacs
Notes to Consolidated Financial Statements For the year ended March 31, 2013
Note 3 SUMMARY OF SIGNIFICANT ACCOUNTING POLICIES (Contd.)
u) Contingent liabilities A contingent liability is a possible obligation that arises from past events whose existence will be confirmed by the occurrence or non-
occurrence of one or more uncertain future events beyond the control of the Group or a present obligation that is not recognized because it is not probable that an outflow of resources will be required to settle the obligation. A contingent liability also arises in extremely rare cases where there is a liability that cannot be recognized because it cannot be measured reliably. The Group does not recognize a contingent liability but discloses its existence in the financial statements.
v) Measurement of EBITDA As permitted by the Guidance Note on the Revised Schedule VI to the Companies Act, 1956, the Group has elected to present earnings
before interest, tax, depreciation and amortization (EBITDA) as a separate line item on the face of the statement of profit and loss. In its measurement, the Group does not include depreciation and amortization expense, finance costs, interest income and tax expense.
2013 2012
Note 4 SHARE CAPITAL
AUTHORISED CAPITAL170,000,000 (2012 - 120,000,000 ) equity shares of ` 1 (2012 - ` 1) each 1,700.00 1,200.00
1,700.00 1,200.00 ISSUED, SUBSCRIBED AND PAID UP CAPITAL161,264,000 (2012 - 80,632,000) equity shares of ` 1 (2012 - ` 1) each fully paid 1,612.64 806.32
1,612.64 806.32
a. Reconciliation of the shares outstanding at the beginning and at the end of the reporting period
2013 2012No. Amount No. Amount
At the beginning of the period 80,632,000 806.32 80,632,000 806.32 Issued during the period -Bonus issue 80,632,000 806.32 - - Outstanding at the end of the period 161,264,000 1,612.64 80,632,000 806.32
b. Details of shareholders holding more than 5% shares in the company
2013 2012No. % Holding
in the classNo. % Holding
in the classEquity shares of ` 1 each fully paidM. P. Ramachandran 71,974,777 44.63% 35,855,297 44.47%As per records of the Company, including its register of shareholders/ members and other declarations received from shareholders regarding beneficial interest, the above shareholding represents both legal and beneficial ownerships of shares.c. Terms/ rights attached to equity shares The Company has only one class of equity shares having par value of ` 1 per share. Each holder of equity shares is entitled to one vote
per share. The Company declares and pays dividends in Indian rupees. The dividend proposed by the Board of Directors is subject to the approval of the shareholders in the ensuing Annual General Meeting.
During the year ended March 31, 2013, the amount of per share dividend recognized as distributions to equity shareholders was ` 2.50 (2012:` 2.50). In the event of liquidation of the company, the holders of equity shares will be entitled to receive remaining assets of the company, after distribution of all preferential amounts. The distribution will be in proportion to the number of equity shares held by the shareholders.
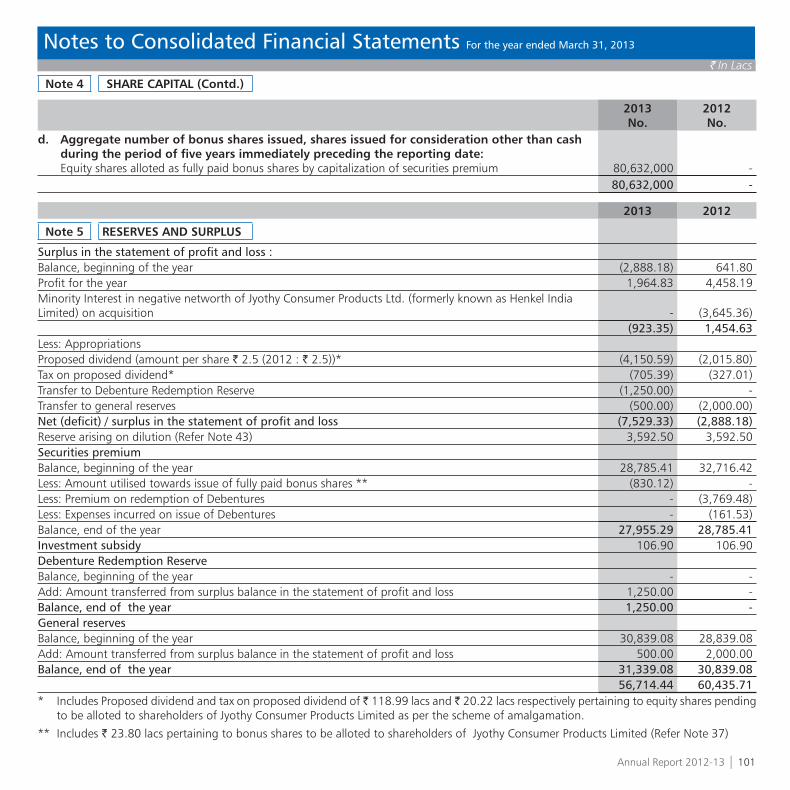
Annual Report 2012-13 | 101
` In Lacs
Notes to Consolidated Financial Statements For the year ended March 31, 2013
Note 4 SHARE CAPITAL (Contd.)
2013No.
2012No.
d. Aggregate number of bonus shares issued, shares issued for consideration other than cash during the period of five years immediately preceding the reporting date:Equity shares alloted as fully paid bonus shares by capitalization of securities premium 80,632,000 -
80,632,000 -
2013 2012
Note 5 RESERVES AND SURPLUS
Surplus in the statement of profit and loss :Balance, beginning of the year (2,888.18) 641.80 Profit for the year 1,964.83 4,458.19 Minority Interest in negative networth of Jyothy Consumer Products Ltd. (formerly known as Henkel India Limited) on acquisition - (3,645.36)
(923.35) 1,454.63 Less: AppropriationsProposed dividend (amount per share ` 2.5 (2012 : ` 2.5))* (4,150.59) (2,015.80)Tax on proposed dividend* (705.39) (327.01)Transfer to Debenture Redemption Reserve (1,250.00) - Transfer to general reserves (500.00) (2,000.00)Net (deficit) / surplus in the statement of profit and loss (7,529.33) (2,888.18)Reserve arising on dilution (Refer Note 43) 3,592.50 3,592.50 Securities premiumBalance, beginning of the year 28,785.41 32,716.42 Less: Amount utilised towards issue of fully paid bonus shares ** (830.12) - Less: Premium on redemption of Debentures - (3,769.48)Less: Expenses incurred on issue of Debentures - (161.53)Balance, end of the year 27,955.29 28,785.41 Investment subsidy 106.90 106.90 Debenture Redemption ReserveBalance, beginning of the year - - Add: Amount transferred from surplus balance in the statement of profit and loss 1,250.00 - Balance, end of the year 1,250.00 - General reservesBalance, beginning of the year 30,839.08 28,839.08 Add: Amount transferred from surplus balance in the statement of profit and loss 500.00 2,000.00 Balance, end of the year 31,339.08 30,839.08
56,714.44 60,435.71 * Includes Proposed dividend and tax on proposed dividend of ̀ 118.99 lacs and ̀ 20.22 lacs respectively pertaining to equity shares pending
to be alloted to shareholders of Jyothy Consumer Products Limited as per the scheme of amalgamation.
** Includes ` 23.80 lacs pertaining to bonus shares to be alloted to shareholders of Jyothy Consumer Products Limited (Refer Note 37)

102 | Jyothy Laboratories Limited
` In Lacs
Notes to Consolidated Financial Statements For the year ended March 31, 2013
Note 6 LONG-TERM BORROWINGS
NON CURRENT CURRENT2013 2012 2013 2012
Term loans from Bank (secured) 37,500.42 43,794.47 7,397.14 420.00 10.25% Secured Redeemable Non Convertible Debentures 5,000.00 - - - Deferred sales tax loan (Unsecured) - - 17.45 17.45 Amount disclosed under ‘Other Current Liabilities’ (Note 12) - - (7,414.59) (437.45)
42,500.42 43,794.47 - - Details of loana) Term Loan of ` 43,000 (2012 : ` 43,000) has been taken from Banks during the financial year 2011-12 and carries interest @ 11.25% p.a
payable monthly. Interest rate is fixed for the period of one year and floating thereafter. Term loan to be repaid in 16 quarterly installment starting from June 30, 2013. The term loan is secured against first charge on the all immovable properties, trademarks of Maxo and Exo, all the rights, title, interest, benefits, claims and demands of the Company in respect of all document,agreements,contracts, clearance, insurance contract entered both present and future and all rights, claims and benefits to all monies receivable thereunder and all other claims thereunder which description shall include all properties of the above whether presently in existence or acquired hereafter and second charge on all the inventories, current assets, all monies, securities, contractor guarantees, performance bonds, cash flows and receivables, revenues, bank accounts together with investment, fixed deposits and book debts, stock in trade and all the properties mentioned above.
b) Term loan from bank of ̀ 482.09 (2012 : ̀ 793.27) was taken during the financial year 2009-10 and carries interest rate of 0.75 % below BPLR or a minimum 11.25% p.a. The loan is repayable in monthy installments of ` 25.00 each along with interest from 1 July, 2010. This is secured by mortgage of leased land & building of Jyothy Fabricare Services Limited situated at Doddaballapura, Bangalore.
c) Term loan of ` 312 (2012 : 432) is repayable in 60 monthly installment along with interest from May 10, 2010. Term Loan is secured by hypothecation of plant & machinery & all movables present & future of Diamond Fabcare Private Limited subject to prior charge in favour of the bankers on stock of stores and books debts for working capital limits and further secured by Corporate Guarantee given by the Company.
d) Term loan of ` 1,103.47 (2012 : Nil) from Axis bank has been taken during the year. The loan is repayable in 32 quarterly installment beginning from August 2013. The loan is secured by Exclusive first charge on the entire fixed assets and current assets of the JFSL-JLL (JV) and further secured by corporate guarantee given by the Company.
e) 10.25% Debenture are redeemable at par at the end of 3 years and 7 days from the date of allotment i.e. November 7, 2012. The Debenture are secured by first charge on all moveable fixed assets, property and fixtures, movable plant and machinery and all other equipment of the Company.
f) Deferred sales tax loan is interest free and is due for payment.
2013 2012
Note 7 DEFERRED TAX LIABILITIES, (NET)
a) Deferred tax liabilityDepreciation 3,486.03 2,314.26 Gross Deferred tax liability 3,486.03 2,314.26
b) Deferred tax assetsTechnical royalty 2.77 2.82 Provision for gratuity 332.36 220.58 Provision for doubtful debts 81.56 28.11

Annual Report 2012-13 | 103
` In Lacs
Notes to Consolidated Financial Statements For the year ended March 31, 2013
2013 2012
Note 7 DEFERRED TAX LIABILITIES, (NET) (Contd.)
Provision for doubtful advances 476.25 16.99 Provision for leave encashment 192.00 127.19 Provision for impairment losses 140.62 160.07 On carry forward loss and unabsorbed depreciation 2,138.27 118.23 Other disallowances 30.86 30.11 Gross Deferred tax assets 3,394.69 704.10 Net Deferred tax liabilities 91.34 1,610.16
NON CURRENT CURRENT2013 2012 2013 2012
Note 8 OTHER LONG-TERM LIABILITIES
Deferred Payment Liability (Unsecured) 180.00 270.00 180.00 90.00 Amount Disclosed under ‘Other Current Liabilities’ (Note 12) - - (180.00) (90.00)
180.00 270.00 - -
NON CURRENT CURRENT2013 2012 2013 2012
Note 9 PROVISIONS
Provision for employee benefitsProvision for leave encashment 26.68 29.08 589.84 382.89 Provision for gratuity (Note 28) 994.98 802.10 11.97 21.31 Provision for bonus - - - 4.86
1,021.66 831.18 601.81 409.06Other provisionsProvision for wealth tax - - 4.13 3.00 Provision for income tax (net of advance tax) - - 32.96 116.65 Provision for contingencies - - 2,175.59 - Proposed dividend - - 4,150.59 2,015.80 Tax on proposed dividend - - 705.39 327.01
- - 7,068.66 2,462.46 1,021.66 831.18 7,670.47 2,871.52
Provision for contingencies:During the year, management has reviewed all the excise and VAT cases pending at various levels and accordingly believes that outflow of resourses embodying economics benefits is probable for certain cases and the estimated amount of outflow is ` 2,175.59 lacs.

104 | Jyothy Laboratories Limited
` In Lacs
Notes to Consolidated Financial Statements For the year ended March 31, 2013
2013 2012
Note 10 SHORT-TERM BORROWINGS
Short term loan from bank (Secured) - 2,000.00 Bank overdraft (Secured) 6,267.27 7,866.84 Commercial Paper (Unsecured) 6,411.20 2,500.00
12,678.47 12,366.84 Details of loan(a) Short term loan and bank overdraft carries interest @ 11.25% and 11.50-15.00% p.a respectively payable monthly and is repayable on demand.
For details of securities refer note 6(a).(b) Commercial paper issued 800 units of face value of ` 5 lacs each, maturing on May 3, 2013.(c) Commercial paper issued 500 units of face value of ` 5 lacs each, maturing on June 24, 2013.
2013 2012
Note 11 TRADE PAYABLES
Micro, Small and Medium Enterprises (Refer Note 42) 3,068.39 3,097.72 Other trade payable 4,194.74 4,188.19 Accrual for expenses 5,084.85 8,165.53
12,347.98 15,451.44
Note 12 OTHER CURRENT LIABILITIES
Interest accrued but not due on loans 614.45 10.80 Statutory Dues 1,371.74 1,407.96 Unclaimed dividend * 7.85 6.72 Security deposits 341.69 415.96 Advances from customers 1,121.31 437.51 Current maturities of deferred payment liability (Note 8) 180.00 90.00 Current maturities of loan (Note 6) 7,414.59 437.45 Other liabilities 39.53 21.02
11,091.16 2,827.42* There are no amounts payable / due to be credited to Investor Education and Protection Fund.

Annual Report 2012-13 | 105
` In lacs
Notes to Consolidated Financial Statements For the year ended March 31, 2013
Note 13 FIXED ASSETS Gross Block Depreciation and Amortisation Impairment Net Block
Particulars As at April 1, 2012
Addition pursuant to acquisitionduring the previous
year (Refer Note 36)
Addition Deletions As at March 31, 2013
As at April 1, 2012
Addition pursuant to acquisitionduring the previous
year (Refer Note 36)
For the year
Deletions As at March 31,
2013
As at April 1, 2012
Charge For the year*
As at March 31,
2013
As at March 31,
2013
As at March 31,
2012
Intangible assetsGoodwill 70,601.17 - 5,504.12 - 76,105.29 373.54 - - - 373.54 51.50 - 51.50 75,680.25 70,176.13
589.30 17,944.13 52,067.74 - 70,601.17 149.54 224.00 - - 373.54 - 51.50 51.50 Trademarks and Copyrights$ 618.44 - - - 618.44 347.25 - 51.62 - 398.87 23.68 - 23.68 195.89 247.51
618.44 - - - 618.44 281.99 - 65.26 - 347.25 - 23.68 23.68 Know-how 647.12 - - - 647.12 335.45 - 120.00 - 455.45 - - - 191.67 311.67
647.12 - - - 647.12 211.69 - 123.76 - 335.45 - - - Software’s and Licences 260.80 - 60.50 - 321.30 69.19 - 42.59 - 111.78 - - - 209.52 191.61
138.28 28.04 94.48 - 260.80 19.56 11.83 37.80 - 69.19 - - - Total intangible assets 72,127.53 - 5,564.62 - 77,692.15 1,125.43 - 214.21 - 1,339.64 75.18 - 75.18 76,277.33 70,926.92
1,993.14 17,972.17 52,162.22 - 72,127.53 662.78 235.83 226.82 - 1,125.43 - 75.18 75.18 70,926.92 Tangible assets Freehold land ^ 3,692.52 - 1.45 - 3,693.97 - - - - - - - - 3,693.97 3,692.52
1,875.57 1,280.54 536.41 - 3,692.52 - - - - - - - - Leasehold land 390.74 - - - 390.74 26.58 - 3.99 - 30.57 - - - 360.17 364.16
372.09 18.65 - - 390.74 21.80 - 4.78 - 26.58 - - - Building# 14,730.66 - 295.49 - 15,026.15 2,532.98 - 416.95 - 2,949.93 - - - 12,076.22 12,197.68
13,266.46 1,158.15 400.71 94.66 14,730.66 1,825.97 313.56 421.57 28.12 2,532.98 - - - Plant and machinery @ 21,371.48 - 1,660.59 110.89 22,921.18 7,525.61 - 1,196.05 73.71 8,647.95 402.11 2,009.76 2,411.87 11,861.36 13,443.76
10,647.82 9,741.13 1,487.99 505.46 21,371.48 3,032.75 3,699.89 1,189.03 396.06 7,525.61 297.96 104.15 402.11 Dies and moulds 538.70 - 32.51 3.47 567.74 412.99 - 67.03 0.21 479.81 - - - 87.93 125.71
426.99 - 125.74 14.03 538.70 350.62 - 76.40 14.03 412.99 - - - Furniture and fixture 1,125.98 - 73.25 167.14 1,032.09 432.05 - 59.60 97.02 394.63 1.07 - 1.07 636.39 692.86
693.79 295.42 141.81 5.04 1,125.98 231.03 142.78 60.56 2.32 432.05 6.27 (5.20) 1.07 LeaseholdImprovements 473.40 - 32.90 - 506.30 268.19 - 86.94 - 355.13 - - - 151.17 205.21
90.83 276.69 105.88 - 473.40 34.13 140.75 93.31 - 268.19 - - - Office equipment’s 1,931.69 - 85.01 714.61 1,302.09 1,145.79 - 111.15 555.39 701.55 14.08 - 14.08 586.46 771.82
818.73 1,065.16 84.55 36.75 1,931.69 348.27 696.60 122.63 21.71 1,145.79 14.82 (0.74) 14.08 Vehicle 1,044.21 - 58.51 169.93 932.79 436.47 - 91.42 102.06 425.83 0.91 - 0.91 506.05 606.83
812.25 228.01 57.04 53.09 1,044.21 262.47 96.42 99.47 21.89 436.47 3.51 (2.60) 0.91 Total tangible assets 45,299.38 - 2,239.71 1,166.04 46,373.05 12,780.66 - 2,033.13 828.39 13,985.40 418.17 2,009.76 2,427.93 29,959.72 32,100.55
29,004.53 14,063.75 2,940.13 709.03 45,299.38 6,107.04 5,090.00 2,067.75 484.13 12,780.66 322.56 95.61 418.17 32,100.55 Total 117,426.91 - 7,804.33 1,166.04 124,065.20 13,906.09 - 2,247.34 828.39 15,325.04 493.35 2,009.76 2,503.11 106,237.05 103,027.47 Previous year 30,997.67 32,035.92 55,102.35 709.03 117,426.91 6,769.82 5,325.83 2,294.57 484.13 13,906.09 322.56 170.79 493.35 103,027.47
$ Includes trademarks and copyrights of ` 315.63 (2012 - ` 315.63) pending for registration in the name of the Company and ` 37.63 (2012 - ` 37.63) pending for registration in the name of the Jyothy Fabricare Services Limited.
# Includes ` 452.19 (2012 ` 452.19) represented by unquoted fully paid shares at cost in various co-operative societies. Further, also refer Note 32.
@ Addition in plant and machinery includes Salary and wages of ` 47.37 (2012 - ` Nil) and Power and Fuel ` 2.72 (2012 - ` Nil) pertaining to revenue expenses capitalised during the year.
* Impairment provision charge for the year includes ` 2014.24 shown as prior period adjustment, (Refer note 38). Previous year impairment provision charges includes impairment provision of ` 95.61 lacs and ` 75.18 lacs for the Pithampur washing powder and for the Goodwill, Trademark and Copyright of Ruby Brand respectively). The same is included in the soaps and detergent in Note 29.
^ Land title deed relating to freehold land of ` 536.41 (2012: ` 536.41) are pending for registration in the name of Jyothy Fabricare Services Limited. Refer note 37 for addition to Goodwill in the current year. Figures in italics are in respect of the previous year

106 | Jyothy Laboratories Limited
` In lacs
Notes to Consolidated Financial Statements For the year ended March 31, 2013
2013 2012
Note 14 NON CURRENT INVESTMENTS (at cost, unless stated otherwise)
Trade Investments (Unquoted)Henkel SPIC Employees Co-operative Thrift and Credit Society Limited2,000 (2012 - 2,000) equity shares of ` 100 (2012 - ` 100) each fully paid up 2.00 2.00 Capexil (Agencies) Ltd.*5 (2012 - 5) equity shares of ` 1,000 (2012 - ` 1,000) each fully paid up 0.05 0.05 Madras Industrial Cooperative Analytical Laboratory Limited*2 (2012 - 2) equity shares of ` 500 (2012 - ` 500) each fully paid up 0.01 0.01 Ambattur Industrial Estate Manufactures Service Industrial Cooperative Society Ltd.*1 (2012 - 1) equity shares of ` 100 (2012 - ` 100) each fully paid up 0.00 0.00
2.06 2.06 Less: *Provision for diminution in the value of investments (0.06) (0.06)
2.00 2.00 Non-Trade Investment (Unquoted)Investment in Government Securities Indira Vikas Patra 0.02 0.02 National Saving Certificates (Pledged with Government authorities) 0.57 0.57 Investment property 147.30 147.30
147.89 147.89 149.89 149.89
Aggregate amount of unquoted investments 149.89 149.89 Aggregate amount of quoted investments - - Market Value of quoted investments - -
NON-CURRENT CURRENT2013 2012 2013 2012
Note 15 LOANS AND ADVANCES
Unsecured, considered good unless otherwise stated Capital Advances 1,206.56 1,142.57 - - Inter corporate deposit to third parties - - 514.79 519.97 Advance to suppliers 426.47 426.47 2,495.85 2,008.61 Balance with excise and VAT authorities - - 1,355.76 551.07 MAT Credit entitlement 1,584.11 - - 699.11 Deposits 881.29 1,195.04 107.09 101.19 Balance with government authorities 4,351.24 2,424.30 99.26 988.82 Prepaid Expenses 1.17 - 432.38 299.12 Advance income tax (net of provision) 885.97 37.10 - 138.35 Other receivables 646.05 189.59 677.15 273.74 Less: Provisions for doubtful advances and deposits (184.27) (37.24) (1,249.41) (17.76)
9,798.59 5,377.83 4,432.87 5,562.22 Advance to Suppliers, Balance with excise and VAT authorities, Deposits, other receivables and Capital Advances include ` 338.59 (2012 - ` 1.25) ` 881.50 (2012 - ` NIL), ` 74.31 (2012 - ` 16.51) ` 102.08 (2012 - ` Nil) and ` 37.20 (2012 - ` 37.24) respectively, considered doubtful and fully provided for.

Annual Report 2012-13 | 107
` In lacs
Notes to Consolidated Financial Statements For the year ended March 31, 2013
NON-CURRENT CURRENT2013 2012 2013 2012
Note 16 OTHER ASSETS
Unsecured, considered goodInventory-Sales Promotions Items - - 461.46 366.09 Interest accrued but not due 11.82 - 30.65 27.36 Unbilled services - - - 18.00 Fixed deposit with Banks having maturity of more than 12 months (Refer Note 19) 145.33 186.09 - 2.97 Others - - - 14.73
157.15 186.09 492.11 429.15
2013 2012
Note 17 INVENTORIES (Valued at lower of cost or net realisable value)
Raw and packing materials (including goods in transit ` Nil (2012- ` 1.93)) 4,501.61 4,726.11 Work in progress 946.72 808.37 Finished goods manufactured 5,038.43 2,352.35 Traded Goods (including goods in transit ` 2.89 (2012- ` 45.78)) 6,243.28 3,555.58 Stores, Operating supplies and spare parts 483.92 434.29 Inventory for Capital Goods 2.92 321.14
17,216.88 12,197.84
2013 2012
Note 18 TRADE RECEIVABLES
Unsecureda) Outstanding for a period exceeding six months from the date they are due for payment
Considered good 920.42 26.58 Considered doubtful 1,031.06 1,013.64 Less: Provision for doubtful receivables (1,031.06) (1,013.64)
920.42 26.58 b) Other receivable, considered good 7,158.28 8,045.78
8,078.70 8,072.36
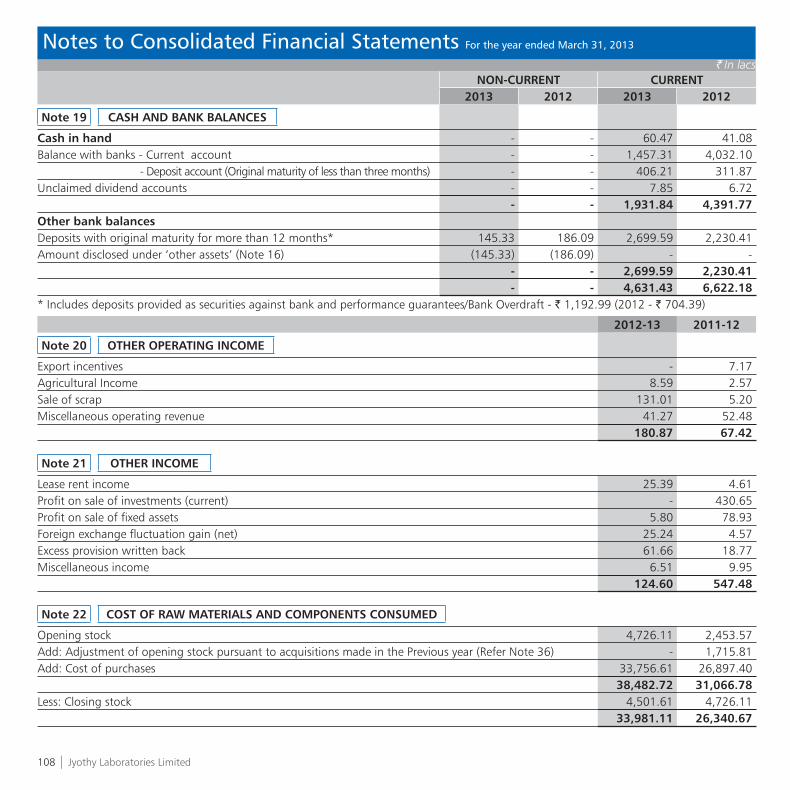
108 | Jyothy Laboratories Limited
` In lacsNON-CURRENT CURRENT
2013 2012 2013 2012
Note 19 CASH AND BANK BALANCES
Cash in hand - - 60.47 41.08 Balance with banks - Current account - - 1,457.31 4,032.10 - Deposit account (Original maturity of less than three months) - - 406.21 311.87 Unclaimed dividend accounts - - 7.85 6.72
- - 1,931.84 4,391.77 Other bank balancesDeposits with original maturity for more than 12 months* 145.33 186.09 2,699.59 2,230.41 Amount disclosed under ‘other assets’ (Note 16) (145.33) (186.09) - -
- - 2,699.59 2,230.41 - - 4,631.43 6,622.18
* Includes deposits provided as securities against bank and performance guarantees/Bank Overdraft - ` 1,192.99 (2012 - ` 704.39)
2012-13 2011-12
Note 20 OTHER OPERATING INCOME
Export incentives - 7.17 Agricultural Income 8.59 2.57 Sale of scrap 131.01 5.20 Miscellaneous operating revenue 41.27 52.48
180.87 67.42
Note 21 OTHER INCOME
Lease rent income 25.39 4.61 Profit on sale of investments (current) - 430.65 Profit on sale of fixed assets 5.80 78.93 Foreign exchange fluctuation gain (net) 25.24 4.57 Excess provision written back 61.66 18.77 Miscellaneous income 6.51 9.95
124.60 547.48
Note 22 COST OF RAW MATERIALS AND COMPONENTS CONSUMED
Opening stock 4,726.11 2,453.57 Add: Adjustment of opening stock pursuant to acquisitions made in the Previous year (Refer Note 36) - 1,715.81 Add: Cost of purchases 33,756.61 26,897.40
38,482.72 31,066.78 Less: Closing stock 4,501.61 4,726.11
33,981.11 26,340.67
Notes to Consolidated Financial Statements For the year ended March 31, 2013
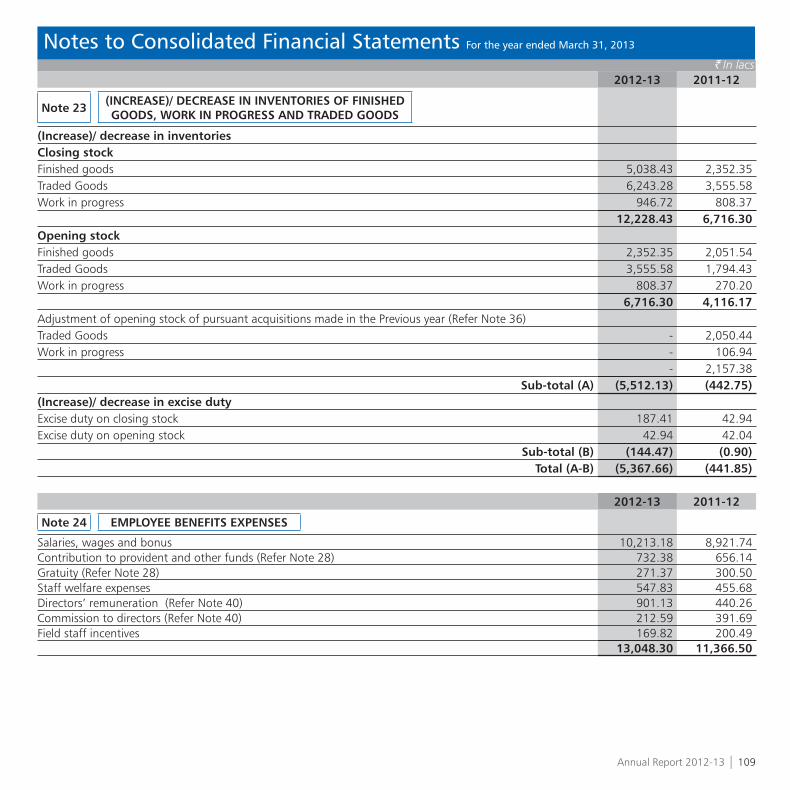
Annual Report 2012-13 | 109
` In lacs2012-13 2011-12
Note 23 (INCREASE)/ DECREASE IN INVENTORIES OF FINISHED GOODS, WORK IN PROGRESS AND TRADED GOODS
(Increase)/ decrease in inventoriesClosing stock Finished goods 5,038.43 2,352.35 Traded Goods 6,243.28 3,555.58 Work in progress 946.72 808.37
12,228.43 6,716.30 Opening stock Finished goods 2,352.35 2,051.54 Traded Goods 3,555.58 1,794.43 Work in progress 808.37 270.20
6,716.30 4,116.17 Adjustment of opening stock of pursuant acquisitions made in the Previous year (Refer Note 36)Traded Goods - 2,050.44 Work in progress - 106.94
- 2,157.38 Sub-total (A) (5,512.13) (442.75)
(Increase)/ decrease in excise dutyExcise duty on closing stock 187.41 42.94 Excise duty on opening stock 42.94 42.04
Sub-total (B) (144.47) (0.90)Total (A-B) (5,367.66) (441.85)
2012-13 2011-12
Note 24 EMPLOYEE BENEFITS EXPENSES
Salaries, wages and bonus 10,213.18 8,921.74 Contribution to provident and other funds (Refer Note 28) 732.38 656.14 Gratuity (Refer Note 28) 271.37 300.50 Staff welfare expenses 547.83 455.68 Directors’ remuneration (Refer Note 40) 901.13 440.26 Commission to directors (Refer Note 40) 212.59 391.69 Field staff incentives 169.82 200.49
13,048.30 11,366.50
Notes to Consolidated Financial Statements For the year ended March 31, 2013

110 | Jyothy Laboratories Limited
` In lacs2012-13 2011-12
Note 25 OTHER EXPENSES
Power and fuel expenses 2,890.00 2,321.08 Rent 1,468.90 1,173.51 Insurance 103.24 86.25 Repairs and maintenance - Building 97.43 71.72 - Plant and machinery 290.86 223.36 - Others 185.54 118.42 Consumption of stores and spares 197.56 330.85 Research and development 23.75 15.27 Excise duty 237.05 196.93 Printing and stationery 113.59 81.12 Communication costs 336.19 281.08 Legal and professional fees 1,123.44 868.19 Rates and taxes 576.41 432.34 Directors’ sitting fees 5.65 4.55 Vehicle maintenance 465.85 436.07 Donation 9.18 4.79 Loss on fixed assets discarded 33.03 173.77 Bad debt written off 4.64 0.44 Provision for doubtful debts 75.09 104.03 Provision for doubtful advances 58.58 55.00 Advertisement and publicity 5,620.80 3,399.05 Sales promotion and schemes 3,933.08 3,552.60 Carriage outwards 4,496.30 4,119.80 Field staff expenses 940.92 994.52 Travelling and conveyance 541.53 395.53 Brokerage on sales 589.52 670.38 Royalty 153.03 133.95 Miscellaneous expenses 1,574.29 980.85
26,145.45 21,225.45
2012-13 2011-12
Note 26 FINANCE COST
Interest expenses 5,951.79 2,026.94 Other Borrowing Cost 870.46 356.20
6,822.25 2,383.14
Notes to Consolidated Financial Statements For the year ended March 31, 2013

Annual Report 2012-13 | 111
` In lacs2012-13 2011-12
Note 27 INTEREST INCOME
Interest on fixed deposit 334.08 433.09 Interest on inter-corporate deposit 61.48 59.13 Interest earned on loans - 1,204.70
395.56 1,696.92
Notes to Consolidated Financial Statements For the year ended March 31, 2013
Note 28 EMPLOYEE BENEFIT
(i) Defined Benefit Plans - The Group has a defined benefit gratuity plan. Every employee who has completed five years or more of service gets a gratuity on departure at
15 days salary (last drawn salary) for each completed year of service. The scheme is funded with Life Insurance Corporation of India.
The following tables summarise the components of net benefit expense recognised in the Statement of profit and loss and the funded status and amounts recognised in the balance sheet for the respective plans.
2012-13 2011-12Gratuity Gratuity
Partly Funded Partly Funded(A) Summary of the Actuarial AssumptionsMortality LIC (1994-96) Ult LIC (1994-96) Ult
Discount rate 8.05%-8.30% 8.25%-8.50%Rate of increase in compensation 8%-8.15% 5%-8%Withdrawal rates 2%-10% 2%-10%Rate of return (expected) on plan assets 8%-10% 9%-9.3%
The estimates of future salary increases, considered in actuarial valuation take account of inflation, seniority, promotion and other relevant factors, such as supply and demand in the employment market.
The overall expected rate of return on assets is determined based on the market price prevailing on that date, applicable to the period over which the obligation is to be settled.
2012-13 2011-12(B) Changes in present value of obligations (PVO)
PVO at beginning of period 1,500.66 1,117.93 Opening balance adjustment pursuant to acquisition made in the previous year - 226.53 Interest cost 121.94 111.85 Current Service Cost 194.44 192.28 Benefits Paid (188.51) (206.85)Actuarial (gain) / loss on obligation 14.43 58.92 PVO at end of period 1,642.96 1,500.66

112 | Jyothy Laboratories Limited
` In lacs
Notes to Consolidated Financial Statements For the year ended March 31, 2013
2012-13 2011-12
Note 28 EMPLOYEE BENEFIT (Contd.)
(C) Changes in fair value of plan assetsFair value of plan assets at the beginning of period 677.25 642.40 Opening balance adjustment pursuant to acquisition made in the previous year - 191.51 Expected return on plan assets 58.17 69.54 Contributions 0.98 3.00 Benefit paid (101.66) (189.50)Actuarial gain / (loss) on plan assets 1.28 (39.70)Fair value of plan assets at end of period 636.02 677.25
(D) Net Assets/(Liabilities) recognised in the balance sheetPVO at end of period (1,642.96) (1,500.66)Fair value of plan assets at end of period 636.02 677.25 Funded status (deficit in fair value of plan assets over PVO) (1,006.94) (823.41)Net assets / (Liability) recognised in the balance sheet (1,006.94) (823.41)
(E) Expenses recognised in the statement of profit and loss Current service cost 194.44 192.28 Adjustment pursuant to acquisition made in the previous year - (32.71)Interest cost 121.94 111.85 Expected return on plan assets (58.17) (69.54)Net Actuarial (Gain)/Loss recognised for the period 13.16 98.62 Expense recognised in the statement of profit and loss 271.37 300.50
(F) The major categories of plan assets as a percentage of the fair value of total plan assets are as follows :Investment with insurer 100.00% 100.00%
(G) Amounts for the current and previous four periods are as follows:
April to March 2013
April to March 2012
April to March 2011
April to March 2010
July toMarch 2009
Defined benefit obligation 1,642.96 1,500.66 1,117.93 880.23 729.30 Plan assets 636.02 677.25 642.40 406.41 296.15 Surplus/ (Deficit) 1,006.94 823.41 475.53 473.82 433.15 Experience adjustments on plan liabilities 14.43 58.92 77.99 7.03 65.70 Experience adjustments on plan assets 1.28 (39.70) 8.49 4.01 12.43
(H) The Group expects to contribute ` Nil (2012 - ` Nil) to gratuity fund and ` 76.70 (2012 - ` 37.03) to Superannuation fund in the next year.
(ii) Defined Contribution Plans - Amount of ` 855.93 (2012 - ` 696.58) is recognised as an expense and included in Note 24 in the Statement of Profit and Loss.
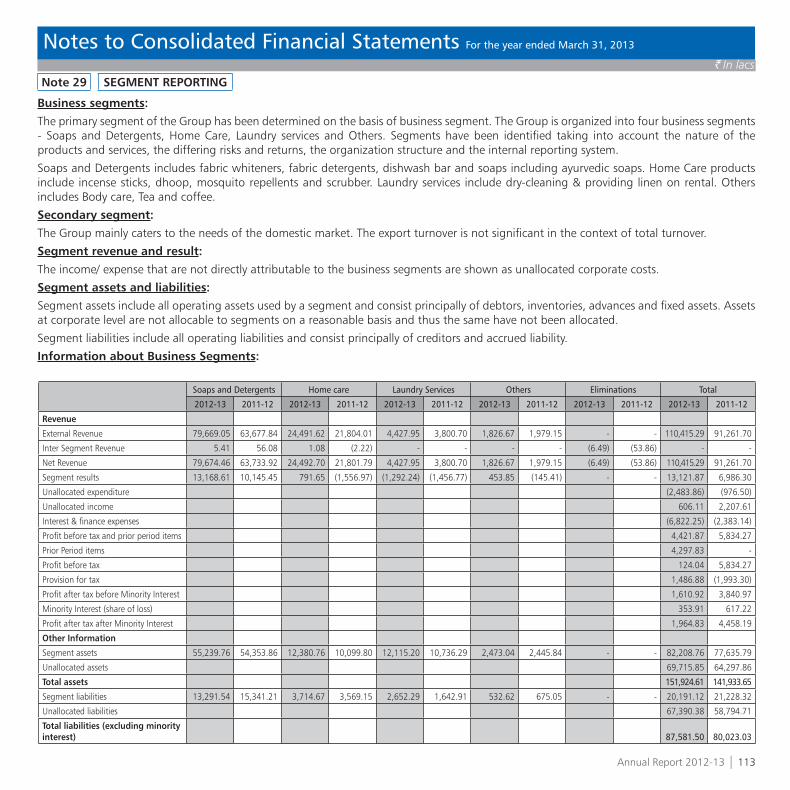
Annual Report 2012-13 | 113
` In lacs
Notes to Consolidated Financial Statements For the year ended March 31, 2013
Soaps and Detergents Home care Laundry Services Others Eliminations Total
2012-13 2011-12 2012-13 2011-12 2012-13 2011-12 2012-13 2011-12 2012-13 2011-12 2012-13 2011-12
Revenue
External Revenue 79,669.05 63,677.84 24,491.62 21,804.01 4,427.95 3,800.70 1,826.67 1,979.15 - - 110,415.29 91,261.70
Inter Segment Revenue 5.41 56.08 1.08 (2.22) - - - - (6.49) (53.86) - -
Net Revenue 79,674.46 63,733.92 24,492.70 21,801.79 4,427.95 3,800.70 1,826.67 1,979.15 (6.49) (53.86) 110,415.29 91,261.70
Segment results 13,168.61 10,145.45 791.65 (1,556.97) (1,292.24) (1,456.77) 453.85 (145.41) - - 13,121.87 6,986.30
Unallocated expenditure (2,483.86) (976.50)
Unallocated income 606.11 2,207.61
Interest & finance expenses (6,822.25) (2,383.14)
Profit before tax and prior period items 4,421.87 5,834.27
Prior Period items 4,297.83 -
Profit before tax 124.04 5,834.27
Provision for tax 1,486.88 (1,993.30)
Profit after tax before Minority Interest 1,610.92 3,840.97
Minority Interest (share of loss) 353.91 617.22
Profit after tax after Minority Interest 1,964.83 4,458.19
Other Information
Segment assets 55,239.76 54,353.86 12,380.76 10,099.80 12,115.20 10,736.29 2,473.04 2,445.84 - - 82,208.76 77,635.79
Unallocated assets 69,715.85 64,297.86
Total assets 151,924.61 141,933.65
Segment liabilities 13,291.54 15,341.21 3,714.67 3,569.15 2,652.29 1,642.91 532.62 675.05 - - 20,191.12 21,228.32
Unallocated liabilities 67,390.38 58,794.71
Total liabilities (excluding minority interest) 87,581.50 80,023.03
Note 29 SEGMENT REPORTING
Business segments:The primary segment of the Group has been determined on the basis of business segment. The Group is organized into four business segments - Soaps and Detergents, Home Care, Laundry services and Others. Segments have been identified taking into account the nature of the products and services, the differing risks and returns, the organization structure and the internal reporting system.
Soaps and Detergents includes fabric whiteners, fabric detergents, dishwash bar and soaps including ayurvedic soaps. Home Care products include incense sticks, dhoop, mosquito repellents and scrubber. Laundry services include dry-cleaning & providing linen on rental. Others includes Body care, Tea and coffee.
Secondary segment:The Group mainly caters to the needs of the domestic market. The export turnover is not significant in the context of total turnover.
Segment revenue and result:The income/ expense that are not directly attributable to the business segments are shown as unallocated corporate costs.
Segment assets and liabilities:Segment assets include all operating assets used by a segment and consist principally of debtors, inventories, advances and fixed assets. Assets at corporate level are not allocable to segments on a reasonable basis and thus the same have not been allocated.
Segment liabilities include all operating liabilities and consist principally of creditors and accrued liability.
Information about Business Segments:

114 | Jyothy Laboratories Limited
` In lacs
Notes to Consolidated Financial Statements For the year ended March 31, 2013
Note 29 SEGMENT REPORTING (Contd.)
Soaps and Detergents Home care Laundry Services Others Eliminations Total
2012-13 2011-12 2012-13 2011-12 2012-13 2011-12 2012-13 2011-12 2012-13 2011-12 2012-13 2011-12
Segment Capital expenditure (including capital work in progress) 982.86 638.07 48.66 285.81 1,490.44 1,309.12 - - - - 2,521.96 1,911.85
Unallocated capital expenditure (including capital work in progress) 199.57 174.66
Total capital expenditure (including capital work in progress and excluding the Goodwill on consolidation) 2,721.53 2,086.51
Segment depreciation and amortisation 1,196.35 1,199.18 410.70 399.80 441.12 386.95 3.46 - - - 2,051.63 1,985.93
Unallocated depreciation and amortisation 195.71 308.64
Total depreciation and amortisation 2,247.34 2,294.57
Segment impairment loss Reversal (4.48) - - - - - - - - - (4.48) -
Segment impairment loss - 170.79 - - - - - - - - - 170.79
Total impairment loss/ (Reversal) (4.48) 170.79
Segment non cash expenses other than depreciation 74.43 21.30 15.81 175.74 77.30 79.02 1.48 - - - 169.02 276.06
Unallocated non cash expenses other than depreciation 1.37 0.03
Total non cash expenses other than depreciation 170.39 276.09
Information about geographical segment : 2012-13 2011-12
IndiaOutside
India IndiaOutside
India
1. Segment Revenue 108,537.98 1,877.31 89,944.25 1,317.45
2. Segment Assets 151,264.86 659.75 141,602.76 330.89
3. Capital Expenditure 2,210.04 511.49 2,086.51 -
Note 30 RELATED PARTY DISCLOSURES
a) Parties where control existsIndividual having controlM.P. Ramachandran Chairman and Managing DirectorAs the Managing Director of the Company is an individual having control and hence not separately disclosed as a key management personnel
b) Related party relationships where transactions have taken place during the yearFirm / HUF in which the relatives of individual having control are partners / members / proprietorBeena Agencies Quilon Trading Co. Travancore Trading Corp.Sree Guruvayoorappan AgenciesM.P. AgenciesTamil Nadu Distributors

Annual Report 2012-13 | 115
` In lacs
Notes to Consolidated Financial Statements For the year ended March 31, 2013
2012-13 2011-12c) Transactions with related parties during the year
Individual having control Remuneration* 216.00 218.98 Commission 111.89 218.78 Dividend 896.38 1,785.73
Commission paid Sreehari Stock Suppliers 8.47 29.40 Sujatha Agencies 8.66 30.21 Tamil Nadu Distributors 3.53 11.95 Beena Agencies 15.17 48.70 Sahyadri Agencies 23.29 81.63 Travancore Trading Corporation 17.07 57.46 Deepthy Agencies 7.19 25.83 Sahyadri Agencies Limited 75.06 -
Rent Paid Quilon Trading Company 1.20 1.20
Dividend (M.P. Divakaran - H.U.F. and M.P. Sidharthan - H.U.F.) 40.30 80.60
Note 30 RELATED PARTY DISCLOSURES (Contd.)
Deepthy Agencies Sahyadri Agencies Sreehari Stock Suppliers Sujatha Agencies M.P. Divakaran - H.U.F. M.P. Sidharthan - H.U.F.
Relative of individual having controlM.P. Sidharthan M.R. Jyothy (Director) M.R. Deepthy Ananth Rao T Ravi RazdanM. G. Santhakumari M.P. Divakaran
Enterprises significantly influenced by key management personnel or their relativesSahyadri Agencies Ltd.
Key management personnelK. Ullas Kamath Joint Managing Director S.Raghunandan Whole Time Director & CEO

116 | Jyothy Laboratories Limited
` In lacsNote 30 RELATED PARTY DISCLOSURES (Contd.)
2012-13 2011-12Relatives of individuals having controlRemuneration* M R Jyothy (Director) 56.28 31.36 M P Sidharthan 20.00 12.00 M R Deepthy 20.16 15.01 Ananth Rao T 26.49 20.16 Ravi Razdan 20.16 15.90 M. P. Divakaran 20.00 11.00
Dividend 362.38 710.08 Contribution to Superannuation fund M R Jyothy 4.20 2.80 Ananth Rao T 2.33 1.80 M R Deepthi 1.80 1.27 Ravi Razdan 1.80 1.38
Key management personnelRemuneration* 581.93 174.52 Commission 100.70 172.91 Dividend 19.19 36.28 Contribution to Superannuation fund 51.96 15.58 * As the future liabilities for gratuity is provided on an acturial basis for the Company as a whole, the
amount pertaining to individual basis is not ascertainable and therefore not included above.d) Related party balances
Amounts payableTrade Payables:Individual having control 111.89 218.78 Key management personnel 100.70 172.91
Enterprises in which relatives of individual having control are interested (Security deposits) Beena Agencies 35.00 38.11 Deepthy Agencies 100.00 102.06 M.P.Agencies 37.92 37.92 Sahyadri Agencies 5.00 11.24 Sujatha Agencies 5.00 12.35 Tamil Nadu Distributors 7.81 10.86 Travancore Trading Corporation 107.61 112.05 Quilon Trading Company 0.10 0.20 Sree Guruvayurappan Agencies 0.71 0.71 Srihari Stock Suppliers - 6.39
Enterprises significantly influenced by key management personnel or their relatives Sahyadri Agencies Ltd. 19.45 6.20
Notes to Consolidated Financial Statements For the year ended March 31, 2013

Annual Report 2012-13 | 117
` In lacs
Note 31 UNHEDGED FOREIGN CURRENCY EXPOSURE
Particulars Foreign Currency
2012-13 2011-12` in Lacs Amount
in Foreign Currency
` in Lacs Amountin Foreign Currency
Export debtors US $ 45.61 83,582 100.32 196,110
Note 32 OPERATING LEASES
In case of assets taken on leaseThe Group has entered into Lease agreements for premises, which expire at various dates over the next five years.Certain agreements provide for increase in rent. All lease agreements are cancellable except in case of few agreements wherein there is a lock in period in the range of 11 months to 3 years. Lease rental expense for the year ended March 31, 2013 was ` 1,468.90 (2012 - ` 1,173.51). There are no restrictions imposed by lease arrangements. There are no subleases.
2012-13 2011-12Future lease payment under non - cancellable operating leases are as follows:Payable not later than one year 205.43 349.11 Payable later than one year and not later than five years 102.84 582.51 Payable later than five years - 5.35
308.27 936.97 In case of assets given on leaseThe Company has leased out few of its premises on operating lease. The Gross carrying amount and accumulated depreciation as at March 31, 2013 is ` 54.95 and ` 6.05 (2012 - ` 54.95 and ` 5.15) respectively. Lease rent income for the year ended March 31, 2013 was ` 4.57 (2012 – ` 4.61). There is no escalation clause in the lease agreement and the lease is cancellable in nature. There are no restrictions imposed by lease arrangements.
Note 33 CONTINGENT LIABILITIES
2013 2012Contingent liabilities not probable and hence not provided by the Groupin respect of:(i) Tax matters
(a) Disputed sales tax demands – matters under appeal 6,304.90 3,352.35 (b) Disputed excise duty and service tax demand - matter under appeal 2,504.91 1,888.84 (c) Disputed income tax demand - matter under appeal 79.56 32.82
(ii) Claims against the Company not acknowledged as debt - 120.00 (iii) Other Statutory dues 9.16 67.85
Note 34 CAPITAL COMMITMENTS (NET OF ADVANCES)
2013 2012Estimated amount of contracts remaining to be executed on capital account and not provided for 298.95 2,017.20
298.95 2,017.20
Notes to Consolidated Financial Statements For the year ended March 31, 2013

118 | Jyothy Laboratories Limited
` In lacs
Notes to Consolidated Financial Statements For the year ended March 31, 2013
Note 35
As per the Notification no. 32/99-CE dated July 8, 1999, the Company was entitled to refund of excise duty in Guwahati and Jammu units equivalent to the amount of the duty paid through Personal Ledger Account (‘PLA’). During an earlier year, the Government issued notifications no. 17/2008-CE and 19/2008-CE dated March 27, 2008 restricting the refund amount to a maximum percentage specified in the notification. The Company had filed a writ petition in the Guwahati High Court and the Jammu and Kashmir High Court against the respective notifications and obtained stay orders from both the High Courts. During the previous years, the Guwahati High Court has given a favourable order in case of a similar matter against which the Department has filed an appeal in the Supreme Court. Further, the Jammu High Court has also given favourable order. Based on the orders of High Court, the Company has accrued an additional benefit of ` 438.50 (2012 - ` 186.54) in the current year.
Note 36
The Group has acquired the following subsidiaries in the previous year
Name of the subsidiary Date of acquisition
1. Henkel India Limited (Now known as Jyothy Consumer Products Limited) August 23, 2011
2. Diamond Fabcare Pvt. Limited April 1, 2011
3. Akash Cleaners Private Limited April 1, 2011
4. Fab Clean & Care Private Limited June 1, 2011
5. Four Seasons Dry-Cleaning Co. Pvt. Ltd. February 15, 2012
The details of financial information on acquisition date are provided below:-
Particulars AmountNet assets (18,559.11)
Purchase consideration 33,508.63
Goodwill on consolidation 52,067.74The net assets of the acquired subsidiaries as on 31 March 2012 are (` 18,855.96) (before elimination), net revenue for the period from date of acquisition to 31 March 2012 are ` 23,385.04 (before elimination) and the loss after tax during the period from date of acquisition to 31 March 2012 are ` 2,945.16 (before elimination).
Note 37
The Honourable High Court of Mumbai, on April 12, 2013, approved the scheme of amalgamation (the scheme) under sections 391 to 394 of the Companies Act, 1956. In accordance with the scheme, Jyothy Consumer Products Limited (transferor Company or JCPL) merged with the company with effect from 1 April 2012.
There is no impact of this merger on consolidated financial statements of the group since the business was already included in the consolidated financial statements of the previous year (Refer Note 38).
As per the Scheme, the purchase consideration is to be discharged through issue of 23,79,748 equity shares. Pending such allotment, the fair value of the consideration of ` 5,504.12 lacs has been shown under ‘Share capital suspense account’ in the balance sheet and corresponding effect has been given in goodwill. Further, the shareholders of the transferor Company are also entitled to equivalent number of bonus shares. Accordingly, an amount of ` 23.80 lacs has been utilised from securities premium and disclosed under ‘Share capital suspense account’.
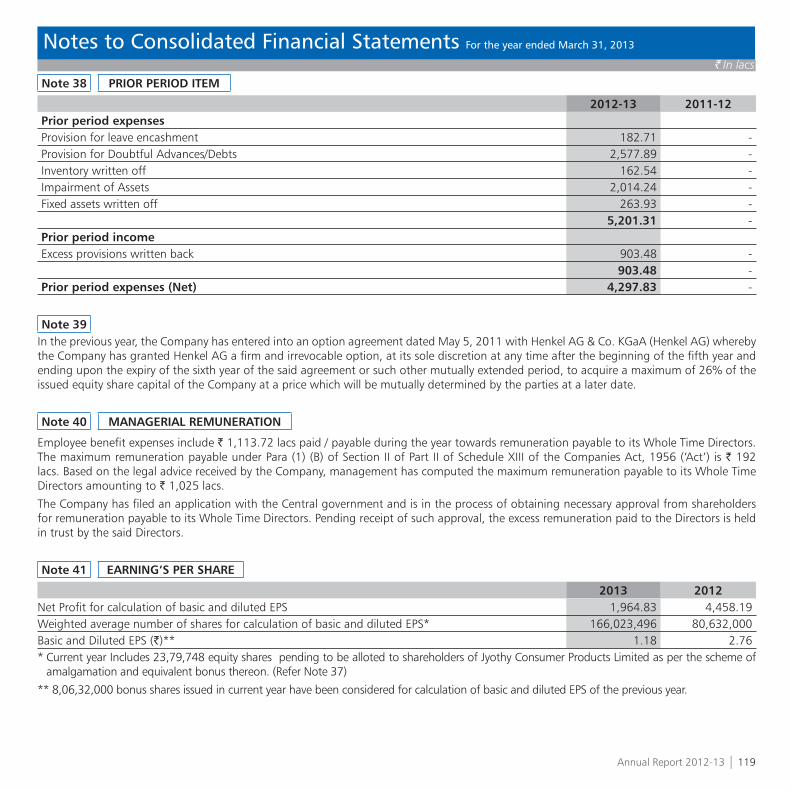
Annual Report 2012-13 | 119
` In lacs
Notes to Consolidated Financial Statements For the year ended March 31, 2013
Note 38 PRIOR PERIOD ITEM
2012-13 2011-12Prior period expensesProvision for leave encashment 182.71 - Provision for Doubtful Advances/Debts 2,577.89 - Inventory written off 162.54 - Impairment of Assets 2,014.24 - Fixed assets written off 263.93 -
5,201.31 - Prior period incomeExcess provisions written back 903.48 -
903.48 -Prior period expenses (Net) 4,297.83 -
Note 39In the previous year, the Company has entered into an option agreement dated May 5, 2011 with Henkel AG & Co. KGaA (Henkel AG) whereby the Company has granted Henkel AG a firm and irrevocable option, at its sole discretion at any time after the beginning of the fifth year and ending upon the expiry of the sixth year of the said agreement or such other mutually extended period, to acquire a maximum of 26% of the issued equity share capital of the Company at a price which will be mutually determined by the parties at a later date.
Note 40 MANAGERIAL REMUNERATION
Employee benefit expenses include ` 1,113.72 lacs paid / payable during the year towards remuneration payable to its Whole Time Directors. The maximum remuneration payable under Para (1) (B) of Section II of Part II of Schedule XIII of the Companies Act, 1956 (‘Act’) is ` 192 lacs. Based on the legal advice received by the Company, management has computed the maximum remuneration payable to its Whole Time Directors amounting to ` 1,025 lacs.
The Company has filed an application with the Central government and is in the process of obtaining necessary approval from shareholders for remuneration payable to its Whole Time Directors. Pending receipt of such approval, the excess remuneration paid to the Directors is held in trust by the said Directors.
Note 41 EARNING’S PER SHARE
2013 2012Net Profit for calculation of basic and diluted EPS 1,964.83 4,458.19 Weighted average number of shares for calculation of basic and diluted EPS* 166,023,496 80,632,000Basic and Diluted EPS (`)** 1.18 2.76 * Current year Includes 23,79,748 equity shares pending to be alloted to shareholders of Jyothy Consumer Products Limited as per the scheme of
amalgamation and equivalent bonus thereon. (Refer Note 37)
** 8,06,32,000 bonus shares issued in current year have been considered for calculation of basic and diluted EPS of the previous year.

120 | Jyothy Laboratories Limited
` In lacs
Notes to Consolidated Financial Statements For the year ended March 31, 2013
Note 43
During the previous year, Jyothy Fabricare Services Limited has issued 50,000 equity shares to IL&FS Trust a Company Limited at a premium of ̀90 per share as a result of which the effective holding of the Company in Jyothy Fabricare Services Limited has reduced from 75% to 74.71%.
Note 44 PREVIOUS YEAR FIGURES
Previous year figures have been regrouped / reclassified, where necessary, to conform to this year classification.
Signatures to Notes 1 to 44
As per our report of even date
For S.R. Batliboi & Associates LLP For and on behalf of the Board of Directors ofChartered Accountants Jyothy Laboratories LimitedICAI Firm Registration No. 101049W
per Vikram Mehta M.P. Ramachandran K. Ullas KamathPartner Chairman and Managing Director Joint Managing DirectorMembership No.: 105938
Place: Mumbai M.L. Bansal Place: MumbaiDate: May 22, 2013 Company Secretary Date: May 22, 2013
Note 42 MICRO, SMALL AND MEDIUM ENTERPRISES DEVELOPMENT ACT, 2006 (‘MSMED’)The disclosure pursuant to the said Act is as under :
2013 2012Principal amount due to suppliers under MSMED Act 3,068.39 3,097.72 Interest accrued and due to suppliers under Section 16 of MSMED Act, 2006 on the above amount, unpaid 64.67 - Interest paid to suppliers under the MSMED Act - - Interest due and payable towards suppliers under MSMED Act towards payment already made - - Interest accrued and remaining unpaid at the end of accounting year 64.67 - The above information has been determined to the extent such parties have been identified on the basis of information available with the Group.

Annual Report 2012-13 | 121
Statement pursuant to exemption received under Section 212 (8)of the Companies Act, 1956, relating to subsidiary companies.
Sr. No
Name of the Subsidiary Company
Associated IndustriesConsumerProductsPvt. Ltd.
JyothyFabricare ServicesLimited
JyothyKallol
BangladeshLimited
SnowaysLaundrers
andDrycleanersPvt. Ltd. #
DiamondFabcare Private
Limited #
AkashCleanersPrivate
Limited #
Fab Clean & Care Private Limited #
Four Seasons Dry
CleaningCo. Private Limited #
Jyothy ConsumerProducts
MarketingLtd. (Formerly
know as Henkel Marketing India
Limited)Country India India Bangladesh India India India India India IndiaFinancial Year / Period April 1,
2012 to March 31,
2013
April 1, 2012 to
March 31, 2013
April 1, 2012 to
March 31, 2013
April 1, 2012 to
March 31, 2013
April 1, 2012 to
March 31, 2013
April 1, 2012 to
March 31, 2013
April 1, 2012 to
March 31, 2013
April 1, 2012 to
March 31, 2013
April 1, 2012 to March 31, 2013
1 Capital 497.00 1,635.00 611.00 100.00 1,000.00 50.00 2.28 220.70 86.00 2 Reserves 139.95 (455.42) 29.94 (8.89) (3,408.77) (176.75) 261.98 (301.13) (34,242.09)3 Total Assets 998.15 8,568.48 659.76 97.41 1,020.79 768.74 269.75 100.57 2,212.22 4 Total Liabilities 361.20 7,388.90 18.82 6.30 3,429.56 895.49 5.49 181.00 36,368.31 5 Details of Investment (except
investment in subsidiries) - - - - - - - - -
6 Turnover (Net) 825.68 2,008.76 - - 917.12 1,239.49 150.13 144.17 18,978.45 7 Profit/(Loss) before taxation 73.11 (1,440.47) 47.91 (0.03) (899.55) (135.09) 41.91 (67.90) (1,224.67)8 Provision for taxation 18.03 - 17.93 - - (0.61) (8.15) - - 9 Profit/(Loss) after taxation 55.08 (1,440.47) 29.98 (0.03) (899.55) (134.48) 50.06 (67.90) (1,224.67)10 Proposed/Interim Dividend Nil Nil Nil Nil Nil Nil Nil Nil Nil
Exchange rate used - - 1BDT = 0.69 INR
- - - - - -
Local Currency INR INR BDT INR INR INR INR INR INR
# Snoways Laundrers and Drycleaners Pvt. Limited, Diamond Fabcare Pvt. Limited, Akash Cleaners Private Limited, Fab Clean & Care Private Limited, Four Seasons Dry-Cleaning Co. Pvt. Limited is a subsidiaries of Jyothy Fabricare Services Limited
For and on behalf of the Board of Directors ofJyothy Laboratories Limited
M. P. Ramachandran K. Ullas KamathChairman & Managing Director Joint Managing Director
Mumbai
Date: May 22, 2013
` In lacs

NOTES

Value Creation for Shareholders
At JLL, creating value for shareholders is an ongoing commitment. As you can see from the
chart, your share has grown 2.53 times over the past 5 ½ years, from Rs 69 in November 2007 to
Rs 175 in May 2013. Clocking up a compounded annual growth rate (CAGR) of 22%.
Share Price
250
200
150
100
50
0
15-N
ov-0
715
-May
-08
15-N
ov-0
8
15-M
ay-0
9
15-N
ov-0
9
15-M
ay-10
15-N
ov-10
15-M
ay-11
15-N
ov-11
15-M
ay-12
15-N
ov-12
15-M
ay-13

UJALA HOUSE, Ramkrishna Mandir Road, Kondivita, Andheri (East), Mumbai - 400 059.
Tel. No.: 022-6689 2800, Fax: 6689 2805, Website: www.jyothylaboratories.com
Des
ign
ed b
y A
dfa
ctor
s
ANNUAL REPORT 2012-13
Change - for our constant growth!