challenges to ecosystem goods and servicesmsj42/pdfs/climatechangedevelopmentgambia_… ·...
TRANSCRIPT
Climate Change and Development in the Gambia Challenges to Ecosystem Goods and Services

ii
Photo Credits
Front Cover:
Top left – Women harvesting rice. Source: Richard Goodman http://www.merriewood.com/gambia Top Right: Flooding in Upper River Region during 2010 rainy season. Source: Regional Disaster Management Committee (RDMC) Bottom left: Beachfront in Barra . Source: Fatoumata Jaiteh Bottom Right: Flooding near Basse, 2010. Source: Rural Disaster Management Committee (RDMC) URR

iii
Authors Malanding S. Jaiteh, PhD Geographic Information Specialist Center for International Earth Science Information Network (CIESIN) The Earth Institute, Columbia University
Baboucarr Sarr International College of Business and Human Resource Development (ICOBAHRD) Kanifing, The Gambia
Technical Reviewers Abdoulie A. Danso Natural Resource Management Expert and Deputy Permanent Secretary Ministry of Agriculture, Banjul, The Gambia Pa Ousman Jarju Department of Water Resources Banjul, The Gambia
The authors are grateful to the following for their participation at and contributions to the National Validation Workshop held on March 31, 2011: Ebrima Dem, National Coordinator, Global Unification Muhammad Leroy Gomez, Program Officer, National Environment Agency Pateh Dampha, Marin Pilot, Gambia Ports Authority Fafanding S. Fatajo, Director, Department of Agricultural Services Mustapha Darboe, Deputy Permanent Secretary, Dept of Forestry/Environment IDPS Serign Modou Joof, Regional Disaster Coordinator, West Coast Region Ismaila Senghore, Principal Producer 1, Educational Programmes (Radio), Gambia Radio and Television Services Adama Demba, Deputy Director of Health Services Janis James, Economic Adviser, UNDP Momodou Touray, Programme Specialist, UNDP

iv
Abbreviations and Acronyms BCC Banjul City Council CBG Central Bank of The Gambia CDDP Community Driven Development Project CRR Central River Region CRR-N Central River Region-North CRR-S Central River Region -South EU European Union FAO Food and Agricultural Organization GBoS Gambia Bureau of Statistics GoTG Government of The Gambia IMF International Monetary Fund IMNCI Integrated Management of Neonatal and Childhood Illnesses JICA Japan International Co-operation Agency KMC Kanifing Municipal Council LGA Local Government Area LRR Lower River Region MDG Millennium Development Goals MICS Multiple Indicator Cluster Survey MRC Medical Research Council NAPA National Adaptation Programme of Action NAWEC National Water and Electricity Company NBR North Bank Region NEA National Environment Agency NGO Non-Governmental Organization PRSP Poverty Reduction Strategy Paper RVTH Royal Victoria Hospital Teaching Hospital SoS Secretary of State SPA Strategy for Poverty Alleviation UNCBD United Nations Convention on Biodiversity UNDP United Nations Development Programme UNEP United Nations Environment Programme UNFCC United Nations Framework Convention on Climate Change UNFPA United Nations Fund for Population Activities UNICEF United Nations Children’s Fund URR Upper River Region WHO World Health Organization WR Western Region
v
Captions for Figures and Tables
List of Figure Figure 1. Elevation map of the Gambia. Source: United States Geological Surveys Digital elevation model, SRTM Data. .......................................................................................................................................................... 2
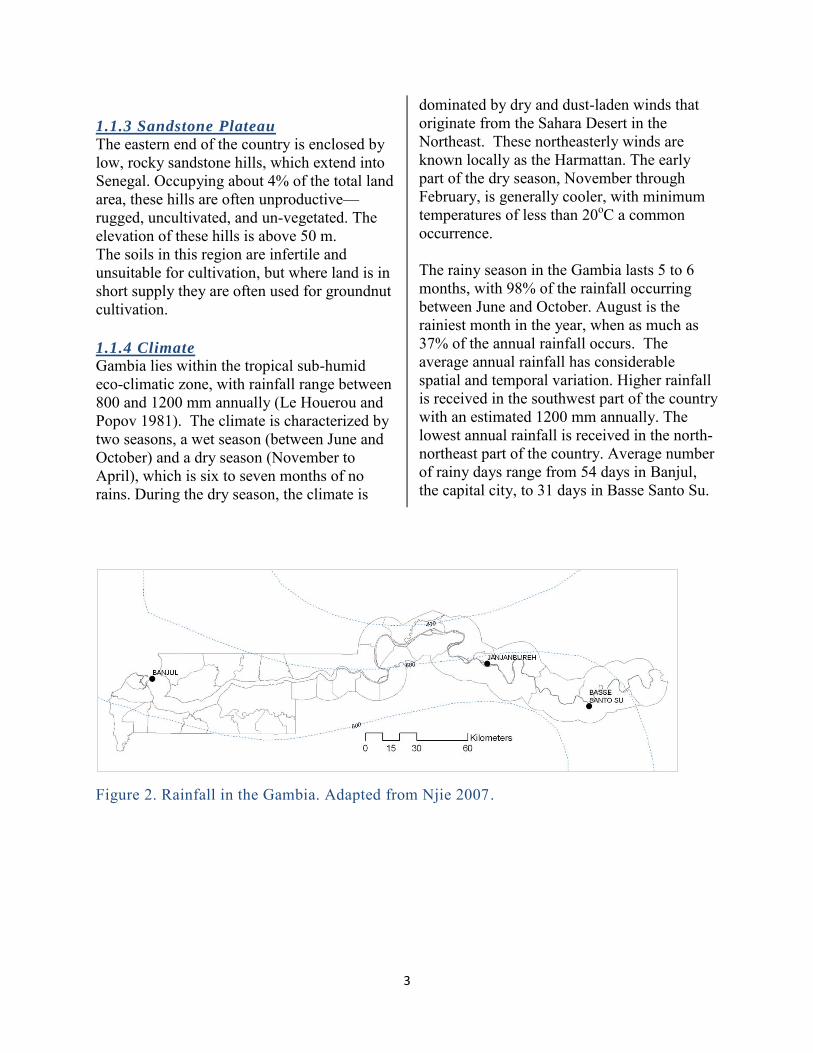
Figure 2. Rainfall in the Gambia. Adapted from Njie 2007. ................................................................................. 3
Figure 3. Rainfall profiles of Banjul, Janjanbureh, and Basse Santa Su. Based on long-term meteorological station data. Adapted from Njie 2007. .................................................................................................................. 4
Figure 4. Land cover distributions in 2001. Source: The Gambia 50000 database, 2003. Department of Local Government and Lands. ........................................................................................................................................ 5
Figure 5. Composition of Gambia’s landscape in 2001. Source: Gambia 50,000 database, 2003. Dept. of State for Local Government and Lands ......................................................................................................................... 6
Figure 6. Population distribution by LGA in 2003. Source: Adapted from Jaiteh and Saho 2006. The Gambia 2003 Population and Housing Census. ................................................................................................................. 7
Figure 7. Average precipitation (isohyts) over The Gambia during the period 1945-1965 (dashed lines) and in 1965-2005 (solid lines). Adapted from Njie 2007- Gambia NAPA report. ........................................................ 11
Figure 8. Area of land cover categories converted to populated built-up in western region by cover type. Source: The Gambia 50,000 Database. Ministry of Local Government and Lands 2003 .................................. 16
Figure 9. Composition of area impacted by urban sprawl between 2001 and 2010 in the Gambia. Source:Gambia 50,000 database. ........................................................................................................................ 17
Figure 10. Populated/built-up area (ha) in western districts of Kombo and Niumi. 2001 (left) and 2010 (right). Source: Gambia 50,000 database (2001) and The Gambia Parcel Database (2010) by Geospatial Data Solutions. ............................................................................................................................................................ 17
Figure 11. Map showing erosion and accretion along the 80km coastline. Source: Coastal Zone Management Handbook for The Gambia, 2004 ....................................................................................................................... 21
Figure 12. Land area that will be inundated by 100cm sea level rise (shaded). Source: Gambia 50,000 database. Ministry of Local Government and Lands .......................................................................................................... 22
Figure 13. Area of each land cover type that will be affected by 100cm sea level rise. Source: Gambia 50,000 database. Ministry of Local Government and Lands .......................................................................................... 22
Figure 14. Area (ha) Forests and woodland ecosystems that will be affected by 100 cm rise in sea level. Source: Elevation and land cover data from the Gambia 50000 GIS database. Ministry of Local Government and Lands ............................................................................................................................................................ 24
Figure 15. Wildlife of the Gambia. Hyena(left) Northern Red Bishop (center) and Chimpanzee and baby (Right). ................................................................................................................................................................ 25

vi
Figure 16. Figure 16. Proportion of land area under each major crop. Source: The Gambia Agricultural Census
2003 .................................................................................................................................................................... 28
Figure 17. Cropland area that will be inundated by 1 m sea level rise in each district. The Gambia 50,000 GIS Database. Ministry of Local Government and Lands ......................................................................................... 29
Figure 18. Agricultural, domestic and industrial water use in the Gambia in 2008. Source: FAO/AQUASTATS 2011 .................................................................................................................................................................... 31
Figure 19. Composition of cooking fuels used in The Gambia in 2002. Based on The Gambia 2003 Population and Housing Census Data. Adapted from Jaiteh and Saho 2006. ....................................................................... 33
Figure 20. The Waliba Kunda Bridge, partly damaged by the floods. Source: Mawdo Jallow, URD .................. 33
Figure 21. Area in and around Banjul that would be inundated after 100 cm rise in sea level. Source: The Gambia 50,000 GIS Database. Ministry of Local Government and Lands ........................................................ 34
Figure 22. Flash flooding after heavy rains in Basse during the 2010 rainy season. Source: RDMC URR .......... 34
Figure 23. Current land area in Western Gambia that would be inundated by a 100 cm rise in sea level.
Source: DEM and administrative boundary data- The Gambia 50,000 GIS Database 2003. Ministry of Local
Government and Lands ....................................................................................................................................... 35
Figure 24. Location of current populated built-up areas that would be affected by 1 m sea level rise. Source:
The Gambia 50,000 GIS Database 2003. Ministry of Local Government and Lands .......................................... 35
List of Tables Table 1. Area of Local Government Area (LGA) in sq. km at different elevation ranges. ...................................... 1
Table 2. Long-term mean, minimum, and maximum temperature and rainfall at stations in Banjul (western Gambia), Janjanbureh (central Gambia) and Basse Santo Su (eastern Gambia). ................................................. 5
Table 3. Land area (Sq km) and total population of local government areas in 2003. ......................................... 7
Table 4. Extent of damage due to flooding between 1999 and 2010. ................................................................. 13
Table 5. Area of current land cover that will be inundated by 100 cm (1 m) rise in sea level............................ 15
Table 6. Catalog of ecosystem goods and services in savannah woodlands, aquatic, coastal and urban ecosystems .......................................................................................................................................................... 20
Table 7. Yield of major crops between 1999/00 to 2005/2005 rainy seasons. Adapted from PRSP II 2007 Report ................................................................................................................................................................. 28
Table 8. Health hazards and potential consequences in the Gambia. Adapted from National Disaster and Climate Adaptation Program. ............................................................................................................................. 36
vii
Executive summary
Occupying a total area of 11,300 sq km, with a population density of 130 persons per sq km, The Republic of the Gambia is one of the most densely populated countries on continental Africa. Because The Gambia possesses only minimal commercial mineral resources and manufacturing sector, agriculture is the primary source of livelihood for many Gambians, employing more than 68% of the workforce and accounting for about 40% of the Gambia’s export earnings contributing about 26% of the Gross Domestic Product (GDP). Agriculture is predominantly subsistence and rain-fed with farmers relying on traditional shifting cultivation and livestock management practices. Over the last fifty years cropland area increased from under 100,000 ha to over 300,000 at the expense of natural woodland and wetland ecosystems.
Over 51% of The Gambia’s population resides in urban areas. Driven by variable and degrading climate, decline in agricultural productivity in rural areas, and changes in economic activity (tourism, petty trade and small scale manufacturing) in the ecologically favorable West Coast Region, urban population has increased from 110,000 in 1973 to 680,000 in 2003. Between 1980 and 2001, built-up area in the Gambia has increased from 2,725 ha to more than 19,000 ha with over 50% of the increase occurring in Kombo (KMC and the districts of Kombo).
The Gambia’s climate is Sahelian characterized by high variability in the amount and distribution of annual precipitation. Analysis of long-term climate data shows that the past 50 years have seen a decrease in total
amount of precipitation, length of rainy season, and increase in length and frequency of extreme weather events such as droughts and dust storms. The low-lying topography, combined by high dependence on subsistence rain-fed agriculture and inadequate drainage and storm water management system in a context of rapidly expanding un-regulated urban expansion has placed the Gambia among those countries most vulnerable to climate change.
This study examines threats associated with anthropogenic climate change; vulnerable ecosystems and ecosystem services; and examines how to integrate responses to climate change and adaptation measures into strategies for poverty reduction, to ensure sustainable development. Key findings of the study are summarized below.
CLIMATE CHANGE CHALLENGES
This study reveals a paucity of literature on anthropogenic climate change and impacts on both the ecosystems and human wellbeing lacking in the Gambia. The GCM projections of future climate in the Gambia reported in the First National Communication and referenced by many others are based on just one analysis. The analysis indicated that average temperature in the Gambia will increase between 3 and 4.5oC, bringing with it an increase in potential evapotranspiration by the year 2075. With respect to projected rainfall, GCM model outcomes vary widely between -59% and +29% of the 1951-1990 average of 850mm per annum(GOTG 2003). Regional GCM analyses comparing Surface Air Temperature (SAT) to those of the surrounding oceans projected annual rainfall to increase between 25% and 50% across the
viii
Sahara by the year 2080 (Haarsm, Selten et al. 2005). Although there is a general consensus that anthropogenic activities such as changes in land cover affect Sahel rainfall, little quantitative data exists that measure these influences at the local level. As to whether or not future anthropogenic changes in land use and land cover will counteract the simulated increase in Sahel rainfall, this is still an open question. The general findings of the First National Communication analysis include increased upstream migration of saltwater, increased salinization of coastal ecosystems, reduction in yield of major crops and receding coastline.
Overall predicted climate change and variability will present important short-term and long-term challenges to development efforts in the Gambia. In the short-term extreme climate events including windstorms, rainstorms, droughts and dust storms will become more frequent with increased severity. Land use and land cover change, sea level rise, and coastal erosion present significant long-term challenges.
Windstorms are common phenomena in the Gambia, particularly at the beginning and towards the end of the rainy season. Overall windstorms account for most damage to properties in rural areas. As woodland degradation and land use change denude the landscape, windstorms could become even more severe, resulting in even greater loss of life and property.
Floods and storm water runoff are most common in urban areas. Inadequate storm water management systems and lack of adherence to land use zoning regulations have increased the frequency and severity of flooding in urban areas and the resulting loss of human life and property damage they cause. Although catastrophic seasonal floods are rare in the Gambia, the risks of are nevertheless present. As extreme weather events become more frequent due to climate
change, so do the likelihood of catastrophic seasonal floods like those seen in Pakistan (2010); Ghana, Benin and Burkina Faso (2010); and Queensland, Australia (2011). Because The Gambia has about 30 % of the country at or below 10 m above sea level, such floods would be cataclysmic of unimagined consequences.
Sea level rise and coastal erosion present serious long-term challenges to Gambia’s development. There is consensus that climate change could result in up to 1 m rise in the sea level. The Gambia is primarily low-lying and a 1 m rise in sea level could potentially inundate over 8% of the country’s land area. This includes over 61% of current mangroves, 33% of swamps, and over 20% of current lowland rice growing areas. The inundation could effectively drown over 50% of the capital city of Banjul (rendering it virtually uninhabitable) and the towns of Barra, Jangjabureh and Kuntaur, together with the Port of Banjul, all ferry terminals, and harbour landings along the River Gambia. Sea level rise could result in the salinization of shallow coastal aquifers, the primary source of portable water for the urban Gambia. Impacts of sea level rise would be compounded by coastal erosion along the 80km coastline, with potentially negative effects on the tourism industry, which is critical to the economy of the Gambia.
Droughts. One of the major challenges posed by future global climate change in the western Sahel region in general and The Gambia in particular is increased frequency and severity of drought events. Direct impacts of frequent persistent droughts include ecosystem desiccation through increased salinization in freshwater wetland and mangrove ecosystems, loss of productivity in croplands, saltwater intrusion up the river, deforestation, and loss of productivity and biodiversity in woodland ecosystems as a result of wildfires and land use change. More than 99% of croplands in

ix
the Gambia are entirely rain-fed. Despite efforts to introduce early-maturing crop varieties and institute sustainable water management practices, crop production is still very vulnerable to persistent droughts.
VULNERABLE ECOSYSTEMS GOODS
AND SERVICES
Four major ecosystem types can be identified in the Gambia: aquatic; coastal and marine; woodland; and urban ecosystems. The aquatic ecosystems include the River Gambia, its tributaries, its estuary, and the Atlantic Ocean. Coastal Ecosystems include freshwater marshes, flood plains, mangrove swamps and barren salt flats (tan). Woodland Ecosystems is comprised of gallery forest, savannah woodlands, and previously cultivated trees and shrubs areas. The vulnerability to threats posed by climate change and variability vary by ecosystem type and location. Urban Ecosystems include built-up environments of Greater Banjul Area and urban growth centers of Brikama, Farafenni, Soma, Bansang and Basse.
Woodland Ecosystems
With minimal commercially viable mineral resources or manufacturing activity, the Gambia is heavily dependent on agriculture (cash crop cultivation, subsistence farming and livestock production) accounting for 26% of the GDP and employing over 68% of the active labor force. Woodland ecosystems are the primary source of land for grazing, cropping, timber for construction, wood fuels, and a host of secondary forest products. Between 1940 and 2001, woodland ecosystems decreased from 80% of the Gambia’s land area to about 42% in 2001. Between 1965 and 2001, cropland area increased from under 100,000 ha to about 320,000 ha. Of the area under cropland, about 93% were situated on previously woodland ecosystems. Anthropogenic climate change and variability combined with land use change, and over-utilization of woodland
resources will seriously impinge on the availability of products and services from these ecosystems.
Coastal Ecosystems
Coastal ecosystems are comprised of sandy beaches, mangroves and other wetlands. Freshwater marshes are one of the most productive and biologically diverse ecosystems in the Gambia. They are also the main rice cultivation and livestock grazing areas. Mangroves and inter-tidal mudflats are vital breeding and feeding grounds for several resident and Palearctic migrant water birds, crustaceans, fish, and mollusks.Frequent and persistent droughts and accompanying decreased freshwater recharge will result in wetland desiccation, mangrove die-back, and increased salinization of low-lying areas. This could have a negative impact on products and services derived from the ecosystems.
Aquatic Ecosystems
The Gambia lays claim to 20,530 sq km of exclusive economic zone in the Atlantic Ocean of which 5,725 sq km is continental shelf (Earth Trends 2003). The River Gambia and tributaries occupy 1,300 sq km permanent surface water area. The fisheries sector contributes about 12% of GDP, employing some 30,000 people with about 200,000 people depending on the sector for their livelihood. Global climate change could result in increased salinization in the estuary zone and inland migration of freshwater habitats. Increased salinization could result in desiccation of mangrove and other wetland ecosystems that are important croplands and critical breeding and nursery habitats for commercially important fisheries species. Inland and upstream migration of freshwater habitats could result in the loss of many economically important species.
Urban Ecosystems

x
Urban ecosystems include parks and open spaces, streets, buildings and water ways. While urban parks and open spaces can help ameliorate local micro-climate during heat waves, impervious surfaces such as streets and buildings increase flood hazards. Inadequate storm water management and drainage facilities in urban areas have increased the risk and severity of flood risks as well as the damage they cause. In 2010 alone urban floods affected more than 35,000 people and damaged 2,371 houses and unknown amount of food and cash crops. In 2002 the Government of the Gambia spent 200 million Dalasi for beach replenishment to protected built-up structures between Senegambia beach and Banjul. As urban population increase more people will be forced to settle in even more vulnerable areas.
Windstorms and flash floods cause the most damage to property in the Gambia. Each year these hazards result in significant infrastructure damage, fatalities and injuries, and loss and damage to agricultural crops. It is estimated that each year property damage from windstorm, floods, and loss from crop yield amount to tens of millions of Dalasis.
ECONOMIC IMPACTS AND
VULNERABILITY TO CLIMATE
CHANGE
Vulnerability is defined as "the degree to which a system is susceptible to, or unable to cope with, adverse effects of climate change, including climate variability and extremes.‖ In this respect most vulnerable sectors include agriculture and natural resources; water resources; energy; urban infrastructure; and human health and wellbeing.
Agriculture and Natural Resources
The Gambia’s economy is predominantly agrarian, with about one third of the land area under some form of agricultural use. The agriculture and natural resources sector
contributes 26% of GDP and employs about 68% of the labor force, as well as acting as the major source of food for the majority of Gambians. On average an estimated 320,000 ha (57% of total arable land of 558,000) was cultivated annually during this decade (2000 to 2010) (GOTG 2003; GOTG 2003). Cereals make up about 51.6% of this area, with the remaining 48.4% under cash crop oil seeds (namely groundnut and sesame).
Climate change and variability have had and will continue to have significant economic costs in the Gambia. Agriculture in the Gambia is almost entirely rain-fed cash and food crops production. High population pressure and inappropriate cultural practices have severely degraded croplands and crop yields are highly dependent on the amount and distribution of seasonal rains. It is estimated that despite the adoption of improved technologies such as crop diversification and the introduction of early maturing and drought resistant seed varieties, crop yields fluctuate as much as 50% from year to year. GCM analyses project a decrease in productivity of all major crops due to increase in Potential Evapotranspiration (PET), runoff, and drainage by year 2075. The economic impacts of droughts include increased food insecurity, loss of export earnings over the short-term, and increased rural-urban migration in search of alternative livelihoods. Water Resources
Water resources in the Gambia fall under surface and groundwater. Surface water is comprised of the Atlantic Ocean and the River Gambia and its tributaries. During the height of the flood season, inland surface water including the river can extend over 1,965 km2, about 18% of the total area of the country.
It is projected that increased PET as a result of future climate change, combined with
xi
construction of dams in upper Gambia River, will result in reduced freshwater recharge downstream, causing hyper-salinity in mangrove and other wetlands along the river’s estuary zone. Hyper-salinity in rice growing swamp areas could negatively impact the country’s goal of self-sufficiency in food production. The Gambia fisheries and fish resources are vulnerable to climate change and variability in a number of ways. Hyper-salinity in mangroves and other wetland ecosystems could result in systematic spawning and recruitment failures and reduced population of economically important fisheries species. Increase in average temperature and reduced precipitation projected by GCM models (GOTG 2003) will affect the fisheries sector by altering fish habitat availability, quality, and potential for the habitat to sustain fish communities.
Urban Infrastructure
Windstorms and flash floods cause the most damage to property in the Gambia. Each year these hazards result in significant infrastructure damage, injuries and fatalities, and loss and damage to agricultural crops. It is estimated that each year property damage from windstorm, floods, and loss from crop yield amount to tens of millions of Dalasis In 2010 alone, urban floods affected more than 35,000 people and damaged 2,371 houses and unknown amount of food and cash crops. It is estimated that as much as US $200 million will be needed to replace infrastructure in Banjul. There are also wider impacts from extreme climate events. Flooding in urban areas increase exposure to malaria and other waterborne and water contact diseases. Biodiversity
Geographically, the Gambia lies along an ecotone between arid Sahara and humid rainforests in the south. This combined with
the extensive wetland systems along the River Gambia result in a wide range of habitat types supporting a diverse plant and animal species. There are an estimated 104 species of mammals, about 549 species of birds, 59 species of reptiles, and 27 species of amphibians known to be native to the Gambia(GOTG 1998; Barnnet and Emms 2000). Habitat degradation as a result of cultivation, hunting, wildfires and overgrazing have resulted in local extinction of many species over the last one hundred years (Reeve 1912; GOTG 1998). Unfortunately, little is known about the status and distribution of invertebrates in the Gambia or how climate change may impact them. The Gambia has several protected areas including six national parks and game reserves (comprising 4% of the total land area), 66 forest parks and one Ramsar site, which promote in-situ conservation. There are only a few ex-situ facilities, including the animal orphanage of Abuko Nature Reserve and the Botanic Gardens at Bakau.. Despite great strides in establishing protected areas and legislation to protect species and habitats over the past quarter of a century, considerable challenges for biodiversity protection in the Gambia Remain. RECOMMENDATIONS
Climate change and variability have and will continue to present serious challenges to Gambia’s development. There are a number of urgent priorities for building adaptive and mitigation capacity in the Gambia that should be fast-tracked, notably in relation to development of storm water management in Greater Banjul Area and other urban growth centers, development of integrated land use plans for wetland ecosystems, and the adoption of low-carbon technologies. There is also a need to build future climate change risk

xii
screening into development and planning, at sector and regional level. Information on climate, resources, and adaptation strategies and options should be mainstreamed into all sector plans. To enable this, the study recommends that:
I. To help mitigate impacts of sea level rise, there needs to be a national effort to develop: i) a strategic plan to protect vulnerable areas along the beach; ii) a legal framework to protect the remaining mangroves and other critical coastal habitats; and iii) a program of action to protect urban infrastructure and populated areas. Priority should be given to rehabilitation and upgrading the drainage systems to include the rehabilitation of the mechanical pump at Bund Road in Banjul and around key locations in Kanifing Municipal Council.
II. A study should be commissioned to understand the economics of climate change in the Gambia. A systematic assessment focused on short- and medium-term priorities at sector and
cross sector levels should be implemented to quantify the impacts of climate change, particularly for health burdens, agriculture and food security, water/flood risks and ecosystem services. In addition, such a study should investigate the impacts and economic costs of climate change; the costs of adaptation; and the potential for low carbon growth.
III. The Gambia should continue to push
for strategies that promote pro-poor, carbon-neutral development projects, particularly in the energy sector. It would be useful to undertake a more comprehensive analysis of potential opportunities for adopting low carbon options that have a marginal cost..
IV. In order to ensure sustainability of ongoing interventions aimed at addressing the climate change challenges, a permanent inter-agency committee on climate change and development should be established to coordinate activities.
xiii
Table of Contents
Abbreviations and Acronyms ................................... iv
Captions for Figures and Tables ............................... v
List of Figures ....................................................... v
List of Tables ............................................................ vi
CLIMATE CHANGE CHALLENGES ......... vii
VULNERABLE ECOSYSTEMS GOODS
AND SERVICES ............................................ ix
ECONOMIC IMPACTS AND SECTOR
VULNERABILITY TO
CLIMATE CHANGE ...................................... x
RECOMMENDATIONS ................................ xi
1.1. Physical environment ........................... 1
1.1.1 The Valley Bottom .............................. - 1 -
1.1.2 Dissected Plateau with Sandy Hills .... - 2 -
1.1.3 Sandstone Plateau .................................. 3
1.1.4 Climate .................................................... 3
1.1.5 Land Use and Land Cover ...................... 5
1.2. Population and Socioeconomic
Characteristics ................................................... 6
1.3. Economic Development Challenges ... 8
2.1. Wind Storms and Floods .................... 11
2.2. Drought ................................................. 14
2.3. Sea Level Rise and Coastal Erosion .. 14
2.4. Urbanization ........................................ 15
3.1. Major Ecosystems ............................... 18
3.2. Ecosystem Goods and Services ......... 19
3.3. Coastal and Marine Ecosystems ....... 20
3.3.1 Coastal Erosion .................................... 21
3.3.2 Sea level Rise ......................................... 21
3.4. Woodland Ecosystems........................ 23
3.5. Biodiversity .......................................... 24
4.1. Agriculture and Natural Resources .. 27
4.1.1 Croplands ........................................... 27
4.1.2 Livestock ............................................ 29
4.2. Water Resources ................................. 29
4.2.1 Surface Water Resources ....................... 29
4.2.2 Groundwater Resources ........................ 30
4.2.3 Vulnerability to Climate Change ........... 31
4.3. Energy ................................................... 32
4.4. Urban Environment and
Infrastructure ................................................... 33
4.5. Human Health and Wellbeing ........... 36
5.1. Millennium Development Goals and
PRSP-II ............................................................... 37
5.2. Climate Adaptations and Mitigation
Strategies .......................................................... 38
5.2.1 Sea Level Rise ........................................ 38
5.2.2 Drought ................................................. 38
5.2.3 Windstorm ............................................. 39
5.2.4 Floods .................................................... 40

xiv

1
1. Introduction
1.1. Physical environment The Republic of the Gambia is located on the Atlantic coast of Africa, between latitudes 13oN and 14oN and Longitude 14oW and 17oW. Occupying a total area of 11,420 sq km, the Gambia consists of two narrow strips of land from 6 to 26 km wide, extending 320 km east along the banks of the River Gambia. The Republic of Senegal is the Gambia’s only neighbor. Occupying an area 20 times the size of the Gambia, Senegal surrounds the Gambia on the north, east and south.
The geomorphology of the Gambia is dominated by the River Gambia, which divides the country into two strips of land no wider than 30 km. The Gambia is generally low-lying, with nowhere above 60 m (Figure 1). Over 48% of the total land area of the Gambia is below 20 m high with nearly one-third of the country, at or below 10 m above sea level. Only four percent of the country’s land area is above 50 m. From the River outwards one can identify three topographic regions, the valley bottom, dissected plateau, and sandstone plateau.
Table 1. Area of Local Government Area (LGA) in sq. km at different elevation ranges.
Land area distributions at elevation ranges (in meters above sea level )
LGA < 10 11−20m 21−30m 31− 40m 41−50m >50m Banjul 21 0 0 0 0 0 Kanifing Municipal Council 34 29 9 0 0 0 Western 418 478 563 216 47 0 North Bank 835 421 399 434 44 0 Lower River 450 318 385 282 116 3 Central River North 371 234 185 185 437 61 Central River South 483 320 216 171 171 74 Upper River 217 448 312 307 437 266
Source: The Gambia 50,000 database 2003 topographic data. Department of Local Government and Lands 1.1.1 The Valley Bottom
The valley bottom is the area immediately along the Gambia River and its tributaries. The area is characterized by poorly drained alluvial sediment formations. These areas are subjected to regular seasonal flooding. The combination of low-lying topography, poorly drained soils, and abundant water provides unique and diverse habitats. The valley makes
up nearly 5,077 sq. km, or 48% of the land area. From Janjanbureh Island westward, the valley broadens, and seasonally inundated swamps appear on either sides of the river, extending more than 2km away from the river. The soils and vegetation in the valley bottom are primarily influenced by the hydrology. In the western third of the Gambia, where the

- 2 -
river water is salty or brackish, the soils are clay and alluvium and are heavily impregnated with salt. The only vegetation that thrives in such condition is mangrove forest. Beyond the mangrove are the freshwater areas, where the soils are often light alluvium and are more fertile than the mangrove region. The natural vegetation in this area is dominated by swamps grass and marshes. For centuries Banto Faros (beyond the swamp) is the center for rice production in the Gambia. 1.1.2 Dissected plateau with sandy hills
Much of upland Gambia is dominated by dissected plateau with sand hills. This area is characterized by gentle rolling sand hills alternating with shallow valleys. In the coastal region, the soils are generally unconsolidated
marine and aeoline sand with intermittent low-lying sand dunes. Underlying these unconsolidated soils are the ferruginous sandstones, which form cliffs no more than about 20 m above Cape St. Mary. In central and eastern Gambia the plateau is broken up by a few flattop laterite sandy hills. Natural vegetation in the plateau is along a precipitation gradient, ranging from trees and shrub savannah in the northeast to multi-story tropical forest in the southwest. All but a few pockets of the original vegetation of the plateau areas are modified or converted for cropland expansion, settlement, and wood collection. The plateau is the center for peanut (the country’s number one cash crop) and coarse-grains (millet and sorghum) production.
Figure 1. Elevation map of the Gambia. Source: United States Geological Surveys Digital elevation model, SRTM Data.
3
1.1.3 Sandstone Plateau
The eastern end of the country is enclosed by low, rocky sandstone hills, which extend into Senegal. Occupying about 4% of the total land area, these hills are often unproductive— rugged, uncultivated, and un-vegetated. The elevation of these hills is above 50 m. The soils in this region are infertile and unsuitable for cultivation, but where land is in short supply they are often used for groundnut cultivation. 1.1.4 Climate
Gambia lies within the tropical sub-humid eco-climatic zone, with rainfall range between 800 and 1200 mm annually (Le Houerou and Popov 1981). The climate is characterized by two seasons, a wet season (between June and October) and a dry season (November to April), which is six to seven months of no rains. During the dry season, the climate is
dominated by dry and dust-laden winds that originate from the Sahara Desert in the Northeast. These northeasterly winds are known locally as the Harmattan. The early part of the dry season, November through February, is generally cooler, with minimum temperatures of less than 20oC a common occurrence. The rainy season in the Gambia lasts 5 to 6 months, with 98% of the rainfall occurring between June and October. August is the rainiest month in the year, when as much as 37% of the annual rainfall occurs. The average annual rainfall has considerable spatial and temporal variation. Higher rainfall is received in the southwest part of the country with an estimated 1200 mm annually. The lowest annual rainfall is received in the north-northeast part of the country. Average number of rainy days range from 54 days in Banjul, the capital city, to 31 days in Basse Santo Su.
Figure 2. Rainfall in the Gambia. Adapted from Njie 2007.

4
Average temperatures in the Gambia range from 18 to 28 degrees Celsius in January to 23 to 36 degrees Celsius in June. Higher temperatures are recorded as one travels east, with mean maximum in summer months
reaching 43 degrees Celsius around Basse Santo Su. Highest temperature ever recorded in the Gambia was 45oC and the lowest temperature recorded was 9oC.
Figure 3. Rainfall profiles of Banjul, Janjanbureh, and Basse Santa Su. Based on long-term meteorological station data. Adapted from Njie 2007.
Temperatures in Banjul and Kombo are moderated by the Atlantic Ocean, experiencing less seasonal and daily variability in daytime temperatures. In an average year, temperatures exceed 35oC for only 34 days in Banjul, compared to 112 days in Basse Santo Su. During the winter months (December through March) temperatures fall
below 18oC for no more than 10 days in Basse Santo Su, compared to 56 days in Greater Banjul Area. Throughout the year the high temperatures encourage plant growth but during the dry season, lack of water becomes an inhibiting factor for plant growth (Le Houérou and Popov 1981; Ludwig and Bojang 1998).
0
100
200
300
400
500
Ja
n
Fe
b
Ma
r
Apr
Ma
y
Ju
n
Ju
l
Aug
Sep
Oct
No
v
De
c
Ra
infa
ll (m
m)
Banjul Rainfall
0
50
100
150
200
250
Ja
n
Fe
b
Ma
r
Apr
Ma
y
Ju
n
Ju
l
Aug
Sep
Oct
No
v
De
c
Ra
infa
ll (m
m)
Rainfall in Janjanbureh
0
50
100
150
200
250
300
Ja
n
Fe
b
Ma
r
Apr
May
Ju
n
Ju
l
Aug
Sep
Oct
No
v
De
c
Ra
infa
ll (m
m)
Basse Rainfall

5
Table 2. Long-term mean, minimum, and maximum temperature and rainfall at stations in Banjul (western Gambia), Janjanbureh (central Gambia) and Basse Santo Su (eastern Gambia).
Station Location Average Mean oC
Average Min oC
Average Max oC
Mean Annual Rainfall(mm)
Banjul 16.8W 13.35N 23 18 25 1096 Janjangbureh 14.8W 13.66N 25 23 33 830 Basse Santo Su 14.2W 13.31N 24 18 36 876
Source: WHO Long-term meteorological station data.
1.1.5 Land Use and Land Cover The natural vegetation formations are classed into more woody Guinea woodland in the west and less woody Sudan savannah in the eastern part (Trolldalen 1991). Wetlands consisting of mangroves, barren flats, and freshwater swamps constitute 17% of total land area and the remaining 83% is under various Sudanian-guinean woodland savannah formations. Over the last one hundred fifty years, the Gambia has experienced significant transformation of the natural land cover as the result of a number of anthropogenic and natural factors. Anthropogenic activities such as agricultural
expansion, urban settlement, livestock rearing, wildfires, and increased climate variability including frequent and persistent droughts are blamed for the change in Gambian land cover. In 1946, woodlands that include mangroves covered an estimated 81% of the land area (FAO 1981). By 2001, total woodland and mangrove area represented less than 50% of the land area. Closed forest, once the dominant woodland cover, is all but disappeared, and the remaining woodland has been reduced to single canopy woodland or grassland.
Figure 4. Land cover distributions in 2001. Source: The Gambia 50000 database, 2003. Department of Local Government and Lands.

6
Figure 5. Composition of Gambia’s landscape in 2001. Source: Gambia 50,000 database, 2003. Dept. of State for Local Government and Lands
1.2 Population and Socioeconomic Characteristics
in 2003, the population of the Gambia was estimated at 1.36 million (Jaiteh and A.Saho 2006). With a population density of 128 inhabitants per /km2, the Gambia is one of the most densely populated countries in Africa. Net population growth is driven primarily by high total fertility rate (TFR) of 4.9 children per woman and drop in infant mortality rate (IMR) of 75 per 1000 live births down from over 225 in 1980. In 2003, about one in four Gambians live in Greater Banjul Area, the region covering the city of Banjul and Kanifing Municipal Council, a combined area of 94 sq. km (0.08% of the total land area). This proportion increases to 37% when we include Kombo North, the district bordering Kanifing Municipal Council. In 2003, about 49% of the population lived in Banjul, KMC, Kombo North, Kombo South and Kombo
Central with a combined area of 720 sq. km (6.8% of land area).
Between the 1993 and 2003 censuses, the population growth rate was 2.8% per annum. Life expectancy at birth is 57 years, compared to 55 years for Africa on average. Like many developing countries in sub-Saharan Africa, the Gambia’s population age-structure is heavily skewed to the youth, with population under 15 years in 2003 estimated at 42% (Jaiteh and A.Saho 2006). The population is heavily concentrated along the coast where the three largest cities, Banjul, Kanifing Municipality, and Brikama are located. About 27% of the population lives in the city of Banjul and Kanifing Municipality, a combined area of 88 sq. km (0.08% of the total land area). More than 52% of the population lives within 20 km of the Atlantic Ocean, an area less than 10% of the total land area.
Cultivation 28%
Grassland /Low Growth
8%
Mangrove 6%
Palms <1%
Plantation 1%
Populated Areas 2%
Rice field 2% Barren Flats 2%
Swamp 9%
Woodlands 42%

7
Table 3. Land area (Sq km) and total population of local government areas in 2003.
LGA Land area (Sq. km) Population in 2003
Banjul 12 35,061
Kanifing 76 322,735 Brikama 1,764 389,594 Mansakonko 1,618 72,167 Kerewan 2,255 172,835 Kuntaur 1,467 78,491 Janjanbureh 1,428 107,212 Basse 2,070 182,586 The Gambia 10,690 1,360,681
Source : The Gambia Atlas of 2003 Population and Housing Census 2003
Brikama is the most populous Local Government Area (LGA), with 29% of the population followed by Kanifing Municipal Council with 24%. Between 1993 and 2003 censuses the national population grew 31% and Brikama LGA grew 66%, surpassing Kanifing as the fastest growing LGA in the country. At district level, Kombo North had
the fastest growing population, with a 106% increase between 1993 and 2003. This was driven largely by rapid expansion of settlements along the recently constructed Kombo Coastal Road , as well as by the establishment of several housing estates including Brusubi, Yarambamba, and OAU village.
Figure 6. Population distribution by LGA in 2003. Source: Adapted from Jaiteh and Saho 2006. The Gambia 2003 Population and Housing Census.
Population Distribution by LGA
Mansakonko
5% Kerewan
13%
Kuntaur
6%
Janjanbureh
8%
Banjul
3%Kanifing
24%
Brikama
28%
Basse
13%

8
With minimal mineral resources or manufacturing sector, agriculture is the primary source of livelihood for many Gambians, accounting for about 40% of the Gambia’s export earnings contributing about 26% of the Gross Domestic Product (GDP). The agricultural sector employs about 75% of rural population. About 78% of working women and 57% of men are directly engaged in cropping, livestock husbandry, or forestry (Jaiteh and A.Saho 2006). Agriculture is predominantly subsistence. Farmers own and manage both crops and livestock, selling surplus to pay for basic needs.
Agricultural policy in the first twenty-five years of post-independent Gambia was driven principally by the need to generate cash to pay for goods and services required for economic development. Through a combination of tax policies, credit facilities, and introduction of mechanization (animal traction), groundnut cultivation increased at the expense of food crops. Expansion of groundnut cultivation peaked in 1980s. Woodland cover in the Gambia decreased to 57% in 1968 and by 2001 only 41% of the total land area was under some form of woodland cover type.
Since the 1990s, increased self-sufficiency in food production and agricultural diversification has been the cornerstone of the government’s agricultural policy. Under the second Poverty Reduction Strategy Program, (PSRP II,) the agricultural sector is the prime area for investments to raise income, improve food security, and reduce poverty as a vehicle to achieving the Vision 2020 objectives and the Millennium Development Goals (MDGs) ―to halve the proportion of poor and those who suffer from hunger.‖ (PSRP-II 2007). The overall objective of the government policy on agriculture is to promote growth on behalf of the poor and to stimulate employment in the rural sector through private sector development. Specific policies seek to promote domestic production of rice and other
key food crops in order to reduce reliance on imports. At the same time, these policies seek to increase diversification by promoting cash crops, such as cotton and horticulture.
1.3. Economic Development Challenges
Despite significant achievements in health, education and infrastructural development, the Gambia remains among the poorest countries in the world, with a Human Development Index ranking of 151st out of 169 (UNDP 2010). In the Global Hunger Index (GHI) The Gambia was ranked 49th (IFPRI, 2009). The GHI incorporates three interlinked hunger-related indicators, namely the proportion of undernourished in the population, the prevalence of underweight in children, and the mortality rate for children. About 61 percent of Gambians live below the poverty line in 2003, up from 62 percent in 1992 (PSRP-II 2007). Although food poverty rose from 33% in 1992 to 37% in 2003, average daily energy consumption per capita rose from 1,570 calories in 1980 to 2,250 calories in 2003 (Delsol, Martin-Prevel et al. 2006).
Poverty rate averaged 57.2% in urban areas and 63.3% in rural areas. Kuntaur LGA has the highest head-count poverty rate of 92.3%, followed by Janjangbureh, 71.7%, and then Kerewan and Basse, with 68.4% and 64.3% respectively. Mansakonko, Kanifing and Brikama have head-count poverty rates of 61.1%, 59.3%, and 54.3% respectively. Banjul, the capital, has the least proportion of poor people, about 10.6%. Households most likely to be poor are characterized by those headed by females and located in rural areas. Female- headed households make up 18% of all rural households, with about 63% of them falling below the poverty line of less than 1USD per day per capita, compared with 48% of male headed households.

9
According to the Integrated Household Survey (2003) definition of poverty based on per capita consumption, the percentage of poor people in the Gambia in 2003 is calculated at 61.2%. The poverty gap index, which is defined as the share in total value of the resources that could be equally distributed to bring the poor out of poverty, is calculated at 25.9%, while the poverty severity (measure of extreme poverty) accounts for about 14.3%. With the exception of Banjul, poverty has increased in both rural and urban areas between 1992 and 2003. Over the past 50 years the urban population of the Gambia has increased from a little over 40,000 in the 1960s to over 700,000, according to a 2010 estimate. One of the
major drivers of urbanization is declining opportunities in rural areas. With increased urbanization, much of the vegetation is replaced by impervious surfaces, thus reducing the area where infiltration to ground water can occur. In the absence of an extensive drainage system, storm water is pushed on to streets. Uncontrolled settlements along natural waterways and quarries, for example, the Kotu stream in Manjai and Bundung, have resulted in a lack of area to channel the runoff water, exacerbating an already serious problem. During the past few years the frequency and severity of these floods have been unprecedented, resulting in extensive spread of disease, tragic loss of life, and huge economic loss.

10
2. The science of climate change and challenges
Climate is the average state of the atmosphere, and the associated characteristics of the underlying land or water, in a particular region over a particular time-scale, usually considered over multiple years (IPCC 2001). Climate variability is the variation around the average climate, including seasonal variations as well as large-scale variations in atmospheric and ocean circulation such as the El Niño/Southern Oscillation (ENSO) or the North Atlantic Oscillation (NAO). Climate change operates over decades or longer time-scales. There is unanimous consensus that anthropogenic climate change is driven by an increase in the atmospheric concentration of so-called greenhouse gases (GHGs that result from the burning of fossil fuels and certain land use practices (Easterling, Meehl et al. 2000). GHGs act to warm the atmosphere by absorbing long-wave radiation emitted from the earth’s surface, which would otherwise escape through the atmosphere to space. The primary contributor to anthropogenic warming is carbon dioxide (CO2), with methane and nitrous oxide being of secondary importance. The Intergovernmental Panel on Climate Change (IPCC), drawing on the published results of leading modeling groups around the world, forecasts an increase in world average temperature by 2,100 within the range 1·4–5·8°C. The increase will be greater at higher latitudes and over land. Global average annual rainfall will increase, although many mid latitude and lower latitude land regions will become drier, whereas elsewhere precipitation events (and flooding) could become more severe (IPCC 2001).
The frequency and intensity of natural disasters are also growing rapidly worldwide. A recent analysis of great natural catastrophes since 1960 shows an increase in the 1990s by a factor of three; this seems to be directly correlated with global warming. Economic losses adjusted for inflation rose by a factor of nine (Easterling, Horton et al. 1997).
Global and regional assessments of vulnerability to climate change have identified the Gambia as one of the most vulnerable countries to sea level rise (Elasha, Medany et al. 2006; McGranahan, Balk et al. 2007). Simulation runs of four Global Circulation Models using locally derived input data have generally produced mixed results. By 2075, mean temperature in the Gambia is expected to increase between 3oC and 4.5oC. Estimates of annual rainfall patterns over the same time period are less consistent, varying between 59% and 29% of current levels (GOTG 2003). Lack of input data from formal sectors and inadequate research in sectoral issues resulted in the use of default values for many model input variables, and consequently there was reduced confidence in the analysis results (Gomez 2002. Unpublished work). The Gambia’s First National Communication to the UNFCCC (2003) and the National Adaptation Programme of Action on Global Change (2007) identified the Gambia to be most vulnerable to increased climate variability (reoccurring droughts and floods) and sea level rise to be some of the major climate change and climate related hazards. Since the mid-1960s the Gambia has experienced observed changes in the climate manifested by declining precipitation trends,

11
increased frequency and length of drought spells and intermitted sometimes catastrophic
flashfloods
Figure 7. Average precipitation (isohyts) over The Gambia during the period 1945-1965 (dashed lines) and in 1965-2005 (solid lines). Adapted from Njie 2007- Gambia NAPA report.
Analysis of long-term meteorological records shows a decline in both average rainfall levels (between 24% and 36%) and length of rainy season (by 15 to 30 days) across the country ((Hutchinson 1982); (Norton, Mills et al. 1989)). Studies also show that during the second half of this century, the country experienced erratic seasonal distribution of rainfall (Hutchinson 1982); (Anyadike 1993). Statistical analysis of rainfall patterns over Banjul based on a 102-year period (1886−1987) established a consistently late onset of rainy seasons between 1968 and 1987, and an early end to the season between 1970 and 1976; and that on average, annual rainfall decreased by 3.54 mm per year (343 mm over the whole period)(Hutchinson 1982; Anyadike 1993).
Anyadike’s analysis of long-term precipitation records in Banjul and Basse (1886 to 1982) showed that 50% of the years between 1886 and 1968 had above average rainfall and only 25% of the years had precipitation below average. However, during the period 1968 and 1990 only 5% of the years had above average rainfall while 75% were dry. Nationally,12 of the last 20 drought years occurred in the last
two decades(Anyadike 1993). A number of observers reported an apparent increase in episodes of torrential rainfall, with heavy runoff and flooding, although little evidence exists to support this claim. However, rapid urban sprawl and inadequate storm-water management systems have significantly contributed to the increased frequency and intensity of flash floods, particularly in urban areas.
2.3. Wind Storms and Floods Climate change is projected to increased variability in amount and distribution of rainfall in the Gambia resulting in frequent extreme climate events (droughts and floods). Floods include flash floods immediately following an abnormally heavy rainfall event or catastrophic seasonal floods along the River Gambia after an above average rainy season. The former is generally compounded by inadequate planning and storm water management infrastructure in urban and populated built-up.
12
Although much of the Gambia is low-lying in potential flood zones, catastrophic seasonal floods like those seen in Pakistan (2010), Ghana, Benin and Burkina Faso (2010), and Queensland Australia (2011) are rare.
The Gambia’s climate is monsoon, with the beginning and end of the rainy season characterized by strong winds (with speeds as high as 50km) (GOTG 2009). These windstorms have over the last decade caused serious property damage in the North and East of the country, notably in the North Bank Region and Upper River Region. Most property damage during the rainy season in The Gambia is the result of windstorms. In Basse alone, 1,795 houses were reported damaged by windstorm in 1999 (GOTG 2009).
During the cool-dry season, atmospheric dust is a major element of the Saharan and
Sahelian environments. Several times each dry season, dry and dust-laden Harmattan winds blanket the country for extended periods. The frequency of occurrence of dust storms has increased in the Gambia over the last twenty-five years. Contributing factors to the increase in dust storms include human impacts such as overgrazing and deforestation, which create a new source of dust. Dust storms are associated with health issues in humans, for example, respiratory problems and meningitis transmission. Meningitis transmission is also associated with over-crowded living conditions; where these risk factors for meningitis are seen as arising from climate change, an increase in the occurrence of meningitis may be associated with climate change. Dust storms also negatively impact agriculture by eroding fertile soil and uprooting young plants, disrupting the flowering cycle in fruit trees.

13
Table 4. Extent of damage due to flooding between 1999 and 2010.
Extent of Damage
Year Hazard People Asset Livelihood (Agriculture) Geographic Extent
1999 Floods 105,288 or 10% of population affected
190 classroom blocks destroyed
D16 million school-related needs of children
5,500 households 650 ha of lowlands rice
fields submerged in CRR
932.75 metric tons of paddy rice lost in CRR
4,500 tons of early millet lost in NBR
Upper Baddibou, NRB Fulladu West, URR Jahally and Patcharr, CRR Sandu, URR, Wulli, URR, Fulladu East, URR Kantora, URR
2003/04 Riverine and flash floods
Over 800 houses
Crop fields Basse, URR
2010 Floods 35,000 affected
9 dead
1442 houses partially destroyed
829 houses completely destroyed
Tons of food crops destroyed
Hectares of cropland submerged
All regions of the country including Banjul and KMC
Source: National Disaster Management Agency Report 2010. Disaster Risk Reduction and Climate Change Adaptation Programme for The Gambia 2009.

14
2.4. Drought The Gambia’s location at the southern fringe of the Sahara desert makes it particularly prone to droughts. Rainfall in the Gambia, as in the rest of the Sahel region, is highly variable from year to year. Meteorological Station data in Banjul between 1951 and 1985 show both a high annual variability in total annual rainfall and a downward trend in mean annual rainfall. Anyadike reported mean annual rainfall between 1950 and 1966 to be 1347 mm, compared to 853mm during the period 1967 to 1985 (Anyadike 1993). Also the length of rainy season had decreased by an estimated 15 to 30 days across the country (Norton, Mills et al. 1989). More than 98% of agricultural lands in the Gambia are rain-fed, so a decline in rainfall (amount and distribution) along with increased temperatures are expected to constrain productivity of crops such as maize, groundnut and millet (Binnewerg and Touray 1999). In 2007 total rice production dropped by about 68% (from 35,900 tonnes in 2002 to 11,395 tonnes in 2007). Similarly the drop in the production of coarse grains (e.g Maize Sorghum, Millet) was about 27% (from 248,400 tonnes in 2003 to 181,400 tonnes in 2007), mainly due to drought that led to reduced yields. Since the 1960s, large areas of freshwater swamps in western Gambia have been replaced by salt pans or salt water marshes, as a result of reduced fresh water inflow from storm runoff.
Poor intra-seasonal rainfall distribution also serves to increase food insecurity, rural poverty, and hardship (Njie 2007)(GOTG 2009). Degraded savannah woodland ecosystems, poor pasture, and insufficient water for livestock in drought years are major constraints on the livestock sector and human livelihood. Indirect effects of droughts are increased forest and woodland degradation through frequent bushfires, changes in land use, and overall reduction in biodiversity.
2.5. Sea level rise and Coastal Erosion
Coastal zones are particularly vulnerable to climate change. Key concerns include sea level rise, land loss, changes in maritime storms and flooding, and salinization of coastal water resources. According to some estimates, global sea level could rise between 80cm and 95 cm by 2100 (IPCC 2001). This increases the number of people in Africa at risk from coastal flooding from 1 million in 1990 to 70 million by 2080 (Elasha, Medany et al. 2006). Also at risk is an estimated 30% of Africa’s coastal infrastructure, including coastal settlements in the Gulf of Guinea, Senegal, the Gambia and Egypt (Elasha, Medany et al. 2006) (Nicholls 1995). Rising sea levels could inundate wetlands and other low-lying lands, erode beaches, intensify flooding, and increase the salinity inland along the river and in groundwater tables. A 1-m rise in sea level could drown about 8.7% of the Gambia’s total land area, which includes over 61% of current mangrove area and over one-third of swampland, while potentially creating new wetlands and mangrove growing areas.
Also at risk of inundation is the whole of Barra and over 50% of Banjul including Banjul Port, the country’s only deep water seaport. Furthermore, groundwater in western Gambia is at risk of increased salinization, and coastal aquifers are at risk of diminishing, which would affect fresh water supplies and peri-urban agriculture. The impact of sea level rise and coastal erosion on tourism and artisanal fisheries sector needs to be highlighted. An increase in sea level would enable saltwater to penetrate farther inland and upstream beyond the estuary area and freshwater wetlands, and to infiltrate ground water aquifers. Increased salinity would be harmful to some aquatic plants and animals, and would threaten human use of water.For example, increased salinity has prevented the

15
continued cultivation of hectares of rice fields in North Bank Region and western parts of
Central River Regions.
Table 5. Area of current land cover that will be inundated by 100 cm (1 m) rise in sea level.
Land cover Total Area (sq)
100 cm rise
Rice field 22,726 4,091.68 Cultivation 295,101 405.60 Palms 4,023 302.72 Plantation 6,761 41.60 Forest 131,754 560.80 Woods 303,844 5,524.80 Mangrove 65,475 40,991.04 Grass land / Low Growth
82,902 1,421.28
Swamp 90,576 31,133.92 Plain Ground 9,344 44.96 Populated Built-up Areas
26,715 168.69
Total 1,039,221 84,687.09 Source: The Gambia 50,000 Database. Ministry of Local Government and Lands 2003
The long-term impacts of 100 cm inundation on mangrove and other wetland ecosystems is not clear in part because little is known about the response of these ecosystems to changing climate. While much is known about the extent of the current ecosystems that could be lost, the extent of the area of new wetlands created by any future sea level increase is not clear, nor the structure and composition of future wetlands. With increased aridity in the sub-region, future new wetlands created by inland migration of the sea would most probably be mangroves and salt marshes. Such an inland migration of mangrove swamps and other saltwater ecosystems would be ecologically both beneficial and disastrous.
2.6. Urbanization Fifty-one percent of Gambia’s population lives in the urban areas, compared to 37% in 1993. Overall, urbanization decreased with distance from Banjul, with about 85% of urban population living within 20km of the Atlantic coast south of the river. Between 1980 and 2001, the populated built-up) area in the Gambia increased from 2,725 ha to over 19,000 ha, with over 50% of the increase occurring in Kombo (KMC and the districts of Kombo). The West Coastal Region, which has seen its built-up area increase from 769 in 1980 to 13,526 ha (2010), encompasses about 50% of all the developed area in the country. The expansion of a paved roads network, electricity, and piped water, and the establishment of housing estates contributed to the rapid growth in urban built-up.

16
Figure 8. Area of land cover categories converted to populated built-up in western region by cover type. Source: The Gambia 50,000 Database. Ministry of Local Government and Lands 2003
Between 2001 and 2010, Kombo North registered the largest increase of populated built-up area (2,100 ha) followed by Kombo South (1,500 ha) and Kombo Central (835 ha). New settlements in KMC are located in reclaimed swamps and flood-prone zones in Jeshwang, Talinding Bakau and Kotu Stream greatly increasing their vulnerability to flooding. About 91% of the expansion of urban built-up occurred in agricultural lands (croplands, orchards, and previously cultivated areas). About 8% of built-up area expansion in western Gambia between 2001 and 2010 occurred in previously woodland ecosystems (Woodland, Forest, and Palms)
with the remaining built-up area expansion occurring in 1% of wetland ecosystems (Mangrove, Swamp, Rice Field and barren flat).
3,623.05
55.16
928.62
0.44 47.73 16.19
1,120.13
39.92 21.59 417.05
-
500.00
1,000.00
1,500.00
2,000.00
2,500.00
3,000.00
3,500.00
4,000.00

17
Figure 9. Composition of area impacted by urban sprawl between 2001 and 2010 in the Gambia. Source:Gambia 50,000 database.
The rapid pace of urbanization accompanied by inadequate drainage and storm water management system has significantly increased the overall vulnerability of urban areas to climate related hazards such as flash floods. In Greater Banjul Area and other
major urban areas, annual flash floods result in loss of human life and property, and increase the risk of a number of water-borne diseases including cholera, diarrhoea, malaria, and water-contact diseases.
Figure 10. Populated/built-up area (ha) in western districts of Kombo and Niumi. 2001 (left) and 2010 (right). Source: Gambia 50,000 database (2001) and The Gambia Parcel Database (2010) by Geospatial Data Solutions.
Rice field <1%
Cultivation 58%
Palms <1%
Plantation 18%
Forest 1%
Woodlands 7%
Mangrove <1% Grass land /
Low Growth 15%
Swamp <1%
Plain Ground <1%
-
1,000.00
2,000.00
3,000.00
4,000.00
5,000.00
6,000.00
7,000.00
K.M.C KomboNorth
KomboCentral
KomboSouth
KomboEast
UpperNiumi
LowerNiumi
Are
a (
ha)
2001
2010
18
3. Impacts on Ecosystem Goods and Services
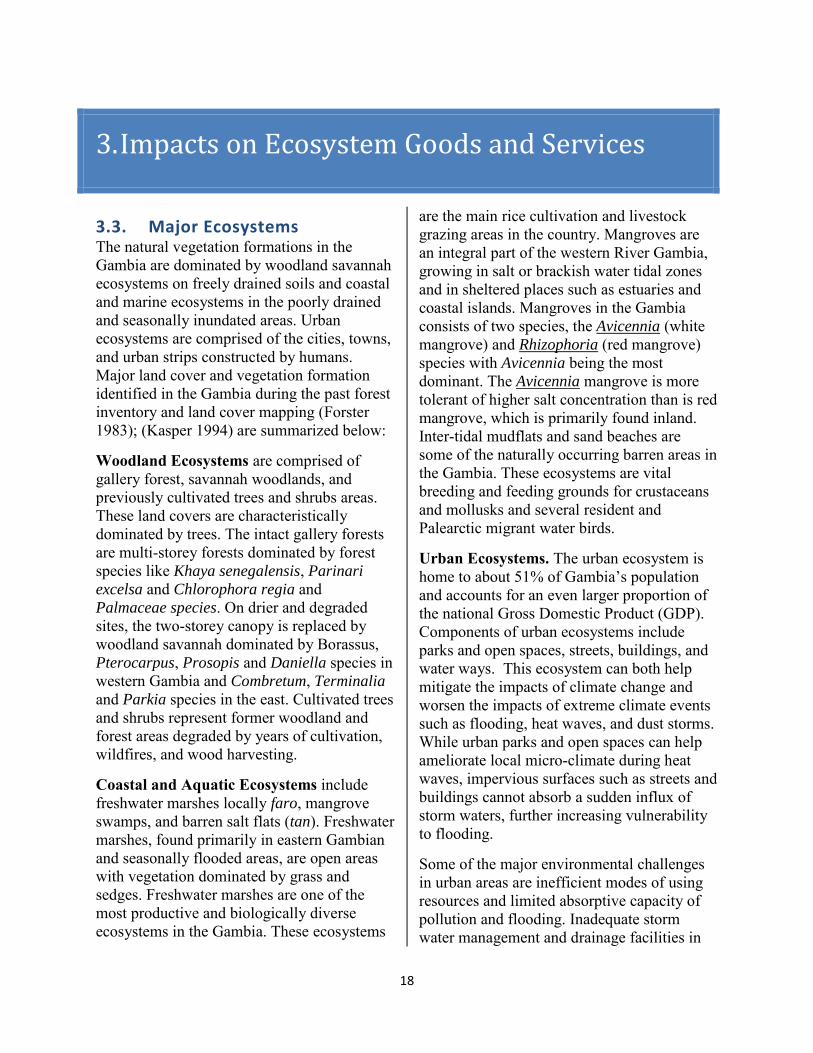
3.3. Major Ecosystems The natural vegetation formations in the Gambia are dominated by woodland savannah ecosystems on freely drained soils and coastal and marine ecosystems in the poorly drained and seasonally inundated areas. Urban ecosystems are comprised of the cities, towns, and urban strips constructed by humans. Major land cover and vegetation formation identified in the Gambia during the past forest inventory and land cover mapping (Forster 1983); (Kasper 1994) are summarized below:
Woodland Ecosystems are comprised of gallery forest, savannah woodlands, and previously cultivated trees and shrubs areas. These land covers are characteristically dominated by trees. The intact gallery forests are multi-storey forests dominated by forest species like Khaya senegalensis, Parinari
excelsa and Chlorophora regia and Palmaceae species. On drier and degraded sites, the two-storey canopy is replaced by woodland savannah dominated by Borassus, Pterocarpus, Prosopis and Daniella species in western Gambia and Combretum, Terminalia and Parkia species in the east. Cultivated trees and shrubs represent former woodland and forest areas degraded by years of cultivation, wildfires, and wood harvesting.
Coastal and Aquatic Ecosystems include freshwater marshes locally faro, mangrove swamps, and barren salt flats (tan). Freshwater marshes, found primarily in eastern Gambian and seasonally flooded areas, are open areas with vegetation dominated by grass and sedges. Freshwater marshes are one of the most productive and biologically diverse ecosystems in the Gambia. These ecosystems
are the main rice cultivation and livestock grazing areas in the country. Mangroves are an integral part of the western River Gambia, growing in salt or brackish water tidal zones and in sheltered places such as estuaries and coastal islands. Mangroves in the Gambia consists of two species, the Avicennia (white mangrove) and Rhizophoria (red mangrove) species with Avicennia being the most dominant. The Avicennia mangrove is more tolerant of higher salt concentration than is red mangrove, which is primarily found inland. Inter-tidal mudflats and sand beaches are some of the naturally occurring barren areas in the Gambia. These ecosystems are vital breeding and feeding grounds for crustaceans and mollusks and several resident and Palearctic migrant water birds.
Urban Ecosystems. The urban ecosystem is home to about 51% of Gambia’s population and accounts for an even larger proportion of the national Gross Domestic Product (GDP). Components of urban ecosystems include parks and open spaces, streets, buildings, and water ways. This ecosystem can both help mitigate the impacts of climate change and worsen the impacts of extreme climate events such as flooding, heat waves, and dust storms. While urban parks and open spaces can help ameliorate local micro-climate during heat waves, impervious surfaces such as streets and buildings cannot absorb a sudden influx of storm waters, further increasing vulnerability to flooding.
Some of the major environmental challenges in urban areas are inefficient modes of using resources and limited absorptive capacity of pollution and flooding. Inadequate storm water management and drainage facilities in

19
urban areas have increased the risk and severity of flooding after rainfall events. In the 2010 rainy season, flash floods in Greater Banjul Area (GBA) caused millions of Dalasi worth of property and infrastructural damage.
3.4. Ecosystem Goods and Services
Healthy ecosystems carry out a diverse array of processes that provide both goods and services to humanity. Ecosystems goods are generally tangible, material products that result from ecosystem processes, whereas ecosystem services are in most cases improvements in the condition or location of things of value in the ecosystems (Daily 1997). Goods refer to items that can be given monetary value in the marketplace, whereas the services from ecosystems are valued, but are rarely bought or sold. Table 6 lists major ecosystem goods and services derived from
savannah woodlands, marine and coastal ecosystems, and urban ecosystems. Land is the single most important ecosystem good in the Gambia, providing for cultivation, grazing, settlement, and infrastructure development. The potential impacts of anthropogenic climate change and climate variability on ecosystems have been well documented in many parts of the world. Direct impacts on ecosystems include physical loss of ecosystems through coastline recession, and inundation by increased sea level rise or by urbanization. Indirect impacts include ecosystem degradation through persistent droughts, bushfires, and increased wood utilization. Persistent droughts result in declining crop yields. As yields decline in drier upland areas, this is often compensated through expansion of cultivation into woodland ecosystems.

20
Table 6. Catalog of ecosystem goods and services in savannah woodlands, aquatic, coastal and urban ecosystems
Ecosystem Ecosystem Goods Ecosystem Services Savannah Woodlands
- Land for crops, livestock, & and settlement
- Construction timber & poles - Fuelwood (firewood and charcoal) - Minor forest products e.g honey,
fruit, and nuts - Wildlife meat - Water (for domestic, agriculture, or
industry use)
- Soil fertility maintenance - Species habitat
maintenance - Run-off control and
maintenance of stream flow and groundwater table
- Maintenance of biological diversity
Coastal and Marine Ecosystems
- Timber for construction and firewood (mangroves)
- Eco-tourism - Rice and horticultural products - Livestock feed (particularly in
CRD) - Fish production - Grass for roofing - Livestock - Water for irrigation
- Flood mitigation and protection of inland ecosystems
- Fish spawning and nursery - Breeding and feed grounds
for Palearctic migratory birds
- Historic and cultural values
Urban Ecosystems - Real estate properties - Manufacturing industries - Transportation and
telecommunication facilities - Provision of jobs, education, and
health facilities
- Provision and maintenance of social safety nets
- Increased efficiency of energy consumption
- Reduced carbon emission
Source: Table adapted from Ecosystems Services Project (Binning, Cork et al. 2001). Ecosystem goods and services information gathered from various sources on forestry, wildlife and fisheries.
3.5. Coastal and Aquatic Ecosystems
The Gambia has an estimated 70 km of open ocean coast and about 200 km of sheltered coast along the River Gambia estuary (Jallow 1999). Except for a number of isolated fisheries and inland port facilities, about 35km of the coastline has had significant infrastructural development. This includes
Banjul, the Tourism Development Area (Bakau Cape Point to Brufut), and Barra Point. The open ocean coastal area consists of entirely sandy beaches while the sheltered areas are covered with mangrove swamp and forest. Since the establishment of the Tourism Development Area (TDA) in the 1970s, the stretch of coastline from Bakau Cape Point to Kartong has had a gradual built-up of settlements, fish landings and market,s and a

21
host of critical infrastructure. By 2010 an estimated 24 major hotels, five fish landing sites, two bridges, the Banjul Port and other national industrial facilities had been built within 200 m of the shore along sandy beach. An estimated 66,000 Gambians depend directly or indirectly on TDA for their livelihood.
Coastal and marine ecosystems are affected by anthropogenic climate change and climate variability in two major ways. Coastal erosion is due to increased wave activity and physical drowning of low-lying areas as sea level rises. In each case the result is coastline recession and physical loss of ecosystems and the services they provide. Coastal erosion, due to unplanned development practices along the beach, is already a noticeable problem (Njie 2007). It is a consensus that the problem is likely to be exacerbated by climate change, specifically by the increase in sea level and frequency of storm surges.
3.3.1 Coastal Erosion
Coastal erosion and coastline retreat has been a major concern in the Gambia for some time now (Jallow 1999; NEA 2004). Using a combination of video recordings, aerial photographs, and topographic data, the studies divided the coastline into nine units on the basis of their geomorphic characteristics and vulnerability to erosion along the 80km coastline (Fig 12). Long-term trends derived from the analysis suggests erosion rates of more than 1 m/year over the last decade, with some sections of the coastline receding while others were experiencing accretion.
The Bruun Rule estimates the land at risk from shoreline recession as a result of sea level rise. It requires the following input parameters: the amount of sea-level rise, active profile width, coastal land height, and the depth of closure. Using long-term historical averages (1972-1993), future erosion rates for the different sections of the beach were estimated, with erosion rates
ranging from 3-4 m per year along the north Banjul shore and accretion rates about the same east of Denton Bridge. Jallow and others used the Bruun Rule to calculate shoreline recession for sandy coasts in the Gambia (Jallow 1999).
Figure 11. Map showing erosion and accretion along the 80km coastline. Source: Coastal Zone Management Handbook for The Gambia, 2004
3.3.2 Sea level Rise
The Gambia is ranked among the top ten countries in the world with the highest share of population living within the lower elevation coastal zone (LECZ) (McGranahan, Balk et al. 2007).

22
A 1 meter sea level rise will submerge over 8.7% of the total land area including the port and capital city of Banjul, and a host of critical facilities including 25.5km of paved roadway in greater Banjul, and all the harbors and ferry landing sites along the Gambia River.
Figure 12. Land area that will be inundated by 100cm sea level rise (shaded). Source: Gambia 50,000 database. Ministry of Local Government and Lands
In addition to submerging populated areas and critical facilities, a 1 meter rise in sea level would inundate over 60% of current mangrove forests, 33% of swamp areas and 20% of rice growing areas. While inundation of mangrove and swamp areas may over the long-term be
compensated by the creation of new mangrove and swamp areas, loss of ecosystem goods and services in the short-term can be substantial, and compensation could not fully address the magnitude of this loss.
Figure 13. Area of each land cover type that will be affected by 100cm sea level rise. Source: Gambia 50,000 database. Ministry of Local Government and Lands
-
5,000.00
10,000.00
15,000.00
20,000.00
25,000.00
30,000.00
35,000.00
40,000.00
45,000.00

23
Over the short-term, the area for rice production might be the most affected, as it makes up 64% of all cropland area that would be submerged by the 1 m sea level rise. While loss of rice areas might in future be compensated by the creation of new wetlands, the overall decrease of available land to an ever-increasing population could not be reversed.
In addition to physical loss of land, an increase in sea level would pose significant threat to coastal aquifers and overall salinity levels along the Gambia River. Adaptation might include coastal protection measures, institutional strengthening for climate-resilient coastal zone development and planning, and/or capacity development at various scales to manage climate-related coastal risks.
3.6. Woodland Ecosystems Woodland ecosystems comprise gallery forest, savannah woodlands, and previously cultivated trees and shrubs area cover types. Of the 450,000 ha classified as woodland ecosystems, only 90,000 (20%) are under official protection as either national forest parks, community forests, or wildlife management areas (Schindele and Bojang 1995).
With minimal commercially viable mineral resources or major manufacturing activity, the Gambia is heavily dependent on agriculture (cash crop cultivation, subsistence farming and livestock raising), accounting for 25% of the GDP and employing 70% of the active labor force (PSRP-II 2007) (Binnewerg and Touray 1999). The ecosystems are the primary source of land for hunting, grazing, cropping, timber for housing and construction, fuelwood and a host of secondary forest products.
The depletion of exploitable West African Mahogany timber was reported in a letter addressed to the British Secretary of State for the Colonies in 1832 (Rosevear 1937). Rosevear went on to say that by 1910 trade in
West African Mahogany had ceased, as almost all the exploitable timber has been cut. Since The Gambia gained independence in 1965, much of the wood is harvested for domestic consumption, resulting in the overexploitation of woodland for charcoal, firewood, and timber processing involving various syndicates (producers, distributors, and retail sellers). This is evident from the proliferation of local machine sawmills for processing logs into various sizes, and the increase in wood vending points in various parts of the country, especially the growth centers.
Historical analysis of land cover suggests that prior to 1940, woodland ecosystems covered as much as 80% of The Gambia’s land area, decreasing to about 42% in 2001. Between 1965 and 2001, cropland area increased from less than 100,000 ha in 1960 to about 320,000 ha in 2001(FAO 2010). Of the area under cropland only 22,750 ha (7%) are classified as lowland crops, with the remaining 93% on previously woodland ecosystems.
Major drivers of this transformation include rampant fires which systematically burn most of the vegetation cover, in combination with other human activities, in particular the practice of shifting cultivation and commercial fuel wood exploitation (Teusan 1999). The process of forest degradation was probably accelerated due to the decline of the mean annual rainfall, and to the adoption of adaptation strategies that relied on cropland expansion to compensate for of loss of soil fertility and productivity, as well as use of forest resources as a secondary source of livelihood and most recently, for survival.
Land degradation is the result of a combination of human-induced and natural processes which negatively affects the productivity of land within an ecosystem. Land degradation in The Gambia is the direct result of interactions between natural processes (increased frequency of droughts) and anthropogenic activities (poor fire

24
management and intensification of cropping, over-grazing, and wood extraction).
Anthropogenic climate change and variability will impact woodland ecosystems in many ways. A 1 msea level rise would inundate 6500 ha of woodland and 40,900 ha of mangrove area within the North Bank, West Coast, and Central River regions.
Increased aridity will contribute to further degradation of the ecosystems. Less drought-
tolerant species (particularly ecological sensitive red mangroves) will die off, decreasing the spatial distribution, composition and function of the ecosystems. Many of these vulnerable species also happen to be the most valuable sources of timber. Over-utilization, wildfires, and cropland expansion (in relatively intact areas) to make up for loss in crop productivity will all contribute to the vicious cycle of destruction.
Figure 14. Area (ha) Forests and woodland ecosystems that will be affected by 100 cm rise in sea level. Source: Elevation and land cover data from the Gambia 50000 GIS database. Ministry of Local Government and Lands
3.7. Biodiversity Geographically, the Gambia lies along an ecotone between arid Sahara and humid rainforests in the south. This combined with the extensive wetland systems along the River Gambia result in a wide range of habitat types supporting a diverse plant and animal species. Known to be native to the Gambia are an estimated 117 species of mammals, about 525 species of birds representing 75 families, 67 species of reptiles, 30 species of amphibians,
and 102 fish species. (Emms and Barnett 2001)(GOTG 1998). Habitat degradation as a result of cultivation, hunting, wildfires and overgrazing have resulted in local extinction of many species over the last one hundred years (Reeve 1912; NAD 1999). Unfortunately, little is known about the status and distribution of invertebrates including Arthropods (insects), Crustaceans, Mollusks, Platyhelminthes (flat worms, round worms), Annelids, Nematodes, and Arachnids as well
-
500.00
1,000.00
1,500.00
2,000.00
2,500.00
BA
NJU
L
K.M
.C
KO
MB
O N
OR
TH
KO
MB
O S
OU
TH
KO
MB
O C
ENTR
AL
KO
MB
O E
AST
FON
I BR
EFET
FON
I BIN
TAN
G K
AR
AN
AI
FON
I KA
NSA
LA
FON
I BO
ND
ALI
FON
I JA
RR
OL
KIA
NG
WES
T
KIA
NG
CEN
TRA
L
KIA
NG
EA
ST
JAR
RA
WES
T
JAR
RA
CEN
TRA
L
JAR
RA
EA
ST
LOW
ER N
IUM
I
UP
PER
NIU
MI
JOK
AD
U
LOW
ER B
AD
DIB
U
CEN
TRA
L B
AD
DIB
U
UP
PER
BA
DD
IBU
LOW
ER S
ALO
UM
UP
PER
SA
LOU
M
NIA
NIJ
A
NIA
NI
SAM
I
NIA
MIN
A D
AN
KU
NK
U
NIA
MIN
A W
EST
NIA
MIN
A E
AST
FULA
DU
WES
T
JAN
JAN
BU
REH
FULA
DU
EA
ST
KA
NTO
RA
WU
LI
SAN
DU

25
as microorganisms including Viruses, Bacteria, Protozoa, Fungi, Lichens and Algae. The Gambia has several protected areas including six national parks and game reserves, 66 forest parks, and one Ramsar site, which promote in-situ conservation. There are only very few ex-situ facilities including the animal orphanage of Abuko nature reserve. There are several coastal and marine habitats of high ecological importance: the Toll point
to cape creek (Camaloo comer), Oyster creek mangrove swamp, Tanji Bird Reserve, Tujereng Lagoons, River Kakima Delta-kachuma forest, Dau Dula to Kartong coastal forest and Kartong point at the Allahein River mouth. Despite great strides in establishing protected area and legislation to protect species and habitats over the past quarter of a century, considerable challenges for biodiversity protection in the Gambia still remain.
Figure 15. Wildlife of the Gambia. Hyena(left), Northern Red Bishop (center) by Gambia Tourism Authority and Chimpanzees (Right) by Gambia Chimpanzee Rehabilitation Project - http://www.chimprehab.com/.
Habitat destruction as a result of urbanization, cultivation, uncontrolled burning, and wood utilization has led to the local extinction of many of well-known species. There are twelve antelope species including the Derbian Eland, Roan Antelope (Hippotragus equines gambianus, the West African Hartebeest (Bubalis major), the West African Situtunga (Tragelaphus
spekii) reported as common to the Gambia(Reeve 1912), but now very few in number. Maxwell’s Duiker (Cephalophus
maxwelli), the bushbuck (Tragelaphus
scriptus typicus) and the Sitatunga are now found only in Niumi National Park and Kiang West National Parks. Of the several other large mammal species reported by
Reeve around 1900, including elephant, giraffe, the Ant-bear, Buffalo, and Hippopotamus, only the Hippopotamus remains (GOTG 1998). Hippopotamus is the only species found around the River Gambia National Park. Among the large animals of prey (lions, leopards, jackals, hunting dogs, and striped and spotted hyenas) reported by Reeve, only the spotted hyena is not locally extinct or endangered. The leopard is reported to be living only in the mangroves of Sine Saloume National Park. Reeve also reported the presence of two species of crocodile, C. cetaphrcatus and C. niloticu, all of which are now confined to reserves and traditional sacred crocodile pools.
26
Projected impacts of climate change and climate variability include habitat degradation and loss of biodiversity:
Habitat degradation. Since 1970s the area of red mangrove (Rhizophora spp) has decreased significantly. Between 1980 and 1993 over-utilization and increased salinity has led to a decrease in total surface area of mangroves by 650 ha per year. Hyper-salinity of the estuary due to reduced fresh water inflow from storm runoff is blamed for die-back of red mangrove. Increased demand for firewood and poles for construction has resulted in over-exploitation of high mangroves in Central River and North Bank Regions. An increase in sea level over the long term could result in the conversion of freshwater ecosystem swamps to open water or salt marshes, displacing species that depend on them.
Biodiversity Loss. Mangroves and other wetland ecosystems are breeding ground and nursery ground for a large number of migratory and resident bird species. Increased droughts, over-exploitation, and land use change will continue to reduce the area under these ecosystems. estimated that about 1000 ha of savannah woodland is converted to croplands each year (Teusan 1999). As urban built-up continues to expand in Kombo, forest parks and wildlife management areas are reduced to isolated patches, leaving wildlife populations in these patches isolated. Indirect efforts to compensate for loss of productivity in upland areas by expanding cultivation in wetlands could result in a decrease in wetland species diversity.

27
4. Economic Impacts and Vulnerability to
Climate Change
Vulnerability is defined by the IPCC as ″the degree, to which a system is susceptible to, or unable to cope with adverse effects of climate change, including climate variability and extremes.″ In this respect vulnerability is seen as the function of the character, magnitude, and rate of climate variation to which a system is exposed, its sensitivity and its adaptive capacity‖ (IPCC, 2001). The high vulnerability can be attributed to a large extent to low adaptive capacity to the prevailing climate. A deteriorating ecological base, widespread poverty, a high dependence on the natural resource base, and diseases such as malaria are some of the contributing factors to low adaptive capacity. Improving the adaptive capacity is important in order to reduce vulnerability to climate change.
4.1. Agriculture and Natural Resources
The Gambia’s economy is predominantly agrarian, with about one third of the land area under some form of agricultural use. The agriculture and natural resources sector employs about 68% of the labor force as well as being the major source of food for the majority of Gambians.
Agriculture is dominated by subsistence rain-fed crop production and traditional livestock rearing. Efforts to diversify agriculture include the introduction of improved groundnut production, horticulture, cotton and sesame production, and artisanal fisheries. Currently, most of the industrial activity in this sector is limited to groundnut milling, with a wide range of cottage industry in cereal processing,
dairy processing, sesame oil extraction, and fish processing. In the livestock and fisheries sub-sectors the production systems are predominantly artisanal.
4.1.1 Croplands
Agriculture plays an important role in the economy, contributing about 25% of GDP (GBoS 2009), and agriculture provides the main source of income, employment, and food supply to over 75% of the rural population. Groundnuts and its by-products contribute over 90% of export earnings, with crops apart from groundnuts collectively contributing to 43% of the agricultural GDP. On average an estimated 320,000 ha (57% of total arable land of 558,000) is cultivated annually during this decade 2000 -2010 (GOTG 2003; GOTG 2003).
Cereals make up about 51.6% of this area, with the remaining 48.4% under cash crop oil seeds, namely groundnut and sesame. Groundnut is the single most widely grown crop, occupying about 44% of the area, followed by millet at 32%. Yields are generally low and vary from year to year depending on rainfall. Horticultural production, which is a significant dry season farming activity is presently an established key source of rural income, engaging over 65% of the agricultural labor force.
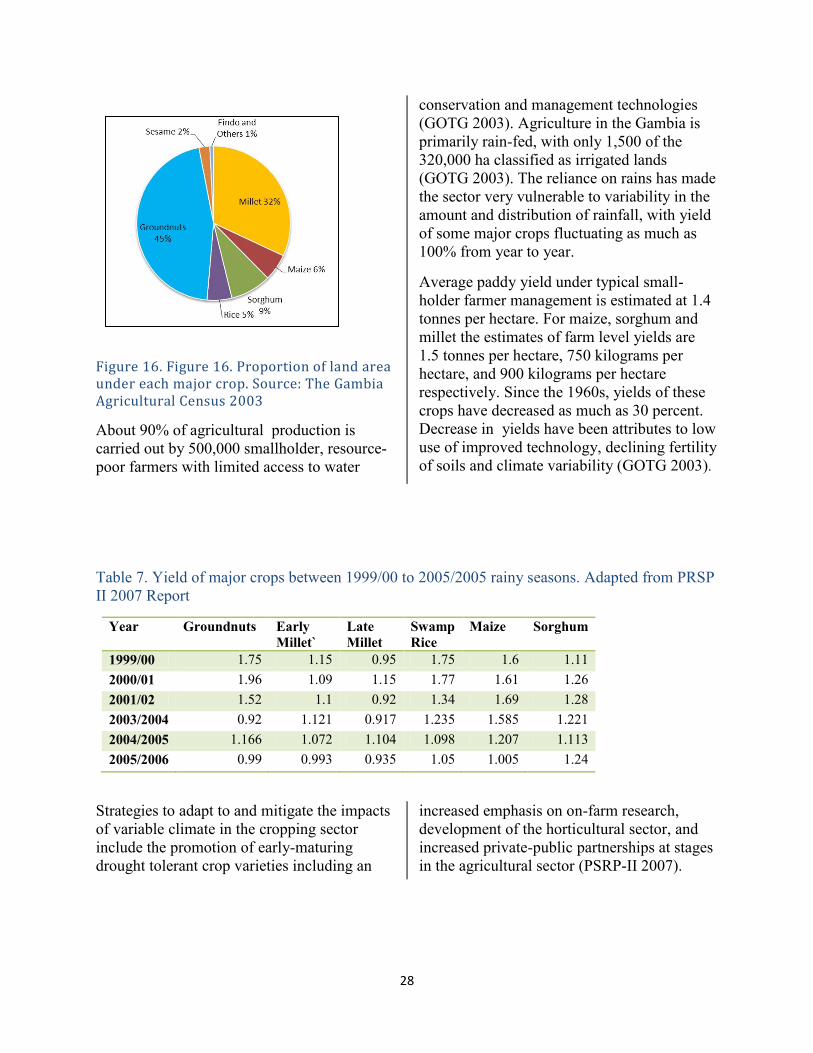
28
Figure 16. Figure 16. Proportion of land area under each major crop. Source: The Gambia Agricultural Census 2003
About 90% of agricultural production is carried out by 500,000 smallholder, resource-poor farmers with limited access to water
conservation and management technologies (GOTG 2003). Agriculture in the Gambia is primarily rain-fed, with only 1,500 of the 320,000 ha classified as irrigated lands (GOTG 2003). The reliance on rains has made the sector very vulnerable to variability in the amount and distribution of rainfall, with yield of some major crops fluctuating as much as 100% from year to year.
Average paddy yield under typical small-holder farmer management is estimated at 1.4 tonnes per hectare. For maize, sorghum and millet the estimates of farm level yields are 1.5 tonnes per hectare, 750 kilograms per hectare, and 900 kilograms per hectare respectively. Since the 1960s, yields of these crops have decreased as much as 30 percent. Decrease in yields have been attributes to low use of improved technology, declining fertility of soils and climate variability (GOTG 2003).
Table 7. Yield of major crops between 1999/00 to 2005/2005 rainy seasons. Adapted from PRSP II 2007 Report
Year Groundnuts Early Millet`
Late Millet
Swamp Rice
Maize Sorghum
1999/00 1.75 1.15 0.95 1.75 1.6 1.11 2000/01 1.96 1.09 1.15 1.77 1.61 1.26 2001/02 1.52 1.1 0.92 1.34 1.69 1.28 2003/2004 0.92 1.121 0.917 1.235 1.585 1.221 2004/2005 1.166 1.072 1.104 1.098 1.207 1.113 2005/2006 0.99 0.993 0.935 1.05 1.005 1.24
Strategies to adapt to and mitigate the impacts of variable climate in the cropping sector include the promotion of early-maturing drought tolerant crop varieties including an
increased emphasis on on-farm research, development of the horticultural sector, and increased private-public partnerships at stages in the agricultural sector (PSRP-II 2007).

29
Figure 17. Cropland area that will be inundated by 1 m sea level rise in each district. The Gambia 50,000 GIS Database. Ministry of Local Government and Lands
4.1.2 Livestock
The livestock sector contributes about 25% to agricultural GDP and 5.5 % to the national GDP (GBoS 2009). Over the last 25 years, livestock population remained at around 300,000 cattle, 130,000 sheep, and 230,000 goats. Livestock practices are primarily subsistent, with 60% of all animal feed from natural rangeland and stubble grazing, 15% from harvested crop residues, and the remainder from household refuse and agro-industrial by-products (GTZ 1999).
The sector is constrained by a number of environmental conditions and management practices, including persistent droughts; decrease in area and quality of traditional pastures through land use change and persistent droughts, bushfires, and overgrazing; and over-dependence on traditional management practices that favor numbers over quality of stock.
4.2. Water Resources Water resources in the Gambia fall under surface and groundwater. Surface water comprises the Atlantic Ocean and the River Gambia and its tributaries. The Gambia has claim to 20,530 sq. km of exclusive economic zone in the Atlantic Ocean, of which 3,855 sq. km is continental shelf (Barrow). The River Gambia and tributaries occupy 1300 sq. km permanent surface water area. During the height of the flood season, inland surface water including the River can extend over 1,965 km2 , about 18% of the total area of the country.
4.2.1 Surface Water Resources
The Gambia River, with a catchment area of 77,000 km2 and a length of about 1,150 km, runs from the Fouta Jallon highlands in the Republic of Guinea through Senegal to The Gambia. The mean annual discharge at Goulombo, 490 km from the mouth, was on
-
100.00
200.00
300.00
400.00
500.00
600.00
700.00
800.00
BA
NJU
LK
.M.C
KO
MB
O N
OR
THK
OM
BO
SO
UTH
KO
MB
O C
ENTR
AL
KO
MB
O E
AST
FON
I BR
EFET
FON
I BIN
TAN
G K
AR
AN
AI
FON
I KA
NSA
LAFO
NI B
ON
DA
LIFO
NI J
AR
RO
LK
IAN
G W
EST
KIA
NG
CEN
TRA
LK
IAN
G E
AST
JAR
RA
WES
TJA
RR
A C
ENTR
AL
JAR
RA
EA
STLO
WER
NIU
MI
UPP
ER N
IUM
IJO
KA
DU
LOW
ER B
AD
DIB
UC
ENTR
AL
BA
DD
IBU
UPP
ER B
AD
DIB
ULO
WER
SA
LOU
MU
PPER
SA
LOU
MN
IAN
IJA
NIA
NI
SAM
IN
IAM
INA
DA
NK
UN
KU
NIA
MIN
A W
EST
NIA
MIN
A E
AST
FULA
DU
WES
TJA
NJA
NB
UR
EHFU
LAD
U E
AST
KA
NTO
RA
WU
LISA
ND
U
Are
a (h
a)

30
the order of 250 m3/s between 1953 and 1981 with a once in ten years flood discharge recorded at about 2000 m3/s(NEA 2004). Long-term records revealed river discharges to be smaller compared to the peak tidal discharges, which vary between 2,500 m3/s and 4,000 m3/s at Kaur, 200 km from the river mouth, and 30,000 m3/s to 45,000 m3/s at the river mouth of the estuary at Banjul (NEA 2004).
Ecological studies conducted in the 1980s identified five ecological zones along the Gambia River: lower estuary, upper estuary, lower freshwater river, upper freshwater, and headwaters (Harza 1985). However, only three zones—the lower estuary, upper estuary, and the lower freshwater river— lie within The Gambia’s borders.
The lower estuary is the wide and relatively shallow part of the river from the Atlantic Ocean to 120 km upstream. This zone is primarily an extension of and heavily influenced by coastal marine waters of the Atlantic Ocean. In the lower estuary, the river is funnel-shaped, causing the river to be slow flowing, which allows tidal waves to move into the lower reaches of the river (Moll and Dorr 1985.) The river is up to 15 km wide and relatively shallow, with the main channel some 3.5 km wide and up to 12 m deep running in the middle. On either side of the river are extensive tidal mud flats up to 2 km wide. The banks of the lower estuary are covered with mangrove forests extending up to 10 km from the river. The marine characteristics and large amounts of mangrove detritus make the lower estuary valuable breeding and nursery ground for a large number of marine fish species.
The upper estuary extends from 120 km to 240 km upstream. Although similar to the lower estuary in that both contain brackish water and bordering mangrove forests, the upper estuary differs from the lower in many ways. Seasonal flooding influences water
quality and thus the fauna and flora that are found in this zone. The main channel of the river in this zone though only 500 m wide (at Elephant Island) is nearly 18 m deep. Mangrove forests around this zone extend up to 3 km away from the river along bolons. Beyond the mangroves are seasonal floodplains. Annual floods produce significant changes in the physical and chemical conditions in this zone. During the rainy season, floodwaters change the zone to freshwater, resulting in a change in fish species from marine to freshwater species. The brackish waters also allow rice cultivation during the rainy season. During the dry season or drought years, saltwater influx from the Atlantic Ocean changes the zone into a saltwater environment. The lower freshwater river around Kuntaur extends 240 km to the Gambia’s eastern border.
4.2.2 Ground water Resources
The Gambia’s ground water resources are extensive. Four major aquifers within the Gambia River Basin have been identified, namely, Shallow, Eocene Sand, Maestrichtian Sand and hard rock ( Harza 1985). The shallow aquifer, ranging from 0 m to 50 m in depth, underlies all of the Gambia and eastern Senegal. The Eocene Sand Aquifer extends from the southern boundary of the River Basin into Cassamance, with water depths ranging between 50 m and 100 m. However, the exact extent of this aquifer in the Gambia is not well known. Both the Maestrichtian and Hardrock Aquifers are found throughout the basin, with water depths for the former ranging from 0 m in eastern Senegal to 500 m at the coast, while the exact extent of the former is not yet known.
Until 1990 groundwater use was primarily domestic. Since 1990 however, commercial agricultural use of the country’s groundwater resources has been on the rise. The proliferation of commercial vegetable farms in Western Gambia has resulted in rapid increase

31
in the commercial agricultural use of groundwater in the Gambia, but the total amount of commercial water use and the impact on groundwater resources is yet understood. The Total Renewable Water Resources (TRWR) in the Gambia is estimated to be 8.0 km3/yr, of which 5.0 km3 (62.5%) flows into the country from Senegal and Republic of Guinea (FAO 2010). Surface water produced internally is estimated at 3.0 cu. km per year with annual internally renewable groundwater estimated at 0.5 km3.
The Gambia’s annual freshwater withdrawal is estimated at 30.6 million cu. meters, about 0.38 percent of annual total renewable water resources. This amounts to a per capita consumption of 22 cubic meters, compared to 163 cubic meters in Senegal and over 1690 cubic meters in the United States (FAO/AQUASTATS 2010). About 65% of water withdrawal goes to agricultural use. Overall, water use has increased by 50% between 1982 and 2000,with industrial and domestic water use registering the largest increase —725% and 385% respectively compared to just 12.3% increase in agricultural water use. Rapid increase in urban population and economic activity over the 20 year period are two factors responsible for the increase.
Figure 18. Agricultural, domestic and industrial water use in the Gambia in 2008. Source: FAO/AQUASTATS 2011
4.2.3 Vulnerability to Climate Change
The Gambian waters provide for both marine and riverine fish habitats, with more than 800 freshwater and marine species. These species are exploited at three levels in terms of the approach to fishing: industrial, artisanal, and small-scale subsistence. The average annual per capita fish consumption is estimated at 23 kg higher than other sources of protein (livestock and poultry).
The Gambia possesses three distinct fish habitats: fresh water, brackish water, and marine habitats. The ichthyofauna in both riverine and marine systems consists of more than 800 fish species, a significant source of protein for the population (Darboe and Bojang 2005). The marine waters contain more diverse fish species, with about 500 species, while the riverine system, including the estuary, contains about 70 fish species. The estimated total fish harvest potential is over 80,000 metric tons, although there is little empirical data to support this. In 2002 fish production was recorded at 46,496 metric tons (Darboe and Bojang 2005).
The fisheries sector is comprised of the industrial and artisanal fisheries sub-sectors and contributes about 12% to GDP employing about 36,000 people. Fish is the major source of protein for most Gambians, with per capita fish consumption about 23 kg higher than other sources of protein (livestock and poultry). The marine and coastal fisheries provide for the bulk of the fish; consequently, any negative fluctuation in fish stocks in these areas— which various climate change scenarios predict will occur—will severely impact the wellbeing of the population.
The Gambia fisheries and fish resources are vulnerable to climate change and variability in a number of ways. Since the 1960s, the Gambia has experienced a decrease in both the amount and distribution of rainfall (Anyadike 1993) and in increased salinization in the estuary zones, resulting in mangrove die-back
Agric Water use
67%
Domestic Water use
22%
Industrial Water use
11%
Water Use

32
and desiccation of freshwater fish spawning areas. An increase in average temperature and reduced precipitation projected by GCM models (GOTG 2003) will affect the fisheries sector by altering fish habitat availability and quality, and the potential for the habitat to sustain fish communities. It has been noted that during the seventies droughts, many freshwater fish species such as Gymnachus
niloticus, Herterotis niloticus, Clarids, and
Cichlids have suffered systematic spawning and recruitment failures and reduced populations as a result of hyper-salinization of spawning grounds (Darboe and Bojang 2005).
With the expansion of urban areas the risk of dumping organic-rich effluents in the river will increase, potentially leading to algae bloom. In the Gambia, urban oyster harvesting, which provides income and livelihood for many harvesters as well as nutrition for many urban dwellers, could be severely affected by the dumping of waste in the river. Toxic algae bloom may impose other health hazards for the human populations as well.
An estimated 848 sq km will be inundated by a 1 m sea-level rise, of which mangrove and other wetland ecosystems make up over 85%. These ecosystems are valuable breeding and nursery habitat for almost all marine fish and crustacean species. The intertidal mangrove oyster (Crassosstrea tulipa), which extensively colonizes fringe mangroves (Rhizophoria raccemossa) along the estuary has adapted to frequent inundation and exposure as a strategy to outwit its competitors on the substrate (Mangrove roots). But permanent inundation or reduced exposure time would result in heavy predatory mortality on oysters, their stunted individual growth and an eventual collapse of the population and the fishery (Darboe and Bojang 2005).
4.3. Energy Climate change and variability is expected to have a direct effect on both energy supply and demand, as well as on energy- related infrastructure. The energy sector is affected by the potential changes in extreme events (heat waves), but also from persistent droughts resulting in land use change and degradation of woodlands. In relation to energy demand, urbanization and higher average temperatures will increase demand for both electricity in cooling and fuelwood for cooking. Electricity generation remains relatively under-developed in the Gambia, with total generating capacity estimated at 60MW. Of these the National Water and Electricity Company Ltd (NAWEC) generates about 30MW, independent power producers 22MW, and the remaining 8MW by private stand-alone generators. About 90% of generation capacity is confined to Banjul and Kombo, with only 10% in rural areas. In 2007, 4MW generating capacity was added outside GBA as part of the Rural Electrification Project. Despite these new additions, the total generating capacity supply is far less than demand. Electricity use is disproportionately confined to government, commercial, and industrial sectors. At the private household level, electricity constitutes only 27% of lighting fuel and less than one-tenth of one percent of cooking fuel (Jaiteh and A.Saho 2006). Wood fuels are by far the dominant domestic source of energy in the Gambia, with 88% of all households using firewood, charcoal, or wood-based fuels as the primary source of cooking fuel. Alternative renewable fuels like solar or wind, though on the increase, are still of limited use.

33
Figure 19. Composition of cooking fuels used in The Gambia in 2002. Based on The Gambia 2003 Population and Housing Census Data. Adapted from Jaiteh and Saho 2006.
The over-reliance on wood fuels as the primary source of domestic energy is continuously affecting the country’s forest resources and natural vegetation cover at an alarming rate, causing general environmental degradation and hence low biological productivity(IMF 2009). Efforts to reduce this dependence through the use of Liquefied Petroleum Gas (LPG) have met little success primarily due to its high cost and irregular supply. Until suitable alternatives to wood fuels are found, The Gambia’s energy dependence on woodland ecosystems will continue to grow as population and urbanization grows. In addition, increased urbanization will continue to drive up demand for electricity for the foreseeable future. Over the long-term, urbanization may help reduce dependence on wood fuels for cooking as other sources of energy, namely LPG and electricity, become competitive. As climate change-induced droughts, wild fires and land use change increases in a future, less and less fuel wood will be available to the rapidly growing population.
4.4. Urban and Infrastructure Anthropogenic climate change manifested through sea level rise, ground water salinization, and increased frequency of flash floods would have devastating environmental, social, and economic consequences for urban Gambia. Receding coastlines following a 100 cm sea level rise would have catastrophic consequences for low-lying built-up areas.
Figure 20. The Waliba Kunda Bridge, partly damaged by the floods. Source: Mawdo Jallow, URD
While the area of built-up land impacted by a sea level rise of 100 cm would be significantly smaller than the area of other land cover types, the economic, financial, and social implications would be much greater. For example, in Banjul an estimated 19.5 km of paved highway including the Banjul-Serrekunda Highway, 5.1 km of secondary roads, and 31 km of other roads and track would be inundated by a 1 meter sea level rise. The economic cost of taking these roadway out of use even temporarily, and the associated disruption to countless social and commercial enterprises, would be substantial. During windstorms and heavy downpours, roads, bridges, and houses are the most affected, and these cost significantly more to replace than food and other properties.
Cooking Fuel in 2003
Firewood
83%
Kerosene 0.2%
Briquet 0.1%
Charcoal 4.5%Liquified Propane
Gas 4%Electricity/Solar
0.1%
Saw Dust 0.5 %Not Stated 8%
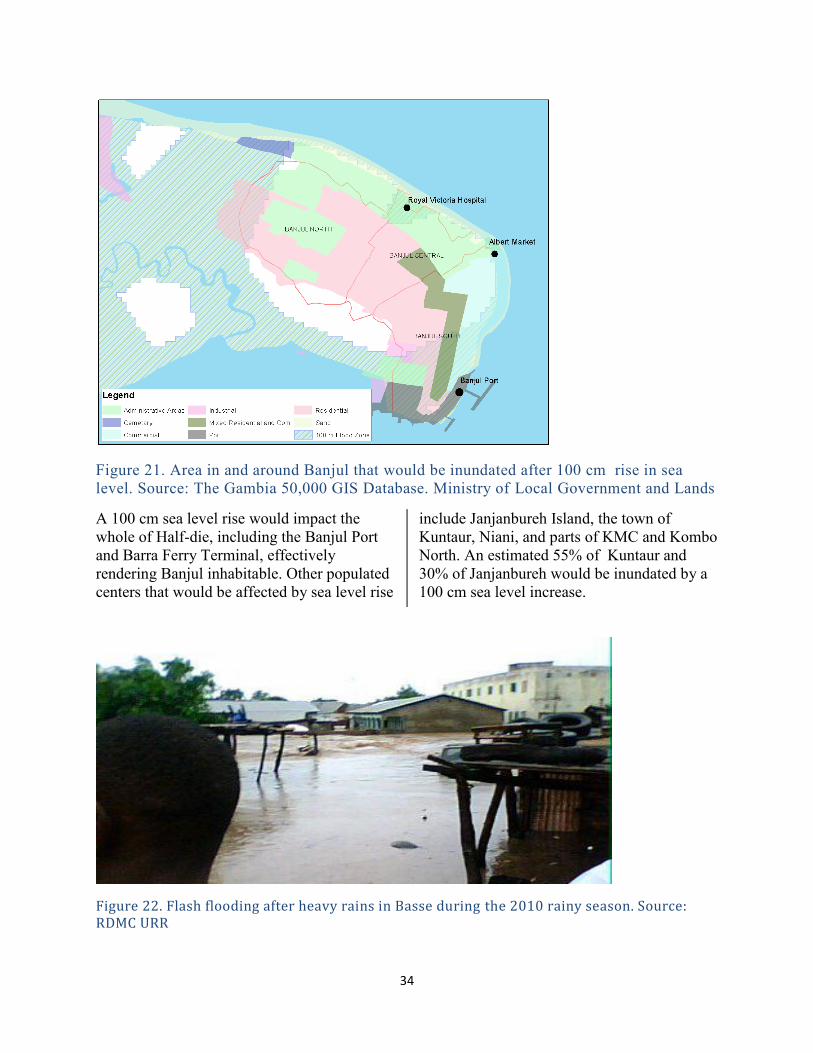
34
Figure 21. Area in and around Banjul that would be inundated after 100 cm rise in sea level. Source: The Gambia 50,000 GIS Database. Ministry of Local Government and Lands
A 100 cm sea level rise would impact the whole of Half-die, including the Banjul Port and Barra Ferry Terminal, effectively rendering Banjul inhabitable. Other populated centers that would be affected by sea level rise
include Janjanbureh Island, the town of Kuntaur, Niani, and parts of KMC and Kombo North. An estimated 55% of Kuntaur and 30% of Janjanbureh would be inundated by a 100 cm sea level increase.
Figure 22. Flash flooding after heavy rains in Basse during the 2010 rainy season. Source: RDMC URR

35
Figure 23. Current land area in Western Gambia that would be inundated by a 100 cm rise in sea level. Red line indicating current coastline. Source: DEM and administrative boundary data- The Gambia 50,000 GIS Database 2003. Ministry of Local Government and Lands
Figure 24. Location of current populated built-up areas that would be affected by 1 m sea level rise. Source: The Gambia 50,000 GIS Database 2003. Ministry of Local Government and Lands
0.00
10.00
20.00
30.00
40.00
50.00
60.00
BA
NJU
LK
.M.C
KO
MB
O N
OR
THK
OM
BO
SO
UTH
KO
MB
O C
ENTR
AL
KO
MB
O E
AST
FON
I BR
EFET
FON
I BIN
TAN
G…
FON
I KA
NSA
LAFO
NI B
ON
DA
LIFO
NI J
AR
RO
LK
IAN
G W
EST
KIA
NG
CEN
TRA
LK
IAN
G E
AST
JAR
RA
WES
TJA
RR
A C
ENTR
AL
JAR
RA
EA
STLO
WER
NIU
MI
UP
PER
NIU
MI
JOK
AD
ULO
WER
BA
DD
IBU
CEN
TRA
L B
AD
DIB
UU
PP
ER B
AD
DIB
ULO
WER
SA
LOU
MU
PP
ER S
ALO
UM
NIA
NIJ
AN
IAN
ISA
MI
NIA
MIN
A D
AN
KU
NK
UN
IAM
INA
WES
TN
IAM
INA
EA
STFU
LAD
U W
EST
JAN
JAN
BU
REH
FULA
DU
EA
STK
AN
TOR
AW
ULI
SAN
DU
Are
a (h
a)
Barra
Kuntaur Janjanbureh
Banjul

36
4.5. Human health and wellbeing Throughout the world, the prevalence of some diseases and other threats to human health depends largely on local climate. Extreme climate events such as heat waves, flooding, and droughts directly or indirectly affect human health. Heat waves, though rare, can lead directly to loss of life, while flooding can lead to an increase in mosquito breeding areas which may then lead to malaria epidemics. In addition, warm temperatures can increase air and water pollution, which in turn harm human health. Human health is strongly affected by social, political, economic, environmental and technological factors, including urbanization, affluence, scientific developments, and individual behavior and individual vulnerability (e.g., nutritional status, emotional well-being, age, gender and
economic status) (USGCRP 2008). The extent and nature of climate change impacts on human health vary by relative vulnerability of population groups, by the extent and duration of exposure to a climate event itself, and by society’s ability to adapt to or cope with the change. Increased flooding could put more people at risk from injury and drowning (Conteh, Njai et al. 2005). Frequent and persistent flooding would also increase the likelihood of the spread of waterborne diseases such as malaria and schistosomiasis and their disease vectors. Other indirect health risks of climate variability include exposure to environmental pollutants that may be present in flood waters; saturation of particulate matter and resultant poor air quality during heat and dust storms; and loss of life during wild fire.
Table 8. Health hazards and potential consequences in the Gambia. Adapted from National Disaster and Climate Adaptation Program .
Hazard Consequences for human health and wellbeing
Dust storms Entire country covered in dust for days at a time, worsening the medical conditions of people with respiratory ailments and in extreme cases reducing visibility.
High incidence of meningitis epidemic
Floods Increase in mosquito breeding grounds, leading to malaria epidemics
Increased contamination of water leading to outbreak of water-borne and water-contact disease
Loss of life through collapse of buildings and drowning Indirect effecting on human wellbeing via damage to
crops and food stock Droughts Loss of life during extreme temperatures
Crop damage or total loss leading to food shortage and hunger, high infant and maternal mortality rates
Loss of livestock due to water and feed shortage

37
5. Integrating climate adaptation and
development strategies
As adverse effects of anthropogenic climate change and variability become evident in The Gambia, several adaptation and mitigation efforts have been put in place to ensure that developments and strategies adopted by the government and people of The Gambia materialize. In response to land degradation and declining yields, lowland agriculture has become an important adaptation strategy.
Some strategies to increase food security and reduce poverty particularly among rural populations, that have been implemented by successive Gambian governments include crop diversification and the introduction of improved poultry and livestock production systems. This involves the introduction of early maturing crop varieties to address drought-related problems; the promotion of irrigation for horticultural crop production, especially upland crop and other short cycles of crops such as peanuts; and the introduction of aquaculture for supply of required protein.
5.1. Millennium Development Goals and PRSP-II
The Poverty Reduction Strategy (PRSP) provides the common framework for poverty reduction efforts in The Gambia. The PRSP sets an ambitious pace to meet the Millennium Development Goals (MDGs) in over five years. The pillars of PRSP-II are closely aligned with the Millennium Development Goals (MDGs), namely:
1. create an enabling policy environment for economic growth and poverty reduction
2. increase the capacity and output of the productive sectors —agriculture, fisheries, industry, trade, and tourism (MDG 1)
3. improve the delivery of basic social services, health (MDG 4, 5, and 6) and education (MDG2)
4. enhance local governance and decentralization, and
5. include mainstream issues related to gender (MDG 3), youth, population, HIV/AIDS (MDG 6), nutrition, and the environment (MDG 7) in the development process
Climate change has the potential to undermine Gambia’s economic development, increase poverty, and delay or prevent the realization of both PRSP-II pillars and Millennium Development Goals (MDGs) (Pachauri 2004). Particularly, the lack of effective adaptation to frequent and persistent droughts, floods, sea level rise, coastal erosion, and saltwater intrusion into ground water aquifers can jeopardize the achievement of Millennium Development Goal 1 (eradicating extreme poverty and hunger), Goal 6 (combatting HIV/AIDS, malaria and other diseases) and Goal 7 (ensuring environmental sustainability). The introduction of a new policy instrument called the Program for Accelerated Growth and Employment (PAGE) is being implemented within the framework of the PRSP and MDGs. With population density over 128 persons per sq km, the Gambia is one of the most densely

38
populated countries in Africa. Climate change and variability is likely to reduce the physical size of the productive capacity of the land, which would increase competition for already scarce resources, such as freshwater, land, or fish resources, undermining productivity. As upland crop yields fall, pressure to expand cultivation in the wetland ecosystems would increase at the expense of environmental sustainability or livestock management.
5.2. Climate Adaptations and Mitigation Strategies
Coping with extreme climatic events like floods, drought, wind, and dust storms is not new to the peoples of the Gambia. Over the years both government and non-government organizations have conducted many studies which culminated in the initiation of a number of activities to minimize the adverse effects of extreme climate events (GTZ 1999; NEA 2004; Darboe and Bojang 2005; Njie 2007). These activities for the most part helped lower the number of deaths and damage to property.
However, climate change combined with rapid and often unplanned urbanization would present new and complex challenges requiring complex adaptation mechanisms. The strategic goals and objectives of future adaptation mechanisms will be to reduce the adverse effects of climate change, including variability and extreme events, and promote sustainable development.
5.2.1 Sea Level Rise
Addressing future problems related to sea level rise appears to be a complex issue requiring a consideration of both physical structures and careful land use planning. No adaptation measure can entirely eradicate the adverse impacts of sea level. A part of the cost, however small, has to be borne by the society. To strengthen the capacity to increase resilience and withstand losses, insurance mechanisms need to be strengthened and sensitized to possible future needs. Areas of focus for such insurance provisions might
include crop failures, losses due to coastal erosion and storm surges, and other natural hazards. Key priorities for adaptation and mitigation strategies to sea level rise include:
Construction of protective seawalls and flood control systems in low-lying urban centers like Banjul, Barra, and Janjanbureh to help protect critical facilities. Since colonial times both Banjul and Janjanbureh have had well-established drainage and flood control systems. Priority should be given to rehabilitation and upgrade of the drainage systems to include the establishment of automated pumps around key facilities.
Develop a medium- and long-term
strategic plan for beach replenishment and maintenance between Brufut and Banjul. Regular beach replenishment along actively eroding beaches along the coast will help slow down coastline recession process. Such plans should include a master plan of infrastructure development along the coast, as well as related regulations to administer
Development of a legal framework to
protect all mangrove areas from harvesting or exploitation
Early warning system for flood
prevention, particularly in the event of catastrophic 100-year floods
5.2.2 Drought
With agriculture in the Gambia predominantly rain-fed, crop and livestock production is totally dependent on the availability of rains. Increased frequency and severity of drought events as projected by climate modelers (GOTG 2003) could negatively impact any

39
future gains obtained by crop diversification and other improved agricultural technologies. Prolonged and frequent droughts would reduce the availability of firewood (the primary source of domestic cooking fuel), construction wood and other forest products, and increase salinity in coastal ecosystems. Adaptation and mitigation strategies should focus on reducing the dependency on rainfall by agricultural activity as well as protect ecosystems at risk from other natural or anthropogenic hazards that accompany droughts, such as bushfires, saltwater intrusion, and land use change. Specific adaptation and mitigation strategies should:
Continue efforts to control use of bushfire and preserve the remaining woodlands from conversion to croplands or over-exploitation.
Continue to promote reforestation
efforts as way to regain lost cover. Such efforts should be extended to include mangroves.
Promote investment in research and development to broaden livestock-based livelihoods.
Encourage rainwater harvesting at the
household and community level to maximize use of available water and reduce the impact of storm-water run-off, particularly in urban centers.
In the fisheries sector, place great
emphasis on monitoring water quality in key fish habitats, as well as on instituting sustainable management of fisheries resources.
Protect fish breeding and nursery
grounds should be from drowning or desiccating droughts
Introduce aquaculture to help meet
growing demand for fish products
Research salt-tolerant varieties of crops to help maintain productivity as salinity increase
Improve energy access and security
through alternative sources of cooking fuel such as LPG and Solar Power
Regulate and promote efficient use of
water, particularly in the urban centers. Coastal Gambia depends entirely on groundwater for both domestic and industrial water, and for irrigation. Unless adequate measures are in place, these aquifers, some of which are the most vulnerable to saltwater intrusion, could be rendered unusable.
5.2.3 Windstorm
The Gambia’s climate is monsoon, with the beginning and end of the rainy season characterized by strong winds (with speeds as high as 50km) (GOTG 2009). These windstorms have over the last decade caused serious damage to properties in the north and east of the country, notably in the North Bank Region and the Upper River Region. Most property damage during the rainy season in The Gambia is the result of windstorms. Land cover change, particularly removal of forest cover, and poor housing standards are two main drivers of damage from windstorms. Strategies to mitigate damage from windstorms must focus on preserving or improving the current tree cover and institute regulations that will ensure higher standards of building. Specifically:
The government should promote community-based tree planting of

40
windbreaks and woodlots around settlements
Develop mechanisms that would promote the design and building of wind-resistant housing, particularly in rural areas.
5.2.4 Floods
About 20% of the Gambia’s land area is within the River Gambia’s historical flood plain. People have avoided building here, instead using the land for lowland rice, pasture, and other forest products. However, population pressures in urban areas and increase in aridity over the past 30 years have resulted in expansion of urban built-up within flood prone areas. Floods in the Gambia include flash floods immediately following abnormally heavy rainfall event or catastrophic seasonal floods along the River Gambia after above average rainy season. Most flash floods are the result of a heavy rainfall event combined with inadequate drainage and storm-water management systems in urban built-up areas. Adaptation and mitigation strategies to address flood control must incorporate self-protection, knowledge of apparent risks, and the capability to avoid living or working in flood-prone areas. As part of a national policy the government should:
Implement a national flood risk map. The map should be accompanied by the necessary legislative and administrative framework such as a national flood insurance program, to help reduce both the risk and potential impacts of flood events
Embark on a national effort to construct storm water management and drainage systems in all urban areas. With the exception of Banjul, Old Bakau and Janjanbureh, Gambian urban centers are built without any storm-water management in mind. An important element of this is the institution of a legislative framework that will ensure that the provision of drainage and storm-water management infrastructure is given equal weight as is water or electricity.
Develop a national building code for flood-prone areas to ensure that settlements are built with floods in mind.
Develop strategies to increase rainwater harvesting. An increase of rainwater harvesting at the household level could significantly reduce surface runoff and flash floods in built-up areas.

41
6. Conclusion
The Gambia has in the last three decades experienced various adverse impacts of climatic change, climate variability, and extreme weather events. The major climatic events include droughts, flash floods, coastline erosion, wind storms, and dust storms. These have had devastating effects on both ecosystems and the goods and services they produce.
Droughts adversely impact aquatic, coastal, and marine ecosystems by altering the hydrology of the Gambia River, through reduced freshwater recharge and hyper-salinization. The consequence of this includes the manifest loss of mangrove and coastal ecosystems. Other negative impacts of droughts include a reduction in crop yield; woodland degradation culminating in reduced food security, water, health and wellbeing, and energy; and an overall negative impact on the sustainable livelihoods of vulnerable rural communities. With over 60% of the population living below the poverty line, vulnerable communities particularly in rural and depressed urban areas do not have sufficient capacity to cope with, or adapt to,
the impacts of extreme weather events. Therefore the need to develop adaptation measures for addressing climate change should be high priority.
In recent years, flash floods and wind storms have become more frequent, with devastating effects. Each year, thousands of people are displaced, with millions of Dalasis worth of property damage (including houses, bridges and roads) in urban centers. The problem is exacerbated by unregulated expansion of settlements in marginal and flood prone areas, exposing even more people to hazards, e.g. catastrophic flood (rare but probable), the likes of those seen in Australia and Pakistan in 2010.
In the long-term, sea level rise and coastline erosion will continue to threaten low-lying coastal areas with potentially damaging consequences. A 1 m rise in sea level would inundate much of Banjul, Barra, Kuntaur and coastal built-up areas, including the Banjul Ports, and other nationally critical infrastructure, the loss of which would be economically devastating to the country.
42
7. References
Anya d ike , R . N . C . (1 9 9 3 ) . "P a t te rn s a nd va ria t i o ns of ra infa l l ove r Ba nj ul , Ga mbia . " S inga po re Jo urna l o f Tro pica l Ge o gra p hy .
Ba rnne t , L . a nd C . Em m s (2 0 0 0 ) . Che ck l i st o f Ga mbia n a nima l s , R e se a r ch & De ve l opme n t U nit . De pa r tme n t of P a r k s a nd Wi ld l i fe Ma na ge me nt .
Ba rrow , M . K . A . , Ed . La n d U se Sys te m on t he Ga mbia ' s C oa s ta l Zone , A FR I NE T .
B innin g , Cor k, e t a l . (2 0 0 1 ) . Na t u ra l A sse ts : An Inve n tor y of Eco sy ste m Good s a nd Se rvi ce s in t he Gu lb u rn Bro ke n Ca tc h me nt . CS IR O Su s ta inb le E cosy s te m s . E . S . P roje ct . Ca nbe r ra .
Con te h , A . S . , S . B . M. Nja i , e t a l . (2 0 0 5 ) . Vu lne ra bi l i ty a nd a d a pta tion a sse ss me n t re por t of t he he a l th se c to r of t he Ga m bia t o c l i ma te c hna ge . Ba nj u l .
Da i ly , G . C . , Ed . (1 9 9 7 ) . N a tu re 's Se rvi ce s: Socie ta l De pe nce on Na t u ra l E cos ys te ms 1 , 3 .
Da rboe , F . a nd L . Boja n g (2 0 0 5 ) . Asse ss me n t of Vu lne ra bi l i ty t o C l ima t e Cha n ge in Fi s he rie s a nd P roposa ls fo r Ad a pta tion Me a s ure s . Ba nju l , Gove r nme n t of T h e Ga mbia .
De lso l , H . , Y . Ma r tin -P re v e l , e t a l . (2 0 0 6 ) . Food a nd n ut r i t ion info r ma t ion sy s te m s in CI LL S co un trie s: a id e me moire o n mi ss ion t o T he Ga m bia , CI L LS .
Ea s te r l ing , D . R . , B . Ho r to n , e t a l . (1 9 9 7 ) . "Ma xi m um a nd Mini m um Te m pe ra t u re Tre nd s for t he Gl obe ." Sc ie nce 2 7 7(5 3 2 4 ) : 3 6 4 -3 6 7 .
Ea s te r l ing , D . R . , G . A . Me e hl , e t a l . (2 0 0 0 ) . "C l i ma te Ex t re me s: Ob se r va tion s , Mod e l ing , a nd Impa ct s . " Sc ie nce 28 9(5 4 8 7 ) : 2 0 6 8 -2 0 7 4 . E la sha , B . O . , M . Me d a ny , e t a l . (2 0 0 6 ) . Impa c ts , v ulne ra bi l i ty a n d a d a pta tio n to c l i ma te c ha nge in Af r ica .
FAO (2 0 1 0 ) . FA OS TA T F AO S ta t i s t ic s Da ta ba se .
For ste r , H . (1 9 8 3 ) . Eva l u a tion of t he Na t iona l Fore st Inve n tor y of t he G a mbia , Ge r ma n Age ncy fo r Te c hn ica l Co r pora ti on (G TZ) .
GBoS (2 0 0 9 ) . Ga mbia Na t iona l Ac co un ts Sta t i st ic s Ann ua l B u l le t in : De ve lop me nt of GDP in 2 0 0 9 . G . B . o . S ta t ist ic s . Ba n j ul .
GOTG (1 9 9 8 ) . T he Ga m bi a Na tiona l Biod ive r si t y S tra te gy a nd Actio n P la n (GBSAP ) . D . o . P . a . W . Ma na ge me n t . Ba nj u l , T he Gove rn me n t of T he G a mbia .
GOTG (2 0 0 3 ) . Fir s t Na tio na l Co m m unica tio n to the U n ite d Na tio ns Fra me wor k Conve nti on on Cl i ma te C ha nge Ba n j ul , N a tiona l C l i ma te Com mi t te e .
GOTG (2 0 0 3 ) . Ga m bia 5 0 , 0 0 0 d a ta ba se . S . o . S . f . L . G . a . La nd s . Ba nj u l .
GOTG (2 0 0 3 ) . R e po rt of t he Agri c ul t ura l Ce ns u s of T he Ga mbia 2 0 0 1 /2 0 0 2 . D . o . P . D . D . o . S . f . A . (DOSA) . Ba n j ul , G OTG . 1 .
GOTG (2 0 0 9 ) . Di sa s te r R i sk R e d uc tion a nd Cl i ma te C ha nge Ad a p ta ti on P rogra m me for The Ga mbia . N . D . a . C . A . P ro gra m me . Ba nj u l .
GT Z (1 9 9 9 ) . Na t iona l Ac t ion P la n to Co m ba t De se rt i f ica t ion - Live st oc k a nd R a nge Ma nge me n t . D . o . Fore s ty . Ba nj u l , G oTG .
Ha a r sm , R . , F . Se l te n , e t a l . (2 0 0 5 ) . " Sa he l R a infa l l va ria b i l i ty a nd r e sponse to Gre e nho u se . " Ge o p hy s. R e s . Le t t . 3 2(3 2 ) .
Ha r za (1 9 8 5 ) . Ga m bia R i ve r Ba sin St ud ie s: Hyd ro lo gy . Ga m bia R ive r Ba sin S t ud ie s Wor king Do cu me n t No . 5 3 . Ann Ar bor , T he U nive rsi ty of Mic hi ga n .

43
H ut ch inso n, P . (1 9 8 2 ) . R a infa l l va ria t ion s in the Ga mb ia s in ce 1 8 8 6 , WMO .
IM F (2 0 0 9 ) . T he Ga mbia : P ove rty R e d uc tion St ra te gy P a pe r - Ann ua l P rogre ss R e por t . I MF Cou nt ry R e por t . No. 0 9/ 7 5 .
IP C C (2 0 0 1 ) . C l i ma te Cha nge 2 0 0 1 : Impa ct s , Ad a pta t ion a nd V u lne ra b i l i ty . IP CC . Ca mb rid ge Ca m brid ge U n ive r si t y P r e ss .
Ja i te h , M . a nd A . Sa h o (2 0 0 6 ) . T he Ga m bia Atla s of 2 0 0 3 P opu la t ion a nd Ho usi ng Ce n s us . Ba nju l , T he Ga mbia B ure a u of S ta t is t i cs (GBoS) .
Ja l low , B . P . (1 9 9 9 ) . "C oa sta l zo ne of T he Ga mbia a nd t he Abid ja n r e gion in C ôte d ' Ivoire : se a le ve l r i se v u lne ra bi l i ty , re spon se st ra te gie s , a nd a d a pta tio n option s . " C l i ma te re se a rc h 1 2 : 1 2 9 .
Ka spe r , A . (1 9 9 4 ) . GGFP Te a c hin g Ma n us crip t for Applie d Dr y Zone For e st ry . Fa ja ra .
Le Ho ué r ou , H. N . a nd G . F . P opo v (1 9 8 1 ) . An e colo gica l c la s si f i ca t ion of inte r tr opica l Afr ica . F . a . A . O . o . t . U . Na tio ns . R o me .
Lud wig , R . a nd L . Boja n g (1 9 9 8 ) . R e su l ts a nd Ana ly sis of t he Na t iona l Fore st R e sou rce Inve n tory T he Ga m bia 1 9 9 7 /9 8 . U R DFP .
McGra na ha n , G . , D . Ba lk , e t a l . (2 0 0 7 ) . "T he r is in g t id e : a s se s sing t he r is ks of c l i ma te cha n ge a nd h u ma n se t t le me n ts in low e le va t ion coa sta l z one s . " Enviro nme nt a nd U rba niza tio n 1 9(1 ) : 1 7 -3 7 .
NEA (2 0 0 4 ) . Coa s ta l Zone Ma na ge me nt Ha nd bo ok fo r T he Ga mbi a . Ba nj u l , Na ti ona l Enviro nme nta l Age n cy
Nic ho l l s , N . (1 9 9 5 ) . i n C l i ma te Cha nge 1 9 9 5 : T he Scie nce of C l i ma te C ha nge [ In te r gove r nme n ta l P a ne l on C l i ma te C ha nge ( IP C C) . Ca m brid ge , Ca m b rid ge U niv . P re s s .
Nj ie , M . (2 0 0 7 ) . T he Ga m bia Na t iona l Ad a pta t ion P ro gra mme of Act io n (NAP A) on
Cl i ma te C ha nge . Ba nj u l , T he Gove rn me n t of T he Ga m bia .
Nor ton , G . W. , B . Mi l ls , e t a l . (1 9 8 9 ) . Ana ly sis of Agric u l tu ra l R e se a rc h P riori t ie s in t he Ga mbia . Ba n ju l , Ga m bia A gric u lt u ra l R e se a rc h a nd Dive rsi f i ca t ion , GAR D.
P a cha uri , R . (2 0 0 4 ) . C l im a te c ha nge a nd i ts imp lica t ion s for d e ve lop me n t: t he
ro le of IP C C a s se s sme n t s . . ID S Bu l l .– I . De v . St ud . , 3 5 , .
P SR P -I I (2 0 0 7 ) . P orve rty R e d uc tion St ra te gy: 2 0 0 7 -2 0 1 1 . Ba nju l , Gove r nme n t of T he Ga mbia .
R e e ve , H . F . (1 9 1 2 ) . The Ga mbia : i t s hi s tory , a ncie n t , me d iva l , a n d mo d e rn , toge t he r wi t h i ts ge og ra phi ca l , ge olo gic a l , a nd e th nogra p hi ca l cond i t ion s , a nd a d e s crip tio n of the bird s , be a s ts , a nd f ishe s fo und t he re in . Lond on .
Sc hind e le , W. a nd F . B oja ng (1 9 9 5 ) . T he Ga mbia n Fore s t Ma na ge m e nt Co nce p t , P a r t I - T he Fore s tr y Se ct or in T h e Ga mbia . GG FP R e poe r . GG FP .
Te u sa n , S . (1 9 9 9 ) . Mo ni t oring of La nd u se Cha n ge in The Ga mbia be twe e n 1 9 0 8 a nd 1 9 9 3 . Fa ja ra .
Tro l ld a le n , J . M . , Ed . (1 9 9 1 ) . On the Frin ge
A Sys te m Approa c h to t h e Evol u tion of t he Enviro nme nt a nd Ag ric u l tu ra l P rod u c tion in the Ga mb ia , We s t Afr i ca 1 9 4 8 - 1 9 8 3 . De ve lop me nt a nd Envi ro nme n t
NOR AGR I C O cca s iona l P a pe rs Se rie s C . O s lo , U nive rsi ty of Os lo .
U NDP (2 0 1 0 ) . H uma n De ve lop me nt R e po rt 2 0 1 0 . Ne w Yor k Ci ty , U N DP .