challenges for cbd freight in - university of...
TRANSCRIPT

Challenges for CBD Freight in
Sydney’s Transformation Michael Stokoe
11 October 2016

CBD Coordination Office
Functions include:
• Communications
• Operational planning: traffic
management and contingency planning
• Strategic and land use planning
(including development approvals)
• Freight planning - deliveries and
servicing
• Business and community support
(i.e. activation during periods of
disruption)
• Facilitating special events

CBD Transformation

Tomorrow’s Sydney
Responding to growth:
• Sydney’s population is expected to leap by more than 2.1
million people in the next 20 years - about 170,000 more
than predicted only two years ago.
• Transport for NSW is overseeing the largest transformation
of the Sydney CBD transport network in decades to
address it.
The demand:
• Over 630,000 trips are made to the city centre daily.
• 67% by public transport and 20% by car. This is forecast to
increase by 25% (155,000 trips) by 2031.
• Over 1.26 million trips are made within the city for work,
education, shopping, leisure and city living each day.
• These trips will increase by 35% to 1.7 million by 2031.
• 100,000 jobs will be created in the city centre over the next
20 years.

Developing Sydney
1 Carrington, Brookfield Office Properties 333 George St, Charter Hall Quay Quarter Tower, AMP
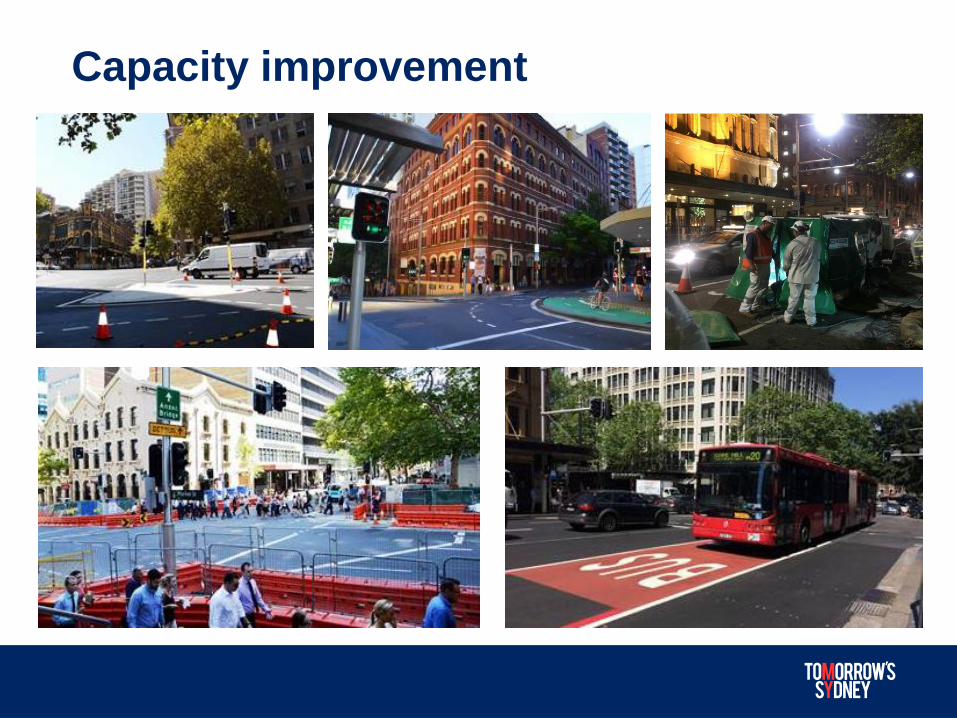
Capacity improvement

16 zones currently active
8 more zones active by
December
Construction zone activity

Travel demand management: Travel Choices
An Olympic style travel demand
management program. Primarily focused
on people movement. The “4Rs” ring true
for freight, too.

Our Sydney CBD Freight Challenge

City logistics
The process for totally optimising the logistics and transport activities by private companies in urban areas while considering the traffic environment, traffic congestion and energy consumption within the framework of a market economy.
Taniguchi, Thompson, Yamada and Van Duin (2001)
McKinsey estimates that the roll out of city logistics principles
is up to four times more efficient than building road
infrastructure (2010).


12
City logistics on our streets
Significant refurb/repair jobs
Bilge pumping
Floral deliveries
Couriers
Shop fitting Provedores

Why is there such a significant freight
task? • In one small part of a CBD street we found there was a consumer choice of 230
different types of bread for sale.
• Diversity, catering to all tastes and daily choices. Delivery of social benefit.
• Now multiply by every other product, service and competitor the city offers.
• This is what makes cities great!
• The number of CBD businesses selling food and drink increased by 13.9 per cent
between 2007 and 2012 to a total of 1484.
• Compare the supply chain implications of diversity, fragmentation and choice.
Bread by the numbers
1 side of the street in a 220 metre CBD block
21 shops and cafes selling bread 35 bread suppliers 80 deliveries each day

Communication & engagement Policy Trials Facilitation
Managing CBD freight and servicing
Economic Environmental Social Commercial Stakeholders
Aims and horizons
Framework
Outcomes
Guiding
principles
1. Encouraging industry driven change
2. Support and actions required by government
Efficient supply chain models supporting stakeholder requirements
Ongoing business success, enabling growth
Efficient transport network operations
1. Problem definition
2. Development of an evidence base
4. Design of future solutions
3.
1. Maintain productivity and sustainability
throughout the transformation
2. Promote efficient freight and servicing practices
to create a lasting legacy
3. Accommodate future grown
2015 2030 Transformation period
14

Problem definition and development of an
evidence base

• Service definition may be set by various parties ... including marketing
departments.
– “Next day AM” is a typical service requirement regardless of the nature
of the good.
• This leads to immense competition for space during the morning peak.
• Property managers play a key gate keeper role – controlling who can access
their loading docks.
Supply chain structures

On-street loading zone assessment for
freight and servicing
• Approximately 3.2 million loading zone “button push” transactions per year.
• Peak period 9-11am exceeds operational capacity.
• Infrastructure projects reduced capacity by 12% last year – more reductions are likely.
17

Key behavioural observations
18
Productive Non-productive
Legal
• Delivery with 30 minute turnover,
no waiting, no double parking, no
circulating.
• Using a loading dock or car park.
• “Back of the clock” delivery.
• Stopping in a loading zone to buy food or
coffee in an approved vehicle type.
• Driving around the block rather than
blocking a lane while waiting.
• Queuing at loading dock entry.
• Internet shopping delivered to CBD
offices.
Illegal
• Overstaying a 30 minute slot due to
delays at business (such as waiting
for security check).
• Making several deliveries from one
spot (on street or in loading dock).
• Colluding to allow overstaying to
finish the job.
• Using a bus lane or no stopping
zone as buffer capacity.
• Private car parking in loading zones.
• Non-commercial SUV/ute stopping for
private use activities (vehicle type is legal
but trip purpose is not).
• Blocking a bus lane, cycle lane or
intersection while queuing for a loading
dock.
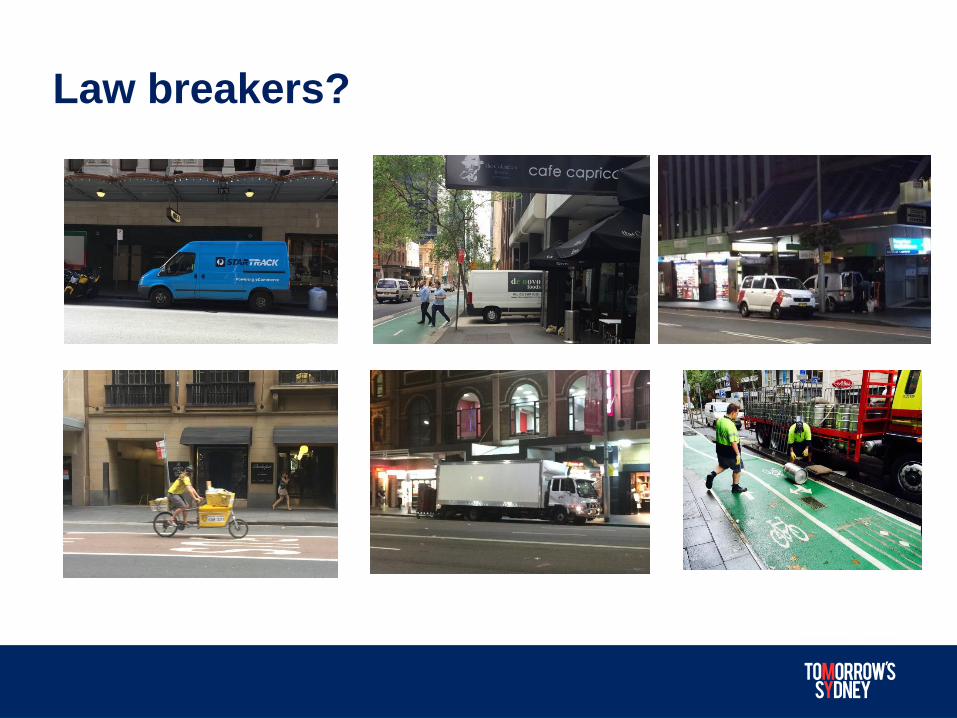
Law breakers?

Free loading zones – a tragedy of the
commons?
• Who gets what space?
• Who gets priority?
• It is in the interests of the users of a
commons to manage it prudently.
• Does compliance work? Yes and no ...

Why use loading zones rather than a
dock?
• Your customer doesn’t have a dock.
• Your truck doesn’t fit (height, length).
• Your customer (the tenant) doesn’t
manage access to the dock, the
property manager does.
• You have deliveries to make to 151
and 155 xyz street. Both have docks.
Parking in the street means you can
access both customers easily.
• Getting to the dock requires going
into a one-way street system.
• You need to create a booking. You
don’t like admin/it doesn’t suit your
operating method.
• The dock closes at 3pm.
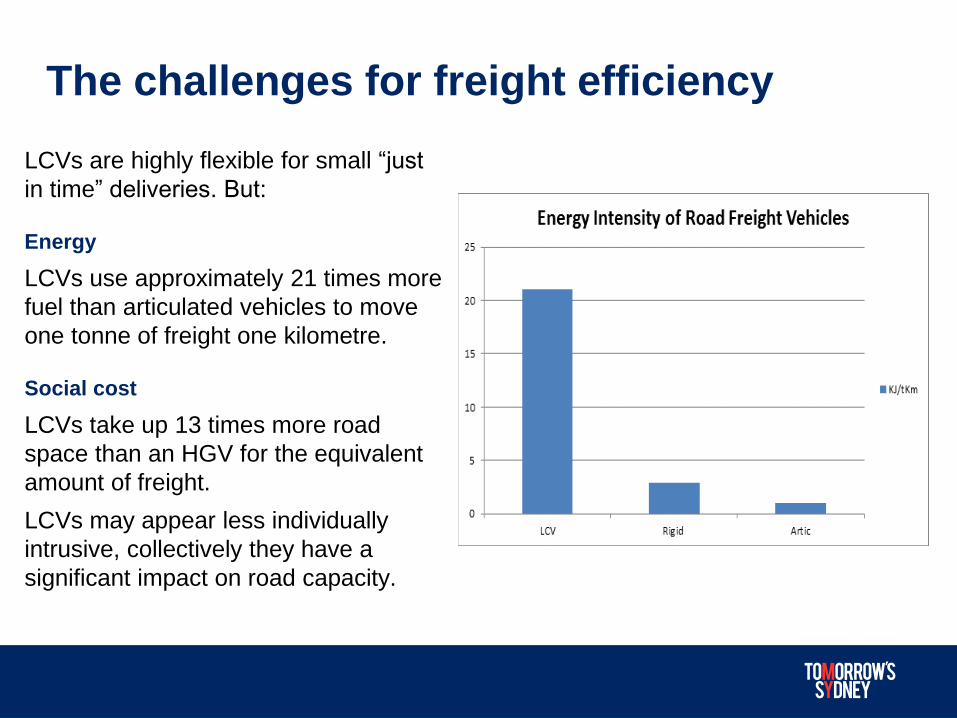
The challenges for freight efficiency
LCVs are highly flexible for small “just
in time” deliveries. But: Energy
LCVs use approximately 21 times more
fuel than articulated vehicles to move
one tonne of freight one kilometre. Social cost
LCVs take up 13 times more road
space than an HGV for the equivalent
amount of freight.
LCVs may appear less individually
intrusive, collectively they have a
significant impact on road capacity.

The challenges for large vehicles
• Providing network
access.
• Providing dock access.
• Maintaining access for
retailers through the
construction phase and
into end state.
• Assessment of swept
paths for accessing docks
– to inform construction.

Off-street loading docks
• Self sufficiency is a requirement for all new developments.
• Only developed for the associated building. Little/no sharing.
• Is the space valued versus maximising leasable space?
• Scissor lifts are increasingly seen as the answer for confined space developments.
• Does building access policy require use of the dock?
• What is the value of serviceability for a building?

Developing Sydney
1 Carrington, Brookfield Office Properties 333 George St, Charter Hall Quay Quarter Tower, AMP
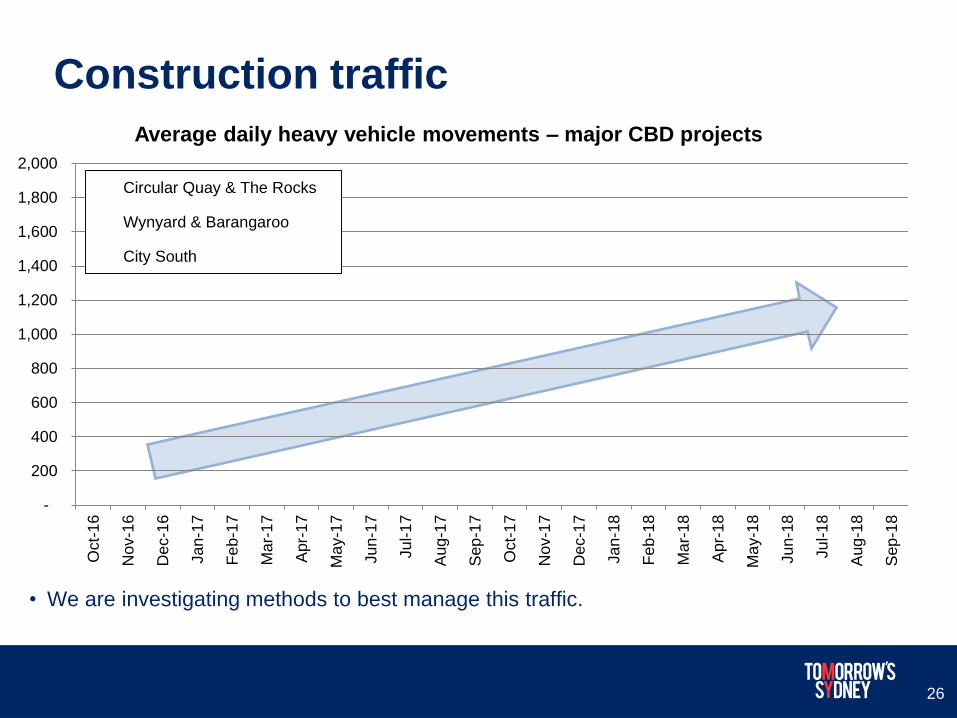
Construction traffic
• We are investigating methods to best manage this traffic.
26
-
200
400
600
800
1,000
1,200
1,400
1,600
1,800
2,000
Oct-
16
No
v-1
6
De
c-1
6
Ja
n-1
7
Fe
b-1
7
Ma
r-17
Apr-
17
Ma
y-1
7
Ju
n-1
7
Ju
l-1
7
Aug
-17
Sep
-17
Oct-
17
No
v-1
7
De
c-1
7
Ja
n-1
8
Fe
b-1
8
Ma
r-18
Apr-
18
Ma
y-1
8
Ju
n-1
8
Ju
l-1
8
Aug
-18
Sep
-18
Average daily heavy vehicle movements – major CBD projects
Circular Quay & The Rocks
Wynyard & Barangaroo
City South

Construction traffic
Pitt Street/Martin Place
Circled the block four times at 8am on
a November morning.
Kent Street
Circling the block and impeding traffic
as planned practices.

Finding solutions
Framework
1. Problem definition
2. Development of an evidence base
4. Design of future solutions
3. Communication & engagement Policy Trials Facilitation

Communications and engagement
Provision of up-to-date information
• “Give us information, give us time to
plan”.
• Handcrafted list of over 750
stakeholders.
• Over 60 operational communications
since September 2015.
• Frequent communication with a broad
variety of stakeholders.
29
Information about the network
• mysydneycbd.nsw.gov.au provides
loading zone and parking station
locations.
• Working with businesses to identify
parking opportunities.
• Data to publish.
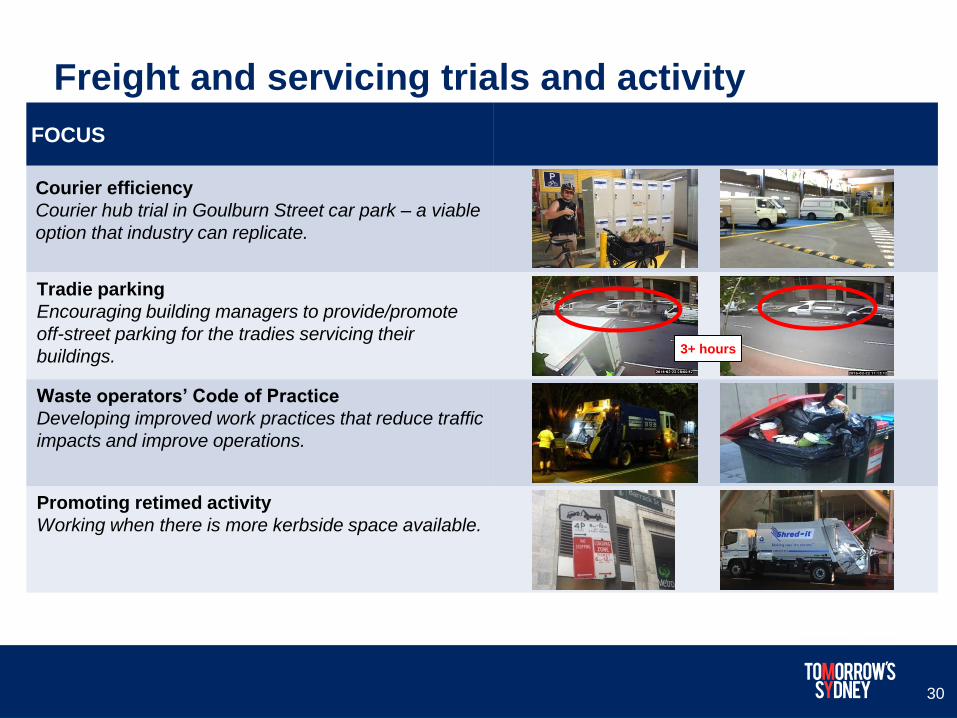
Freight and servicing trials and activity
FOCUS
Courier efficiency
Courier hub trial in Goulburn Street car park – a viable
option that industry can replicate.
Tradie parking
Encouraging building managers to provide/promote
off-street parking for the tradies servicing their
buildings.
Waste operators’ Code of Practice
Developing improved work practices that reduce traffic
impacts and improve operations.
Promoting retimed activity
Working when there is more kerbside space available.
3+ hours
30

Approaches: courier hub
• Joint initiative with the Council of the City of Sydney.
• Off-street parking, secure cages and lockers for deliveries.
• Activity with couriers demonstrates there are viable alternatives that can be adopted to
efficiently get goods into and around the CBDs
• The most common operator has 44 vehicles and bike couriers visiting per day (August
2016). 60% of movements are by bike.
• At full capacity, we estimate the hub could save 26,000 kilometres within the CBD (and
more across greater Sydney) and reduce loading zone dwell time by 4,600 hours
annually. Current use is approximately 25%
• Other couriers have established their own individual courier hubs.

Courier productivity assessment from the hub
Bonds Couriers Despatch Manager
“While it is difficult to empirically judge,
there is a very strong service benefit to
our CBD customers due to the use of
pushbikes.”
Testing the hub as:
• An intermodal point
• A city based hub
• A consolidation point

Approaches: retiming activities
Extending loading zones to
midnight to enable late
evening deliveries.
Testing the ability to schedule
less time-critical deliveries from
peak periods to off-peak periods.

Retiming activities
Tests conducted at a TfNSW office
• Substantial productivity gains
can be made from operating
overnight.
• In this case productivity
increased by x6 and mileage
decreased by x5.
• Productivity gains for us as the
client too by this operation
being out of hours.
The challenge is typically how
both parties establish a win-win
outcome.

Noise assessment – responsible retiming
Conclusion: peaks in noise are
typically “bin self noise” and the
way they are robustly handled.
Less noise from the actual
vehicle. There are still several
areas for improvement.

Policy and Design of Future Solutions

• New buildings are required to be self
sufficient, not reliant on on-street space.
• Accessibility for larger vehicles.
• Opportunities for local area hubbing. Lease
income from operators.
• Improved service outcomes for building
tenants.
• Could enhance the buildings green
credentials and rating
Requires view to be changed that this space
generates value to tenants ...
Better design of loading docks
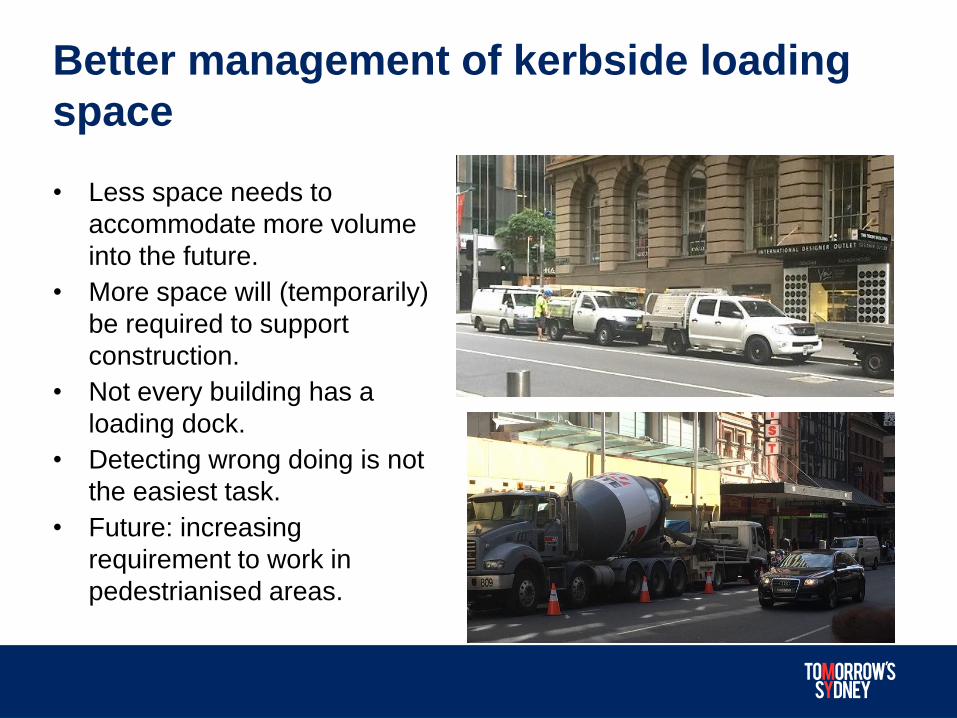
• Less space needs to
accommodate more volume
into the future.
• More space will (temporarily)
be required to support
construction.
• Not every building has a
loading dock.
• Detecting wrong doing is not
the easiest task.
• Future: increasing
requirement to work in
pedestrianised areas.
Better management of kerbside loading
space

CBD land use and infrastructure planning
Transport for NSW new Metro stations
• Investigating a precinct-based approach
to loading docks.
• Can these be used to service the local
area efficiently?
Central Sydney Planning Strategy (draft - July 2016)
Loading and servicing actions
• Precinct-based approach to commercial
vehicle management, including open access
docks.
• Create small delivery consolidation points for
“last mile” delivery by foot, cycle or electric
vehicle.
• Encourage storage, particularly in retail to
reduce the number of (small) consignments.
• Loading on widened footpaths, at low
pedestrian volume periods e.g. at night.
39

Global developments and trends – Europe
Freight tram (Dresden) Urban courier deliveries
Consolidated freight deliveries by electric vehicles
40
Often these are motivated by energy/environment and are not commercially sustainable.
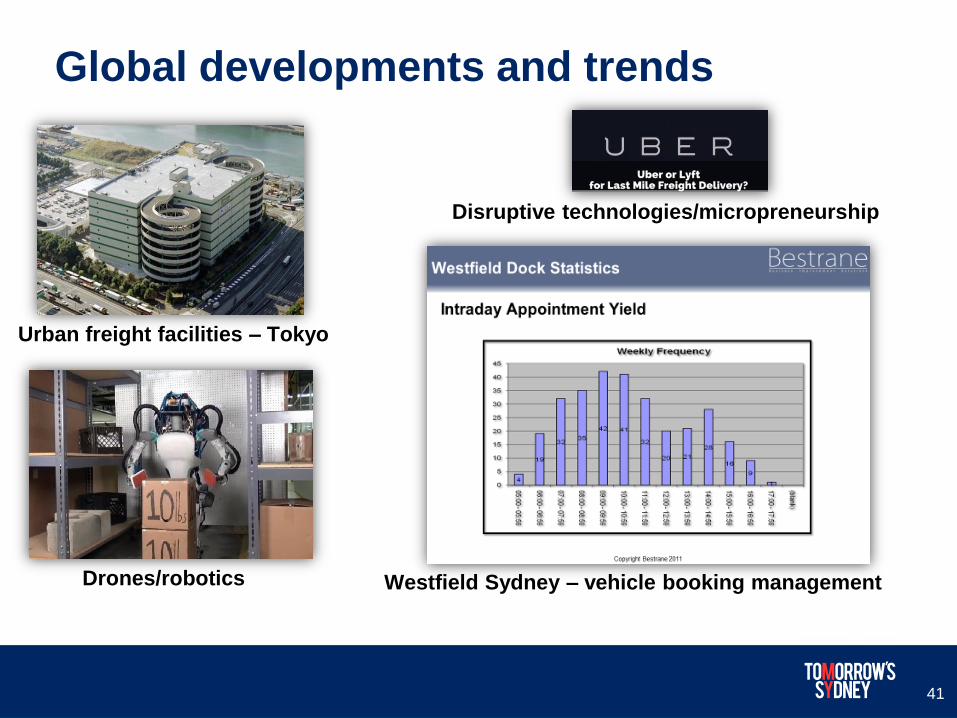
Global developments and trends
Urban freight facilities – Tokyo
Drones/robotics
Disruptive technologies/micropreneurship
Westfield Sydney – vehicle booking management
41
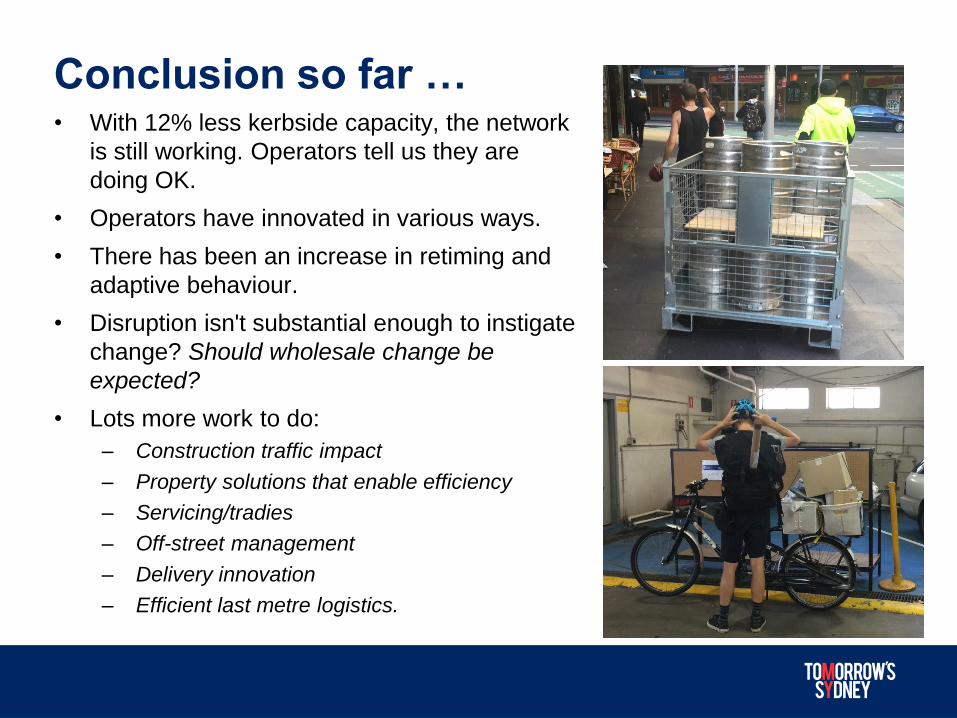
Conclusion so far … • With 12% less kerbside capacity, the network
is still working. Operators tell us they are
doing OK.
• Operators have innovated in various ways.
• There has been an increase in retiming and
adaptive behaviour.
• Disruption isn't substantial enough to instigate
change? Should wholesale change be
expected?
• Lots more work to do:
– Construction traffic impact
– Property solutions that enable efficiency
– Servicing/tradies
– Off-street management
– Delivery innovation
– Efficient last metre logistics.
