ch3_examples from mecha
TRANSCRIPT

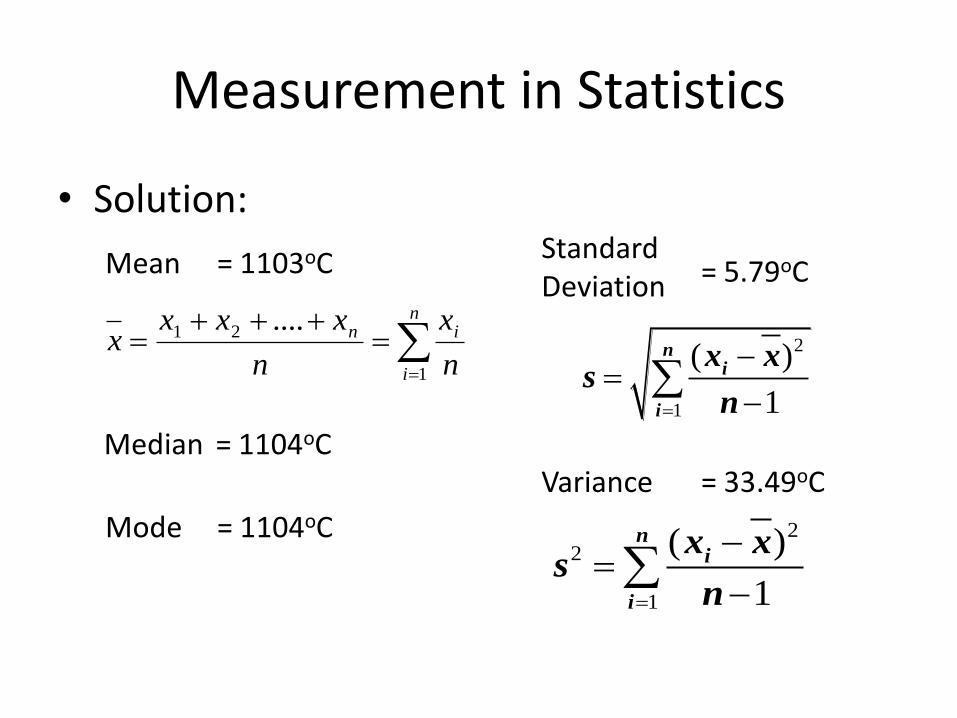
Measurement in Statistics
• Example: Find the Mean, Median, Standard Deviation, Variance and Mode
Measurement in Statistics
• Solution:
Mean
n
i
in
n
x
n
xxxx
1
21 ....
= 1103oC
Median
= 1104oC
Standard Deviation
= 5.79oC
2
1
( )
1
ni
i
x xs
n
Variance
= 33.49oC
22
1
( )
1
ni
i
x xs
n
Mode
= 1104oC
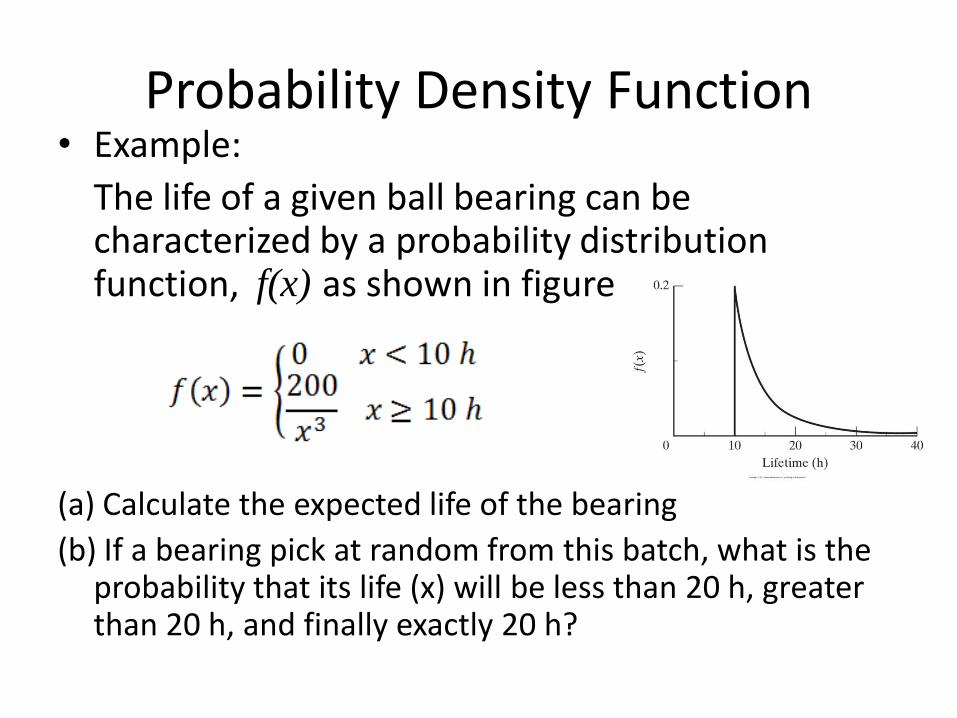
Probability Density Function • Example:
The life of a given ball bearing can be characterized by a probability distribution function, f(x) as shown in figure
(a) Calculate the expected life of the bearing
(b) If a bearing pick at random from this batch, what is the probability that its life (x) will be less than 20 h, greater than 20 h, and finally exactly 20 h?
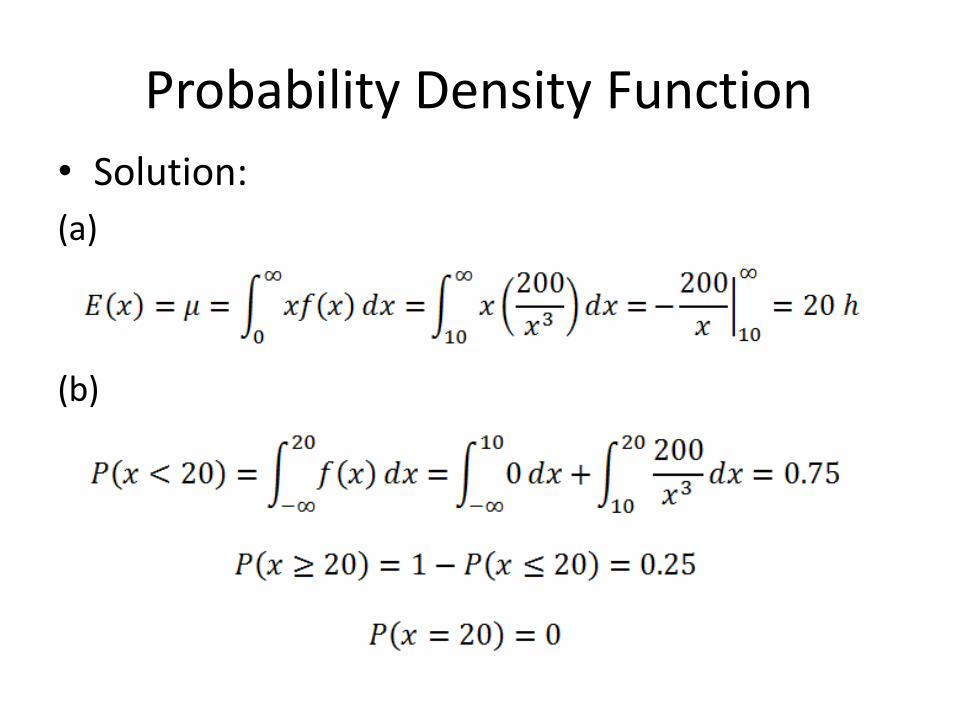
Probability Density Function
• Solution:
(a)
(b)
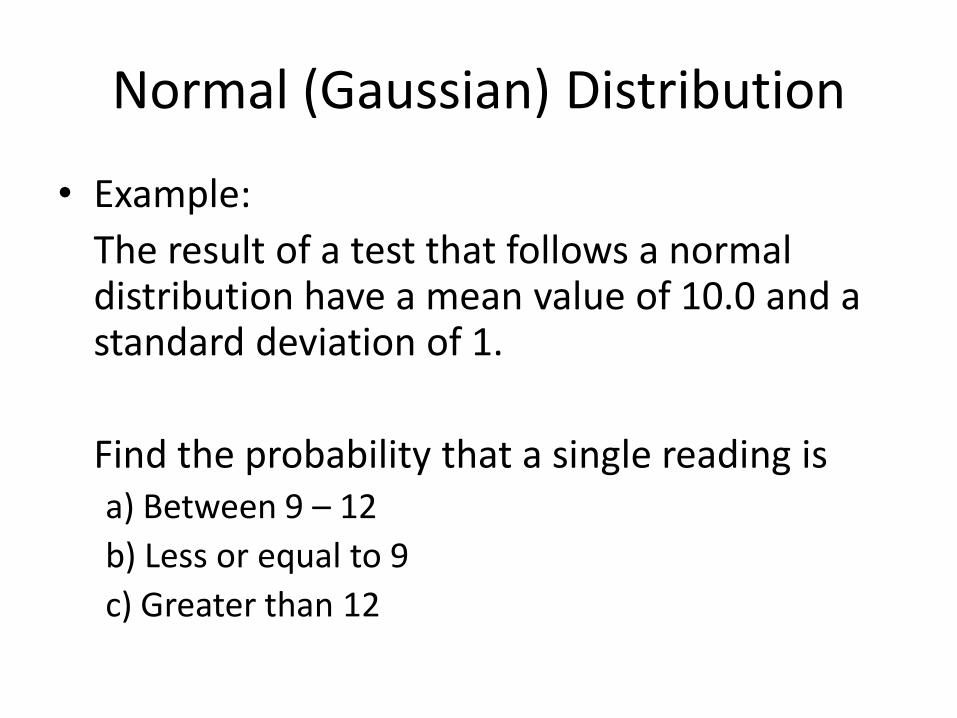
Normal (Gaussian) Distribution
• Example:
The result of a test that follows a normal distribution have a mean value of 10.0 and a standard deviation of 1.
Find the probability that a single reading is a) Between 9 – 12
b) Less or equal to 9
c) Greater than 12

Normal (Gaussian) Distribution
• Solution:
μ = 10.0 and σ = 1
a)
z1 = (9 – 10)/1 = -1 and z2 = (12 – 10)/1 = 2
Part 1: z = -1 to 0, Part 2: z = 0 to 2
Note for Part 1, z = -1 to 0 equal to z = 0 to 1
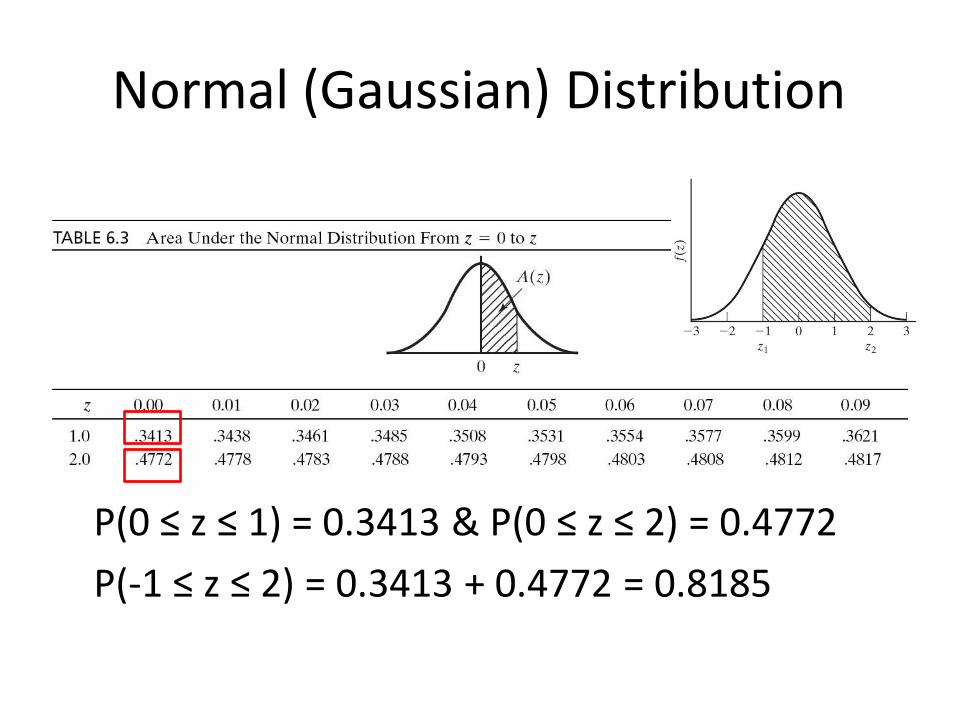
Normal (Gaussian) Distribution
P(0 ≤ z ≤ 1) = 0.3413 & P(0 ≤ z ≤ 2) = 0.4772
P(-1 ≤ z ≤ 2) = 0.3413 + 0.4772 = 0.8185
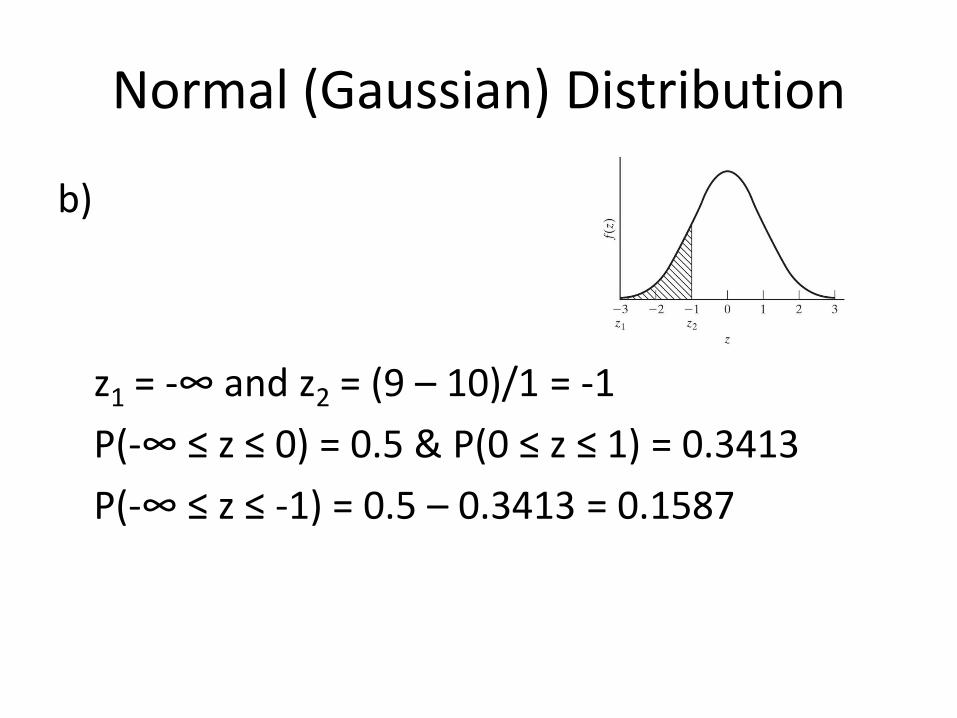
Normal (Gaussian) Distribution
b)
z1 = -∞ and z2 = (9 – 10)/1 = -1
P(-∞ ≤ z ≤ 0) = 0.5 & P(0 ≤ z ≤ 1) = 0.3413
P(-∞ ≤ z ≤ -1) = 0.5 – 0.3413 = 0.1587
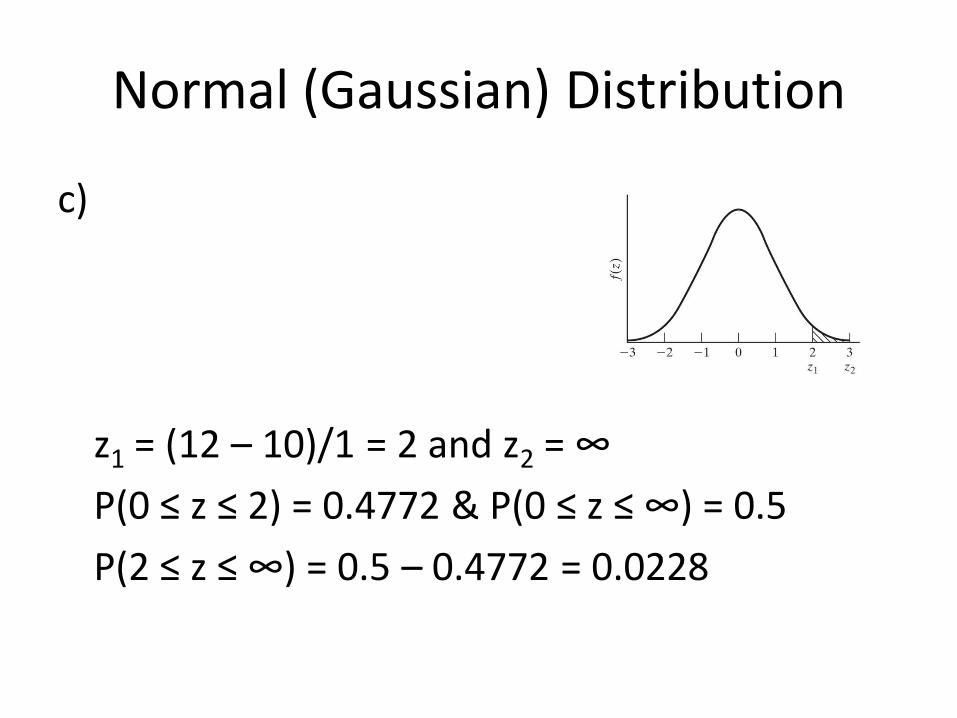
Normal (Gaussian) Distribution
c)
z1 = (12 – 10)/1 = 2 and z2 = ∞
P(0 ≤ z ≤ 2) = 0.4772 & P(0 ≤ z ≤ ∞) = 0.5
P(2 ≤ z ≤ ∞) = 0.5 – 0.4772 = 0.0228
Interval Estimation of the Population Mean
• Example:
Based on 36 reading, the average resistance is 25Ω and the sample standard deviation is 0.5Ω.
Determine the 90% confidence interval of the mean resistance of the batch.

Interval Estimation of the Population Mean
• Solution:
Based on 36 reading, the average resistance is 25Ω and the sample standard deviation is 0.5Ω.
90%, 1 – α = 0.90 and α = 0.10
Since n > 30, can use normal distribution
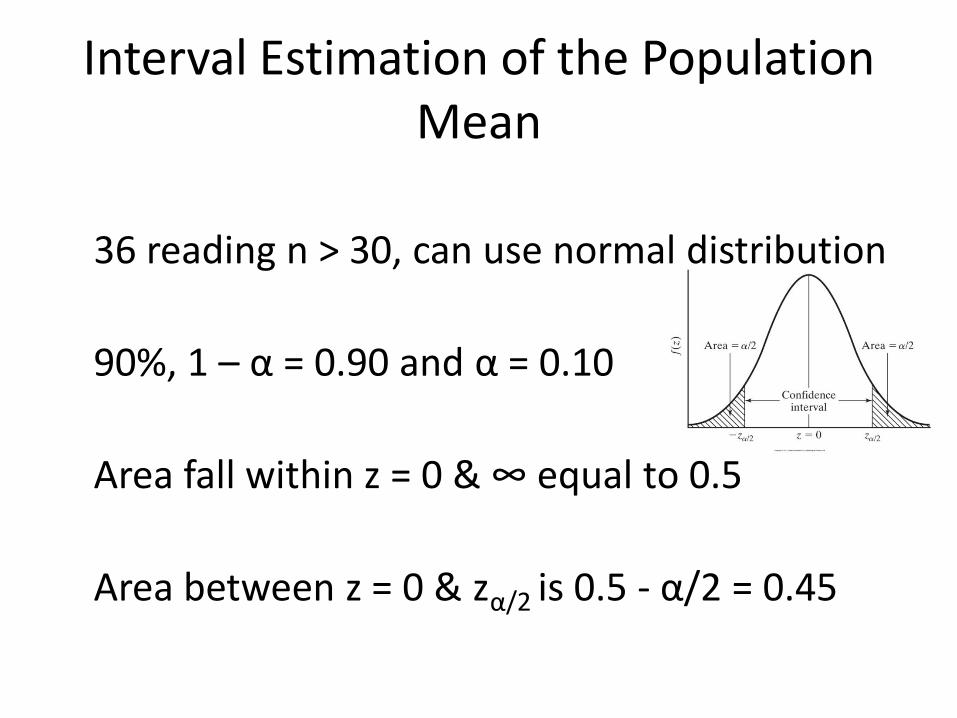
Interval Estimation of the Population Mean
36 reading n > 30, can use normal distribution
90%, 1 – α = 0.90 and α = 0.10
Area fall within z = 0 & ∞ equal to 0.5
Area between z = 0 & zα/2 is 0.5 - α/2 = 0.45
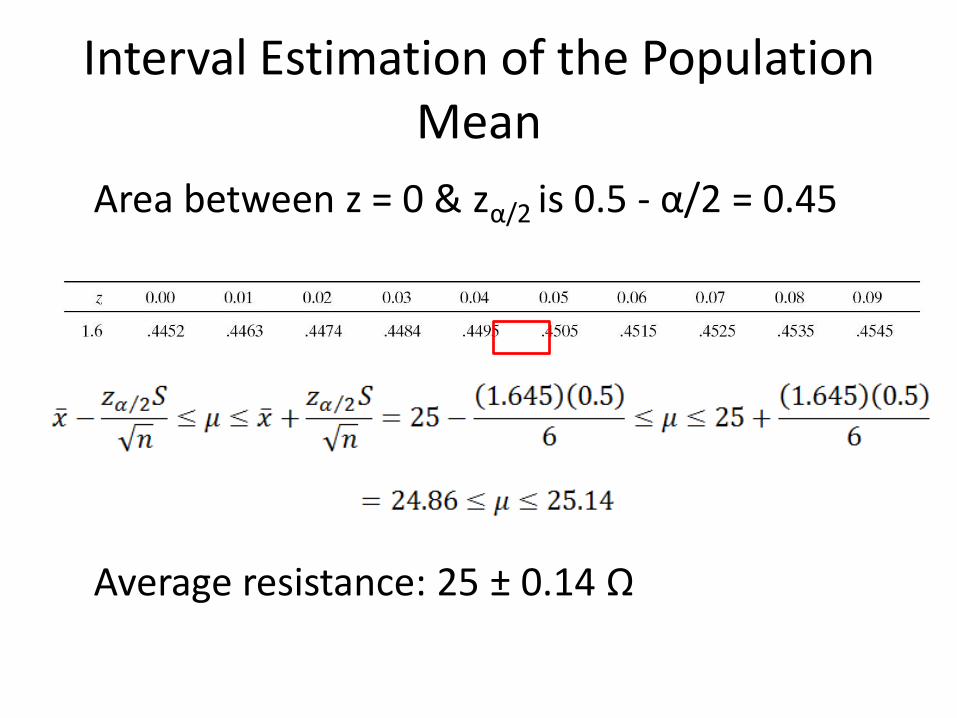
Interval Estimation of the Population Mean
Area between z = 0 & zα/2 is 0.5 - α/2 = 0.45
Average resistance: 25 ± 0.14 Ω
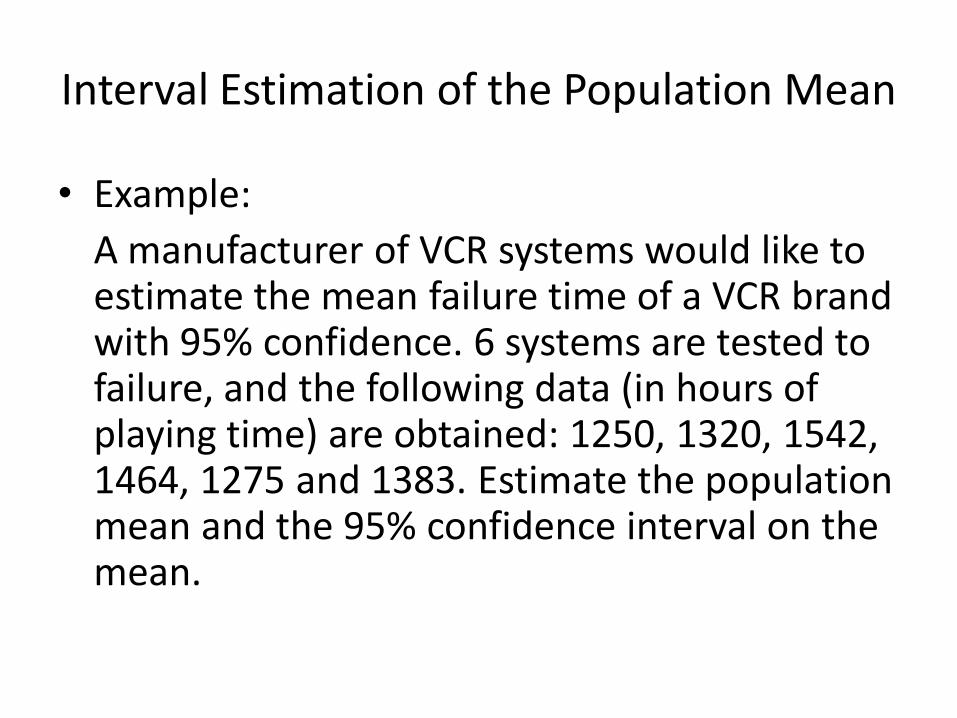
Interval Estimation of the Population Mean
• Example:
A manufacturer of VCR systems would like to estimate the mean failure time of a VCR brand with 95% confidence. 6 systems are tested to failure, and the following data (in hours of playing time) are obtained: 1250, 1320, 1542, 1464, 1275 and 1383. Estimate the population mean and the 95% confidence interval on the mean.
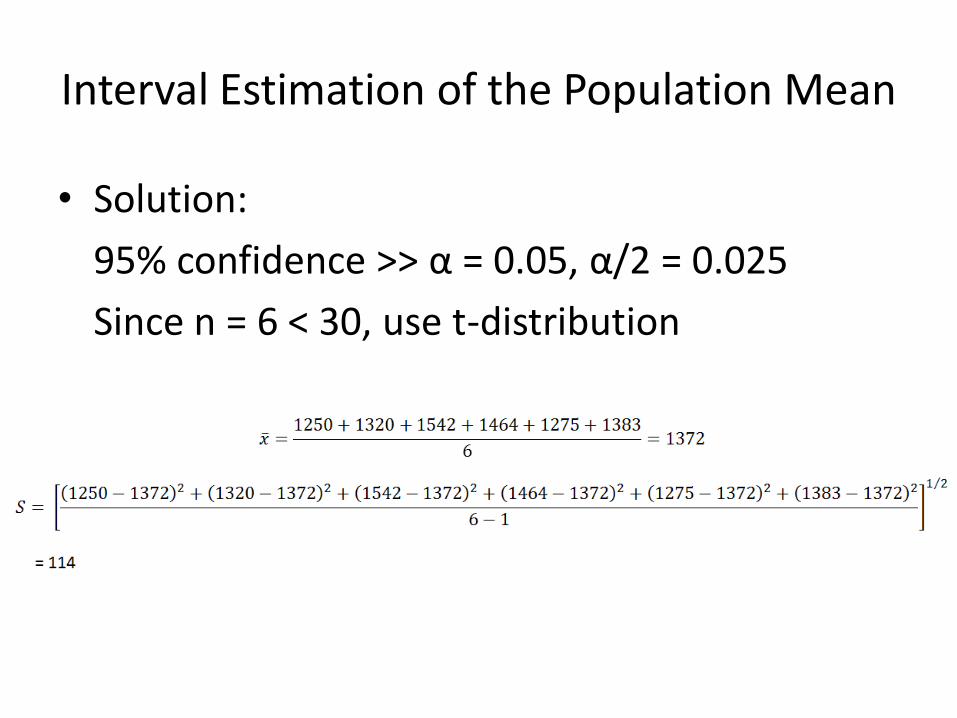
Interval Estimation of the Population Mean
• Solution:
95% confidence >> α = 0.05, α/2 = 0.025
Since n = 6 < 30, use t-distribution

Interval Estimation of the Population Mean
tα/2 = 0.025 = 2.571, ν = n – 1 = 5
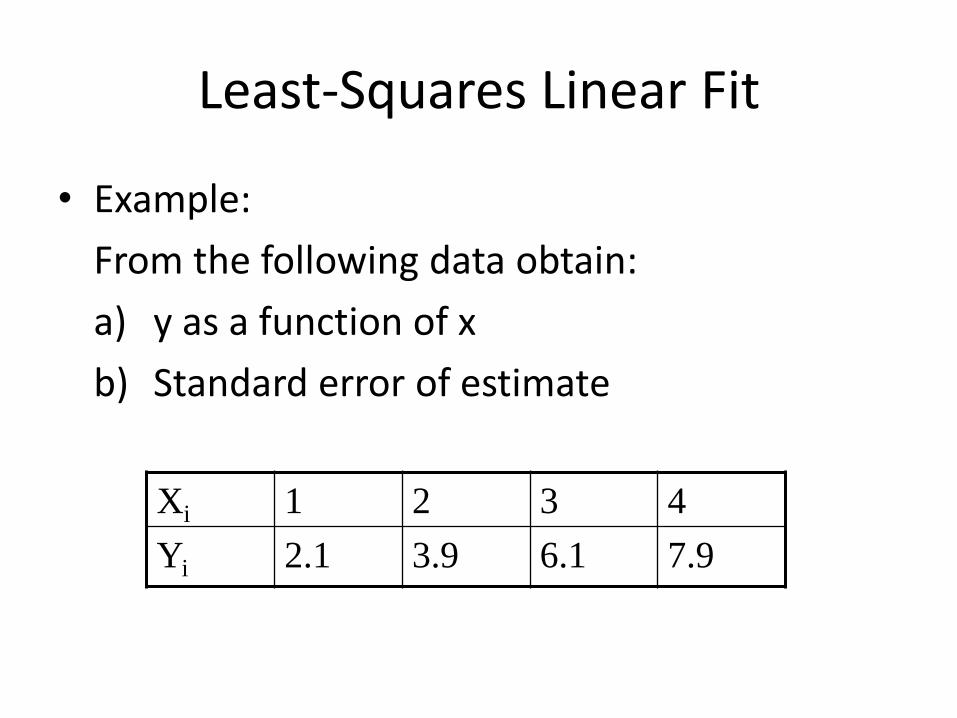
Least-Squares Linear Fit
• Example:
From the following data obtain:
a) y as a function of x
b) Standard error of estimate
Xi 1 2 3 4
Yi 2.1 3.9 6.1 7.9
Least-Squares Linear Fit • Solution:
a)
1.96 0.10Y x
xi yi xi yi xi2 yi
2
1 2.1 2.1 1 4.41
2 3.9 7.8 4 15.21
3 6.1 18.3 9 37.21
4 7.9 31.6 16 62.41
10 20 59.8 30 119.24
22)(
))((
ii
iiii
xxn
yxyxna
96.1)10()30)(4(
)20)(10()8.59)(4(2
a
22
2
)(
))((
ii
iiiii
xxn
yxxyxb
10.0)10()30)(4(
)8.59)(10()20)(30(2
b
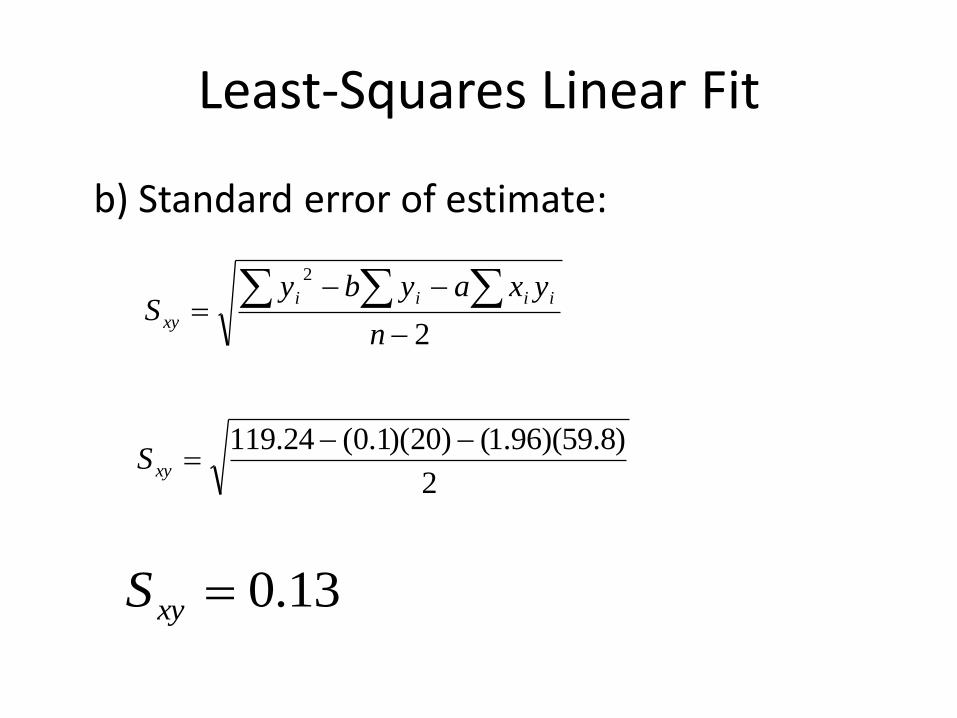
b) Standard error of estimate:
Least-Squares Linear Fit
2
2
n
yxaybyS
iiii
xy
2
)8.59)(96.1()20)(1.0(24.119 xyS
13.0xyS