ch.3 key issue 3
DESCRIPTION
Ch.3 Key Issue 3. Why Do Migrants Face Obstacles?. Quick Write- 5 minutes. Explain how a country’s stage in the DTM can determine its net-in/net-out migration. ( HINT: where are migrants coming from and going and what stages are these respective countries in?). Intervening Obstacles. - PowerPoint PPT PresentationTRANSCRIPT

Moving from San Francisco to Washington, D.C. would be considered A) international migration. B) intraregional migration. C) interregional migration. D) forced migration. E) net migration.

Moving from San Francisco (WEST) to Washington, D.C. (EAST) would be considered A) international migration. B) intraregional migration. C) interregional migration. D) forced migration. E) net migration.

15. Wilbur Zelinsky's migration transition predictedA) women are more likely to migrate than men. NoB) long migration distances are more likely than short. falseC) migration characteristics vary with the demographic transition.D) intraregional migration is more important than interregional. Never discussedE) migrants move most frequently for economic reasons. True, but not what Mig. Tran. Talks about

11. Refugees migrate primarily because of which type of push factor?A) economic-its #1 reason for migrating, but NOT for refugeesB) environmental- nopeC) cultural- being persecuted for beliefs! (lang. Rel. or Ethnicity)D) Circulation- what is this?E) all of the above- nope

Ch.3 Key Issue 3
Why Do Migrants Face Obstacles?
Quick Write- 5 minutes
• Explain how a country’s stage in the DTM can determine its net-in/net-out migration.
• (HINT: where are migrants coming from and going and what stages are these respective countries in?)
Countries with slow population growth but strong economies commonly experience out-migration.
FALSE!!!!!!!! (see quick write)

Population Pyramid of Native and Foreign Born Population, United States, 2000 (in %)
8 6 4 2 0 2 4 6 8Percent
Male Female FemaleMale
Foreign Born Native
8 6 4 2 0 2 4 6 8
0-45-9
10-1415-1920-2425-2930-3435-3940-4445-4950-5455-5960-6465-6970-7475-7980-84
85+
Percent
Age
Slide graphic courtesy of Dr. Jean-Paul Rodrigue, Hofstra University
Reproductive and working
age!

Immigration policies of host countries– U.S. quota laws• The Quota Act (1921) and The National Origins Act
(1924)–Due to isolationist policies after WWI– Established quotas- only 2% of people from that country
already living in US could immigrate.– Does not include refugees
• Applications to enter US exceeded quotas– Priorities had to be set (skilled labor and family of
citizens first)–Quota system for individual countries abolished in 1965;
now have a Global Quota

Impact of the Quota System
• Most immigrants were from North and West Europe at that time (the “lighter” Europe)
• The quotas severely restricted immigration from Southern and eastern Europe (the “darker” Europe)
• Quotas also contribute to brain drain- US will only accept the best and brightest from a country

Family-Based Immigration System Category U.S. Sponsor Relationship Numerical Limit
Immediate Relatives (IRs)
U.S. Citizen adults
Spouses, unmarried minor children, and parents
Unlimited
Preference allocation1 U.S. citizen Unmarried adult
children23,400*
2A LPR Spouses and minor children
87,900
2B LPR Unmarried adult children
26,300
3 U.S. citizen Married adult children
23,400**
4 U.S. citizen Brothers and Sisters
65,000***

Permanent Employment-Based Preference System
Preference Category Eligibility (Creating BRAIN DRAIN) Yearly Numerical
Limit1 “Persons of extraordinary ability” in the arts, science,
education, business, or athletics; outstanding professors and researchers, some multinational executives.
40,000*
2 Members of the professions holding advanced degrees, or persons of exceptional abilities in the arts, science, or business.
40,000**
3 Skilled workers with at least two years of training or experience, professionals with college degrees, or “other” workers for unskilled labor that is not temporary or seasonal.
40,000*** “Other” unskilled laborers restricted to 5,000
4 Certain “special immigrants” including religious workers, employees of U.S. foreign service posts, former U.S. government employees and other classes of aliens.
10,000
5 Persons who will invest $500,000 to $1 million in a job-creating enterprise that employs at least 10 full time U.S. workers.
10,00; TOTAL: 140,000

Africa 12,000East Asia 17,000Europe and Central Asia 2,000Latin America/Caribbean 5,000Near East(Middle East)/South Asia 31,000Unallocated Reserve 3,000TOTAL 70,000
For Fiscal Year (FY) 2013, the President set the worldwide refugee ceiling at 70,000, and the regional allocation was as follows:

***Post 9/11• Immigration policies and National security mix– Stop terrorists from entering country
• Asylum-seeker crack down• Operation Liberty Shield – 33 countries were “marked” due to the presence of
terrorist organizations; asylum-seekers from these countries were automatically detained
• Justice department policies– allowed to detain any illegal immigrant using Haiti and
Mexico as a staging points• Will these polices stop or intensify terrorism?– Promoting (even more) hatred for US government?

Operation Liberty Shield
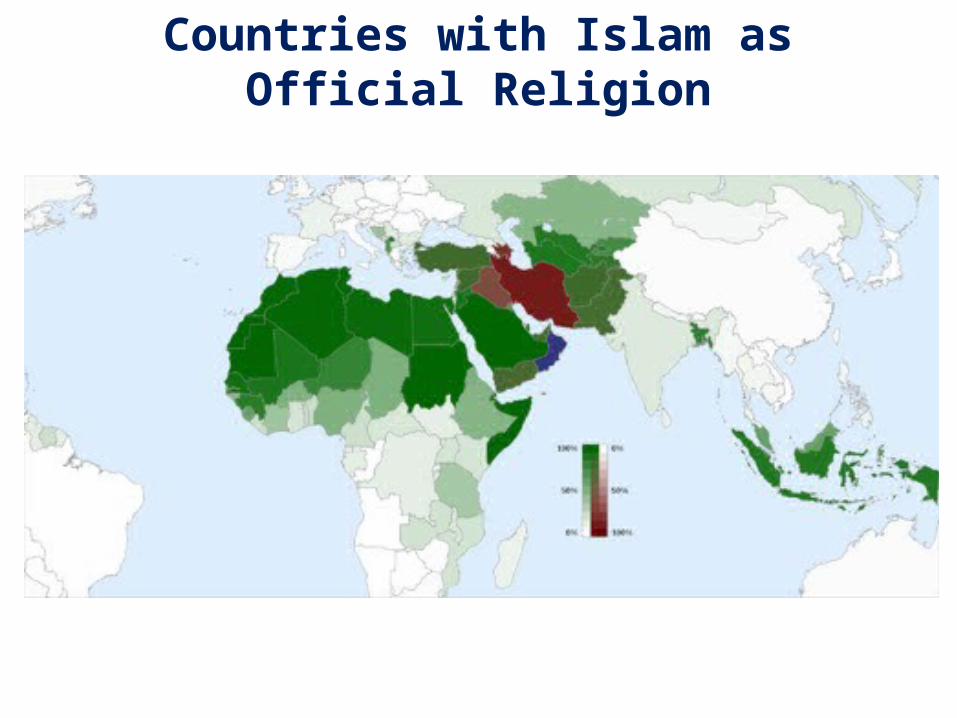
Countries with Islam as Official Religion

Immigration policies of host countries–Temporary migration for work• Guest workers- in Europe and Middle East–Protected by labor laws of host country–Take low-status, low-skilled jobs –Reduces unemployment in home country–Remittances
• Time-contract workers (type of guest worker)–Recruited for a fixed period of time–Chinese stayed in Western US after contract
ended

European Guest Workers• During the Marshall Plan (US gives $ to Europe),
Europe was in need of workers– Lost millions of men in WWII
• Two flows of migration into Western Europe followed the Plan:
1. Within European region itself- poor countries of S/E Europe to wealthier ones
2. From outside Europe- North Africa (France), Turkey (Germany), Caribbean, India, Africa (to UK)
• Economies of home countries rely on remittances of guest workers
• Affects the ethnic, linguistic and religious makeup of host country– Temples, mosques, stores depicted on cultural landscape
Refugee or Economic Migrant?
• Majority of refugees flee poor countries and go to neighboring countries that are also poor
• Since priority is given to skilled migrants (economic pulls) we must distinguish between these two groups.

Refugee or Economic Migrant?
• Cuba–Deemed as refugees in 1959 because they
were allied with Soviet Union during Cold War– “Mariel Boatlift” in 1980; some Cubans
allowed to leave–Wet foot, dry foot policy

Refugee or Economic Migrant?
• Haiti– Under persecution from “Papa Doc” and “Baby
Doc” (1957-1986)– Haitians tried to immigrate in 1980’s for
“economic reasons”, they were denied entrance to US
– US did not consider the Haitians as refugees since Haiti was not allied with Soviet Union and Cuba was

Refugee or Economic Migrant?
• Vietnam– After Vietnam War, South Vietnamese were
considered refugees (fearing persecution under new Communist government) until late 1980’s
– After late 1980’s, US judged the Vietnamese “Boat People” as economic migrants (economic pull now outweighed political push)• Were placed in detention camps by UN then
repatriated

Cultural Challenges in New Country• US attitudes– “Tolerated” early immigrants because they helped
“expand” the US’s frontier• Once frontier was closed/maxed-out, so should
immigration– Increased hostility when immigrants were no
longer coming from Western European countries– Recent hostility towards illegal immigration
(Arizona Law, denial of the DREAM Act)• Obama’s DACA


DACA
Challenges in New Country• Attitudes towards guest workers– Poor social conditions: single, lonely man with
little money in a different culture– Supposed to be temporary but may become
permanent• Disliked by Western Europeans (affecting
culture)• Scapegoats for country’s problems• May be forced to leave if they want to marry or
have opposing beliefs (Palestinian's in Kuwait)– Global recession has limited economic migrants
because of bleak job outlook in desired countries

Illegal Aliens in the United States by Country of Origin, 1996 (in 1,000s)
2700
335
165
120
105
95
90
70
70
70
0 500 1000 1500 2000 2500 3000
MexicoEl SalvadorGuatemala
CanadaHaiti
PhilippinesHonduras
PolandNicaraguaBahamas
Slide graphic courtesy of Dr. Jean-Paul Rodrigue, Hofstra University
Most illegal immigrants in the US are “overstays”; people who come to the US legally but overstay their Visa

Visas granted by Country FY 2007 FY 2012Brazil 90% 97%China 79% 91%Dominican Rep. 60% 68%Ecuador 72% 81%India 78% 76%Indonesia 60% 88%Iran 55% 62%Jamaica 62% 58%Mexico 67% 89%Nicaragua 54% 72%Nigeria 68% 66%Pakistan 60% 63%Philippines 68% 76%Russia 88% 90%Saudi Arabia 94% 92%Turkey 85% 93%
Should we focus on this issue instead of “beefing up” the boarder?

75.669.1
6253
912.5
1824
11.7 12.1 13 14
3.6 6.3 7 9
0%
20%
40%
60%
80%
100%
1990 2000 2025 2050
Asian/ OtherBlackHispanicWhite
US Population by Race and Ethnicity, 1990-2050
Whites becoming the minority-majority?