ch 4 - 28 © 2000 by prentice-hall inc russell/taylor oper mgt 3/e example r-chart
TRANSCRIPT
Ch 4 - 28© 2000 by Prentice-Hall IncRussell/Taylor Oper Mgt 3/e
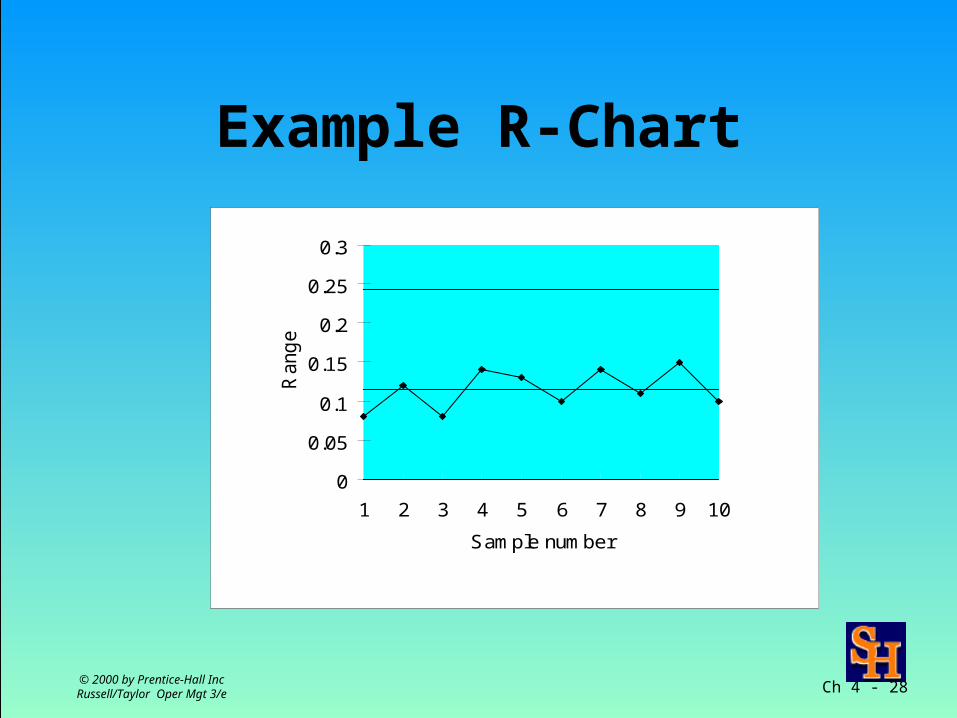
Example R-Chart
0
0.05
0.1
0.15
0.2
0.25
0.3
1 2 3 4 5 6 7 8 9 10
Sample number
Rang
e

Ch 4 - 29© 2000 by Prentice-Hall IncRussell/Taylor Oper Mgt 3/e
x Chart Calculations
xn
cm
UCL x R
LCL x R
x
R
x x x
AA
n
1 2
2
2
50 0910
5 01
5 01 0 58 115 5 08
5 01 0 58 115 4 94
..
. . . .
. . . .
average of sample means
average range value
Ch 4 - 30© 2000 by Prentice-Hall IncRussell/Taylor Oper Mgt 3/e
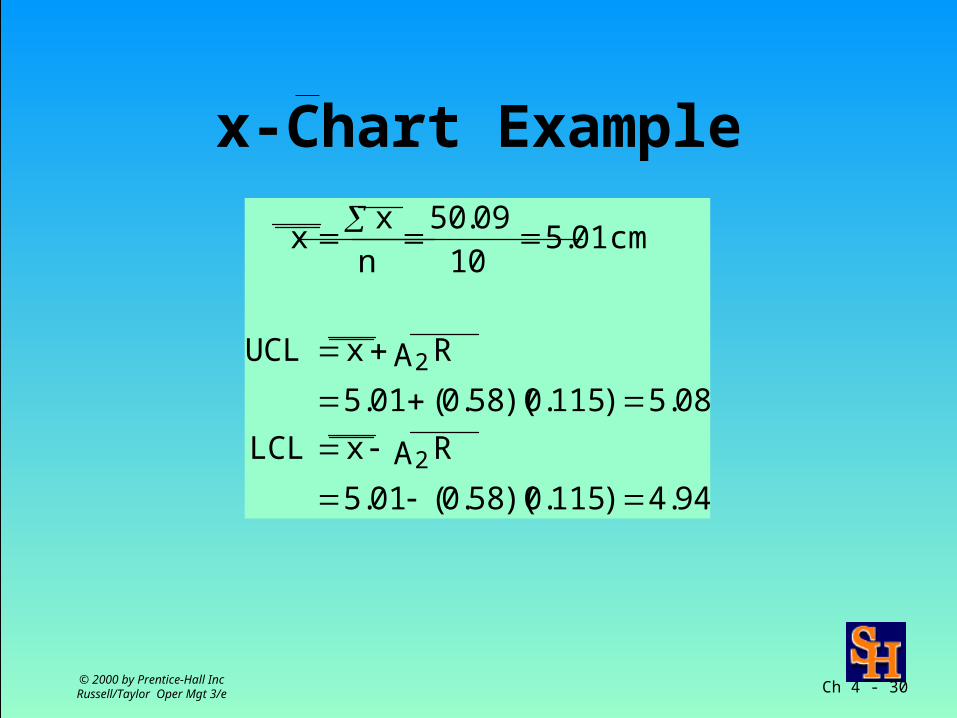
x-Chart Example
x x
n
50.0910
5.01cm
UCL x 2A R
5.01 (0.58)(0.115) 5.08
LCL x 2A R
5.01 (0.58)(0.115) 4.94
Ch 4 - 31© 2000 by Prentice-Hall IncRussell/Taylor Oper Mgt 3/e
Using x- and R-Charts Together
• Each measures process differently
• Process average and variability must be in control
Ch 4 - 32© 2000 by Prentice-Hall IncRussell/Taylor Oper Mgt 3/e
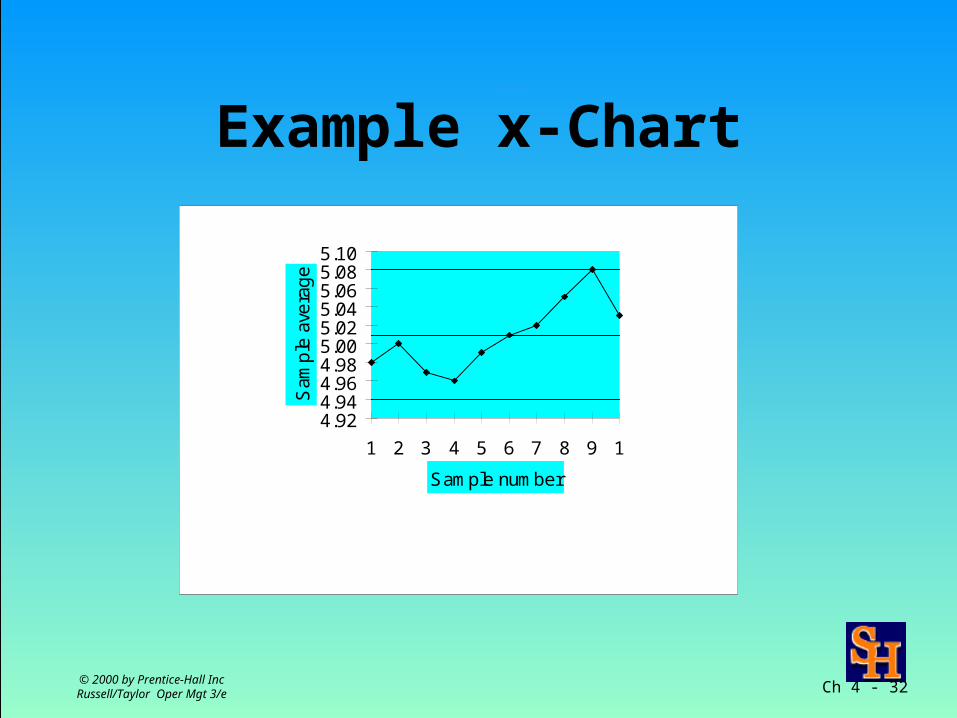
Example x-Chart
4.924.944.964.985.005.025.045.065.085.10
1 2 3 4 5 6 7 8 9 1
Sample number
Sam
ple
ave
rag
e
Ch 4 - 34© 2000 by Prentice-Hall IncRussell/Taylor Oper Mgt 3/e
UCL
LCL LCL
UCL
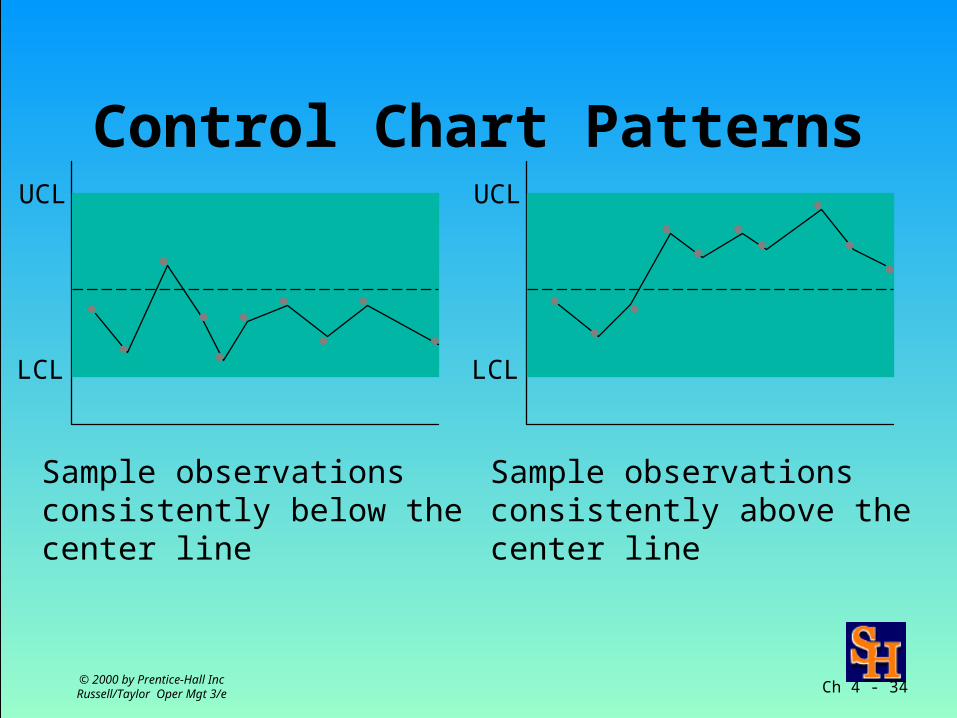
Sample observationsconsistently below thecenter line
Sample observationsconsistently above thecenter line
Control Chart Patterns
Ch 4 - 35© 2000 by Prentice-Hall IncRussell/Taylor Oper Mgt 3/e
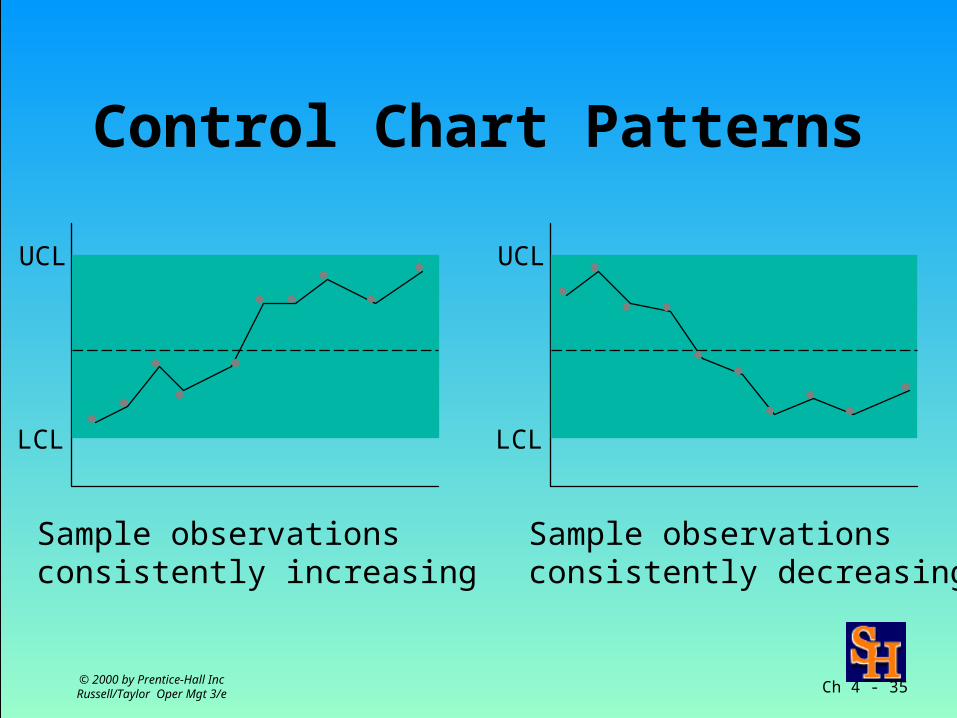
Control Chart Patterns
LCL LCL
UCL UCL
Sample observationsconsistently increasing
Sample observationsconsistently decreasing
Ch 4 - 36© 2000 by Prentice-Hall IncRussell/Taylor Oper Mgt 3/e
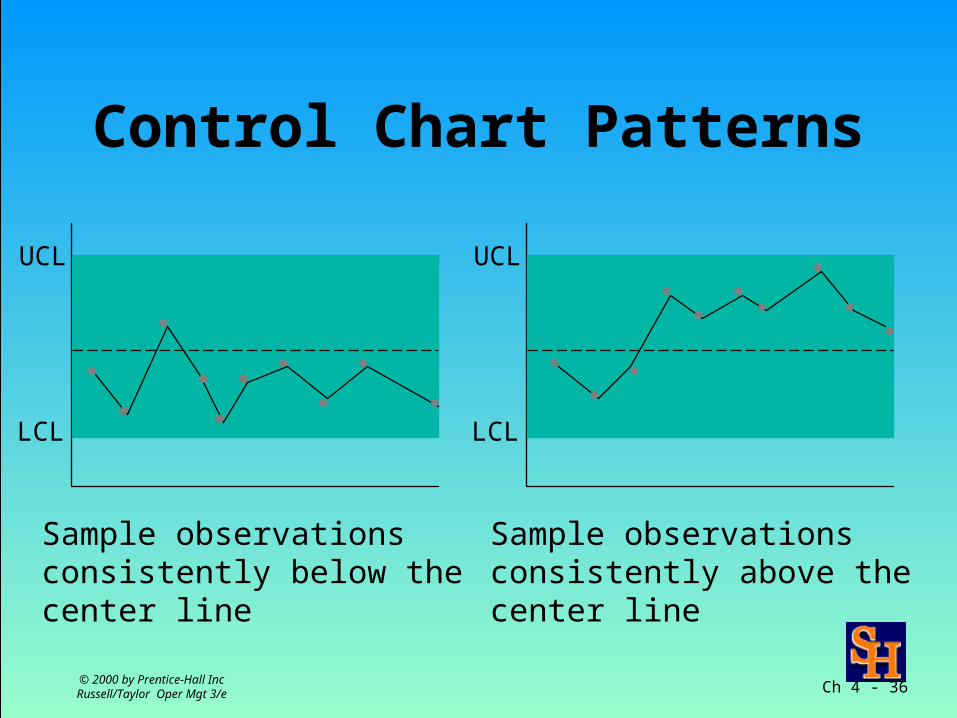
Control Chart Patterns
UCL
LCL LCL
UCL
Sample observationsconsistently below thecenter line
Sample observationsconsistently above thecenter line
Ch 4 - 38© 2000 by Prentice-Hall IncRussell/Taylor Oper Mgt 3/e
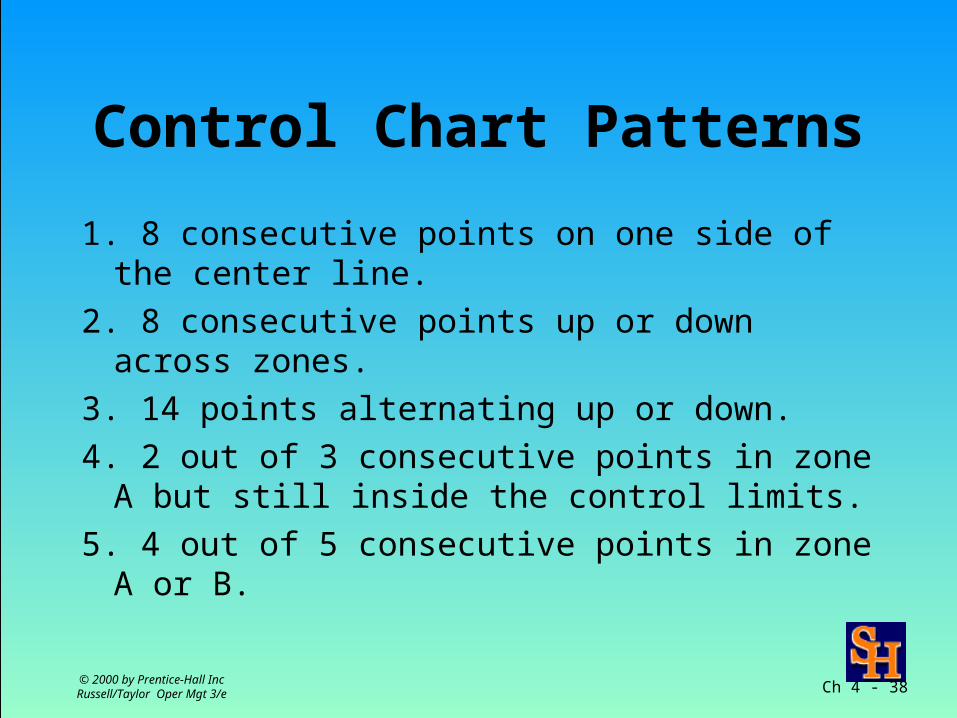
Control Chart Patterns
1. 8 consecutive points on one side of the center line.2. 8 consecutive points up or down across zones.3. 14 points alternating up or down.4. 2 out of 3 consecutive points in zone A but still inside
the control limits.5. 4 out of 5 consecutive points in zone A or B.
Ch 4 - 41© 2000 by Prentice-Hall IncRussell/Taylor Oper Mgt 3/e
Sample Size Determination
• Attribute control charts–50 to 100 parts in a sample
• Variable control charts–2 to 10 parts in a sample
Ch 4 - 42© 2000 by Prentice-Hall IncRussell/Taylor Oper Mgt 3/e
Process Capability• Range of natural variability in process
– Measured with control charts.• Process cannot meet specifications if natural
variability exceeds tolerances• 3-sigma quality
– specifications equal the process control limits. • 6-sigma quality
–specifications twice as large as control limits
Ch 4 - 43© 2000 by Prentice-Hall IncRussell/Taylor Oper Mgt 3/e
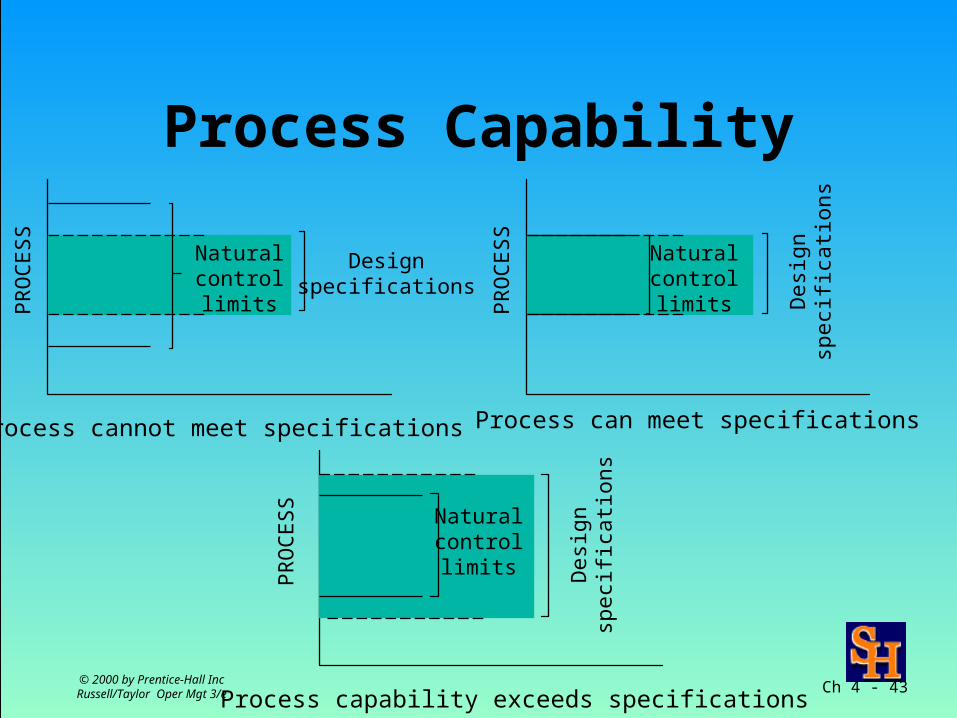
Process Capability
Process cannot meet specifications Process can meet specifications
Process capability exceeds specifications
PR
OC
ES
S
PR
OC
ES
S
PR
OC
ES
S
Naturalcontrollimits
Naturalcontrollimits
Naturalcontrollimits
Des
ign
spec
ifica
tions
Des
ign
spec
ifica
tions
Designspecifications
Ch 4 - 44© 2000 by Prentice-Hall IncRussell/Taylor Oper Mgt 3/e
Acceptance Sampling
• Accept/reject entire lot based on sample results• Not consistent with TQM of Zero Defects• Measures quality in percent defective
Ch 4 - 45© 2000 by Prentice-Hall IncRussell/Taylor Oper Mgt 3/e
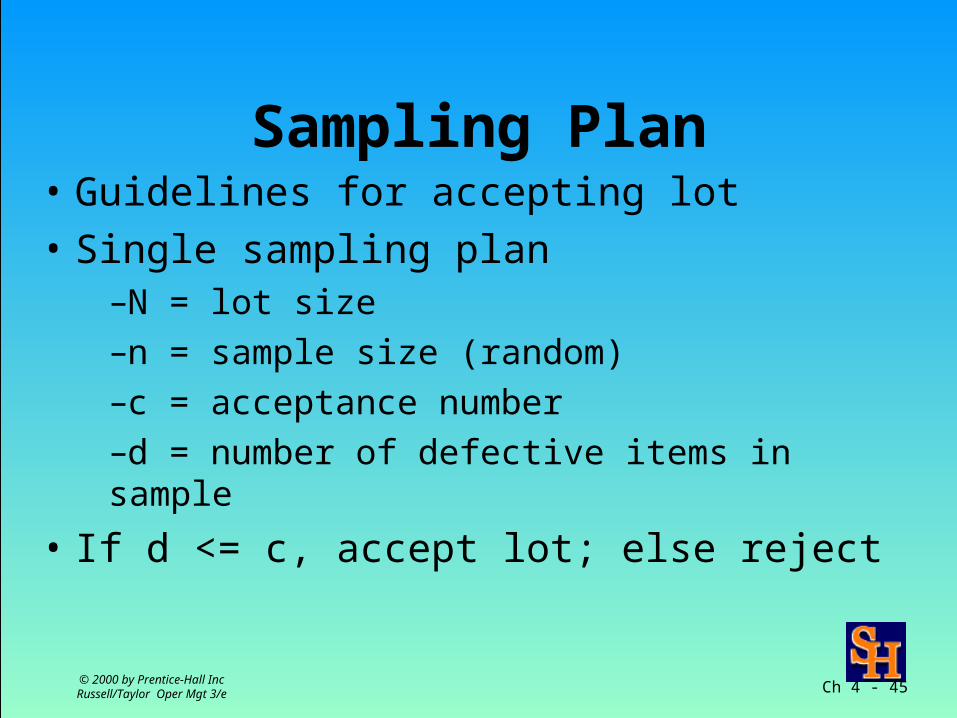
Sampling Plan• Guidelines for accepting lot• Single sampling plan
–N = lot size–n = sample size (random)–c = acceptance number–d = number of defective items in sample
• If d <= c, accept lot; else reject
Ch 4 - 46© 2000 by Prentice-Hall IncRussell/Taylor Oper Mgt 3/e
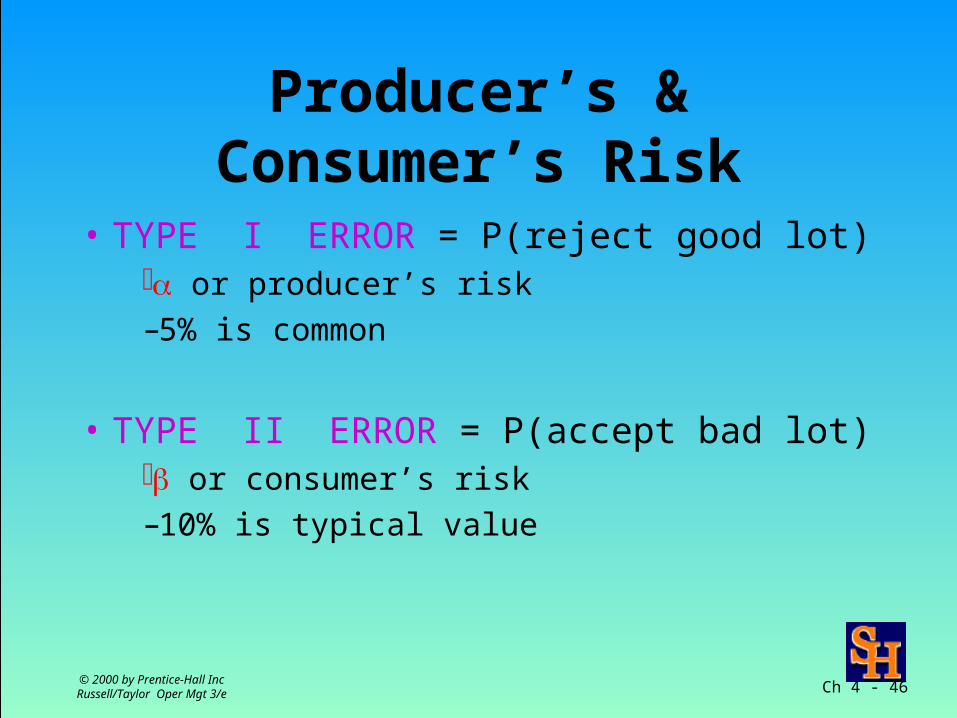
Producer’s & Consumer’s Risk
• TYPE I ERROR = P(reject good lot) or producer’s risk –5% is common
• TYPE II ERROR = P(accept bad lot) or consumer’s risk–10% is typical value

Ch 4 - 47© 2000 by Prentice-Hall IncRussell/Taylor Oper Mgt 3/e
Quality Definitions
• Acceptance quality level (AQL)–Acceptable fraction defective in a lot
• Lot tolerance percent defective (LTPD)–Maximum fraction defective accepted in a lot
Ch 4 - 48© 2000 by Prentice-Hall IncRussell/Taylor Oper Mgt 3/e
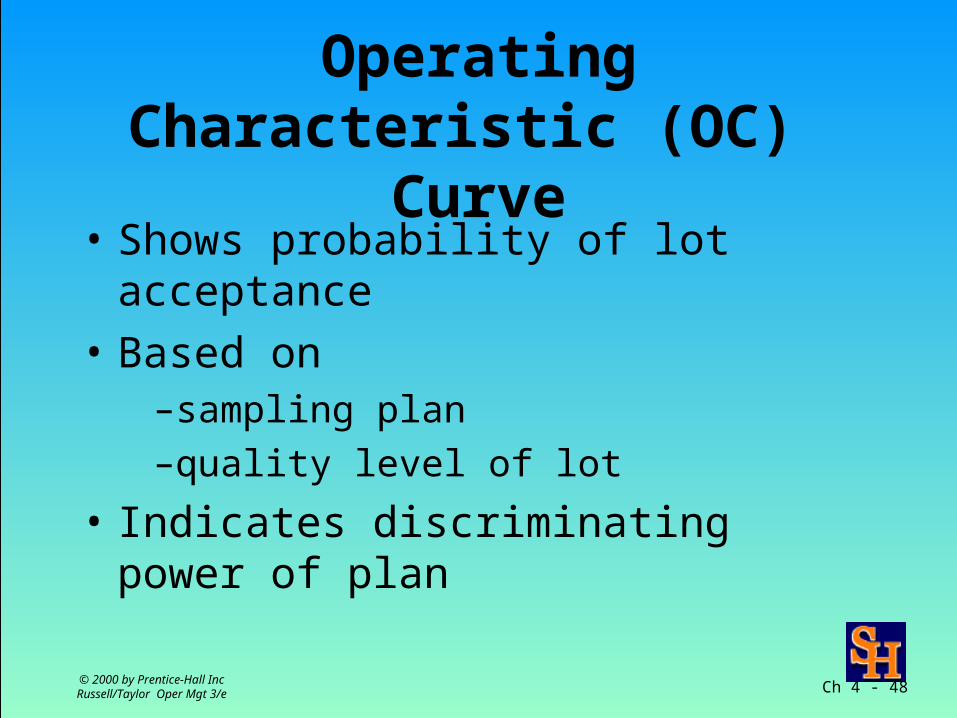
Operating Characteristic (OC) Curve
• Shows probability of lot acceptance• Based on
–sampling plan –quality level of lot
• Indicates discriminating power of plan
Ch 4 - 49© 2000 by Prentice-Hall IncRussell/Taylor Oper Mgt 3/e
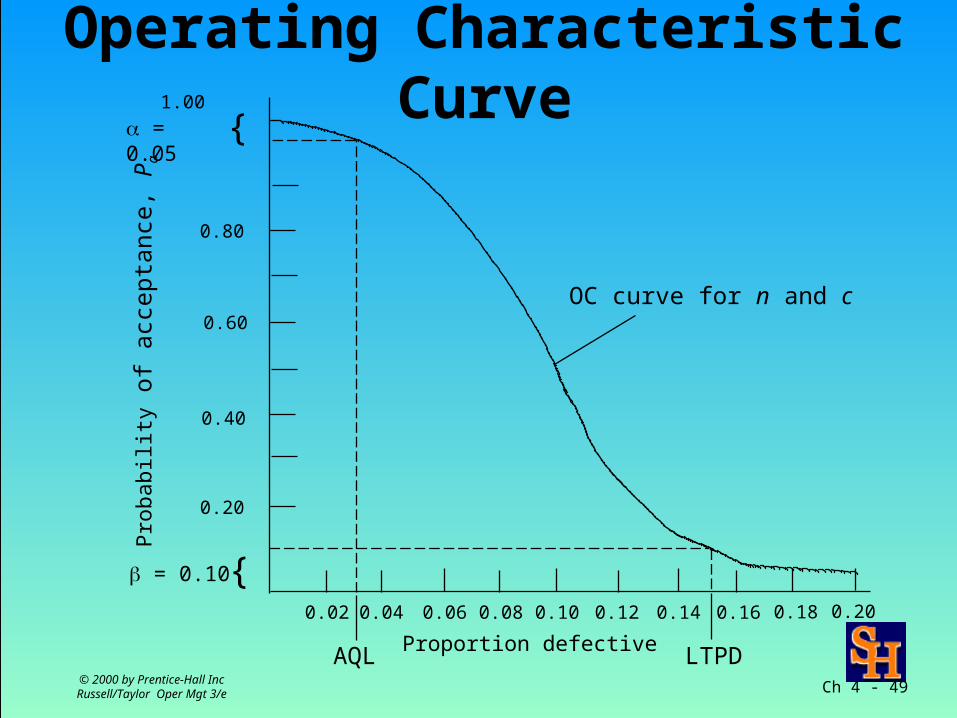
Operating Characteristic Curve
AQL LTPD
= 0.10
= 0.05P
roba
bilit
y of
acc
epta
nce,
Pa
{
0.60
0.40
0.20
0.02 0.04 0.06 0.08 0.10 0.12 0.14 0.16 0.18 0.20
0.80
{
Proportion defective
1.00
OC curve for n and c
Ch 4 - 50© 2000 by Prentice-Hall IncRussell/Taylor Oper Mgt 3/e
Average Outgoing Quality (AOQ)
• Expected number of defective items passed to customer
• Average outgoing quality limit (AOQL) is–maximum point on AOQ curve
Ch 4 - 51© 2000 by Prentice-Hall IncRussell/Taylor Oper Mgt 3/e
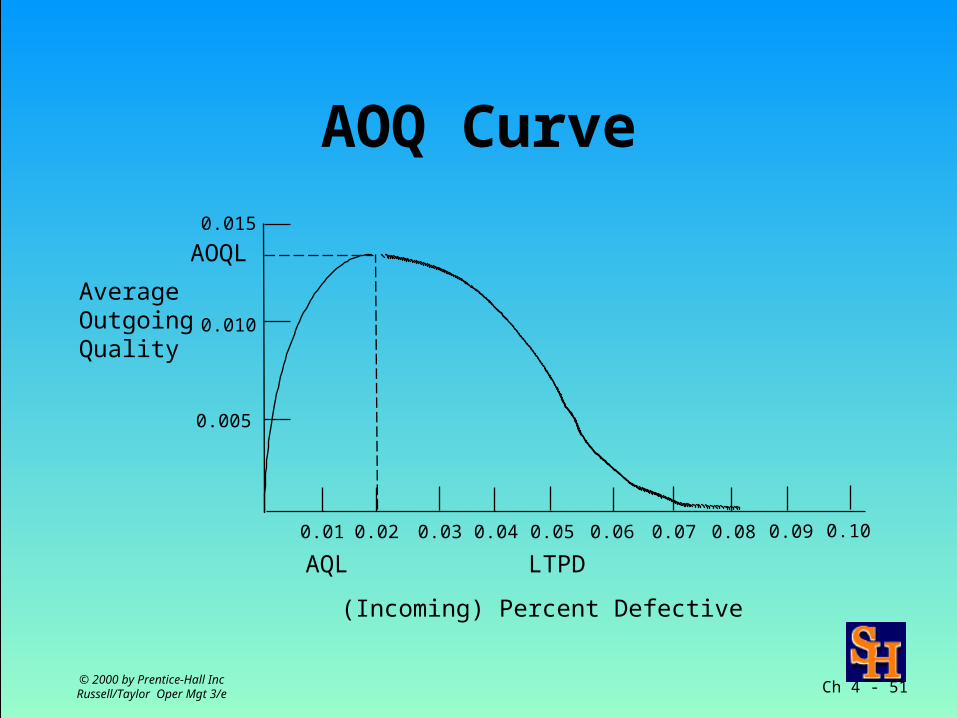
AOQ Curve
0.015
0.010
0.005
0.01 0.02 0.03 0.04 0.05 0.06 0.07 0.08 0.09 0.10
AOQL
AverageOutgoingQuality
(Incoming) Percent Defective
AQL LTPD
Ch 4 - 52© 2000 by Prentice-Hall IncRussell/Taylor Oper Mgt 3/e
Double Sampling Plans
• Take small initial sample–If # defective < lower limit, accept–If # defective > upper limit, reject–If # defective between limits, take second sample
• Accept or reject based on 2 samples• Less costly than single-sampling plans

Ch 4 - 53© 2000 by Prentice-Hall IncRussell/Taylor Oper Mgt 3/e
Multiple (Sequential) Sampling Plans
• Uses smaller sample sizes• Take initial sample
–If # defective < lower limit, accept–If # defective > upper limit, reject–If # defective between limits, resample
• Continue sampling until accept or reject lot based on all sample data
Ch 4 - 54© 2000 by Prentice-Hall IncRussell/Taylor Oper Mgt 3/e
Choosing A Sampling Method
• An economic decision• Single sampling plans
–high sampling costs• Double/Multiple sampling plans
–low sampling costs