cge models for regional policy research: notes and...
TRANSCRIPT

CGE Models for Regional Policy Research: Notes and ExamplesDavid Roland-Holst, UC BerkeleyDRC Modeling WorkshopBeijing, PRCNovember, 2004

Contents
1. General considerations for policy modeling2. Examples of CGE applications3. Strategy for DRC model development4. Generic model descriptions5. Proposed timetables for implementation

Modelingtechniquecomputingparameters
dataetc
Policy analyst’s balancing act
Policy makingtrade-offs
timingbalancing interests
Polic
y an
alys
t

The GE Modeling Offers
Linkages and Indirect (and otherwise invisible) effectsEffects of resource and other constraintsSubstitution patterns

The process of policy analysis
Preliminary steps
Understand the problem and how it has been addressed in the pastUnderstand the things that most concern the policy maker

The process of policy analysisThe modeling
Think about the GE aspects of the problemWhy are we using a GE model for this issue?
Get the modeling rightMake sure the problem is represented in the modeleg must have base tariffs if they are to be removed
Understand and explore the resultsWhat key parameters or data drive the resultsHow do changes in these change the results

The process of policy analysis
The communication
Explain without any technical detailCover policy makers concernsRepeat all the steps as necessary

Examples of CGE Applications

Some examples
Agricultural PolicyTrade policyTax policyEnvironmental regulation and reformPoverty and Inequality

Agricultural PolicyThe issue
What does agriculture contribute to the economy and what does the (domestic and international) economy contribute to agricultureWhat are the detailed effects of agriculture policy?
Why a CGE model?Agriculture remains a dominant sector in China, the most important source of income for the poor, and will experience many transitions in the next generation
Key insightsAgriculture can be a main driver for growth and poverty alleviation, but the composition of this growth will be very complexBig contrast with partial equilibrium analysis

Trade policyThe issue
Effect of changes in tariffs and other forms of industry assistance
Why a CGE model?Trade policy is the classic GE problem
Key insightsFor dynamic exporters like China, it is a rich story about how the benefits and costs of protection were distributed

Tax policyThe issue
Effect of replacing wholesale sales tax with goods and services value added tax
Why a CGE model?Very complicated initial structure of taxes
Key insightsOverall gains very small andvery sensitive to some key assumptions

Environmental regulationThe issue
Effects of regulations such as:pollutionResource (water, fisheries, forestry) policy
Why a CGE model?Still emerging in a live policy debateEnergy and water, for example, key inputs to all production processes
Key insightsEnvironmental policies have many indirect effects

Poverty and InequalityThe issue
What is the real composition of income and growth effects?
Why a CGE model?Institutional detail is essentialRelative incomes are determined by relative pricesConstraints play a major role in incidence and distribution
Key insightsWho are the winners and how can they be enlisted to support policy?Who are the losers and how can they be compensated?

DRC Modeling Strategy

Basic Tenets of Modeling StrategyPolicy makers need visibility. Economic models
make a lasting contribution to this under three conditions:1. They must incorporate advanced data and
methods.2. Their results must be transparent.3. They must be locally implemented.
In order to achieve these three goals, we propose a three tier modeling facility.

Three Model Archetypes1. National research prototype model – A
state-of-the-art single country CGE model.2. Single region model - for local
implementation, a simplified single country CGE with a user-friendly interface.
3. National multi-regional model – A model based on the LINKAGE/GTAP multi-country framework, with flexible regional aggregation.

A Generic Modeling Facility
Analytical Analytical Economic Economic
ModelModel
SocialSocialAccountingAccounting
MatrixMatrix
SatelliteSatelliteAccountsAccounts
AggregationAggregation CGECGE ForecastingForecastingModelModel
Analytical Economic Model
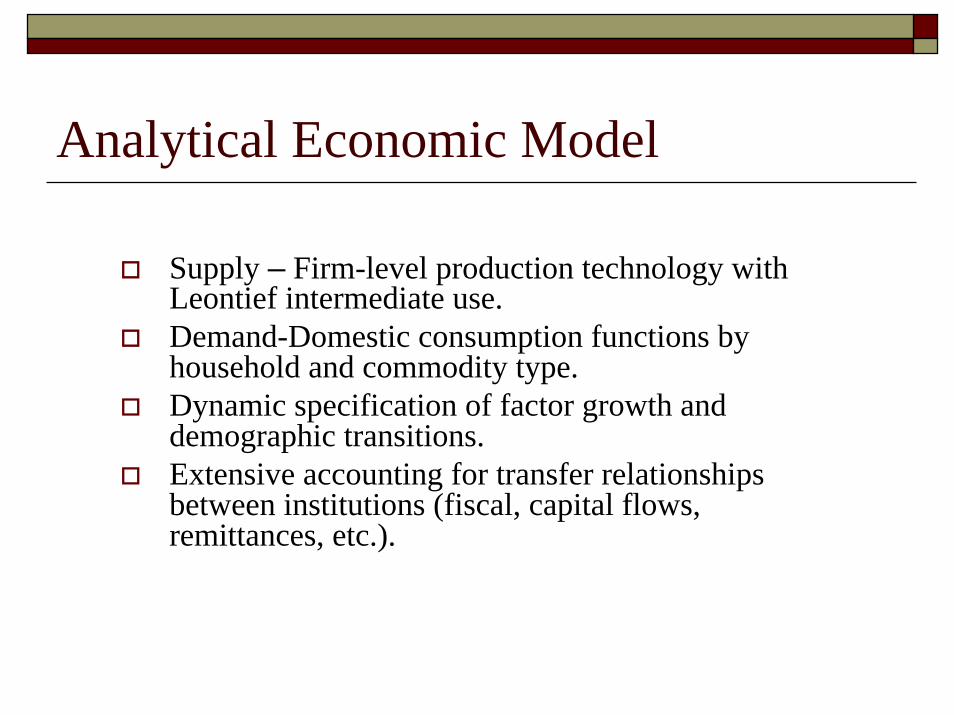
Supply – Firm-level production technology with Leontief intermediate use.Demand-Domestic consumption functions by household and commodity type.Dynamic specification of factor growth and demographic transitions.Extensive accounting for transfer relationships between institutions (fiscal, capital flows, remittances, etc.).

Forward-looking Policy Analysis
Policy Scenarios
CGEForecasting
Model
Projections for China/Region
to 2020
Baseline Economic Conditions

Single Region Model: A Schematic ViewSocial Accounting
Matrix
Econometric Parameter Estimates
Policy Scenarios CGE Model Baseline Calibration Data
Numerical Results Graphical Output
Development
Simulation
Analysis
Box Color Key to Software Implementation: Green – Microsoft ExcelYellow – GAMS

Multi-region Model Structurebased on the LINKAGE model byDominique van der Mensbrugghe

Model structure I—OverviewMulti-sectoral and multi-regionalConstant-returns-to-scale and perfect competition(Recursive) dynamicSingle representative household per regionGovernment and investment activitiesLinked bilateral trade flows.

Model structure II—ProductionThree production archetypes:
Crops (extensive vs. intensive)Livestock (range-fed vs. ranch-fed)Other (standard capital-labor substitution)
Crop sectors include land, energy and agricultural chemicals as substitutable inputsLivestock includes land and feed as substitutable inputsEnergy is a substitutable input in other sectorsFossil fuels also rely on sector-specific resource.

Model structure III—Factor marketsLabor is perfectly mobile across sectors and there is a single market-clearing wage rate.‘New’ capital is mobile across sectors, installed capital is partially mobile.All factor income accrues to single representative householdExtended linear expenditure system for consumer demand

Model structure IV—ImportsAggregate demand is the sum of demand across industries, households, government and investment.Aggregate demand is composed of domestic and imported goods.Dual nested CES structure. Top nest allocates aggregate demand between domestic goods and an aggregate import bundle.Second nest allocates aggregate import demand across regions of origin.
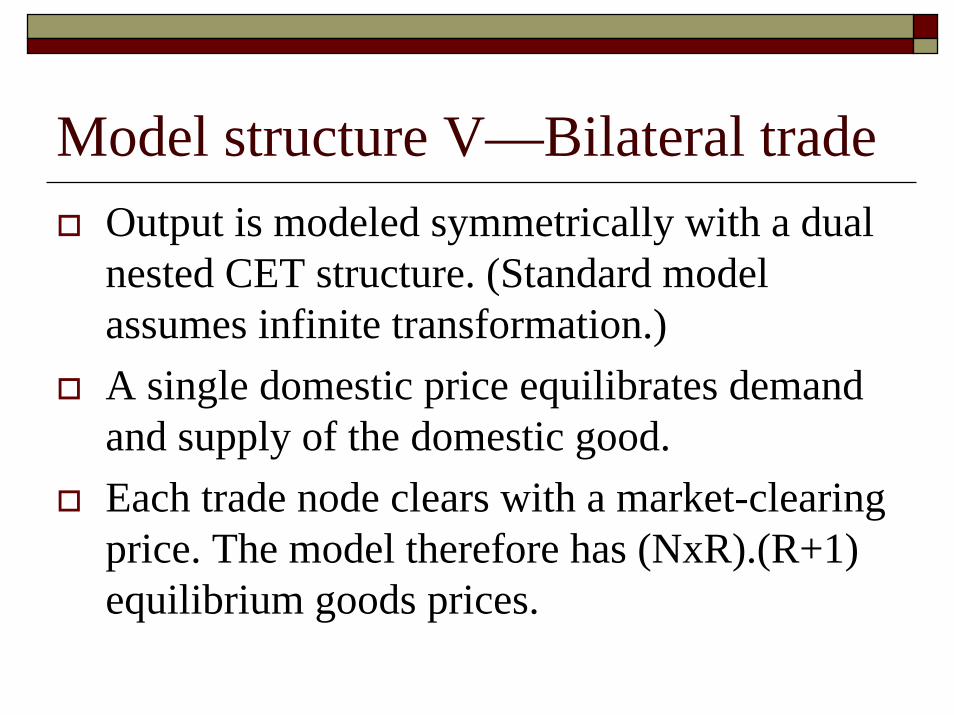
Model structure V—Bilateral tradeOutput is modeled symmetrically with a dual nested CET structure. (Standard model assumes infinite transformation.)A single domestic price equilibrates demand and supply of the domestic good.Each trade node clears with a market-clearing price. The model therefore has (NxR).(R+1) equilibrium goods prices.

Model structure VI—Trade wedges
Each traded commodity has four prices—pre-FOB (export subsidy excluded), FOB, CIF, and post-CIF (tariff inclusive).FOB/CIF wedge modeled using international trade and transport services.Model also includes trade friction parameter (so-called iceberg parameter).

Model structure VII—ClosureTaxes on intermediate inputs and final demand, factors of production, output, trade, and households.All taxes are exogenous save household direct taxes. The latter are endogenous to hit a given fiscal balance.Investment is savings (private, public and foreign) driven.Net foreign savings are exogenous.Model numéraire is OECD manufactured export price index.

Model structure VIII—DynamicsLabor force and population growth are exogenous.Capital stock is driven by past investments (and depreciation).Productivity is calibrated in baseline to achieve a GDP growth target.Productivity is typically exogenous (i.e. fixed) in policy scenarios, though some scenarios link sectoral productivity to export/output ratio.

Model structure IX—VariationsSegmented labor markets (e.g. rural vs. urban) with or without migration.Minimum wage (with endogenous regime switch).Tariff rate quotas (TRQs).International capital mobility (driven by changes in relative rates of return).Increasing returns to scale with contestable markets

Proposed Project Timetables

Proposed Development TimetableEach modeling exercise below includes SAM and other data
development:1. National research prototype
January, 2005Essentially an update of the existing DRC model
2. Single region prototype March, 2005
Initial version of the model and interface implemented with the national database.
3. Application to seven sample provincesApril, 2005
This will be done collaboratively, including joint work at UC Berkeley.

Proposed Dissemination Timetable
1. Regional dissemination workshops May, 2005
2. National dissemination workshopsJune, 2005
3. Documentation and Final Reporting