cfo10e ch01macro crs 1click
TRANSCRIPT

5/13/2018 CFO10e Ch01macro CRS 1click - slidepdf.com
http://slidepdf.com/reader/full/cfo10e-ch01macro-crs-1click 1/53
P A
R T
I I n t r o d u c t i o n t o E c o n o m
i c s
© 2012 Pearson Education, Inc. Publishing as Prentice Hall
Prepared by: Fernando Quijano & Shelly TefftCASE FAIR OSTER
P R I N C I P L E S O F
MACROECONOMICST E N T H E D I T I O N
5/13/2018 CFO10e Ch01macro CRS 1click - slidepdf.com
http://slidepdf.com/reader/full/cfo10e-ch01macro-crs-1click 2/53
2 of 53
P A
R T
I I n t r o d u c t i o n t o E c o n o m
i c s
© 2012 Pearson Education, Inc. Publishing as Prentice Hall

5/13/2018 CFO10e Ch01macro CRS 1click - slidepdf.com
http://slidepdf.com/reader/full/cfo10e-ch01macro-crs-1click 3/53
3 of 53
P A R T
I I n t r o d u c t i o n t o E c o n o m
i c s
© 2012 Pearson Education, Inc. Publishing as Prentice Hall
1
PART I INTRODUCTION TO ECONOMICS
The Scope and
Method of EconomicsCHAPTER OUTLINE
Why Study Economics?To Learn a Way of Thinking
To Understand Society
To Understand Global Affairs
To Be an Informed Citizen
The Scope of EconomicsMicroeconomics and
Macroeconomics
The Diverse Fields of Economics
The Method of EconomicsDescriptive Economics and
Economic Theory
Theories and Models
Economic Policy
An Invitation
Appendix: How to Read
and Understand Graphs

5/13/2018 CFO10e Ch01macro CRS 1click - slidepdf.com
http://slidepdf.com/reader/full/cfo10e-ch01macro-crs-1click 4/53
P A R T
I I n t r o d u c t i o n t o E c o n o m
i c s
© 2012 Pearson Education, Inc. Publishing as Prentice Hall
economics The study of howindividuals and societies choose to usethe scarce resources that nature andprevious generations have provided.
Economics is the study of how individuals and societies chooseto use the scarce resources that nature and previous generationshave provided. The key word in this definition is choose.
Economics is a behavioral, or social, science. In large measure, itis the study of how people make choices. The choices that peoplemake, when added up, translate into societal choices.
4 of 37

5/13/2018 CFO10e Ch01macro CRS 1click - slidepdf.com
http://slidepdf.com/reader/full/cfo10e-ch01macro-crs-1click 5/53
5 of 53
P A R T
I I n t r o d u c t i o n t o E c o n o m
i c s
© 2012 Pearson Education, Inc. Publishing as Prentice Hall
What is economics?
a. Economics is the study of money and financial systems.
b. Economics is the study of business.c. Economics is a behavioral science that studies how people make choices.
d. Economics is a natural science that studies the resources that nature and
previous generations have provided.
5/13/2018 CFO10e Ch01macro CRS 1click - slidepdf.com
http://slidepdf.com/reader/full/cfo10e-ch01macro-crs-1click 6/53
6 of 53
P A R T
I I n t r o d u c t i o n t o E c o n o m i c s
© 2012 Pearson Education, Inc. Publishing as Prentice Hall
What is economics?
a. Economics is the study of money and financial systems.
b. Economics is the study of business.c.c. Economics is a behavior al science that studies how people makeEconomics is a behavior al science that studies how people make
choices.choices.
d. Economics is a natural science that studies the resources that nature and
previous generations have provided.
5/13/2018 CFO10e Ch01macro CRS 1click - slidepdf.com
http://slidepdf.com/reader/full/cfo10e-ch01macro-crs-1click 7/53
7 of 53
P A R T
I I n t r o d u c t i o n t o E c o n o m i c s
© 2012 Pearson Education, Inc. Publishing as Prentice Hall
Three fundamental concepts:
Opportunity cost
Marginalism
Efficient markets
To Learn a Way of Thinking
Why Study Economics?

5/13/2018 CFO10e Ch01macro CRS 1click - slidepdf.com
http://slidepdf.com/reader/full/cfo10e-ch01macro-crs-1click 8/53
8 of 53
P A R T
I I n t r o d u c t i o n t o E c o n o m i c s
© 2012 Pearson Education, Inc. Publishing as Prentice Hall
To Learn a Way of Thinking
Why Study Economics?
Opportunity Cost
opportunity cost The best alternative thatwe forgo, or give up, when we make achoice or a decision.
scarce Limited.

5/13/2018 CFO10e Ch01macro CRS 1click - slidepdf.com
http://slidepdf.com/reader/full/cfo10e-ch01macro-crs-1click 9/53
9 of 53
P A R T
I I n t r o d u c t i o n t o E c o n o m i c s
© 2012 Pearson Education, Inc. Publishing as Prentice Hall
What is opportunity cost?
a. Opportunity cost refers to costs that cannot be avoided, regardless of what is done in
the future, because they have already been incurred.
b. Opportunity cost is the value of what we give up by not making the alternative choice.c. Opportunity cost is a business concept that explains why it is important to consider
the additional cost of production, not just the initial cost, in making production
decisions.
d. Opportunity cost is a cost associated with the allocation of abundant resources
among alternative uses.
e. Opportunity cost is a monetary measure of cost that takes into account only explicitcosts, or costs that can be counted.

5/13/2018 CFO10e Ch01macro CRS 1click - slidepdf.com
http://slidepdf.com/reader/full/cfo10e-ch01macro-crs-1click 10/53
10 of 53
P A R T
I I n t r o d u c t i o n t o E c o n o m i c s
© 2012 Pearson Education, Inc. Publishing as Prentice Hall
What is opportunity cost?
a. Opportunity cost refers to costs that cannot be avoided, regardless of what is done in
the future, because they have already been incurred.
b.b. Oppor tunity cost is the value of what we give up by not making the alternativeOppor tunity cost is the value of what we give up by not making the alternativechoice.choice.
c. Opportunity cost is a business concept that explains why it is important to consider the
additional cost of production, not just the initial cost, in making production decisions.
d. Opportunity cost is a cost associated with the allocation of abundant resources among
alternative uses.
e. Opportunity cost is a monetary measure of cost that takes into account only explicitcosts, or costs that can be counted.

5/13/2018 CFO10e Ch01macro CRS 1click - slidepdf.com
http://slidepdf.com/reader/full/cfo10e-ch01macro-crs-1click 11/53
11 of 53
P A R T
I I n t r o d u c t i o n t o E c o n o m i c s
© 2012 Pearson Education, Inc. Publishing as Prentice Hall
To Learn a Way of Thinking
Why Study Economics?
Marginalism
marginalism The process of analyzing theadditional or incremental costs or benefitsarising from a choice or decision.
sunk costs Costs that cannot be avoided
because they have already been incurred.

5/13/2018 CFO10e Ch01macro CRS 1click - slidepdf.com
http://slidepdf.com/reader/full/cfo10e-ch01macro-crs-1click 12/53
12 of 53
P A R T
I I n t r o d u c t i o n t o E c o n o m i c s
© 2012 Pearson Education, Inc. Publishing as Prentice Hall
To Learn a Way of Thinking
Why Study Economics?
Efficient Markets²No Free Lunch
efficient market A market in whichprofit opportunities are eliminatedalmost instantaneously.
The study of economics teaches us a wayof thinking and helps us make decisions.

5/13/2018 CFO10e Ch01macro CRS 1click - slidepdf.com
http://slidepdf.com/reader/full/cfo10e-ch01macro-crs-1click 13/53
13 of 53
P A R T
I I n t r o d u c t i o n t o E c o n o m i c s
© 2012 Pearson Education, Inc. Publishing as Prentice Hall
To Understand Society
Why Study Economics?
Industrial Revolution The period inEngland during the late eighteenth and earlynineteenth centuries in which newmanufacturing technologies and improvedtransportation gave rise to the modern factorysystem and a massive movement of thepopulation from the countryside to the cities.
The study of economics is an essential part of the study of society.
5/13/2018 CFO10e Ch01macro CRS 1click - slidepdf.com
http://slidepdf.com/reader/full/cfo10e-ch01macro-crs-1click 14/53
14 of 53
P A R T
I I n t r o d u c t i o n t o E c o n o m i c s
© 2012 Pearson Education, Inc. Publishing as Prentice Hall
To Understand Global Affairs
Why Study Economics?
An understanding of economics is essentialto an understanding of global affairs.
To Be an Informed Citizen
To be an informed citizen requires a basicunderstanding of economics.

5/13/2018 CFO10e Ch01macro CRS 1click - slidepdf.com
http://slidepdf.com/reader/full/cfo10e-ch01macro-crs-1click 15/53
15 of 53
P A R T
I I n t r o d u c t i o n t o E c o n o m i c s
© 2012 Pearson Education, Inc. Publishing as Prentice Hall
E C O N O M I C S I N P R A C T I C E
iPod and the World
A sticker that says ³Made in China´ can often bemisleading.
Indeed, for the iPod, which is composed of manysmall parts, it is almost impossible to accurately
tell exactly where each piece was producedwithout pulling it apart.
From an economics point of view one often has to dig a little deeper to seewhat is really going on.

5/13/2018 CFO10e Ch01macro CRS 1click - slidepdf.com
http://slidepdf.com/reader/full/cfo10e-ch01macro-crs-1click 16/53
16 of 53
P
A R T
I I n t r o d u c t i o n t o E c o n o m i c s
© 2012 Pearson Education, Inc. Publishing as Prentice Hall
Microeconomics and Macroeconomics
The Scope of Economics
microeconomics The branch of economics thatexamines the functioning of individual industriesand the behavior of individual decision-makingunits²that is, firms and households.
Microeconomics looks at the individual unit²the household,the firm, the industry. It sees and examines the ³trees.´Macroeconomics looks at the whole, the aggregate. It seesand analyzes the ³forest.´
macroeconomics The branch of economicsthat examines the economic behavior of aggregates²income, employment, output, andso on²on a national scale.

5/13/2018 CFO10e Ch01macro CRS 1click - slidepdf.com
http://slidepdf.com/reader/full/cfo10e-ch01macro-crs-1click 17/53
17 of 53
P
A R T
I I n t r o d u c t i o n t o E c o n o m i c s
© 2012 Pearson Education, Inc. Publishing as Prentice Hall
Microeconomics and Macroeconomics
The Scope of Economics
TABLE 1.1 Examples of Microeconomic and Macroeconomic Concerns
Divisions
of Economics Production Prices Income Employment
Microeconomics Pr oduction/output in
individual indust r ies and businesses
How much steelHow much office
spaceHow many cars
Pr ice of individual
goods and ser vices
Price of medical carePrice of gasolineFood prices
Apartment rents
Dist r ibution of
income and wealth
Wages in the autoindustry
Minimum wageExecutive salariesPoverty
Employment by
individual businessesand indust r ies
Jobs in the steelindustry
Number of employeesin a firm
Number of accountants
Macroeconomics N ational
pr oduction/output
Total industrial outputGross domestic
productGrowth of output
Agg r egate pr ice level
Consumer pricesProducer pricesRate of inflation
N ational income
Total wages andsalaries
Total corporateprofits
Employment and
unemployment inthe economy
Total number of jobsUnemployment rate

5/13/2018 CFO10e Ch01macro CRS 1click - slidepdf.com
http://slidepdf.com/reader/full/cfo10e-ch01macro-crs-1click 18/53
18 of 53
P
A R T
I I n t r o d u c t i o n t o E c o n o m i c s
© 2012 Pearson Education, Inc. Publishing as Prentice Hall
Which of the following statements is correct?
a. The aggregate price level is a subject of concern in microeconomics.
b. A study of employment in the semiconductor industry would be categorized
as a microeconomic study.
c. The production and growth of output in the domestic economy is a
microeconomic concern.
d. Microeconomics is an in-depth study of aggregate economic behavior.
e. Microeconomics includes the study of fiscal and monetary policies, or
government policies designed to steer the economy in the right direction.

5/13/2018 CFO10e Ch01macro CRS 1click - slidepdf.com
http://slidepdf.com/reader/full/cfo10e-ch01macro-crs-1click 19/53
19 of 53
P
A R T
I I n t r o d u c t i o n t o E c o n o
m i c s
© 2012 Pearson Education, Inc. Publishing as Prentice Hall
Which of the following statements is correct?
a. The aggregate price level is a subject of concern in microeconomics.
b.b. A study of employment in the semiconductor industr y would beA study of employment in the semiconductor industr y would be
categorized as a microeconomic study.categorized as a microeconomic study.
c. The production and growth of output in the domestic economy is a
microeconomic concern.
d. Microeconomics is an in-depth study of aggregate economic behavior.
e. Microeconomics includes the study of fiscal and monetary policies, or
government policies designed to steer the economy in the right direction.

5/13/2018 CFO10e Ch01macro CRS 1click - slidepdf.com
http://slidepdf.com/reader/full/cfo10e-ch01macro-crs-1click 20/53
20 of 53
P
A R T
I I n t r o d u c t i o n t o E c o n o
m i c s
© 2012 Pearson Education, Inc. Publishing as Prentice Hall
The Diverse Fields of Economics
The Scope of Economics
TABLE 1.2 The Fields of Economics
Behavior al economics uses psychological theories relating to emotions and social context to helpunderstand economic decision making and policy. Much of the work in behavioraleconomics focuses on the biases that individuals have that affects the decisionsthey make.
C ompar ative economic systems
examines the ways alternative economic systems function. What are theadvantages and disadvantages of different systems?
Economet r ics applies statistical techniques and data to economic problems in an effort to testhypotheses and theories. Most schools require economics majors to take at leastone course in statistics or econometrics.
Economic development focuses on the problems of low-income countries. What can be done to promotedevelopment in these nations? Important concerns of development for economistsinclude population growth and control, provision for basic needs, and strategies for
international trade.Economic histor y traces the development of the modern economy. What economic and political events
and scientific advances caused the Industrial Revolution? What explains thetremendous growth and progress of post-World War II Japan? What caused theGreat Depression of the 1930s?
Continued...

5/13/2018 CFO10e Ch01macro CRS 1click - slidepdf.com
http://slidepdf.com/reader/full/cfo10e-ch01macro-crs-1click 21/53
21 of 53
P
A R T
I I n t r o d u c t i o n t o E c o n o
m i c s
© 2012 Pearson Education, Inc. Publishing as Prentice Hall
The Diverse Fields of Economics
The Scope of Economics
TABLE 1.2 The Fields of Economics (continued)
Envi r onmental economics studies the potential failure of the market system to account fully for the impacts of production and consumption on the environment and on natural resource depletion.Have alternative public policies and new economic institutions been effective incorrecting these potential failures?
F inance examines the ways in which households and firms actually pay for, or finance, their purchases. It involves the study of capital markets (including the stock and bondmarkets), futures and options, capital budgeting, and asset valuation.
Health economics analyzes the health care system and its players: government, insurers, health careproviders, and patients. It provides insight into the demand for medical care, healthinsurance markets, cost-controlling insurance plans (HMOs, PPOs, IPAs),government health care programs (Medicare and Medicaid), variations in medicalpractice, medical malpractice, competition versus regulation, and national healthcare reform.
The histor y of economic
thought,
which is grounded in philosophy, studies the development of economic ideas andtheories over time, from Adam Smith in the eighteenth century to the works of economists such as Thomas Malthus, Karl Marx, and John Maynard Keynes.Because economic theory is constantly developing and changing, studying thehistory of ideas helps give meaning to modern theory and puts it in perspective.
Indust r ial or ganization looks carefully at the structure and performance of industries and firms within aneconomy. How do businesses compete? Who gains and who loses?
Continued...

5/13/2018 CFO10e Ch01macro CRS 1click - slidepdf.com
http://slidepdf.com/reader/full/cfo10e-ch01macro-crs-1click 22/53
22 of 53
P
A R T
I I n t r o d u c t i o n t o E c o n o
m i c s
© 2012 Pearson Education, Inc. Publishing as Prentice Hall
The Diverse Fields of Economics
The Scope of Economics
TABLE 1.2 The Fields of Economics (continued)
Inter national economics studies trade flows among countries and international financial institutions. What arethe advantages and disadvantages for a country that allows its citizens to buy andsell freely in world markets? Why is the dollar strong or weak?
Labor economics deals with the factors that determine wage rates, employment, and unemployment.
How do people decide whether to work, how much to work, and at what kind of job?How have the roles of unions and management changed in recent years?
Law and economics analyzes the economic function of legal rules and institutions. How does the lawchange the behavior of individuals and businesses? Do different liability rules makeaccidents and injuries more or less likely? What are the economic costs of crime?
P ublic economics examines the role of government in the economy. What are the economic functionsof government, and what should they be? How should the government finance theservices that it provides? What kinds of government programs should confront the
problems of poverty, unemployment, and pollution? What problems doesgovernment involvement create?
U r ban and r egional
economics
studies the spatial arrangement of economic activity. Why do we have cities? Whyare manufacturing firms locating farther and farther from the center of urban areas?
5/13/2018 CFO10e Ch01macro CRS 1click - slidepdf.com
http://slidepdf.com/reader/full/cfo10e-ch01macro-crs-1click 23/53
23 of 53
P
A R T
I I n t r o d u c t i o n t o E c o n o
m i c s
© 2012 Pearson Education, Inc. Publishing as Prentice Hall
E C O N O M I C S I N P R A C T I C E
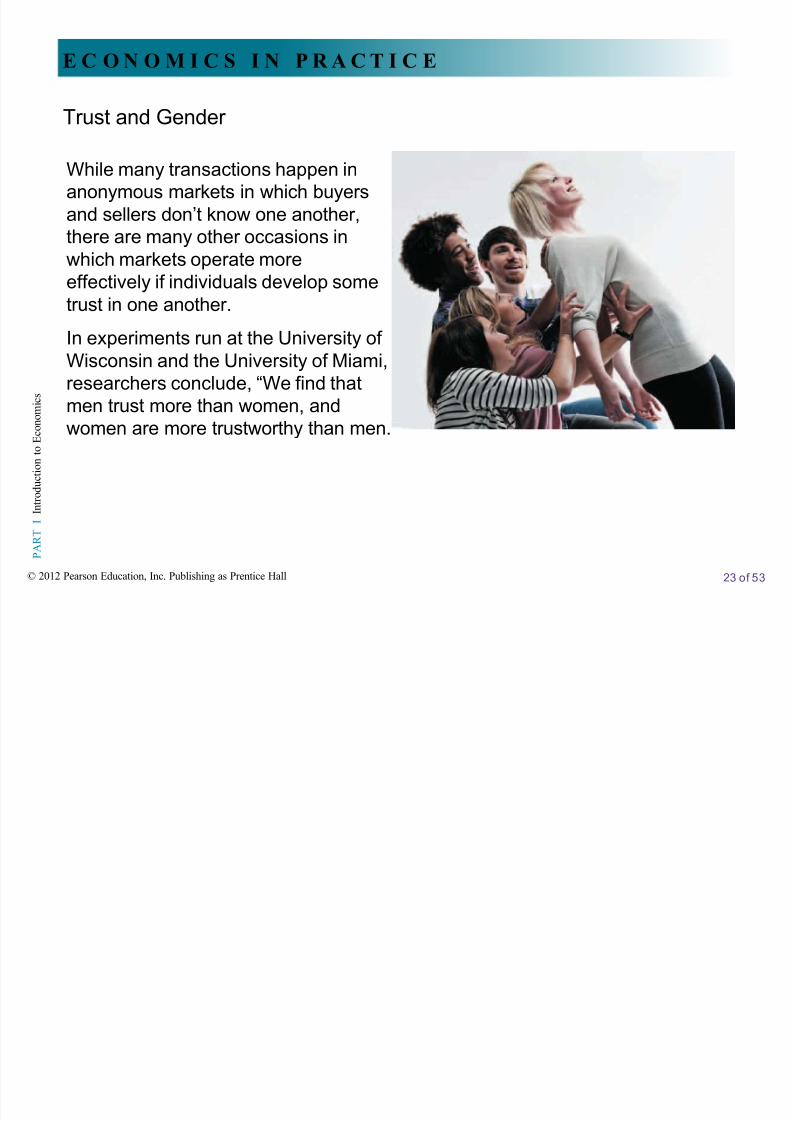
Trust and Gender
While many transactions happen inanonymous markets in which buyersand sellers don¶t know one another,there are many other occasions inwhich markets operate more
effectively if individuals develop sometrust in one another.
In experiments run at the University of Wisconsin and the University of Miami,researchers conclude, ³We find thatmen trust more than women, andwomen are more trustworthy than men.´

5/13/2018 CFO10e Ch01macro CRS 1click - slidepdf.com
http://slidepdf.com/reader/full/cfo10e-ch01macro-crs-1click 24/53
24 of 53
P
A R T
I I n t r o d u c t i o n t o E c o n o
m i c s
© 2012 Pearson Education, Inc. Publishing as Prentice Hall
The Method of Economics
positive economics An approach to economics thatseeks to understand behavior and the operation of systems without making judgments. It describes whatexists and how it works.
normative economics An approach to economicsthat analyzes outcomes of economic behavior,evaluates them as good or bad, and may prescribecourses of action. Also called policy economics.

5/13/2018 CFO10e Ch01macro CRS 1click - slidepdf.com
http://slidepdf.com/reader/full/cfo10e-ch01macro-crs-1click 25/53
25 of 53
P
A R T
I I n t r o d u c t i o n t o E c o n o
m i c s
© 2012 Pearson Education, Inc. Publishing as Prentice Hall
Descriptive Economics and Economic Theory
The Method of Economics
descriptive economics The compilation of data that describe phenomena and facts.
economic theory A statement or set of related statements about cause and effect,action and reaction.

5/13/2018 CFO10e Ch01macro CRS 1click - slidepdf.com
http://slidepdf.com/reader/full/cfo10e-ch01macro-crs-1click 26/53
26 of 53
P
A R T
I I n t r o d u c t i o n t o E c o n o
m i c s
© 2012 Pearson Education, Inc. Publishing as Prentice Hall
Theories and Models
The Method of Economics
model A formal statement of a theory, usuallya mathematical statement of a presumedrelationship between two or more variables.
variable A measure that can change from timeto time or from observation to observation.
Ockham¶s razor The principle that irrelevantdetail should be cut away.

5/13/2018 CFO10e Ch01macro CRS 1click - slidepdf.com
http://slidepdf.com/reader/full/cfo10e-ch01macro-crs-1click 27/53
27 of 53
P
A R T
I I n t r o d u c t i o n t o E c o n o
m i c s
© 2012 Pearson Education, Inc. Publishing as Prentice Hall
If you apply your own values to judge economic decisions, which category of
economics would you be applying?
a. Normative economics.b. Positive economics.
c. Descriptive economics.
d. Economic theory.
e. Empirical economics.

5/13/2018 CFO10e Ch01macro CRS 1click - slidepdf.com
http://slidepdf.com/reader/full/cfo10e-ch01macro-crs-1click 28/53
28 of 53
P
A R T
I I n t r o d u c t i o n t o E c o n o
m i c s
© 2012 Pearson Education, Inc. Publishing as Prentice Hall
If you apply your own values to judge economic decisions, which category of
economics would you be applying?
a.
a.
Norm
ative e
conomics.Norm
ative e
conomics.
b. Positive economics.
c. Descriptive economics.
d. Economic theory.
e. Empirical economics.

5/13/2018 CFO10e Ch01macro CRS 1click - slidepdf.com
http://slidepdf.com/reader/full/cfo10e-ch01macro-crs-1click 29/53
29 of 53
P
A R T
I I n t r o d u c t i o n t o E c o n o
m i c s
© 2012 Pearson Education, Inc. Publishing as Prentice Hall
All Else Equal: C eter is P ar ibus
ceteris paribus, or all else equal A device
used to analyze the relationship betweentwo variables while the values of other variables are held unchanged.
Theories and Models
The Method of Economics
Using the device of ceter is par ibus is one part of the process of
abstraction. In formulating economic theory, the concept helpsus simplify reality to focus on the relationships that interest us.
5/13/2018 CFO10e Ch01macro CRS 1click - slidepdf.com
http://slidepdf.com/reader/full/cfo10e-ch01macro-crs-1click 30/53
30 of 53
P
A R T
I I n t r o d u c t i o n t o E c o n o
m i c s
© 2012 Pearson Education, Inc. Publishing as Prentice Hall
Economic models are:
a. Precise representations of reality that include as many details as possible in
order to accurately predict behavior.b. Simplifications of reality that focus only on key relationships and ignore less
relevant details.
c. General interpretations of cause and effect.
d. Analytical interpretations of economic behavior involving a good deal of the
surrounding social and political structure of society.
e. Devices that usually make it impossible to isolate the impact of a singlefactor.

5/13/2018 CFO10e Ch01macro CRS 1click - slidepdf.com
http://slidepdf.com/reader/full/cfo10e-ch01macro-crs-1click 31/53
31 of 53
P
A R T
I I n t r o d u c t i o n t o E c o n o
m i c s
© 2012 Pearson Education, Inc. Publishing as Prentice Hall
Economic models are:
a. Precise representations of reality that include as many details as possible in
order to accurately predict behavior.b.b. Simplifications of r eality that focus only on key r elationships andSimplifications of r eality that focus only on key r elationships and
ignor e less r elevant details.ignor e less r elevant details.
c. General interpretations of cause and effect.
d. Analytical interpretations of economic behavior involving a good deal of the
surrounding social and political structure of society.
e. Devices that usually make it impossible to isolate the impact of a singlefactor.
5/13/2018 CFO10e Ch01macro CRS 1click - slidepdf.com
http://slidepdf.com/reader/full/cfo10e-ch01macro-crs-1click 32/53
32 of 53
P
A R T
I I n t r o d u c t i o n t o E c o n o
m i c s
© 2012 Pearson Education, Inc. Publishing as Prentice Hall
Expressing Models in Words, Graphs, and Equations
Theories and Models
The Method of Economics
Methods of expressing the quantitative relationship between two variables:
Gr aphing (as presented in appendix)
Equations, for example:
C = .90 Y and S = .10Y
If over time U.S. households collectively spend, or consume, 90percent of their income and save 10 percent of their income, wecould then write:
where C is consumption spending, Y is income, and S is saving.

5/13/2018 CFO10e Ch01macro CRS 1click - slidepdf.com
http://slidepdf.com/reader/full/cfo10e-ch01macro-crs-1click 33/53
33 of 53
P
A R T
I I n t r o d u c t i o n t o E c o n o
m i c s
© 2012 Pearson Education, Inc. Publishing as Prentice Hall
Cautions and Pitfalls
Theories and Models
The Method of Economics
The Post Hoc F allacy
post hoc, ergo propter hoc Literally, ³after this (in time), therefore because of this.´ Acommon error made in thinking aboutcausation: If Event A happens before EventB, it is not necessarily true that A caused B.
The F allacy of C omposition
fallacy of composition The erroneousbelief that what is true for a part isnecessarily true for the whole.

5/13/2018 CFO10e Ch01macro CRS 1click - slidepdf.com
http://slidepdf.com/reader/full/cfo10e-ch01macro-crs-1click 34/53
34 of 53
P
A R T
I I n t r o d u c t i o n t o E c o n o
m i c s
© 2012 Pearson Education, Inc. Publishing as Prentice Hall
Testing Theories and Models: Empirical Economics
Theories and Models
The Method of Economics
empirical economics The collection and use
of data to test economic theories.

5/13/2018 CFO10e Ch01macro CRS 1click - slidepdf.com
http://slidepdf.com/reader/full/cfo10e-ch01macro-crs-1click 35/53
35 of 53
P
A R T
I I n t r o d u c t i o n t o E c o n o
m i c s
© 2012 Pearson Education, Inc. Publishing as Prentice Hall
Economic Policy
The Method of Economics
Criteria for judging economic outcomes:
1. Efficiency
2. Equity
3. Growth
4. Stability

5/13/2018 CFO10e Ch01macro CRS 1click - slidepdf.com
http://slidepdf.com/reader/full/cfo10e-ch01macro-crs-1click 36/53
36 of 53
P
A R T
I I n t r o d u c t i o n t o E c o n o
m i c s
© 2012 Pearson Education, Inc. Publishing as Prentice Hall
Efficiency
Economic Policy
The Method of Economics
Equity
efficiency In economics, allocative efficiency. An
efficient economy is one that produces whatpeople want at the least possible cost.
equity Fairness.

5/13/2018 CFO10e Ch01macro CRS 1click - slidepdf.com
http://slidepdf.com/reader/full/cfo10e-ch01macro-crs-1click 37/53
37 of 53
P
A R T
I I n t r o d u c t i o n t o E c o n o m i c s
© 2012 Pearson Education, Inc. Publishing as Prentice Hall
Growth
Economic Policy
The Method of Economics
Stability
economic growth An increase in the total
output of an economy.
stability A condition in which nationaloutput is growing steadily, with low inflationand full employment of resources.

5/13/2018 CFO10e Ch01macro CRS 1click - slidepdf.com
http://slidepdf.com/reader/full/cfo10e-ch01macro-crs-1click 38/53
38 of 53 P
A R T
I I n t r o d u c t i o n t o E c o n o m i c s
© 2012 Pearson Education, Inc. Publishing as Prentice Hall
You cannot begin to understand how a societyfunctions without knowing something about itseconomic history and its economic system.
Learning to think in this very powerful way will
help you better understand the world.
As you proceed, it is important that you keep trackof what you have learned in earlier chapters. Thisbook has a plan; it proceeds step-by-step, eachsection building on the last. Make sure you
understand where it fits in the big picture.
An Invitation

5/13/2018 CFO10e Ch01macro CRS 1click - slidepdf.com
http://slidepdf.com/reader/full/cfo10e-ch01macro-crs-1click 39/53
39 of 53 P
A R T
I I n t r o d u c t i o n t o E c o n o m i c s
© 2012 Pearson Education, Inc. Publishing as Prentice Hall
Which of the following criteria for judging economic outcomes refers to producing
what people want at the least possible cost?
a. Efficiency.
b. Equity.c. Growth.
d. Stability.
e. All of the above.

5/13/2018 CFO10e Ch01macro CRS 1click - slidepdf.com
http://slidepdf.com/reader/full/cfo10e-ch01macro-crs-1click 40/53
40 of 53
P A R T
I I n t r o d u c t i o n t o E c o n o m i c s
© 2012 Pearson Education, Inc. Publishing as Prentice Hall
Which of the following criteria for judging economic outcomes refers to producing
what people want at the least possible cost?
a.a. Efficiency.Efficiency.
b. Equity.c. Growth.
d. Stability.
e. All of the above.

5/13/2018 CFO10e Ch01macro CRS 1click - slidepdf.com
http://slidepdf.com/reader/full/cfo10e-ch01macro-crs-1click 41/53
41 of 53
P A R T
I I n t r o d u c t i o n t o E c o n o m i c s
© 2012 Pearson Education, Inc. Publishing as Prentice Hall
R E V I E W T E R M S A N D C O N C E P T S
ceter is par ibus, or all else equal
descriptive economics
economic growth
economic theory
economics
efficiency
efficient market
empirical economics
equity
fallacy of composition
Industrial Revolution
macroeconomics
marginalism
microeconomics
model
normative economics
Ockham¶s razor
opportunity cost
positive economics
post hoc, er go pr opter hoc
scarce
stability
sunk costs
variable

5/13/2018 CFO10e Ch01macro CRS 1click - slidepdf.com
http://slidepdf.com/reader/full/cfo10e-ch01macro-crs-1click 42/53
42 of 53
P A R T
I I n t r o d u c t i o n t o E c o n o m i c s
© 2012 Pearson Education, Inc. Publishing as Prentice Hall
A graph is a two-dimensional representationof a set of numbers, or data.
How to Read and Understand Graphs
CHAPTER 1 APPENDIX
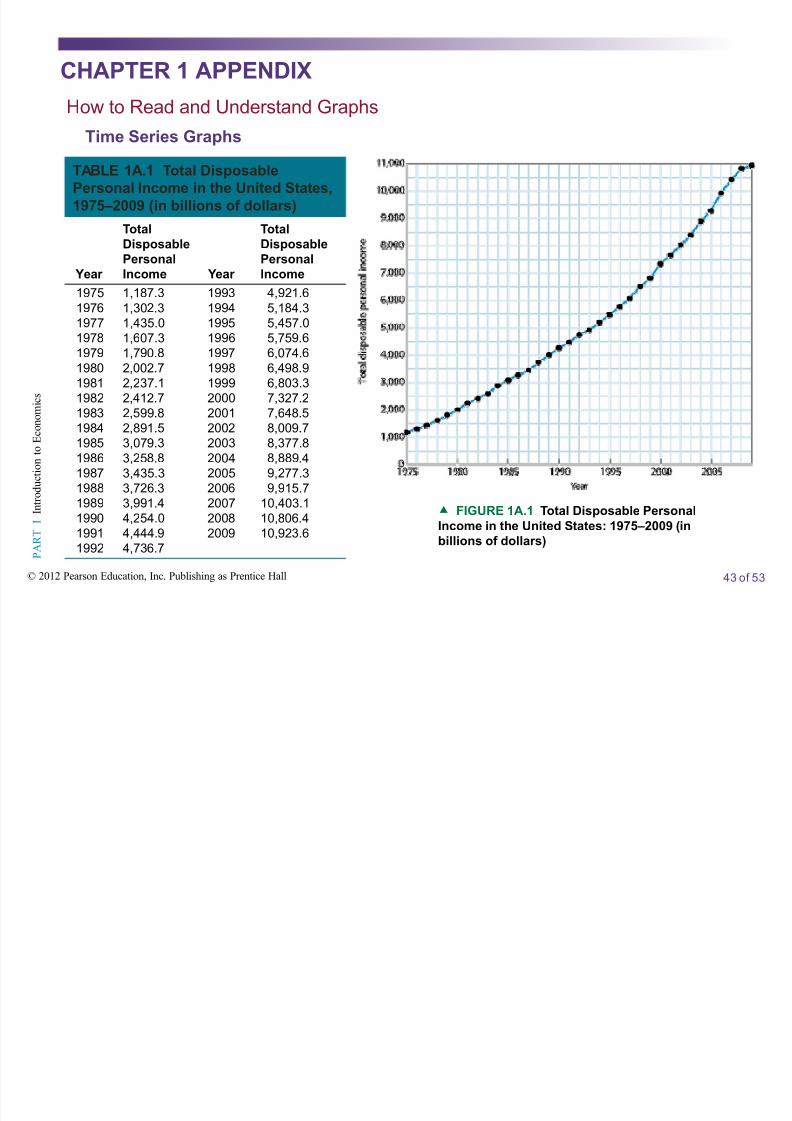
A time series graph shows how a singlemeasure or variable changes over time.
Time Series Graphs
5/13/2018 CFO10e Ch01macro CRS 1click - slidepdf.com
http://slidepdf.com/reader/full/cfo10e-ch01macro-crs-1click 43/53
43 of 53
P A R T
I I n t r o d u c t i o n t o E c o n o m i c s
© 2012 Pearson Education, Inc. Publishing as Prentice Hall
How to Read and Understand Graphs
Time Series GraphsTABLE 1A.1 Total Disposable
Personal Income in the United States,
1975±2009 (in billions of dollars)
Year
Total
Disposable
Personal
Income Year
Total
Disposable
Personal
Income
197519761977197819791980198119821983198419851986198719881989199019911992
1,187.31,302.31,435.01,607.31,790.8 2,002.72,237.12,412.72,599.82,891.53,079.33,258.83,435.33,726.33,991.44,254.04,444.94,736.7
19931994199519961997199819992000200120022003200420052006200720082009
4,921.65,184.35,457.05,759.66,074.66,498.96,803.37,327.27,648.58,009.78,377.88,889.49,277.39,915.7
10,403.110,806.410,923.6
c FIGURE 1A.1 Total Disposable Personal
Income in the United States: 1975±2009 (in
billions of dollars)
CHAPTER 1 APPENDIX

5/13/2018 CFO10e Ch01macro CRS 1click - slidepdf.com
http://slidepdf.com/reader/full/cfo10e-ch01macro-crs-1click 44/53
44 of 53
P A R T
I I n t r o d u c t i o n t o E c o n o m i c s
© 2012 Pearson Education, Inc. Publishing as Prentice Hall
Graphing Two Variables on a Cartesian Coordinate System
Appendix
e FIGURE 1A.2 A Cartesian Coordinate
System
A Cartesian coordinate system is
constructed by drawing two
perpendicular lines: a vertical
axis (the Y -axis) and a horizontal
axis (the X -axis). Each axis is a
measuring scale.
How to Read and Understand Graphs
CHAPTER 1 APPENDIX

5/13/2018 CFO10e Ch01macro CRS 1click - slidepdf.com
http://slidepdf.com/reader/full/cfo10e-ch01macro-crs-1click 45/53
45 of 53
P A R T
I I n t r o d u c t i o n t o E c o n o m i c s
© 2012 Pearson Education, Inc. Publishing as Prentice Hall
A graph is a simple two-dimensional geometric
representation of data.
This graph displays the data from Table 1A.2.
Along the horizontal scale ( X -axis), we measure
household income. Along the vertical scale (Y -
axis), we measure household consumption.
Note: At point A, consumption equals $22,304
and income equals $10,263.
At point B, consumption equals $31,751 and
income equals $27,442.
TABLE 1A.2 Consumption Expenditures
and Income, 2008
Average Incomebefore Taxes
Average Consumption
Expenditures
Bottom fifth2nd fifth
3rd fifth4th fifthTop fifth
$ 10,26327,442
47,19674,090
158,652
$ 22,30431,751
42,65958,63297,003
f FIGURE 1A.3 Household Consumption and
Income
Plotting Income and Consumption Data for Households
How to Read and Understand Graphs
CHAPTER 1 APPENDIX

5/13/2018 CFO10e Ch01macro CRS 1click - slidepdf.com
http://slidepdf.com/reader/full/cfo10e-ch01macro-crs-1click 46/53
46 of 53
P A R T
I I n t r o d u c t i o n t o E c o n o m i c s
© 2012 Pearson Education, Inc. Publishing as Prentice Hall
Slope
d FIGURE 1A.4 A Curve with (a) Positive Slope and (b) Negative Slope
2 1
2 1
Y Y Y
X X X
(!
(
How to Read and Understand Graphs
A positive slope indicates that increases in X are
associated with increases in Y and that decreases
in X are associated with decreases in Y .
A negative slope indicates the opposite²
when X increases, Y decreases; and when
X decreases, Y increases.
CHAPTER 1 APPENDIX
5/13/2018 CFO10e Ch01macro CRS 1click - slidepdf.com
http://slidepdf.com/reader/full/cfo10e-ch01macro-crs-1click 47/53
47 of 53
P A R T
I I n t r o d u c t i o n t o E c o n o m i c s
© 2012 Pearson Education, Inc. Publishing as Prentice Hall
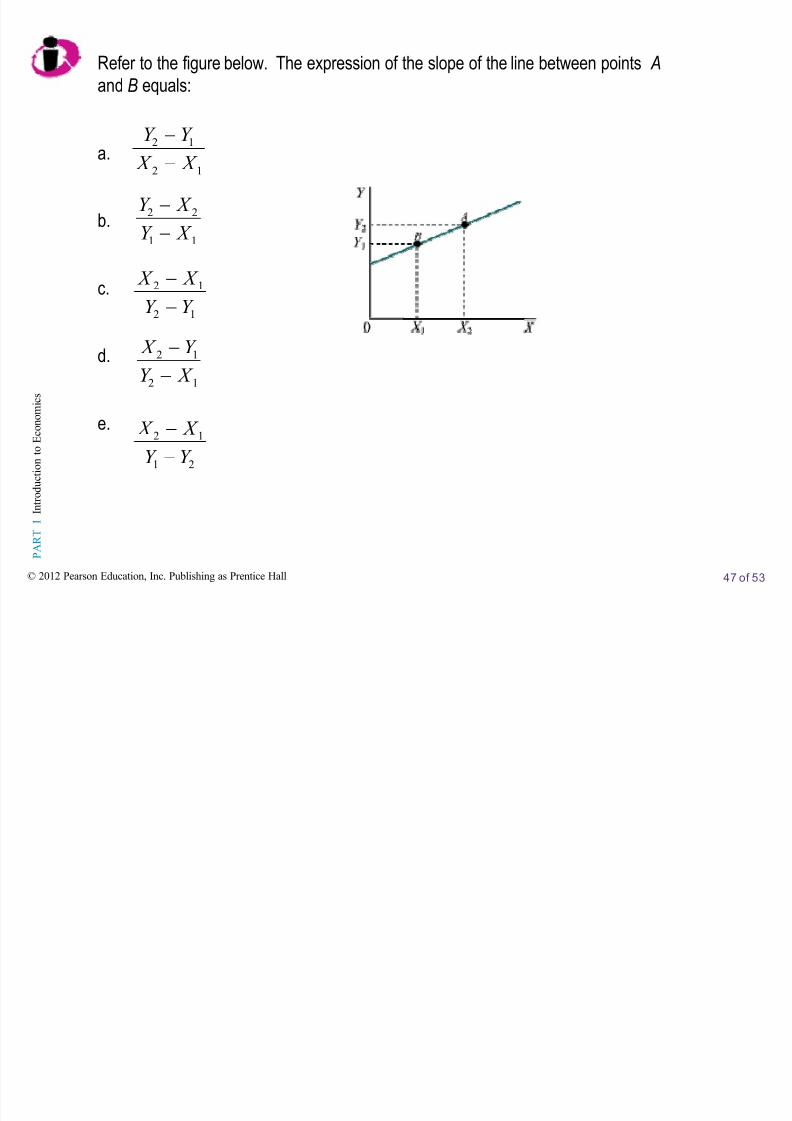
Refer to the figure below. The expression of the slope of the line between points A
and B equals:
a.
b.
c.
d.
e.
Y Y
X X 2 1
2 1
Y X
Y X
2 2
1 1
X X Y Y
2 1
2 1
X Y
Y X
2 1
2 1
X X
Y Y
2 1
1 2

5/13/2018 CFO10e Ch01macro CRS 1click - slidepdf.com
http://slidepdf.com/reader/full/cfo10e-ch01macro-crs-1click 48/53
48 of 53
P A R T
I I n t r o d u c t i o n t o E c o n o m i c s
© 2012 Pearson Education, Inc. Publishing as Prentice Hall
Refer to the figure below. The expression of the slope of the line between points A
and B equals:
a.a.
b.
c.
d.
e.
Y Y
X X 2 1
2 1
Y X
Y X
2 2
1 1
X X Y Y
2 1
2 1
X Y
Y X
2 1
2 1
X X
Y Y
2 1
1 2
5/13/2018 CFO10e Ch01macro CRS 1click - slidepdf.com
http://slidepdf.com/reader/full/cfo10e-ch01macro-crs-1click 49/53
49 of 53
P A R T
I I n t r o d u c t i o n t o E c o n o m i c s
© 2012 Pearson Education, Inc. Publishing as Prentice Hall
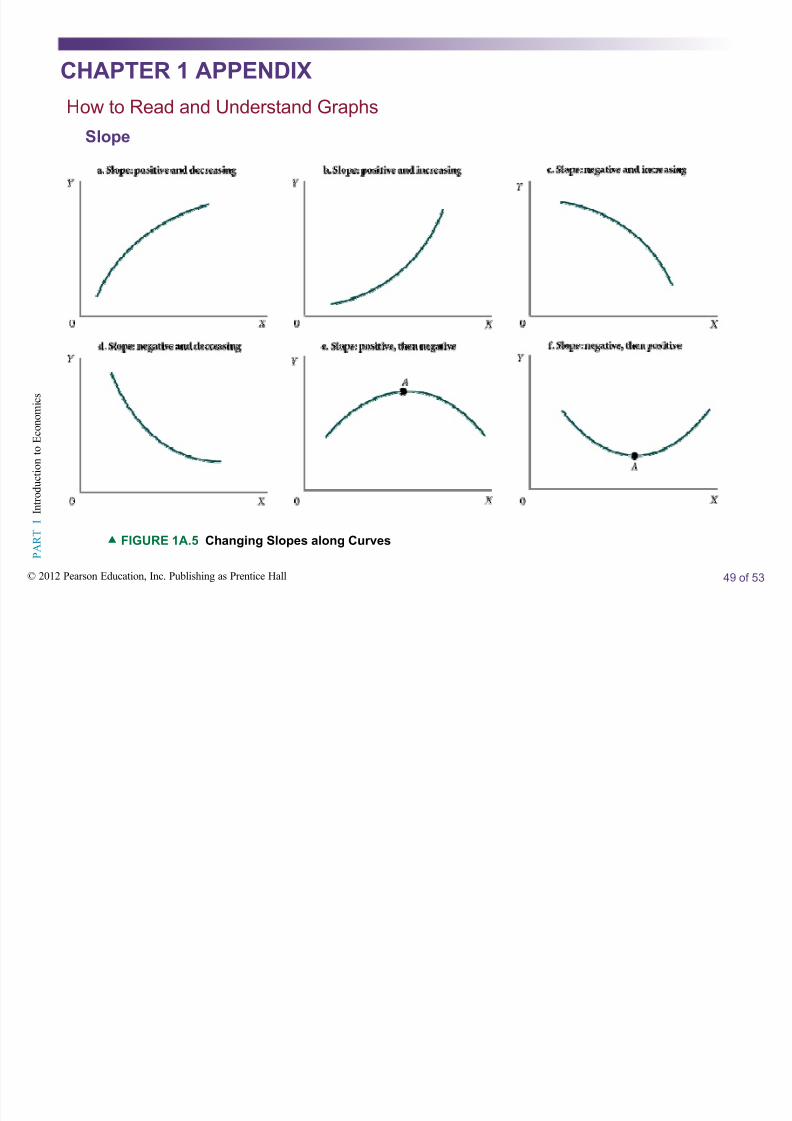
c FIGURE 1A.5 Changing Slopes along Curves
How to Read and Understand Graphs
Slope
CHAPTER 1 APPENDIX

5/13/2018 CFO10e Ch01macro CRS 1click - slidepdf.com
http://slidepdf.com/reader/full/cfo10e-ch01macro-crs-1click 50/53
50 of 53
P A R T
I I n t r o d u c t i o n t o E c o n
o m i c s
© 2012 Pearson Education, Inc. Publishing as Prentice Hall
Refer to the figure below. According to this graph, the relationship between hours
of study time and points on the exam is as follows:
a. The relationship is first positive and then it turns negative.
b. Positive but diminishing.c. Positive and increasing.
d. Negative.
e. Nonexistent.

5/13/2018 CFO10e Ch01macro CRS 1click - slidepdf.com
http://slidepdf.com/reader/full/cfo10e-ch01macro-crs-1click 51/53
51 of 53
P A R T
I I n t r o d u c t i o n t o E c o n
o m i c s
© 2012 Pearson Education, Inc. Publishing as Prentice Hall
Refer to the figure below. According to this graph, the relationship between hours
of study time and points on the exam is as follows:
a. The relationship is first positive and then it turns negative.
b.b. Positive but diminishing.Positive but diminishing.c. Positive and increasing.
d. Negative.
e. Nonexistent.

5/13/2018 CFO10e Ch01macro CRS 1click - slidepdf.com
http://slidepdf.com/reader/full/cfo10e-ch01macro-crs-1click 52/53
52 of 53
P A R T
I I n t r o d u c t i o n t o E c o n
o m i c s
© 2012 Pearson Education, Inc. Publishing as Prentice Hall
TABLE 1A.3 Aggregate National Income and Consumption for the United States,
1930±2009 (in billions of dollars)
Aggregate National Income Aggregate Consumption
193019401950196019701980
1990200020052006200720082009
82.990.9263.9473.9929.52433.0
5059.88938.9
11,273.812,031.212,448.212,635.212,280.0
70.171.3
192.2331.8648.3
1,755.8
3,835.56,830.48,819.09,322.79,826.4
10,129.910,089.1
f FIGURE 1A.6 National Income and
Consumption
Some Precautions
It is important to think carefully about what is
represented by points in the space defined by the
axes of a graph.
In this graph, we have graphed income with
consumption, as in Figure 1A.3, but here each
observation point is national income and aggregate
consumption in differ ent year s, measured in billions
of dollars.
CHAPTER 1 APPENDIX

5/13/2018 CFO10e Ch01macro CRS 1click - slidepdf.com
http://slidepdf.com/reader/full/cfo10e-ch01macro-crs-1click 53/53
P A R T
I I n t r o d u c t i o n t o E c o n
o m i c s
Cartesian coordinate system
graph
negative relationship
origin
positive relationship
slope
time series graph
X -axis
X -intercept
Y -axis
Y -intercept
A P P E N D I X R E V I E W T E R M S A N D C O N C E P T S