cfd analysis of gas cooling - spray analysis by spraying ... · pdf file3 cfd analysis of gas...
TRANSCRIPT

Experts in Spray TechnologySpray
NozzlesSpray
ControlSpray
AnalysisSpray
Fabrication
CFD Analysis of Gas Cooling
J. S. Markus*Spraying Systems Deutschland GmbH
Paul-Strähle Str. 1073614 Schorndorf, Germany
Abstract
In many industrial processes hot gas is cooled down due to the evaporation (boiling) of sprayed droplets. The effects of two different atomizer types, inner mixing air atomizing nozzles and flow back nozzles, on the cooling behavior inside a spray tower for a typical flue gas will be discussed. The heat and mass transfer is computed with
Fluent. Special attention is paid to the effect of the two-phase gas jets on the flow field. The interaction between the discrete droplets and the average gas flow depending on the tower geometry is described for different drop size distributions.
As presented at: ILASS–Americas, 20th Annual Conference on Liquid Atomization and Spray Systems, Chicago, IL, May 2007
*Corresponding author

2 www.sprayconsultants.com
CFD Analysis of Gas Cooling
Introduction
At any incineration process like e.g. waste inciner-ation, steel or cement kiln incineration an exhaust gas needs to be cleaned before escapes into our environment. Therefore it has to be filtered. But before it can pass any filter, the hot flue gas has to be cooled down. Often spray towers are used for that purpose, see Figure 1.
The flue gas is a gas mixture that mainly consists of oxygen, carbon dioxide, water vapor and nitrogen. Additional it may contain sulfur dioxide, sulfur trioxide and other marginal species. It usually also contains dust and ashes. While the oxygen content is very much lowered compared to that of ambient air, the content of carbon dioxide can reach a volume fraction of up to 25%. Especially at the modern waste incineration plants the content of water vapor can go up to a few percent. Usually the composition of the species of the flue gas is given volume-per-volume-percent. The mass fraction Yi can be derived from the molecular weight Mi of each species and the volume fraction Xi.
(1)
1
ii n
i ii
MYX M
=
=⋅∑
The amount of water that needs to be added in order to cool a certain amount of flue gas down, could be simply derived by balancing the enthalpy. Therefore it is assumed that the process is adiabatic and no heat is transferred through the walls of the tower.
(2) m h T h T m h⋅ − ⋅∆
= =( ( ) ( ))
( ( ) ( ))g g out g in g g
sprayl l l out l
mh T h T h− ∆
The difference of the specific enthalpy of the spray ∆hl contains the specific latent heat due to the phase change of the sprayed liquid, for water this is hfg = 2263.07 kJ/kg. If the flue gas temperature is higher than the boiling temperature of the sprayed liquid, Tg,∞ > Tbp, the droplet is heated up and remains at the boiling point Td = Tbp until it is evaporated. Neglecting the droplets radiation, the boiling rate equation leads to
(3) d D k
= + −( ) ,( ) 4 1 0.23 Re ( )g d
d fg
T Tdt h Dρ ∞
The density of the droplet ρd remains fixed, whereas the flue gas can be treated as ideal gas. These are the two basic equations, 2 and 3, for solving the problem in a 1-dimensional space along a droplets trajectory. At the present state there are several small and simple to use programs, which offers the calculation of the droplets boiling (evaporation) rate along its way in a constantly moving flue gas stream, neglecting the spatial distribution of the momentum and temperature of the flow field. It gives reliable results for the gas composition and temperature at the outlet, as these values are calculated from an energy balance. But it predicts the evaporation rate only for the following assumptions: The gas phase moves with constant speed throughout the whole spray tower and there is no slope between the droplets and the gas. The droplets move with same velocity as the gas phase.
If these assumptions are justified or under which circumstances they hold should be discussed in the following.
Principle of a Flow Back Nozzle
A flow back nozzle is similar to an axial hollow cone spray nozzle with an additional back flow outlet at the back side of its swirl chamber. The total flow rate is the sum of the back flow and the sprayed flow rate.
(4) tot spray backm m m= +
This allows an elegant and simple control of the sprayed flow rate just by changing the counter pressure at the back flow side. The principle is shown in Figure 2. The total flow rate of the nozzle corresponds to the pressure drop from the injection orifice to the pressure inside the swirl chamber.
EQUIPMENT & METHODS

3 www.sprayconsultants.com
CFD Analysis of Gas Cooling
(5) inj in back totp p p m∆ = − ∝
When the valve of the back flow line is closed, the maximum spray flow rate is reached. The back flow pressure at this operating point indicates the pressure inside the swirl chamber, point C see Figure 3.
Like generally in pressure swirl atomization a high pressure is needed in order to produce small droplets. A good overview of empirical and analytical correlations for the mean droplet size generated by pressure swirl atomization is given by Liu [1] and Richter [2]. Another analytical model for predicting the resulting average droplet size is given by the LISA-Model [3]. Strong simplified it correlates the initial velocity and the initial liquid film thickness of the cone with the resulting mean diameter.
(6) U p m( )
1,in spray
D ∝
, where U ↑ for pin↑, U ↑ for ṁg ↑.
An increasing spray flow rate as well as an increasing overall pressure results in a higher out flow velocity. Hence it results in a decreased mean droplet size. The effect that an increasing spray flow rate and an increasing overall pressure leads to smaller droplets is independent of the size of the outlet diameter of the flow back nozzle and is obeyed for different size ratios. This behavior is an advantage of the flow back nozzle, as usually an increasing flow rate of flue gas leads to an higher velocity of the basic flow inside the spray tower and requires both a smaller mean and a smaller maximum droplet size.
A short summary of the ranges of the flow rate and the drop sizes is given in Table 1. Due to the large free
cross sections (passages) the nozzle can also be used for suspensions, when no plugging is demanded.
Principle of an Inner Mixing Air Atomizer
At any inner mixing air assisted atomizer the air and the liquid is premixed in a chamber, before it is atom-ized into fine droplets due to the high kinetic energy of the expanding gas. Here inside the so called air cap the liquid flows out of the orifice and is sucked along the rim towards the first air slit, see point D at schematic sketch in Figure 4. The high velocity air stream is shearing the liquid and accelerates liquid ligaments downstream in direction towards the center, where the ligaments impinge onto the top of the impact bolt and already break up into droplets. Then the premixed phases flow through the drilled holes of the air cap where it exits the orifice. The gas is further expanding and accelerating the droplets. Fine droplets are produced due to secondary breakup mechanism. The structure two phase flow inside the chamber is very complex and should not be described here; a more detailed description of the flow first stage in ambient air gives Ting [4].
The flow rate of inner mixing air atomizer nozzles range up to 120 dm³/min (special purpose up to 200 dm³/min). The air consumption ranges from 60 to 6000 Nm³/h (special purpose up to 10 000 Nm³/h) and is given by the Air-To-Liquid Ratio. Often the Air-to-Liquid-ratio is defined as the ratio of the flow rates of air to liquid
(7) * air
l
VALRV
=
while the author prefers the ratio of the mass flow rates of air to liquid defined as
EQUIPMENT & METHODS
Flow Back Nozzle Inner Mixing Air Atomizer Liquid flow rate (dm³/min) 1 … 120 0.1 … 120 Air flow rate (Nm³/h) - 6 … 6000 Operating pressure liquid (Mpa) 2 … 5 0.05 … 0.6 Operating pressure air (Mpa) - 0.1 … 0.6 Sauter Mean diameter D32 (µm) 100 ... 300 40 ... 150 Maximum diameter Dmax (µm) 300 … 1200 90 … 300 Spread of drop size distribution wider narrower
Table 1. Comparison of flow back nozzle and inner mixing air atomizer

4 www.sprayconsultants.com
CFD Analysis of Gas Cooling
EQUIPMENT & METHODS
(8) air
l
mALRm
=
as it takes also the density into account. The ALR usually ranges from 0.02 to 1. Generally a small ALR is desired as it saves expensive pressurized air. For a typical air assisted atomizer the ALR can be correlated to mean drop diameter, as shown in Figure 5. The mean drop size decreases with an increasing ALR. For low ALRs a small change of the ALR will have a strong effect on the mean drop size. For large ALRs the mean drop size reaches a lower limit. So an ALR over 2 becomes uneconomical. The high supersonic speed of the under expanded jets results in a in a much finer droplet size distribution compared to a flow back nozzle and requires much lower liquid pressure. An overview and comparison of the characteristic nozzle data of both types is given in Table 1.
The initial velocity of the liquid droplets direct at the exit is not known. There is a slope between the droplets and the air; the droplets are already accelerated and they do not start with zero velocity. Even though at region near the nozzle secondary breakup will occur it is assumed that for a further simulation, that all droplets have reached their finally stage, as one is mainly interested in the effect of the spray on evaporation and the basic flow.
It is well known that for a disperse two phase mixture out of water and air the speed of sound is lowered depending on the Air-To-Liquid ratio ALR due to Henry and Fauske [5, 6]. In a CFD code normally a spray of droplets is treated separately as a discrete phase. For an air atomizing nozzle the momentum of the additional air flow plays an essential role, as it has an effect on both the droplets of the spray and the flow field in the domain.
The liquid and air flow rate is usually known from measurements for each nozzle for a given pressure. The air flow rate is usually given in scfm (or Nm³/h) for the standard state at the pressure of 101.325 kPa and temperature of 288.15 K. With a density of ρair = 1.225 kg/m³ and an isotropic coefficient of γ = 1.4 it can be converted to the corresponding mass flow rate
(9)
1/ 3600 (Nm / h)= ⋅ ⋅
= ⋅ ⋅m V3
(kg/s) 0.58858 / 3600 (scfm)air air air
air airV
ρ
ρ
The smallest free cross section of a nozzle with multiple orifices is Aorifice = π/4 dorifice
2, with n orifices and an inner diameter dorifice and the Mach number Ma is defined as the ratio of the supersonic velocity c to the local velocity u. The state at the outlet of the orifice is given by equations 11 and 12; it is denoted by the subscript s. The (static) stagnation pressure inside the air cap before the orifices is denoted by the subscript 0.
(10) air orificem n A uρ= ⋅ , v Ma RTγ= ,
(11)
= + p p
p p /( 1)0 op 2
op
112
γ γγ −+ −+s
Ma ,
(12) 0
2112
γ=−
+s
TTMa
,
where R is the individual gas constant, γ is the isentropic coefficient and T0 is the temperature at rest. From this one can derive
(13) m
2 ( 1)γ γ+ −A Ma Ma= −p pop2
2 γ ss
R T ,
(14)
1 Ma = + + −p p p p( )
/( 1)2
0 op op1
2
γ γγ −−s
.
The speed of sound with no slope for a critical two phase flow can be due to Kolev [7] estimated as
(15)
= +
1/ 2
2 2 2ρρ ρ
− g l
mg g l l
X Xcc c
whereas ρm = Yg ρg + Yl ρl is defined as the homogenous density, cg is the speed of sound of the gas, cl = 1520 m/s is the speed of sound for liquid water and Xg,l is the volume fraction of gas and liquid.
While the air mass flow rate is given, one assumes that the outflow velocity has to be lowered compared to the state of the single gas phase flow in order to act with the same momentum flux I = ṁ·u at the nozzle exit as in the critical state of the mixed two phase flow.

5 www.sprayconsultants.com
CFD Analysis of Gas Cooling
EQUIPMENT & METHODS
CFD Analysis Method
To discuss the differences between the two nozzle spray characteristics a small, strong simplified tower should be computed as an example. For the computation the general CFD code Fluent is applied. The mesh size is about 360000 cells; the maximum cell size for a hexagonal cell is 0.1 x 0.1 x 0.1 m³. The average velocity is expected to 5 m/s. The wall boundaries are not refined; the y+ values are still in the range of 30 to 300 (viscous sublayer is about 0.33 mm). The standard wall function with the no slip condition is applied. Usually inside the spray tower there is small aspiration; the operating pressure (duct pressure) is near the atmospheric pressure pop = 100 kPa. For the steady state solution the segregated solver is used. As turbulence model the realizable k-ε-model with default parameters is used, as it is known for better convergence applied for evaporation coolers and swirling flows. As the height of the tower is more than 10 m it will have an effect on the static pressure of the flow field inside, hence the terms for gravity are included. Gravitational acceleration is g = 9.81 m/s².
The inlet conditions of the pure flue gas flow are described first. The flue gas enters the tower with a total flow rate of about 13300 Nm³/h and a temperature at the inlet Tfg,in = 800 K. At the inlet the mass flow inlet boundary is applied with a value of: Mass flow rate moist ṁg = 5 kg/s
The volume content of each species is: Water H20 3 %v/v Oxygen 02 5 %v/v moist Carbon dioxide CO2 15 %v/v moist
The rest is nitrogen N2 77 %v/v moist. The mass contents results from eq. 1 for water YH20 = 0.017, oxygen Y02 = 0.037, carbon dioxide YCO2 = 0.364 and nitrogen YN2 = 0.583. The fluid and thermo physical properties of the single species are treated as follows: The density is derived from the ideal gas law, while the dynamic viscosity is given by Sutherland’s law. The heat capacity and the heat conductivity are both piecewise linear. The turbulent conditions at the inlet are often unknown. The turbulent kinetic energy measured in an evaporation cooler is quite low, e.g. by Kickinger et al. [8] it was measured lower than
0.4 m²/s². For an initial guess the turbulent kinetic energy of k = 0.1 m²/s² and turbulent dissipation rate of ε = 0.1 m²/s³ is estimated.
The desired temperature at the outlet is Tfg,out = 500 K. At the outlet is the pressure outlet is applied. For the converged solution no back flow at the outlet is predicted, so for initialization the mass content was chosen at the same level as at the inlet.
In order to cool the flue gas down for Tl = 293.15 K cold water a flow rate of 9.25 gpm (= 35 dm³/min) and a mass flow rate of ṁspray = 0.582 kg/s is required. Therefore a flow back nozzle of the type HFB15 at an inlet pressure of 3 MPa and a back flow pressure of 0.828 MPa and an inner mixing atomizer nozzle of the type FM10A at a water pressure of 0.35 MPa and an air pressure of 0.345 MPa with an spray angle of 55° are chosen. The spray angle of the flow back nozzle at this operating condition is only 32°. All pressures are relative pressures. The operating range is for the HFB15 is shown in Figure 3 (red line) and for the FM10A-55° in Figure 5 (blue line). The corresponding cumulative volume as well as the volume frequency of both drop size distributions is shown in Figure 6. The mean and median volume diameter as well as the spread for the flow back nozzle is larger than for the inner mixing nozzle. Both drop size distribution are fitted functions of a Rosin-Rammler distribution, which is divided into 32 bins for the simulation; the maximum diameter is denoted as the diameter that contains more than 99% of the total volume of the spray. It determines the maximum distance which is needed for complete evaporation. In this example a droplet with a diameter of Dmax = 203 µm will only require 5.5 m to evaporate in an even uniform flow, for Dmax = 614 µm it would require almost a ten times larger distance for complete evaporation (but only about 18 m for 99% evaporation). The spread parameter of the HFB15 nozzle is about 2.5 and much wider than the one of the FM10A-55°, which is 4 and narrow. The initial velocity of the injected droplets is predicted as uinj = 27 m/s for the HFB15 and uinj = 30 m/s. The droplets are positioned at the nozzles exit. For each simulation 3200 droplet parcels are injected. For stochastic modeling the random walk model with default parameters is chosen in order to describe the turbulent dispersion of the droplets.

6 www.sprayconsultants.com
CFD Analysis of Gas Cooling
EQUIPMENT & METHODS
Often for simplification of the computation the air flow of the spray nozzle is neglected; the spray nozzle is treated the same way as a simple pressure atomizer like a solid cone. But in case of an inner mixing air atomizer the additional gas may change the total flow behavior inside the spray tower (even without any liquid). Even though the gas mass flow rate is usually small compared with the total gas mass flow rate of the whole tower, the high kinetic energy of the expanding gas jets will accelerate a larger fraction of the total gas flow inside the tower due to its high momentum exchange (and entrainment). As the inner pressure inside the mixing chamber is upper critical, the gas at the nozzles exit holes and the environmental pressure inside the tower is near the atmospheric pressure, the two-phase flow is an under expanded jet. For the computation nozzle exit is treated as two phase flow with a lowered supersonic velocity of the two phase mixture than for the pure gas as described in eqs. 10–15. The dry air composition at the nozzles exit is 21 %v/v oxygen 02 and 79 %v/v nitrogen N2 at a temperature of T0 = 300 K. The turbulence intensity is estimated as Tu = 3% and the characteristic length scale L = 0.07 dorifice. The mesh near the nozzles exit was refined to cells with edges smaller than 1 mm. The cell size growth in
direction to the coarser cells is quite harsh. Here the general problem should be pointed out. In order to solve the exact supersonic flow behavior with shock waves much more cells are required. Especially close to the nozzle even finer cells are required in order to solve the problem. But for more nozzles and larger towers the cell size is limited and one is interested in the effect of jets on the main flown.
If the droplets hit the wall, the trajectory calculations are terminated and the fate of the droplet is recorded as "trapped". In the case of evaporating droplets, their entire mass instantaneously passes into the vapor phase and enters the cell adjacent to the boundary.
The solution procedure is carried out into two steps. First the single phase flow without droplets is computed until it is converged followed by the computation with the discrete phase.
The spray towers computed here, see Figure 13, does not show an optimized flow. It is just an example of a narrow duct that should provoke a back flow region near the injected spray of the nozzle lance. The tower has a rectangular cross section of 1.5 x 1.5 m² and is 11 m high. A typical full scale evaporation cooler with an even velocity inside is shown as e.g. in Figure 14.
RESULTS & DISCUSSION
Results
The flue gas flows around the rectangular corner. Behind the sharp edge of the corner a swirl with a back flow region builds up (Fig. 7 and 10). At the lower section of the tower the velocity vectors flow in down-stream normal to the outlet. The average velocity is about 3 ... 4 m/s at the outlet. The overall pressure loss is only in the Pa range. The nozzle lance is 1 m below the corner besides the back flow region. Direct behind the nozzle lance is a wake. Figure 8 shows the detailed gas flow near the FM10A-55° nozzle; the flow velocity is still subsonic and only in the core region higher than 80 m/s. The two phase flow shows 8 single jets with a narrow spray dispersion angle are also
obeyed experimentally, see Figures 7 and 9.
In comparison the taller droplets in case of the flow back nozzle type (left) the sprayed droplets are less affected by the basic flow than in case of the inner mixing air atomizer (right), see Figure 11. Most of the droplets hit the opposite wall of the flow back nozzle (left), only already evaporated with a diameter below 200 µm follow the basic flow. In opposition most of the sprayed droplets in case of the FMA nozzle type (right) are affected by the basic flow; the droplets are much more affected by turbulent dispersion of the additional air flow. Only 1600, half of the droplet trajectories, are

7 www.sprayconsultants.com
CFD Analysis of Gas Cooling
RESULTS & DISCUSSION
plotted. The drag of a droplet depends on the velocity difference between gas flow and the droplets motion as well as its size. This can be described by the droplets Reynolds number Red = D urel /ν, as shown in Figure 12. The drag is reciprocally proportional to Red. For the HFB15 nozzle type (left) the Reynolds number for most of the droplets is in the range Red = 1 … 500 and larger than in case of the FM10A nozzle type (right). The highest Reynolds number for the FM10A nozzle is in a short distance of 1 m in the range of Red = 1 … 100. Even though for droplets with inner fluid motion in itself the drag will diverge. Finally the small or already evaporated droplets will follow the basic flow, Red ≈ 1.
Due to the finer spray the gas is already cooled down in a near distance of the nozzle in case of the inner mixing air nozzle (right) more than for the flow back nozzle (left), see middle plane in Figure 13. More droplets are collected in back flowing swirl and therefore result in a cooler flue gas (right). The flow is not symmetric as one would suspect for the steady flow. This non-uniformity is even impaired by the spray. Due to the assumption that the impinging droplets at the wall will evaporated completely the temperature drops below the boiling point, the walls get wet.
Conclusions
While generally smaller mean and maximum drop sizes are appreciated, as the sprayed droplets evaporate faster and in a shorter distance due to their increased surface area, the smaller droplets get more and more affected by the basic flow inside the spray tower. This behavior is described by the Stokes number, which describes the ability of droplets to act to a change of the mean flow. For St << 1 the droplet will follow the flow immediately, for St >> 1 the particle will stay on its path, see also Table 2.
(16) = =τ ττ
D D
L
UStL
The relaxation time is defined as
(17) 2
18ρτµ
= lD
g
D
Hence for a finer spray of inner mixing air atomizer nozzles requires an even and uniform velocity of the flue gas inside a spray tower. The evenness and uniformity of the flow inside the tower results from the spray tower design, not from the spray itself. In narrow ducts the additional air may have an effect on the basic flow of the flue gas due to its high momentum, and therefore can not be neglected. Any simulation of a spray tower needs to include the whole duct work before the spray section in order to describe the basic flow correctly.
Droplet Diameter D
(µm)
Relaxation time τ
(ms)
Response distance δs at 5 m/s
(mm)
Stokes number St at 5 m/s and 0.1 m cell size
10 0.3 0.0015 0.015 50 7.7 0.039 0.39 100 31 0.15 1.5 500 775 3.9 39
Table 2. Particle relaxation time and dimensionless Stokes number for air flow under standard state condition

8 www.sprayconsultants.com
CFD Analysis of Gas Cooling
References
1. Liu, H., Science and Engineering of Droplets, Fundamentals and Applications, Wiliam & Andrew, 2000, pp. x-x.
2. Richter, T., Zerstäuben von Flüssigkeiten, Expert Verlag, 2004, pp. 57-65.
3. Schmidt, L D. P., Nouar, I., Senecal, P. K., Rutland, C. J., Martin, J. K. and Reitz., R. D., Pressure-Swirl Atomization in the Near Field, SAE Paper 01-0496, SAE, 1999.
4. Ting, J., A Pulsatile Atomization Model, 41st AIAA Aerospace Science Exhibit, Reno, NV, January 5-9, 2003, AIAA Paper 2003-1186.
5. Henry, R. E. and Fauske, H. K., The two-phase critical flow of one component mixtures in nozzles, orifices and short tubes, J. Heat Transfer, Vol. 93, 1971, pp. 179-187.
6. Wein, M., Numerische Simulation von kritischen und nahkritischen Zweiphasenströmungen mit thermischen und fluiddynamischen Nichtgleichgwichtseffekten, Dissertation Technische Universität Dresden, 2002, pp. 52-55.
7. Kolev, N.I., Transiente Zweiphasenströmung, Springer, 1986.
8. Kickinger, R., Wimmer, P., and Leibinger, H., PVP-Vol.448-2, Numerical and experimental Analysis of an evaporation cooler, Computational Technologies for Fluid/Thermal/Structural/Chemical Systems With Industrial Applications – 2002, Volume II, ASME 2002, PVP2002-1583.
Nomenclature
A AreaALR Air-To-Liquid mass flow ratioALR* Air-To-Liquid flow rate ratioc speed of soundD, d diameterD30 Volume mean diameterD32 Sauter-Mean DiameterDmax Maximum Diametercp heat capacityh specific enthalpyhfg latent heatI momentum
k thermal conductivity, turbulent kinetic energyL characteristic lengthM molecular weightMa molecular weightṁ mass flow ratep pressureRe Reynolds numberSt Stokes number
T temperatureTu turbulent intensityU, u velocityX volume fractionY mass fractionV flow rate
ρ densityε turbulent dissipation rateγ isentropic coefficientμ viscosityν kinematic viscosityτD droplet relaxation timeτL characteristic time scale
Subscriptsd dropletg gasl liquids supersonic

9 www.sprayconsultants.com
CFD Analysis of Gas Cooling
Figure 1. Sketch of a spray tower for gas conditioning.
Figure 2. Sketch of a flow back nozzle.
3 MPa2 MPa
4 MPa
01020304050607080
0.0 1.0 2.0 3.0 4.0 5.0
pressure p in - p back (MPa)
flow
rate
(dm
³/min
)
C
spraym
totalm
Figure 3. Flow rates of a flow back nozzle in dependence of the pressure difference of the inlet pressure and the flow back pressure (left) and the corresponding Sauter-Mean and maximum diameter (right).
3 MPa
4 MPa3 MPa
2 MPa
2 MPa
4 MPa
0100200300400500600700800900
100011001200
0 10 20 30 40 50 60 70
spray flow rate (dm³/min)
drop
siz
e D
32, D
max
(µm
)

10 www.sprayconsultants.com
CFD Analysis of Gas Cooling
Figure 4. Sketch of an inner mixing air atomizer of the FlowMax type.
0.00.10.20.30.40.50.60.70.80.9
0 10 20 30 40 50 60
water flow rate (dm³/min)
mas
s flo
w ra
te (k
g/s)
0
100
200
300
400
0.0 0.2 0.4 0.6 0.8 1.0
ALR (1)
drop
siz
e D
32, D
max
(µm
)
Figure 5. Sum of air and liquid mass flow rates correlated to the liquid flow rate (left) and Sauter-Mean and maximum diameter in dependence of the corresponding air to liquid ratio for different constant air pressures (right) for a inner mixing air atomizer of the FlowMax type.
DmaxDv 0.9
Dv 0.5
D32
Dv 0.1
D30
Dv 0.1
D32
Dv 0.5
Dv 0.9Dmax
D30
0
0.02
0.04
0.06
0.08
0.1
0.12
0.14
0 100 200 300 400 500 600
drop size D (µm)
volu
me
frequ
ency
(1
/µm
)
0%10%20%30%40%50%60%70%80%90%100%
cum
ulat
ive
volu
me
Figure 6. Drop size distribution of two nozzles.

11 www.sprayconsultants.com
CFD Analysis of Gas Cooling
Figure 7. Velocity distribution of the flue gas and water droplets inside an simple rectangular spray tower with back flow region colored by the velocity magnitude (m/s).
Figure 8. Velocity distribution (m/s) of the flue gas and the air near the inner mixing air atomizer nozzle lance.
12 www.sprayconsultants.com
CFD Analysis of Gas Cooling
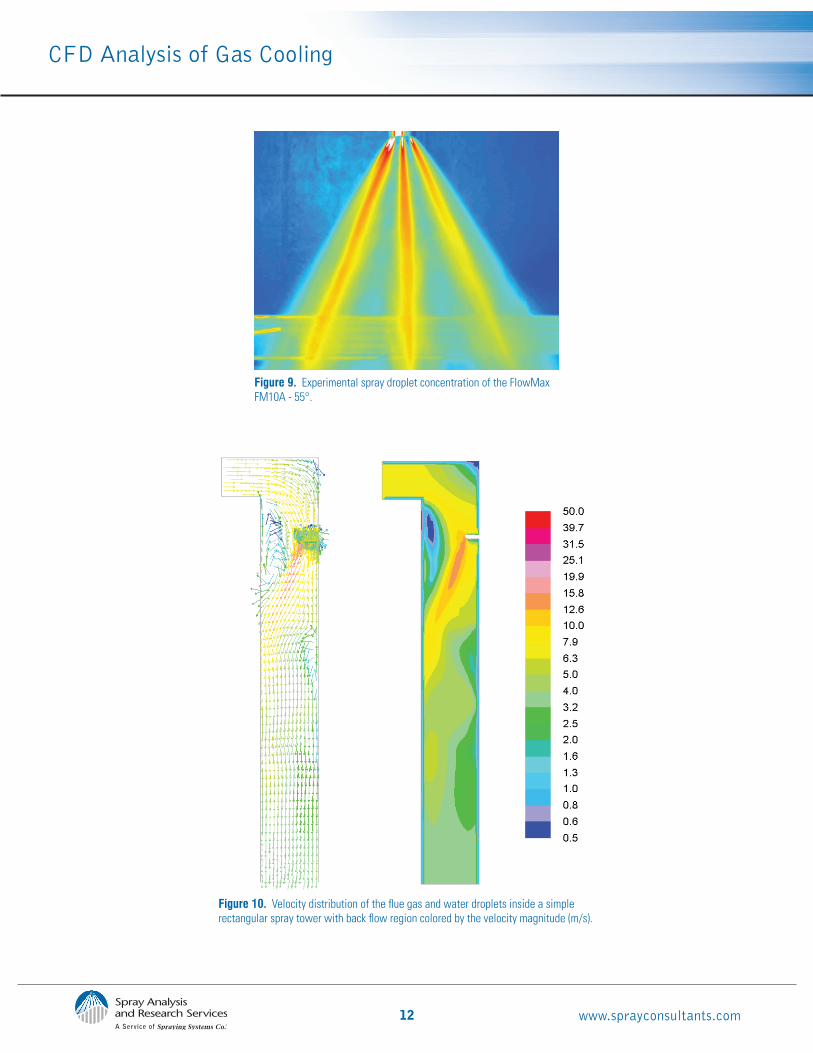
Figure 9. Experimental spray droplet concentration of the FlowMax FM10A - 55°.
Figure 10. Velocity distribution of the flue gas and water droplets inside a simple rectangular spray tower with back flow region colored by the velocity magnitude (m/s).

13 www.sprayconsultants.com
CFD Analysis of Gas Cooling
Figure 12. Water droplet trajectories colored by droplet Reynolds number.
Figure 11. Water droplet trajectories colored by droplet diameter (µm).

14 www.sprayconsultants.com
CFD Analysis of Gas Cooling
Figure 13. Temperature distribution (K), walls get wet.
Figure 14. Droplet and temperature distribution of good designed spray tower without scales.