cepa and ssap books.pdf
TRANSCRIPT


ii
NATIONAL CEPA RESOURCE BOOK FOR SUSTAINABLE
WETLANDS MANAGEMENT
FOR USE BY
THE GENERAL PUBLIC AND COMMUNITIES,
SCHOOLS AND SCHOOL CLUBS, ENVIRONMENTAL AND USER GROUPS,
CBOS AND NGOS, LOCAL AND CENTRAL GOVERNMENT, OUTREACH AND EXTENSION AGENTS,
RAMSAR SITE AND PROTECTED AREA MANAGERS, CEPA UNITS, UNIVERSITIES, COLLEGES, RESEARCH AND TRAINING INSTITUTIONS
Recommended Citation: URT (2012), A National CEPA Resource Book For Sustainable Wetlands Management. Edited by Wildlife Division, Published by: Ministry of Natural Resources and Tourism, Dar es Salaam, Tanzania.
Wildlife Division

iii
Table of Contents FOREWORD ........................................................................................................................................................ viii
ACKNOWLEDGEMENT ..................................................................................................................................... ix
Useful Acronyms, Terms and Definitions: ............................................................................................................ x
CHAPTER ONE...................................................................................................................................................... 1
INTRODUCTION TO SUSTAINABLE WETLANDS MANAGEMENT IN TANZANIA ............................ 1
1.1. Introduction to this Resource Book ................................................................................................................ 1
1.2. What is SWMP? ............................................................................................................................................. 2
1.3. What is CBNRM of Wetlands? ...................................................................................................................... 2
1.4. Who are the Target Audience of this Resource Book? .................................................................................. 3
1.5. Who are the Users of the Resource Book? ..................................................................................................... 3
1.6. How to Use this Resource Book: ................................................................................................................... 3
1.7. Accompanying CEPA Materials and Tools: .................................................................................................. 4
1.8. Useful SWM Training Materials: ................................................................................................................... 4
CHAPTER TWO .................................................................................................................................................... 6
TANZANIA WETLANDS ECOLOGY, BIOLOGY AND ECOSYSTEM FUNCTIONS ............................... 6
2.1. Definition of Wetlands. .................................................................................................................................. 6
2.2. Wetlands Ecology .......................................................................................................................................... 6
2.3. Characteristics of Wetlands ............................................................................................................................ 9
2.4. Wetlands and the Hydrological Cycle (Water Cycle) .................................................................................. 10
2.5. Hydrology and Nature of the Wetland ......................................................................................................... 11
2.6. Wetland Habitats .......................................................................................................................................... 12
2.7. Adaptations to Life in the Wetlands ............................................................................................................. 12
2.8. Webs of Life in Wetlands............................................................................................................................. 14
2.9. Wetlands Productivity .................................................................................................................................. 15
2.10. Wetland Functions Support Life: ............................................................................................................... 15
2.11. Wetlands are often Mistaken as Waste Lands ............................................................................................ 17
CHAPTER THREE .............................................................................................................................................. 18
WETLANDS OF TANZANIA AND CLASSIFICATION BY TYPES ............................................................ 18
3.1. Distribution of Wetlands in Tanzania .......................................................................................................... 18
3.2. River Basins of Tanzania ............................................................................................................................. 19
3.3. Protected Wetlands of Tanzania: .................................................................................................................. 20
3.4. Ramsar Classification of Types of Wetlands ............................................................................................... 24

iv
a. Marine/Coastal Wetlands - Saline water: .................................................................................................... 25
b. Inland Wetlands - Fresh water. ................................................................................................................... 25
c. Man – Made Wetlands: ............................................................................................................................... 26
3.5. Coastal Wetlands of Tanzania ...................................................................................................................... 26
3.6. Inland Wetlands of Tanzania........................................................................................................................ 27
3.7. Man-made/Non-natural Wetlands ................................................................................................................ 29
CHAPTER FOUR ................................................................................................................................................. 31
IMPORTANCE OF WETLANDS IN TANZANIA ........................................................................................... 31
4.1. Wetlands Ecosystem Services and Functions .............................................................................................. 31
4.2. Ecological Benefits of Wetlands .................................................................................................................. 32
4.2.1. Preservation of Biodiversity .................................................................................................................. 32
4.2.2. Soil Erosion Control and Wetlands ..................................................................................................... 33
4.2.3. Flood Control and Wetlands ................................................................................................................. 33
4.2.4. Water System/Water Sources and Wetlands ......................................................................................... 33
4.2.5. Water Filtration/Purification and Wetlands .......................................................................................... 34
4.2.6. Climate Change Control and Wetlands ................................................................................................. 34
4.3. Economic Products of Wetlands .................................................................................................................. 35
4.3.1. Food and Agriculture in Wetlands: ....................................................................................................... 36
4.3.2. Pastoralism and Wetlands ..................................................................................................................... 38
Pastoralist (nomadism/Semi-nomadism): ....................................................................................................... 39
Agro-pastoralists: ............................................................................................................................................ 39
4.3.3. Source of Energy and Wetlands ............................................................................................................ 39
4.3.4. Building Materials and Wetlands. ......................................................................................................... 40
4.3.5. Tourism and Wetlands .......................................................................................................................... 40
4.3.6. Fish and Wetlands: ................................................................................................................................ 41
4.4. Education and Wetlands: .............................................................................................................................. 42
4.5. Medicine and Wetlands: ............................................................................................................................... 42
4.6. Transportation and Wetlands. ...................................................................................................................... 42
4.7. Worship and Wetlands. ................................................................................................................................ 42
4.8. Recreation and Wetlands .............................................................................................................................. 42
4.9. Other Uses .................................................................................................................................................... 43
CHAPTER FIVE ................................................................................................................................................... 44
THREATS TO WETLANDS IN TANZANIA ................................................................................................... 44
5.1. Global Wetland Degradation ........................................................................................................................ 44
5.2. Threats to Wetlands in Tanzania .................................................................................................................. 45
v
5.2.1. Unsustainable Agriculture. ................................................................................................................... 45
a. Trends in Irrigation In Wetlands. ................................................................................................................ 46
b. SWOT Analysis of Irrigation in Wetlands. ................................................................................................. 46
5.2.2. Over-stocking Livestock. ...................................................................................................................... 47
5.2.3. Unsustainable Fishing ........................................................................................................................... 47
5.2.4. Cutting Down Catchment Trees (Deforestation) ................................................................................... 48
5.2.5 Improper Disposal of Solid and Liquid Wastes in Wetlands ................................................................. 49
5.2.6. Urban, Dams and Road Construction: ................................................................................................... 50
5.3. Climate Change and Wetland Damage in Tanzania. .................................................................................... 50
CHAPTER SIX...................................................................................................................................................... 54
WETLANDS AND POLICY IN TANZANIA .................................................................................................... 54
6.1. Holistic Management & Wetlands ............................................................................................................ 54
6.2. Policy and Laws Governing Wetlands ......................................................................................................... 56
6.2.1. Arusha Manifesto: ................................................................................................................................. 56
6.2.2. Wetlands in the Wildlife Policy (2007):................................................................................................ 56
6.2.3. Wetlands and the Poverty Reduction Strategy (MKUKUTA II): ......................................................... 57
6.2.4. Wetlands and the Forest Policy (2009): ................................................................................................ 57
6.2.5. Wetlands and the Agriculture Policy (1997): ........................................................................................ 57
6.2.6. Wetlands and the Water Policy (2002): ................................................................................................ 58
6.2.7. Wetlands and Environment Policy (1997) ............................................................................................ 58
6.2.8. Wetlands and Environment Management Act(EMA) 2004 .................................................................. 58
6.2.9. Wetlands and Fishery Policy (2007): .................................................................................................... 59
6.2.10. Wetlands and Tourism Policy (1999):................................................................................................. 59
6.2.11: Wetlands, Energy and Minerals Policy: .............................................................................................. 59
6.2.12. Wetlands and the Health Policy (1990):.............................................................................................. 59
6.2.13. Local Government Policy (1990), Act (1982) and Village Land Act (1998): .................................... 60
6.3.14. International Protocols/Conventions ................................................................................................... 60
6.4. SADC Protocols/Conventions ...................................................................................................................... 61
6.5. The Ramsar Convention and Tanzania ........................................................................................................ 62
CHAPTER SEVEN ............................................................................................................................................... 66
COMMUNITY MANAGEMENT (CBNRM) OF WETLANDS IN TANZANIA: ......................................... 66
7.1. What is CBNRM of Wetlands? .................................................................................................................... 66
7.2. What is the Hierarchy of Management for CBNRM? .................................................................................. 67
7.3. Local Government Planning and Wetlands. ................................................................................................. 68
7.4. What is the Objectives of SWMP and CBNRM?......................................................................................... 68
vi
7.5. The Institution of SWMP: ............................................................................................................................ 69
7.5.1. The Role of NAWESCO: ...................................................................................................................... 69
7.5.2. The Role of MNRT: .............................................................................................................................. 70
7.5.3. The Role of NWWG: ............................................................................................................................ 71
7.5.4. The Role of WD and Wetlands Unit: .................................................................................................... 71
7.5.5. Role of PA and Ramsar Site Project Managers (PM): .......................................................................... 72
7.5.6. PMO-RALG and Wetlands: .................................................................................................................. 72
7.5.7. Role of DSC and Wetlands: .................................................................................................................. 73
7.5.8. Role of Local Government and Wetlands: ............................................................................................ 73
7.5.9. Role of Regional Secretariat (RAS) and Wetlands: .............................................................................. 73
7.5.10. Role of District Council and Wetlands: .............................................................................................. 74
7.5.11. Role of Village Government and Wetlands: ....................................................................................... 74
7.5.12. Role of Private Sector and Wetlands:.................................................................................................. 74
7.5.13. Role of NGOs and Wetlands: .............................................................................................................. 74
7.5.14. Role of Development Partners (DP) and Wetlands: ............................................................................ 75
7.6. CBNRM and Wetlands: ............................................................................................................................... 75
7.6.1. SWM at District Level: ......................................................................................................................... 75
7.6.2. SWM at Village Level: ......................................................................................................................... 77
7.6.3. Capacity Support to Districts ................................................................................................................ 78
CHAPTER 8 .......................................................................................................................................................... 80
WETLANDS FRIENDLY INVESTMENTS (WFI) IN TANZANIA ............................................................... 80
8.1. Wise Use Principles ..................................................................................................................................... 80
8.2. Best Practices for SWM through Wise Use in Place .................................................................................... 81
8.2.1. Current Wetland Investments and Impacts ........................................................................................... 81
8.2.2. Wetlands Wise Use and Sustainable Development: .............................................................................. 82
8.3. Sustainable Livestock Management In Wetlands ........................................................................................ 82
8.3.1. Introduction to Pastoralism WFI: .......................................................................................................... 82
8.3.2. WFI Options in Pastoralism .................................................................................................................. 83
8.3.3. Rangeland Management of Wetlands: .................................................................................................. 84
8.3.4. Regulation of Access to Wetlands: ....................................................................................................... 84
8.3.5. Establishment of Agro-pastoralism in Wetlands: .................................................................................. 85
8.3.6. Additional WFIs: ................................................................................................................................... 86
8.4. Sustainable Irrigation Management In Wetlands ......................................................................................... 87
8.4.1. Introduction to WI Problems: ................................................................................................................ 87
8.4.2. WFI Suggestions: .................................................................................................................................. 87

viii
FOREWORD Introduction The Government, when revising the Wildlife Policy, in 2007, saw it proper to put equal emphasis on wildlife, as on wetlands. Wetlands not only provide key ecological functions to sustain biodiversity in Protected Areas (PA) and in wildlife corridors, but are a source of 95% of all water for all human, livestock, biodiversity (ie wildlife) and industrial needs. Without wetlands there is no “water, no life, no wildlife and, no economy”. For years, wetlands had been considered wastelands, unsustainably managed, taken for granted, unappreciated, undervalued, encroached and drained. Today, we realize that although wetlands make up less than 10% of Tanzania, their “critical, l ife support services” sustains our lives, our crops, our wildlife and our livestock. They provide security as sources of food, water, energy, economy, income and livelihoods. However they are the most vulnerable ecosystem to unsustainable use and climate change. Climate change is all about water, and water makes up wetlands and therefore consideration of strategies for mitigation and adaptation are needed. The Role of Communication, Education and Public Awareness (CEPA): Tanzania has set aside 40% of land use for nature conservation (eg wildlife, forest, marine and Ramsar site). This is one of the highest in the world. Whereas this was possible 50 years ago, today this is no longer practical. Protected Areas (PA) now compete with the growing population which has increased, as has greater demand for land and natural resources for livelihoods. In order to sustain people, wildlife and wetlands, the 2007 Wildlife Policy seeks new technological advances to improve ways of managing our resources. Similarly, in order to sustain wildlife and wetlands, wise use and management of these resources will depend on how the public perceive the importance of conservation now, and for use by future generations. Public awareness is therefore a key to sustainability, and this is the objective of this CEPA Resource Book. Broad based knowledge of wetland life support values, economics and livelihood opportunities can “open eyes”, change perspectives and transform unsustainable resource use patterns. Mass Communication, Education and Public Awareness (CEPA) is therefore vital to change these mis-perceptions, values and attitudes about wetlands. Needed is to empower appropriate actions at the user level, and CEPA is the key to contribute to informed decision making, policy and planning! For CEPA to be effective, the Wildlife Policy 2007 calls for greater cooperation between sectors, academia, NGOs, CBOs, private sectors and Local Government Authorities (LGA). It encourages Wildlife Division, Protected Area Managers, NGOs and local government to collectively engage as “change agents” in transferring knowledge, technology and information through training, outreach programs, wildlife clubs, extension services, Community Based Conservation (CBC) or Community Support Services (CSS). The aim of Tanzania’s Poverty Reduction Strategy, popularly known as MKUKUTA, is to engage “user group”’ participation in Community Based Natural Resource Management (CBNRM). This is the aim of this Resource Book, with respect to wetlands and to the biodiversity that is dependent on wetland functions. Users of this Resource Book: The primary targets of this Resource Book are the general public, the youth in schools, Wildlife Clubs, local communities and CBOs. Examples of users include extension agents, school teachers, college lecturers, Malihai Clubs of Tanzania (MCT), Wildlife Conservation Society of Tanzania (WCST), Roots and Shoots (R&S), NGOs, Local and Central Government, Ramsar Site and Protected Areas (PAs) Project Managers (PM) and their CBC agents. It is also designed as reference material, part of education services like schools, environmental groups, universities, colleges, research and training institutions. CEPA Focal Areas: Growing human population and their survival strategies means that mankind is putting increased pressure on its wetlands by: agricultural encroachment, pastoralism (overgrazing), traditional irrigation, hunting bush meat for food, fishing, harvesting non-timber products for household needs and trade, catchment damage by creating channels or damming, and deforestation and production of greenhouse gases leading to climate change. A lack of knowledge and poor appreciation of the importance of wetlands values lead to i) unsustainable use, ii) under valuation, iii) mis-management and iv) inefficient utilization. Wetlands resources and their ecosystem services would need to be treated as “public economic goods” and managed sustainably. Inventories and Participatory Resource Assessment (PRA) help to highlight problems in order to bring into attention the threats on wetlands so that the solutions are incorporated into village and district development plans. This CEPA Resource Book is intended to raise awareness to users so that they understand and apply the appropriate mitigating measures on the planning and implementation of wetland friendly investments (WFI) as wise use micro-projects.
Subsequent Reviews: This Guide is an updated edition of an earlier, 1995 Wetlands Brochure by Malihai Clubs of Tanzania (MCT). It is designed as a national resource book and CEPA guide as part of training materials in Sustainable Wetlands Management (SWM). As such, rolling reviews and updates shall take place every 3-5 years so as to align appropriate actions based on results on the ground. The NWWG CEPA Sub-committee shall be the oversight body, advising the NWWG and National Wetlands Steering Committee (NAWESCO), monitoring progress, in conjunction with Wetlands Unit and Malihai Clubs of Tanzania. The Ministry of Natural Resources and Tourism (MNRT) feels that this first step towards a user friendly Wetlands CEPA Resource Book will contribute to our long term goal of raising awareness on wise use of wetlands for the conservation of bio-diversity and sustaining life supporting ecosystem services. ………………………… Permanent Secretary, MNRT
will contribute to our long term gosupporting ecosystem services.
………………………………………………………………………PPPPPPPeermanent Secretary, MNRT

ix
ACKNOWLEDGEMENT
The Director of Wildlife wishes to acknowledge the following: Prepared with Financial and Technical Assistance from: The support of the Global Environment Fund (GEF) that financed the precursor of this CEPA Resource Book, the 1995 version of the Malihai Clubs of Tanzania (MCT) Wetlands Brochure, is highly appreciated. The Danida Component support to Sustainable Wetlands Management Program (SWMP), helped fund the MCT, WU and the authors to update the material, provided technical assistance, supported editing meetings, consultative workshops and printing of the final publication. Acknowledgement is extended to: The staff of the Wildlife Division, notably from the Wetlands Unit (WU), Malihai Clubs of Tanzania (MCT) and the Wildlife Conservation Society of Tanzania (WCST) who did the editing, compilation and publication of this document with technical support from the Wetlands Advisor. Further, he would like to acknowledge the individual contributions received from: Ms Nyangabo Musika, Said Mshana, Hassan Namkeleja, Ms Victoria Ferdinand, Ms Africo Simon, Ms Wande Kema, Imani Nkuwi and Sadiki Lotha Laisser. The Co-editing inputs are appreciated from: Members of the National Wetlands Working Group (NWWG), Communication, Education and Public Awareness ( CEPA) Sub-Committee and Wetlands Unit, notably: Charles Mulokozi, Lotha Laisser, Herman Keraryo, Ms Rehema Tibanyenda, Privatus Kasisi, Nassoro Salum Wawa, Lota Melamari, Dr. Said Abdallah, Ms Flora Nzema, Japhet Jonas, Wengeslaus Lambilela, Charles Masanja, Pellage Kauzeni, I.A. Lejora, Ms Priscilla Mbangwa, Norbert Ngowi, Amina Kibola, et al. Special Thanks are due to the Following Institutions and NGOs: Pasiansi Wildlife Training Institute, CAWM Mweka, UDSM, IRA, PMO-RALG, TANAPA, NCCA, SUA Forconsult, JET, Roots and Shoots (R&S), RUBADA, NEMC and others, too numerous to mention. In appreciation …………………………….. Director of Wildlife For Further Information, Please Contact: Director, Wildlife Division, P.O. Box 9372, Dar es Salaam, Tanzania. E-mail: [email protected], Phone: 255 22 2866408, 2866376, 2866418. Fax: 255 22 2865836, 2863496.
In apa preciation
………………………………………Director of Wildlifeff
x
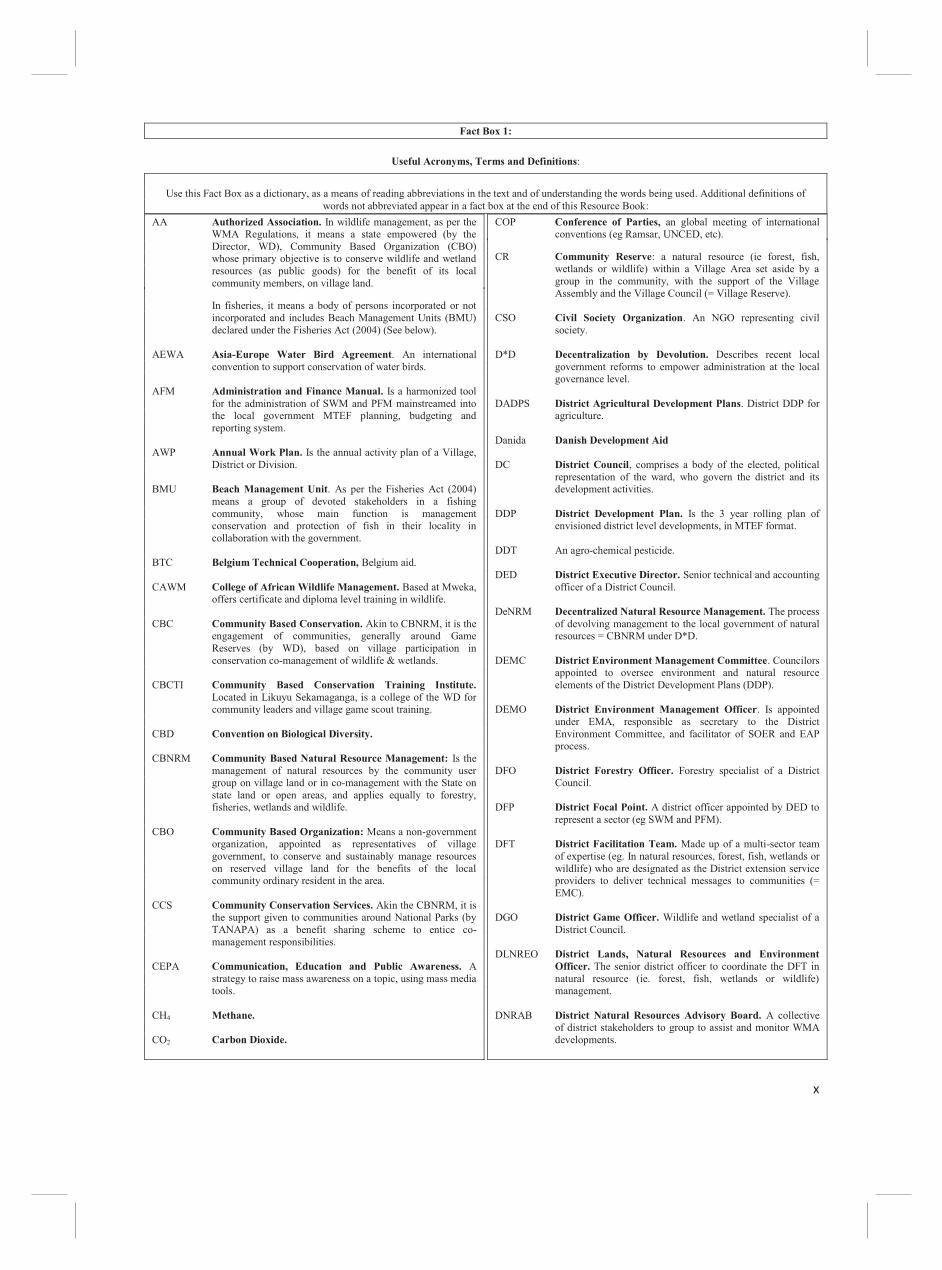
Fact Box 1:
Useful Acronyms, Terms and Definitions:
Use this Fact Box as a dictionary, as a means of reading abbreviations in the text and of understanding the words being used. Additional definitions of
words not abbreviated appear in a fact box at the end of this Resource Book: AA Authorized Association. In wildlife management, as per the
WMA Regulations, it means a state empowered (by the Director, WD), Community Based Organization (CBO) whose primary objective is to conserve wildlife and wetland resources (as public goods) for the benefit of its local community members, on village land.
In fisheries, it means a body of persons incorporated or not
incorporated and includes Beach Management Units (BMU) declared under the Fisheries Act (2004) (See below).
AEWA Asia-Europe Water Bird Agreement. An international
convention to support conservation of water birds. AFM Administration and Finance Manual. Is a harmonized tool
for the administration of SWM and PFM mainstreamed into the local government MTEF planning, budgeting and reporting system.
AWP Annual Work Plan. Is the annual activity plan of a Village,
District or Division. BMU Beach Management Unit. As per the Fisheries Act (2004)
means a group of devoted stakeholders in a fishing community, whose main function is management conservation and protection of fish in their locality in collaboration with the government.
BTC Belgium Technical Cooperation, Belgium aid. CAWM College of African Wildlife Management. Based at Mweka,
offers certificate and diploma level training in wildlife. CBC Community Based Conservation. Akin to CBNRM, it is the
engagement of communities, generally around Game Reserves (by WD), based on village participation in conservation co-management of wildlife & wetlands.
CBCTI Community Based Conservation Training Institute.
Located in Likuyu Sekamaganga, is a college of the WD for community leaders and village game scout training.
CBD Convention on Biological Diversity. CBNRM Community Based Natural Resource Management: Is the
management of natural resources by the community user group on village land or in co-management with the State on state land or open areas, and applies equally to forestry, fisheries, wetlands and wildlife.
CBO Community Based Organization: Means a non-government
organization, appointed as representatives of village government, to conserve and sustainably manage resources on reserved village land for the benefits of the local community ordinary resident in the area.
CCS Community Conservation Services. Akin the CBNRM, it is
the support given to communities around National Parks (by TANAPA) as a benefit sharing scheme to entice co-management responsibilities.
CEPA Communication, Education and Public Awareness. A
strategy to raise mass awareness on a topic, using mass media tools.
CH4 Methane. CO2 Carbon Dioxide.
COP Conference of Parties, an global meeting of international conventions (eg Ramsar, UNCED, etc).
CR Community Reserve: a natural resource (ie forest, fish,
wetlands or wildlife) within a Village Area set aside by a group in the community, with the support of the Village Assembly and the Village Council (= Village Reserve).
CSO Civil Society Organization. An NGO representing civil
society. D*D Decentralization by Devolution. Describes recent local
government reforms to empower administration at the local governance level.
DADPS District Agricultural Development Plans. District DDP for
agriculture. Danida Danish Development Aid DC District Council, comprises a body of the elected, political
representation of the ward, who govern the district and its development activities.
DDP District Development Plan. Is the 3 year rolling plan of
envisioned district level developments, in MTEF format. DDT An agro-chemical pesticide. DED District Executive Director. Senior technical and accounting
officer of a District Council. DeNRM Decentralized Natural Resource Management. The process
of devolving management to the local government of natural resources = CBNRM under D*D.
DEMC District Environment Management Committee. Councilors
appointed to oversee environment and natural resource elements of the District Development Plans (DDP).
DEMO District Environment Management Officer. Is appointed
under EMA, responsible as secretary to the District Environment Committee, and facilitator of SOER and EAP process.
DFO District Forestry Officer. Forestry specialist of a District
Council. DFP District Focal Point. A district officer appointed by DED to
represent a sector (eg SWM and PFM). DFT District Facilitation Team. Made up of a multi-sector team
of expertise (eg. In natural resources, forest, fish, wetlands or wildlife) who are designated as the District extension service providers to deliver technical messages to communities (= EMC).
DGO District Game Officer. Wildlife and wetland specialist of a
District Council. DLNREO District Lands, Natural Resources and Environment
Officer. The senior district officer to coordinate the DFT in natural resource (ie. forest, fish, wetlands or wildlife) management.
DNRAB District Natural Resources Advisory Board. A collective
of district stakeholders to group to assist and monitor WMA developments.

xiii
DoE Division of Environment. In the VPO office, coordinates EMA.
DPG-E Development Partner Group on Environment. DPLO District Planning Officer. Responsible to LGA, for
developing and monitoring the DDP implementation. DSC Director of Sector Coordination. Responsible in PMO-
RALG for the coordination of decentralization of natural resource sectors (ie. forest, fish, wetlands or wildlife).
DW Director of Wildlife. Head of the Wildlife Division. EAP Environment Action Plan. Mandated by EMA at village,
district and sector level, and revised every 5 years, it is the natural resource sectors (ie. forest, fish, wetlands or wildlife) plan of the national and DDP.
EIA Environmental Impact Assessment. Measuring the
environmental consequences of any project, action, etc. EMA Environmental Management Act. Is the umbrella
legislation that governs environmental management and all natural resource sectors (ie. forest, fish, wetlands or wildlife).
EMC Environment Management Committee. Is mandated by
EMA, potentially replacing the DFT as the focal point for a multi-sector committee to manage the environment and all natural resources (ie. forest, fish, wetlands or wildlife).
ENR Environment and Natural Resource Unit in VPO. EU European Union. FBD Forestry and Beekeeping Division of the Ministry of
Natural Resources and Tourism. Finnida Finnish Development Aid. GCA Game Control Area. A protected area for wildlife allowing
limited use, eg for sport hunting. GDP Gross Domestic Product. The annual turn-over of the
economy of a country. GEF Global Environment Facility. A funding agency in
environment. GR Game Reserve. Is state reserved land for protection of
wildlife, subject to regulated consumptive use. GMP General Management Plan (or Integrated Management Plan
= IMP) is a tool to guide management and development of a PA, Ramsar Site or wetland.
GTZ German Technical Cooperation. A German government
technical assistance service provider. Ha Hectare. HEP Hydro-electric Power. Electricity generated from water
powered turbines. HIV/AIDS Human immune-deficiency Virus/Acquired Immuno-
deficiency Syndrome. A sexually transmitted desease. IBA Important Bird Area. Areas of significance to birds. IDCC Inter-District Development Committee. A collective of
district administrators who come together to manage a trans-boundary resource, like wetlands.
IGA Income Generating Activity. A livelihood action that
generates income.
IMP Integrated Management Plan. A holistic GMP taking all sectors into consideration.
IRA Institute for Resource Assessment. An institute within
UDSM for research and technical services in resource management.
IWM Institute of Wildlife Management (Pasiansi). An WD
college for the training of game wardens and rangers, located in Mwanza.
IWRM Integrated Water Resource Management. Is the holistic,
basin wide approach taken to manage water resources. JAST Joint Assistance Strategy of Tanzania. The DP alignment
to government under Paris Declaration. JET Journalist for Environment in Tanzania. A society of
environmental journalists. JM Joint Management. A general term to describe how a
community can collaborate with central or local government in the management of gazetted natural resource areas (ie forest, fish, wetlands, marine or wildlife) reserves. A state of “co-management” prevails, based on Joint Management Agreements (JMA), Joint Management Plans (JMP), etc.
JMA Joint Management Agreements made between LGA and
communities to manage state forests. JMP Joint Management Plans made by community and LGA to
manage state forests. KVRS Kilombero Valley Ramsar Site, a registered Ramsar Site. Km Kilometers LF Lesser Flamingo. LGA Local Government Authority. Means under D*D, the
mandated governance institutions at Village, Ward and District level.
LNRS Lake Natron Ramsar Site. A registered Ramsar Site. LUP Land Use Plan. Is a planning tool for villages to designate
current land use zones, areas for future expansion and reserves for protection.
M3 Cubic Meter M&E Monitoring and Evaluation. Is a management tool for
measuring progress against pre-set targets in MTEF, to assess progress is on track, and the outputs achieved in the form of tangible, OVIs.
MCT Malihai Clubs of Tanzania. The CEPA arm of Wildlife
Division, supports school and community wildlife clubs. MDA Ministry, Departments and Agencies. Describes central
level institutions. MDG Millenium Development Goals. Global targets to reduce
poverty. MMRS Malgarasi-Moyovosi Ramsar Site. One of the largest RS in
Tanzania. Previously under SIMMORS project. MNRT Ministry of Natural Resources and Tourism. Parent
ministry of forest, wetlands, marine parks and wildlife, and their economic use through tourism.
MPA Marine Protected Areas or reserves as defined in the Marine
Parks and Reserves Act (1994). MTEF Medium Term Expenditure Framework. Is the government
planning, budgeting and reporting tool based on annual and 3 year rolling plans, with M&E formats for reporting progress.

xiv
MUKUKUTA National Strategy for Growth and Poverty Reduction (=
NSGPR). National strategy to fight poverty. NAWESCO National Wetlands Steering Committee. A national body
made up of Permanent Secretary’s of 8 ministries to look after wetland resources (ie. representing local government, agriculture, livestock, irrigation, forest, fisheries, wetlands or wildlife) steering wetlands policy based on the Ramsar Strategic Plan.
NAPA National Plan of Action. Plan for combating climate change. NCCA Ngorongoro Crater Conservation Area. The authority
managing the Conservation Area. NEMC National Environment Management Council. An
environmental watchdog. NFP National Forest Program. Is a SWAp with joint donor
support to implement a nation-wide forest program initiative in PFM.
NGO Non Governmental Organization. Describes service
providers. NP National Park. A maximum wildlife protected area where no
consumptive use is allowed. NR National Reserve. A natural resource (ie forest, fish,
wetlands or wildlife) which falls within the jurisdiction of the State and is owned by the State as a whole and declared as a reserved area by law (eg. Game Reserve), but subject to certain permissible consumptive uses (= Protected Area which does not preclude consumptive use).
NRM Natural Resource Management. Is the management of all
natural resources on ecological basis. NWS National Wetlands Strategy. Is Tanzania’s national strategy
to implement the Ramsar Strategic Plan and is implemented as the SWMP.
NWWG National Wetlands Working Group. A multi-sectoral
representative body advising NAWESCO on all matters pertaining to SWM in Tanzania.
NYM Nyumba Ya Mungu. A HEP dam on Pangani River system. O&OD Obstacles and Opportunities for Development. Is a local
level planning tool to get villages to express their development needs and aspirations, it looks at opportunities to exploit NR, not necessarily sustainable use.
O&M Operation and Maintenance. oC Degrees Centigrade. OVI Objectively Verifiable Indicator. Is a tangible, measureable
deliverable as a result of implementing an action plan, usually used in logical framework analysis (LFA) and make up the targets for M&E.
PA Protected Area. The same as a national reserve, is a
geographically defined area, designated or regulated as a centrally protected natural resource area (means National Parks, Forest Reserves, Game Reserves, Ngorongoro Conservation Area, Wetland Reserves, Marine Parks, Game Control Areas, etc).
PFM Participatory Forest Management. Is the term for CBNRM
of forests. PFM WG Participatory Forest Management Working Group. Is the
national advisory body to the NFP on PFM.
PlanRep Local Government Planning and Reporting Database. Is central governments system for monitoring performance in natural resource sectors.
PMO-RALG Prime Minister’ s Office – Regional Administration and
Local Government. Is the MDA of all LGAs. PPA Public Procurement Act (2004). Lays down how public
funds are used. PRSP Poverty Reduction Strategy Paper. MKUKUTA. The
national approach to poverty reduction. PRA Participatory Resource Assessment. This is a process
which assesses the resource (ie forest, fish, wetlands or wildlife) and leads to the development of a management plan.
PM Project Manager. Employed by and reporting to MDA (eg.
WD) centrally with responsibility for the management of wildlife and wetland reserves (ie Game Reserves, Ramsar Sites, etc).
RAMSAR The international wetlands convention named after a city
in Iran R&S Roots and Shoots. A local NGO, linked to Jane Goodall RAS Regional Administrative Secretary. Is the accounting
officer at Regional governance level. RBA River Basin Authority. A basin authority to oversee water
allocation. RBMP River Basin Management Plan. A basin wide IWRM plan REMC Regional Environment Management Committee. Regional
level committee, under EMA. RFP Regional Focal Point. Appointed by RAS to oversee sector
at regional level (eg SWM or PFM). RMKRS Rufiji, Mafia, Kilwa Ramsar Site. A registered Ramsar
Site. RS Regional Secretariat. Is the support unit to the RAS office. RUBADA Ruaha Basin Development Authority. The basin authority
for Ruaha. RWF Regional Wetlands Facilitator. Hired technical assistance
by SWM project to assist RFP. SACCOS Savings and Credit Cooperatives Societies. Micro-credit
schemes. SC Sub-committee. Of NWWG (eg CEPA SC). SEA Strategic Environmental Assessment. Analysis for strategic
mitigation of any adverse effects of a policy, strategy, project, program, etc.
SMART Describes OVIs as: Specific, Measurable, Achievable,
Realistic and Time Bound. SOER State of the Environment Report. Mandated by EMA for
village, districts and sectors, with special emphasis given to wetlands, it is a situation analysis of pressure, state and response indicators used to monitor progress.
SSAP Single Species Action Plan. Following AEWA format, is a
national action plan to manage water birds. SUA Sokoine University of Agriculture. SWAp Sector Wide Approach. Is a holistic, programmatic
approach to sector development.

xv
SWMP Sustainable Wetlands Management (Programme). Is the policy implementation of the NWS to attain wise use under the Ramsar Convention Strategic Plans for Wetlands, under a programmatic approach.
SWOT Success, weakness, opportunities and threats (or problems
= SWOP): Is a tool for the planning of sustainable and wise use of resources. Unlike O&OD, it also looks at the threats created by development and livelihoods and thereby allows for mitigation measures to help restore damage caused by unsustainable pressures.
t/ha Tons per hectare. A level of production per unit area. TA Technical Advisor. An expert hired to advise a ministry,
program, project, etc TAFIRI Tanzania Fisheries Research Institute. Coordinates all
fisheries research. TAFORI Tanzania Forest Research Institute. Coordinates all
forestry research. TANAPA Tanzania National Parks. The Wildlife Authority of MNRT
managing all NPs. TAWIRI Tanzania Wildlife Research Institute. Coordinates all
research on wildlife and wetlands. TB Tuberculosis. A lung disease. TLU Total Livestock Units. Unit of measure as to how many
cattle can be grazed per unit area of land. TNA Training Needs Assessment. An analysis of the training
needs of a particular sector. TNRF Tanzania Natural Resources Forum. A collective of natural
resource NGOs, which network to trade information, and lobby for policy change, work with communities, etc.
TORs Terms of Reference. Description, scope of work of a
consultancy or functions of a staff member, officer or committee.
USAID USA Development Aid. USD United States Dollar ($). UDSM University of Dar es Salaam. VA Village Assembly. This is the meeting of all adult members
of the village held at least four times a year, and described in the Local Government (District Authorities) Act, 1982 as ‘the supreme authority in the village’.
VC Village Council. The Government of the village elected by
the Village Assembly to govern all matters relating to the community, including its shared resources.
VDC Village Development Committee. The LGA responsible for
village development planning.
VEMC Village Environment Management Committee. Made up
village leaders to manage the environment according to EMA.
VEO Village Executive Officer. VFMA Village Forest Management Area. The whole or part of a
local FR or National FR which has been placed under the management authority of a Village Council (equivalent to a WMA).
VLR Village Land Reserve. A natural resource (ie forest, fish,
wetlands, marine or wildlife) which falls within the Village Area and is owned by the community as a whole and declared as a reserved area by the Village Council and is protected, acting on the recommendation of the Village Assembly.
VNRC Village Natural Resource Committee. Elected by the
Village Assembly and approved by the Village Council to act as Manager of a Village natural resources (ie forest, fish, wetlands, marine or wildlife).
VPO Vice Presidents Office. Is the MDA overseeing EMA. WCST Wildlife Conservation Society of Tanzania. A membership
based NGO on natural resources conservation. WD Wildlife Division. The Wildlife Authority of the Ministry of
Natural Resources and Tourism. WEO Ward Executive Officer. Political appointee at ward level. WFI Wetlands Friendly Investments. Are activities or mini-
projects carried out at grassroots level based on village management plans to make unsustainable practices more sustainable.
WMA Wildlife Management Area. Means the whole or part of
village land which has been placed under the management authority of a Village Council (and/or CBO, an Authorized Association) for purposes of conservation and sustainable utilization of natural resources (ie forest, fish, wetlands or wildlife).
WPT Wildlife Policy of Tanzania. The main policy that governs
wildlife and wetlands use and development. WU Wetlands Unit. Is the secretariat in WD to NWWG and
NAWESCO, coordinating the SWMP and Ramsar Convention.
WUA Water Users Association. Organizations of a cross-sector of
water users (ie irrigators, miners, livestock, wildlife, fishers, HEP, domestic and industrial.
WWD World Wetland Day. Globally, all over the world CEPA
programs are carried out on wetlands on this day: 2nd February.
WWF World Wide Fund for Nature. An international NGO
working on wildlife.

1
CHAPTER ONE
INTRODUCTION TO SUSTAINABLE WETLANDS MANAGEMENT IN TANZANIA
This section introduces the Resource Book and its background as embedded in the Ramsar Convention, and answers some basic questions
about what this CEPA Guide is designed for and who are the targeted user groups, listing other resource material in this series.
a. Introduction to Resource Book, handouts, objectives, etc. b. Wetlands Acronyms, Definitions and Terms.
c. Background on History of Ramsar Convention in Tanzania. d. SWMP Explained.
e. 3 pillars of Ramsar: Wise Use (including CEPA), listing wetlands of international importance and international cooperation. f. Target and User Groups of CEPA.
g. CEPA Resource Book, Leaflets and Poster Content. h. SWM Guides
1.1. Introduction to this Resource Book The first Wetlands Communication, Education and Participation for Awareness (CEPA) Brochure for Tanzania was produced in Swahili in 1995, by the Malihai Clubs of Tanzania (MCT). It was used at that time as a tool for targeting schools, wildlife clubs and communities. The aim, was to broaden understanding on wetlands and their sustainable management to the general public and particularly the youth. This was followed by an IUCN book on Wetlands of Tanzania in 1995 and SIMMORS CEPA materials in 2005. This current National Wetlands CEPA Resource Book is more detailed to serve as reference material for education. It communicates the importance of wetland ecosystem services to mankind, helps to explain the national Sustainable Wetlands Management Program (SWMP) and elaborates Community Based Natural Resource Management (CBNRM) of wetlands. Its application is towards the encouragement of wise use of wetlands under Devolution by Decentralization (D*D) as relates to MKUKUTA. In doing so it elaborates the ecology, biology, importance and threats to wetlands and how this can be manage within the policy framework. In 2008, MNRT, through MCT and the Wetlands Unit in Wildlife Division (WU/WD) collaborated to update the 1995 MCT Wetlands Brochure. The result was a National Wetlands CEPA Resource Book. This Book is intended as a compendium of knowledge, to be used as a CEPA training tool, to convey in a simple, easy to read way, elements of wildlife and wetlands management which has emerged from the revised 2007 Wildlife Policy and the new 2009 Wildlife Act. This CEPA Resource Book sets out to explain, amongst other things, the new Wildlife Policy and wildlife legislation as applies to wetlands. It uses simple language for a wider audience aimed at training and participatory involvement for greater awareness raising on wetlands. The main aim of this Resource Book is for use by CEPA agencies to create a universal understanding that there is an urgent need for all citizens to actively take part in sustainably management of their wetlands. It is also about raising national awareness at all levels about wetlands, their ecology, functions, services, importance and sustainable use. This has also been extended to include a comprehension of the holistic approach to the many inter-dependent facets of wetland ecosystem services, like use in energy generation, food production (eg through irrigation), provision of water and grazing for livestock and wildlife and, other uses so as to ensure future, sustainable livelihoods.

2
1.2. What is SWMP? In 2000, Tanzania joined the international convention on wetlands management known as the Ramsar Convention of 1971. Accordingly, Tanzania produced its first National Wetlands Strategic Plan (2003-5). This plan was revised in 2006-8 and has become popularly known as the national “Sustainable Wetlands Management Program” (SWM P) based on a draft National Wetlands Strategy (NWS). SWMP is managed by a National Sustainable Wetlands Management Steering Committee (NAWESCO), which is made up of 9 Ministries at Permanent Secretary (PS) level. NAWESCO is the oversight body of SWMP, and is chaired by Ministry of Natural Resources and Tourism (MNRT) and is assisted by a technical body - the National Wetlands Working Group (NWWG) which is made up of 35 institutions. The Wildlife Division (WD) in the MNRT is the Secretariat to these bodies, through the Wetlands Unit (WU). The Malihai Clubs of Tanzania (MCT) is the CEPA arm of the WD. Jointly with the WU, MCT have a national policy mandate to undertake CEPA in wetlands at all levels, from central to local government, NGOs, CBOs, private sectors and the public at large. Likewise, Wildlife Conservation Society of Tanzania (WCST) is also the Ramsar CEPA Focal point for Tanzania. Together with WU, they advise NWWG and NAWESCO on CEPA strategies for creating greater awareness and understanding on wetlands. Collectively, WD/WU, MCT and WCST combined efforts to develop this CEPA Resource Book, under the auspices of the NWWG Sub-Committee of CEPA. The intention is that it will become one of the lead training instruments of the SWMP.
1.3. What is CBNRM of Wetlands? Community Based Natural Resource Management (CBNRM) is defined as: the management of natural resources at the lowest form of appropriate local governance, usually at the user group level, under the village government and applies to all sectors: forestry, fisheries, wildlife, wetlands, bee keeping, water, etc. In the case of CBNRM as applied to SWMP, this is currently being developed in 14 pilot Districts. The aim of these pilot case studies is to develop a systematic approach to CBNRM of wetlands as applies under the government policy of Decentralization by Devolution (D*D). This devolution of management to LGA, is popularly becoming known as, “Decentralized Natural Resource Management” (DeNRM), however, unlike in education, health and the like, the formal devolution under the Local government Reform Program (LGRP) has yet to take place, and are still at a “pilot stage”.
Fact Box 2: Decentralized Natural Resource Management (DeNRM) Defined
DeNRM and CBNRM are synonymous. DeNRM is the empowerment at the lowest local government level of user groups, to participate jointly with LGA, to take charge of and to co-administer their natural resource base on village land (ie land, trees, water, fish, wildlife,
etc), to sustainably manage and wise use for present and future generations through the LGA planning system, with enforcement through local government by laws and district development process.
What this means is that government reform policy in all natural resource sectors is to encourage civilian participation management and control through user rights. This should empower the lowest user groups (the community) to both own and sustainably manage their resources on village land. Under Local Government Authority (LGA), village governance is both the user, owner and manager of its resource base. This is known as “Participatory Management” if on village land, or “Joint Management or Co-Management” if on public or state land (eg forest reserves). This Resource Book is about stimulating these kinds of local initiatives through education and about instilling participation for awareness and joint action, where wetlands are concerned. The similarity in the approach as relates to 6 basic steps to CBNRM, is universal across all sectors as outlined in Chapter 7.

3
1.4. Who are the Target Audience of this Resource Book? This Resource Book is designed for use by training, education, outreach and extension agents, with the aim of providing information in a relatively simple and user friendly format in order to impart knowledge about wise use of wetlands for participatory management and for awareness raising.
Fact Box 3: Target Audience of this CEPA Guide
a. Wetlands user groups: like farmers, pastoralists, fishers, hunters, gathers of: natural food, fibers, medicines, etc.
b. Collective CBNRM groups: like PFM, BMU, WMA, Catchment Management,WUG, etc. c. The youth: either in schools, clubs (e.g. wildlife), religious institutions, or places of higher learning, colleges, universities, etc.
d. Community leaders: like village groups, community leaders, grass root decision makers, policy and planners. e. Local government authorities: like village leaders, local councilors, members of parliament and ward executives.
f. Central Government authorities: like ministries, directorates, regional government, parastatals and protected area PMs,
1.5. Who are the Users of the Resource Book? This Resource Book is designed for use by CEPA agents as outreach material for providing knowledge to the above target groups.
Fact Box 4: Users and CEPA Agents of this Guide
a. By NGOs through patrons/matrons of wildlife clubs as well as community leaders for raising awareness to youth and community, (ie
Wildlife Clubs may include MCT, WCST, Roots and Shoots, etc). b. By extension services (Government, District, Ward and NGOs) to assist, in Community Based Conservation (CBC) or Community
Conservation Services (CCS) or Local Government programs, under D*D. c. By planners and local policy makers, and Wetlands Focal Points to include SWM in District Development Plans (DDP) and village
plans for District Natural Resources Advisory Board (DNRAB) to use in WMA management. d. By training institutions like Mweka (CAWM), Likuyu Sekamganga (CBCTI), Pasiansi (IWM) and Universities like University of Dar
es Salaam (UDSM) and Sokoine University of Agriculture (SUA) where it can be used to train future PA Managers, community workers and extension outreach staff.
e. In schools, to guide school teachers and school clubs. f. General public, as a Resource Book how to achieve wetlands awareness for use by NGOs, CBOs and private sector, as well as the
general public. g. For use by Protected Areas Project Managers (PM) and their community workers, Ramsar Site Project Managers, to work with
communities in key wildlife corridors, WMAs and around PAs. h. To provide the CEPA materials for inclusion in posters, leaflets, school lesson plans and the like. Fact Boxes present statistical
information in an easy to read formats, for quick reference, that can be quoted in speeches, in presentations, and used as training aids.
i. To help the Reader to provide information, to change attitudes and instill more responsibility towards wise use of wetlands resources.
1.6. How to Use this Resource Book: This Resource Book is designed as a reference guide to use as a tool for teaching and for this purpose it has adopted the following style.
Fact Box 5: Layout and Use of this CEPA Guide
a. Abbreviations: A large number of the terms and acronyms used in this Resource Book will be new, and so all abbreviations used in
the text are explained in Fact Box ## for quick reference and as a learning guide. b. Definitions: Most of the words used in the Resource Book, may be new and as a help, more definitions and explanations of terms are
given in Fact Box ##, in a quick reference style for easy reading.

4
c. Fact Box: Throughout, useful statistics and facts and figures have been used in “Fact Boxes”, designed for quick and easy reference, and as data that can be used by managers when lobbying for resources or persuading resource users to change behavior.
d. Illustrations: Throughout, the Resource Book has used photographs, maps, tables and figures to illustrate its text. The photos are presented as a separate insert so as to maximize on the use of colour.
e. Review Questions: At the end of every Chapter are suggestions for the teacher/trainer/extension agent to use as an exercise to quiz the audience on what has just been discussed to check on understanding and to re-emphasize a point.
f. Group Work: To make it interesting, and enhance learning, each Chapter has suggestions for group exercises, and work activities to give practical experience.
1.7. Accompanying CEPA Materials and Tools: To facilitate outreach, each Chapter is accompanied by a CEPA leaflet, a 4 sided, folded A4 2 page hand out, an illustrative text, generally in Swahili and English, for easy reading and reference by the trainees/audience and as take home material to share with others.
Fact Box 6: SWM CEPA Leaflets
1. Sustainable Wetlands Management in Tanzania.
2. Tanzania Wetlands Ecology and Biology 3. Wetlands of Tanzania and Types.
4. Importance of Wetlands in Tanzania. 5. Threats to Wetlands in Tanzania.
6. Wetlands Policy of Tanzania. 7. Community Based Management of Wetlands in Tanzania.
8. Wetlands Friendly Investments for Tanzania.
1.8. Useful SWM Training Materials: In support of this CEPA Resource Book, the SWMP has also produced a number of useful training manuals and guides.
Fact Box 7: Additional, Useful SWM Manuals, Guides, Resource Books and Training Materials
1. A Guide to SWM Research Agenda 2. A SWM Manual (and Users Guide).
3. An Administration and Financial Management (AFM) Manual (For Participatory Forest Management (PFM) and Sustainable Wetlands Management (SWM).
4. A User’ s Guide to AFM Manual. 5. A Guide to District and Wetlands Inventory and Participatory Resource Assessment.
6. A Guide to Wetlands Friendly Investments in Pastoralism. 7. A Guide to Wetlands Friendly Investments in Irrigation. 8. Lesser Flamingo Single Species Action Plan (SSAP LF).
9. CEPA Leaflets (one for each of the CEPA chapters and the above). 10. The SWMP Strategy
Work Box 1: Review Questions:
1. What does SWMP stand for…?
2. What does CBNRM stand for….? 3. List 2 users of this CEPA Guide Book…? 4. Where will you find useful definitions…?
5. What is a Fact Box...? 6. Name 2 useful wetlands manuals/guides…?

5
Group Work:
1. List the resource user groups who make use of wetlands in your area…? 2. Draw a diagram showing the link between these users, the village government and district administration…?
3. Use Fact Box 2 to guide you…..

6
CHAPTER TWO
TANZANIA WETLANDS ECOLOGY, BIOLOGY AND ECOSYSTEM FUNCTIONS
This section describes the definition of wetlands, its ecology and biology with emphasis on different parts of the wetland ecosystem, wetland characteristics, wetlands and food web, wetland biodiversity, plant and animal interactions and adaptation to wetlands life.
a. Definition of wetlands.
b. Describing the ecosystem, food chain/web/trophic levels. c. Detailing the hydrological/water cycle.
d. Listing the biodiversity (Flora and Fauna of Wetlands). e. Comparative productivity of wetland vs other ecosystems.
f. Functions of freshwater and marine ecosystems (purification, percolation, etc).
2.1. Definition of Wetlands. There are wetlands everywhere where there is “water stored on land”! Wetlands are areas where water covers the soil or substrate, or is present either at or near the surface of the ground for all of the year, or for varying periods of time during the year.
Wetlands have the following definition (adopted from the Ramsar Convention):
‘They are areas of marsh, swamp, peat land, stream, river, lake or ponds etc, natural or artificial, temporal or permanent, with still or running, salty or fresh water, together with coastal areas with water not exceeding six meters during low tides.’
The popular Kiswahili name for a wetland is ‘Ardhioevu’ or is sometimes referred to as ‘ ardhi chepechepe’.
Fact Box 8: About Wetlands:
a. Areas on land which are wet throughout all or part of the year.
b. Nature’s store of water on land (ie sponges). c. Areas of marsh, fen, peat land, bogs, swamp, floodplain, ponds or all areas flooded with water.
d. Include springs, streams, rivers, dams and lakes. e. Contribute to percolation and re-charge of ground water table, artisian springs, fossil groundwater lakes, etc.
f. They can be either natural or man-made (e.g. hydro-electric or irrigation dams, fish farms, salt pans, rice fields, sewage ponds, mine sludge dams, gravel quarry pits).
g. Water can be permanent or temporary, static or flowing. h. The water can be either, fresh, brackish, salty, sodaic or alkaline.
i. Include coastal marine inshore waters up to depths of 6 meters (e.g. lagoons). j. Include islands, riparian or inter-tidal coastal zones.
k. Mangroves and areas influenced by tides, mud flats, estuaries, creeks and salts flats are regarded as wetlands. l. Include inland lakes inshore waters up to depths of 6 meters. m. Can be frozen water, like permafrost, ice caps and glaciers.
n. Wetlands are water, and as such are very fragile and sensitive towards climate change.
2.2. Wetlands Ecology
Wetland ecology is all about the environmental or natural science of the biology and functions of what is basically an aquatic ecosystem. Ecology looks at the natural balance between flora and fauna biodiversity and

7
their relationship with the peculiar hydro-chemical cycle and food webs that characterizes the different types of wetland bio-tomes.
Wetlands are part of a continuous landscape that grades from wet to dry. They are often found at the intersection or interface between true terrestrial habitat (dry land) and true aquatic habitat (lake, sea or ocean) and usually include elements of both ecosystems. Their characteristics are defined by those areas that are inundated or saturated by surface or groundwater, and by frequency and duration of inundation sufficient to support different life forms. Under normal circumstances wetlands support a prevalence of vegetation and fauna typically adapted for life in aquatic environments, flooded or saturated soil conditions.
Wetlands can be extremely varied and fluctuating ecosystems and therefore inherently difficult to categorize. Many wetlands are unique to a certain degree, as their individual characteristics are determined by a combination of factors such as climate, soils and hydrology, which determines the combination of animals and vegetation.
Fact Box :9 Intersection of terrestrial habitat and aquatic habitat (Tiner, 1991) Wetlands can be categorized by several biotomes, notably: a. Open water: A true aquatic environment, permanently inundated, supporting submergent vegetation and aquatic live,
such as fish. b. Permanently Flooded: Shallow waters, with emergent plants, generally covered in water for all or most part of the
year, extremely rich in organic nutrients and silt and very productive zone, a major fish feeding area. c. Periodically Flooded: An intertidal or inter-flood zone where seasonally during the rains, water rises to inundate this
area categorized by plants, generally grasses and a few tree species (like mangroves, palm trees and acacias) that can tolerate water logged soils, or their roots being under water for all or part of the wet season.
d. Permanently Saturated: Is boggy or marshy ground, waterlogged for all or part of the year due to seepage from upstream sources or high water table. Again, characterized by vegetation types that can tolerate their roots in water.
e. Periodically Saturated: Higher ground, away from the permanent flooding areas, but in receipt of water logging for a small part of the season, but not excessive such that trees and other vegetation predominate.
Fact Box 10: Low Water, Flooding and Flood Recession Phases of a Floodplain Cycle (Roggeri, 1995)

8
Wetlands also are marine in nature and can be categorized by (Richmond, 2002): a. Tides: The daily rise and fall of the sea level is known as tides, and they are vital to the ecology of the inter-
tidal and coral wetlands. Produced by the gravitational pull of the moon more so than the sun, that causes the oceans to bulge outward as they are pulled by the gravity of these two objects. High tide is always experienced on the side of the earth directly facing the moon and on the opposite side of the planet. Tides vary over a 24 hr period and over the 29 day lunar cycle due to the position of the earth and moon rotation.
b. Extreme or Spring Tides: Twice in a lunar cycle, at full moon and new moon, the sun and moon are directly in line and their combined gravitational pull results in a greater tide range, or extremes known as “spring tides” and can be 2-4 m.
c. Smaller or Neap Tides: During the half moon phases, when the sun and moon are in opposite sides of the earth, their gravitational pull neutralizes each other and the tidal range is much smaller, called “neap tides”.
d. Tidal Range: The amplitude of a tide is determined by the season and shore topography, and during the equinoxes in March and September, when the sun and moon are on the same plane, the amplitude is the greatest.
Fact Box: Profile of a Coastal Intertidal Wetland Showing the Tidal Zones (Richmond, 2002)
e. Littoral Zone: The intertidal area, that washed by the tidal extremes, or intertidal zone, can be small a few
meters on rocky shores of 3km in shallow flats. The difference between the tidal ranges of spring and neap therefore determine the ecology and habitats according to gradient between immersed and exposed shoreline. The upper parts are only immersed during high spring tides and are dry most the year, with diverse plant species (eg mangroves) while the sub-littoral lower reaches only exposed during spring lows are more diverse in aquatic life (eg coral reefs).
f. Mangrove Forests: These are salt tolerant evergreen plants, of which 9 species are found in Tanzania. They occur in soft sediment shorelines, from the mid-eulittoral to the upper shores, and trap sediments, recycle nutrients, buffer wave action, stop erosion and make up a very productive ecosystem, breeding and nursery grounds for many fish and aquatic species and a valuable source of timber and poles.
Fact Box: Cross-section of a Coastal Intertidal Wetland Showing the Main Habitat Types (Richmond, 2002)
g. Salt Marsh: In the upper tidal reaches and seepage zones, salt concentration in the sols can be high, and the
area is categorized by salt tolerant grasses and bushes known as “salt marshes”. h. Seagrass Beds: These are terrestrial plants adapted to a marine life, at least 10 species occur in Tanzania.
They prefer sandy substrates of intertidal zones and mud flats to about 20 m depth, limited by light penetration (ie less in dirty, turbid waters. By trapping sediments, seagasses play a vital role to stabilize sandy areas, protecting shores from erosion and home to hundreds of invertebrates, of several 1000/m2, and algae. Numerous fish species find food and shelter here.

9
i. Rocky Shores/Cliffs: Most are of fossil coral outcrops of Pleistocene age, common in strong wave or wind action areas, often interspersed with sandy beaches and characterized by being water retentive, thus creating habitats for many plants and epifauna.
j. Coastal Lagoons: Stretches of sea water partly separated from the sea by low, narrow elongated strips of land, coral reef or sand bars, covered in seagrass beds, coral patches. Numerous attached benthic life-forms and invertebrates find food and shelter here, in addition to hundreds of species of fish who come in at high tide and leave when it becomes shallow. The fringe reef also forms a reef flat dominated by coralline algae, brittle stars, anemones and a host of life forms and a rich fishery for octopus and sea cucumbers. Coastal lagoons are a rich source of food for coastal communities.
Fact Box: Cross-section of a Typical Intertidal Zone, with Fringe Reef and Lagoon (Richmond, 2002)
Coral Reefs: Perhaps some of the most diverse ecosystems on the planet, a 3 dimensional living structure of thousands of benthic plants and animals living in amongst the hard and soft coral communities encrusted with algae. Home to may fish, invertebrates and other aquatic fauna, corals produce a hard calcareous skeleton to protect their soft tissues and deposit limestone in a symbiotic relationship with a zooxanthellae alga. Growing at 0.5-0.7 cm/year, corals are very sensitive to light, high temperatures, or exposure to air, and coral bleaching (ie a die out) can occur if the water temperatures get to hot, a feature of “el nino” or climate change. These habitats provide a very
important breeding and feeding ground for aquatic organisms harvested by local beach communities.
2.3. Characteristics of Wetlands Three conditions must be satisfied before an area will be classified as a wetland. The area must exhibit: a. Characteristically wet: (ie. Hydric or water-logged) soils, sediment or substrate, characterized by high nutrient loads
and often a low level of oxygen available for biological purposes within the root zone; b. Permanent or periodic inundation: or water saturation of the soil or substrate; and c. A predominance (made up of) of characteristic plants and animals: that are adapted to live, breed and grow under
these conditions. Water-logged soils are characterized by: a. Wetland soils are water saturated or water logged (and this occurs when enough water is present amongst the soil
particles to limit the possibility of any diffusion of air into the soil). b. Decomposition is where bacteria and other micro-organisms break down organic matter and this can result in
accumulation of a layer of decomposing (rotting) organic matter on or in the water-logged soils of wetlands. c. Soil reduction or de-oxygenation occurs when, due to water-logging, oxygen is not available to soil microbes (eg
bacteria, fungi, etc), and they cease to decompose (breakdown) the organic matter or substitute oxygen contained in iron compounds in their respiratory process.
d. Re-doximorphic includes grey or mottled layers (mixed colours) which occur when iron compounds, in the absence of oxygen, are reduced by microbes in anaerobic soils and carried away, leaving bare grey mineral soils. The iron tends to be oxidized elsewhere, leaving orange stains (ferric oxide compounds), usually at the seasonal high-water table.

10
2.4. Wetlands and the Hydrological Cycle (Water Cycle) To manage wetlands it is first important to understand the “water cycle”. Whereas it is high ground and forest micro-climates that bring rainfall, it is wetlands that catch and store the water on land! This process is described as the water cycle. a. Water Catchment: Where water is concerned, we all live in a river basin. It is really a part of your address – your
house, street, village, town, province, region and basin! So how our river basins are being managed concerns all of us. What happened upstream could affect those living downstream. Wastes dumped upstream (eg sewage) could harm downstream communities, and any dams, or excessive water use upstream (eg irrigation) or damage to catchment forests (eg deforestation for timber) or due to overgrazing (ie pastoralism) could limit water available to downstream users.
b. Water Cycle: Heat from the sun causes water vapour (= moisture) to rise (= evaporation) from oceans, seas, lakes, wetlands, land and glaciers. Plants also release moisture into the air though trans-evaporation from their leaves, and so do animals when they breathe. This water vapour rises, and cools, and condenses (reforms as water droplets) into clouds, and when the moisture in the clouds becomes too heavy, it falls as rain (= precipitation). Rain fall gathers as droplets at first, then into puddles, forming streams and rivers, and runs down to the lowest point (to wetlands), either a floodplain, lake or sea.
c. Groundwater: When water sits on land, in a wetland, it will also percolate (or seep) through the soil and ends up stored
in underground aquifers or groundwater reservoirs. Underground aquifers store around 97% of the worlds unfrozen fresh water and provide safe drinking water for between 25-50% of the global population who tap this through wells and boreholes – and they play an important role in irrigated agriculture.
d. River Basin: A river basin, watershed, catchment and drainage basin are all interchangeable terms to describe an area of land that is drained by a river. It includes all the connected land surfaces that drain from many streams and tributaries, to associated lakes, reservoirs, marshes, swamps, as well as the under-ground aquifers. The final destination is usually through an estuary to the sea (eg Rufiji River Basin rises in Mbeya, flows through Usangu floodplain, through Mtera dam is joined by Kilombero floodplain, and drains through the Selous to the Rufiji estuary which is lined with mangroves).
A river basin includes many inhabitants, and its biodiversity – humans and other animals, plants, bacteria, etc, are characterized by its degree of water saturation. Imagine it like a giant bath tub that catches all the water that falls within its sides and sends it all out towards the bath-plug, the sea! River basins are usually separated from adjacent basins by a ridge, a hill or a mountain, and this is known as its catchment, or watershed.
Fact Box 11: Wetlands and the Water Cycle (Ramsar WWD 2011)
(Seepage)

11
Some basins however, are inland basins that do not drain into an ocean – rather, water is recycled entirely through evaporation or seepage. These are called “endorheic basin”, and around the world, make up about 18% of all land (e.g. in Tanzania the soda lakes are endorheic, like Lake Natron, Lake Eyasi, etc).
e. Interconnected Water: What is important to appreciate, is that the wetlands within the basin – rivers, lakes, swamps,
reservoirs, etc. – are interconnected. They act like a series of major arteries and minor capillaries that keep us alive, and all the other living things in the basin, too. Surface waters in wetlands are closely associated to most underground aquifers (eg an underground lake), and this groundwater is exchanged between them in both directions. Some aquifers depend for recharge (re-filling) almost entirely on the downward seepage (percolation) of water from a wetland, while conversely some wetlands may depend on the outflow from an aquifer (a spring) as their water source.
Just as there are limits to using or pumping water from rivers or lakes, the extraction possibilities for groundwater are not limitless, and over-exploitation leads to a similar impairment of the water cycle and often to salt water intrusion (entry) into underground aquifers near the sea. Likewise, wastes or sewage dumped above or underground will eventually seep and find its way into contaminating ground water, therefore placement of waste dumps and latrines near water tables must be carefully regulated.
2.5. Hydrology and Nature of the Wetland Wetlands may support both terrestrial and aquatic plant and animal biodiversity. However, the level and duration of water inundation (ie duration and severity of flooding) largely determines the degree of surface water, soil or substrate saturation. This influences the type of ecosystem niches that develop and the type of plant or animal communities living in, on or adjacent to the water, the water/subsurface interface and in the subsurface layers, generally water logged soils. Therefore, the most important factor that determines the overall nature of a wetland is it hydrology cycle and associated water and soil chemistry. The timing, quantity, and duration of water flow strongly influences both abiotic (non-living, eg hydro-chemistry.) and biotic (living, eg. Flora and fauna) factors within a wetland.
a. Abiotic factors that are determined by hydrology in a wetland could include soil texture, water quality, or topography, whereas
b. Biotic factors influenced by the hydrology in a wetland would be plant and animal types, biodiversity or quantity.
The prolonged presence of water creates conditions that favor the growth of specifically adapted plants and animals, and promote the development of characteristic wetland soil. Hydrology alone, does not always affect biology, as animals such as beavers (and man) can change the nature of a stream by constructing a dam, or vegetation can build up over time in an area and reduce available surface water through increasing evapo-transpiration or accumulation of silt and organic debris.

12
Fact Box: 12 Seasonal Variations with Water Cycle in a Typical Delta (Roggeri, 1995)
2.6. Wetland Habitats A habitat is a place where an organism finds the food, water, shelter and space that it needs to live, grow, reproduce and survive. In other words a habitat is a secure home for plants and animals. Wetlands are characterized by a diversity of plants and animals specifically adapted to wetland conditions, as well as a variety of “microhabitats” which offer very specific conditions for animals and plants. A microhabitat is an area within the habitat that presents a different set of living conditions from the area right next to it. In wetlands, some specific microhabitats include (See Fact Box 9): a. The open water zone or permanently flooded, b. the emergent zone, the zone partially flooded, where the soil is sometimes wet and sometimes dry and c. the dry uplands. There are plants and animals that are perhaps abundant in one of these areas but could not survive in an adjacent zone. For example, typha (bullrushes), papyrus and phragmites (reeds) are found in shallow water at the edge of the wetlands only, but cannot survive being inundated in deeper water or on dry land. Floating plants on the other hand, need more open water. Most ducks can be found both in open water and along the shore of wetlands but they rarely range to the dry uplands. Wetland plants and animals are uniquely adapted to life in one or more particular microhabitat.
2.7. Adaptations to Life in the Wetlands Even with its abundance of water and nutrients, the wetland environment is a challenging place to live. Survival in the wetlands means adapting to periods of both flooding and drought. It means dealing with reduced oxygen in both the soil and water. Organisms must often contend with accumulated salts or other pollutants. The day to day tasks of finding food and shelter as well as reproducing must also be accomplished to ensure a species’ survival. Wetland plants and animals have therefore evolved and developed a variety of physical and behavioral adaptations to deal with the particular set of challenges presented by life in the wetlands. One of the biggest challenges organisms face in some wetlands (eg floodplains) is surviving in an often oxygen-deprived environment. Sediment and soil in a wetland are often anaerobic (– that is, there is very little available oxygen).

13
This is a big challenge for wetland plants that need oxygen for respiration and nutrient exchange. Wetland plants have developed several strategies to deal with this condition. Many have developed air spaces throughout their structures to move oxygen from the emergent parts of the plant (the part above water) to the roots. Other plants have developed above-ground roots and other structures which enable them to literally “come up for air” (eg mangroves have aerial roots to breath). Wetland bacteria have a unique way of dealing with anaerobic conditions. Rather than using oxygen for respiration, they use sulfate. The by-product of their respiration is hydrogen sulfide, which is what causes the rotten-egg smell in the muck of many wetlands, and is the result of decomposing actions by anaerobic bacteria.
Fact Box: 13 Physical Adaptations of Different Plants in the Wetlands (Roggeri, 1995)
Wetland plants generally fall into three categories. a. Emergent plants are those that are rooted in the soil but extend above the water’s surface. b. Submergent plants are those that live completely underwater. c. Floating plants are just that – they float on the water’s surface and may or may not have their roots in the soil.
Fact Box 14: Habitats of Typical Wetland Herbivours (Roggeri, 1995)
Floa�ng Plants Emergent Plants

14
2.8. Webs of Life in Wetlands Wetlands functions are very productive and provide great volumes of food or nutrients that attract many plant and animal species. There is an abundance of water and nutrients in wetlands. a. Wetlands Plant Species: With plenty of sunshine (the ultimate source of energy), plants thrive in this environment. As
plants grow, die and decompose, they become the basis of the wetland food chain. b. Wetlands Bacteria, Fungi and other tiny organisms feed on these decomposing plants (also called detritus). In turn,
these microorganisms feed small invertebrates such as insect larvae, snails and worms.
c. Wetlands Animals such as frogs, small fish and birds consume these invertebrates. The small animals become food for larger predatory fish, reptiles, amphibians, birds, and mammals.
d. Wetland Productivity: In this way energy from the sun travels through may food chains and food webs. The sheer productivity of energy at the primary level makes wetlands unique. The constant growth of plants, which are the primary level of the food chain, leads to an abundance of energy all the way up the food chain. Wetlands are literally teaming with life.
Fact Box:15 Food Web Diagram for a Typical Antelope Wetland (Roggeri, 1995) Wetland Productivity: In this way energy from the sun travels through may food chains and food webs. The sheer productivity of energy at the primary level makes wetlands unique. The constant growth of plants, which are the primary level of the food chain, leads to an abundance of energy all the way up the food chain. Wetlands are literally teaming with life.
Typical Shallow-Water Coral Reef Wetland Showing Bio-diversity (Richmond, 2002)

15
2.9. Wetlands Productivity
Fact Box16: Wetlands are some of the most Productive Ecosystems on the Planet (Roggeri, 1995)
Wetlands constitute some of the most productive and valuable natural habitats on Earth. They provide many important functions and services for society but are ecologically very sensitive and fragile systems which are being threatened by human overuse, and very prone to climate change (See Chapter 5for explanation). Climate change is due to mankind’s influence on the planet’s temperature, which is rising due to waste emissions called greenhouse gases (GHG), including carbon dioxide (CO2), methane (CH4), etc. The aims and responsibilities of different levels of management organizations (from community to State) are to protect and ensure wise use of wetland areas, at the same time ensuring that the ecological balance is maintained, so that wetlands do not become damaged, and can continue to support life. This is particularly vital when wetlands are in close proximity to local communities. Here, the establishment of mutually beneficial ways of utilizing such areas is crucial to ensure their continued existence. Incomplete information on the ecological role and the functions of wetlands, combined with the lack of recognized property rights has led to their uncontrolled, over-exploitation, conversion (eg encroachment for agriculture) and degradation. This Resource Book aims to enlighten more on these perspectives so as to try and halt the current, destructive path.
2.10. Wetland Functions Support Life: Tanzania is richly endowed with wetlands which cover 10% of land area, and their functions provide the bulk of life services that support mankind and all other forms of life. Wetlands are the “liver and kidneys of the Earth” ! Wetlands act as sponges, they filter, clean and store water, recharging ground water. Without wetlands, rivers and streams, which acts like veins and arteries, would simply bleed the land dry and life giving freshwater would be lost after every rainfall. Wetlands hold back this water, store it on land, making it available for all forms of life. All water mankind and animals use, comes from wetlands. This is known as the “Ecosystem Services or life support services of a wetland”. Wetlands are a living ecosystem! If wetlands were damaged, waterways would seasonally dry up, would not flush nor purify, and as a result, they would die and stink from the waste and rotting organic materials.

16
Fact Box 17: Wetland Ecosystem Resources and Functions by Type (Roggeri, 1995)
During rainfall seasons without wetlands, rivers and streams, water would simply flow unimpeded (un-restricted) into the lakes, seas and oceans, draining all life giving water from the land. Without wetlands there would be no water storage on land (surface water), no perennial (all year round) water flows in rivers and streams. No water would be stored without depressions like lakes, marshes, swamps, floodplains and inter-tidal zones. Without water storage, no percolation (seepage) would take place, and there would be no re-charge of groundwater as a result wells would also dry up! Inter-tidal zones are some of the most productive ecosystems on the planet; they provide vital nurseries and feeding areas for fish. Without tidal wetlands, and tidal flows, water exchange would not take place and these coastal depressions would become clogged with wastes, rot, smell, de-oxygenate and die. Wetlands are sponges, resembling living tissue, they hold water on land and in intertidal zones where “wetland ecosystem services” become life support functions available for man, plants and animals to live and survive. Water is the giver of life and wetlands are the main source of all freshwater on our planet. Wetlands are so diverse in nature and function, that they perhaps contain and support almost 60-70% of all biodiversity in Tanzania. Globally, 60-65% of mankind lives on, in, or near a wetland (MEA, 2005). Wetlands are also highly susceptible to climate change. For example catastrophes such as floods, droughts, storms, ice melt, increased evaporation and sea rise would adversely affect wetland’ s ability to store water.
Wetlands also assist both in carbon sequestration (= carbon fixing) and local climate amelioration (to reduce adverse effect on local micro-climates). Wetlands can fix carbon at 100tC/ha/yr and store carbon at a rate of 1000 Ct/ha with peat land and permafrost bogs contain 33% of all globally stored carbon. Wetlands can also produce methane as a by-product of decomposition of organic matter.
Fact Box 18: Key Life Services of Wetlands are:
a. Water for animal and human survival.
b. Water for human livelihood and domestic needs. c. Water for mining, industry, energy (i.e. hydro-power), for cities.
d. Water for waste and sewage disposal. e. Water for food production, fish and agriculture.
f. Water for dry and wet season grazing for livestock and wildlife. g. Water percolation/seepage to re-charge groundwater supplies.

17
h. Water storage to ensure perennial flows in streams and rivers.
Wetlands are life! No water, no wetlands, no life!
2.11. Wetlands are often Mistaken as Waste Lands Wetlands are often mistaken as wastelands, and believed to be as a source of diseases! Many people consider wetlands as dumping grounds, places to throw waste, places that smell bad, have mosquito’s and are a sources of animal and human health problems.
Fact Box 19: Why Wetlands are Misunderstood:
a. Dirty and polluted: There is a prevailing psychology that wetlands are sites where you throw waste, rubbish and sewage, and
because of pollution, you cannot drink the water (90% of wetlands are believed contaminated by human wastes). b. Sources of diseases of man: Bilharzia, cholera, typhoid, diarrhea, malaria, intestinal parasites and skin infections, most of which are
a result of human waste dumping in wetlands or on land that’s washes into wetlands. c. Sources of diseases of animals: Rift valley fever, anthrax, foot & mouth, avian flu, intestinal parasites, tick borne disease, liver fluke,
fungal infections, etc. generally are harboured as spores in wetlands, and become prevalent at time of drought or stress. d. Habitats of dangerous animals: Such as spiders, buffalo, snakes, hippos, crocodiles and leeches in freshwater as well as poisonous
fish in intertidal zones (eg stone fish, lion fish, sea snakes, conus shells, urchins, etc). e. Life threatening: Due to river bank erosion or flood risk to settlement, infrastructure and crops.
Because of the un-appreciation of the importance of wetlands to life, they are being undervalued, unappreciated, exploited and slowly destroyed by unsustainable human activities. Researchers consider nearly 90% of wetlands in Tanzania are contaminated with human wastes, and this is an explanation why water borne diseases are amongst the most common ailments treated in health clinics (see Fact Box 19)(Wildlife Division, 2008 SWM Research Agenda). In addition, the same report considers that 50% of wetlands have been encroached by settlement, agriculture or pastoralism, thereby reducing nature’s natural storage of water on land, which could have dire consequences when water in the future becomes more scarce due to climate change. Wetlands are life, they need to be used wisely and managed sustainably.
Work Box 2: Review Questions:
1. Define what is meant by a wetland…?
2. Explain the water cycle.? 3. Elaborate, why wetlands are the kidneys and liver of the earth?
4. List 3 reasons why wetlands are mis-understood as waste lands? 5.
Group Work:
1. Draw a wetland food web of a typical wetland in your area. 2. Show what are the importance of the wetlands to livelihoods?

18
CHAPTER THREE
WETLANDS OF TANZANIA AND CLASSIFICATION BY TYPES
This section describes the wetlands of Tanzania, their distribution, river basins, protected wetlands and the different types of wetland with examples from Tanzania
a. Distribution of Wetlands.
b. River Basins. c. Protected Wetlands (Ramsar Sites of Tanzania).
d. Ramsar Classifications of wetlands (Marine and Freshwater). e. Definition of Natural and Man-made.
i. Major fresh water ecosystems � Riverine � Lacustrine
� Marshes and swamps. � Floodplains
� Bogs � Peatlands � Springs
� Crater lakes.
ii. Major marine ecosystems � Coral reefs � Mangroves � Sea grasses � Estuaries
� Beaches and shoreline
iii. Man-made Freshwater Wetlands � Dams (HEP, irrigation, water supply).
� Agricultural. � Fish ponds.
� Sewage systems. � Drainage channels and ditches.
� Borrow pits and quarries. � Fish pond.
iv. Man-Made: Marine:
� Salt works. � Salt pans,
� Magadi (Soda lakes), � Waste water treatment,
� Fish farming, etc.
3.1. Distribution of Wetlands in Tanzania Wetland ecosystems occupy about 6% of the world’s land surface. Wetlands range from 1% to 16% of the total land area in various countries in Africa, vary in type from saline coastal lagoons, to fresh and brackish water. In Tanzania the Wildlife Policy (2007) estimated that:
� 10% of the country surface area, is wetlands. � 7% are natural freshwater wetlands (79,450 km2) � 3% of freshwater wetlands (27,000 km2) are freshwater swamps, marshes, deltas and seasonal floodplain. � 3% is coastal shoreline, salt marshes, intertidal zones, sand islands, estuaries, mangroves, etc.

19
Also there are a number of artificial impoundments for hydropower production and irrigation.
Map 1: Distribution Map of Wetlands in Tanzania A list of the 115 key wetlands of importance in Tanzania are listed in Fact Box 38.
Fact Box 20: The Wetland Estates of Tanzania
a. 10 % of land area is wetlands.
b. 7% is freshwater c. 3% brackish water d. 115 key wetlands.
e. 9 river basins, 7 of which are trans-boundary. f. 60% of wetlands are on village land.
g. 40% of wetlands are in Protected Areas. h. Wetlands include parts of 87 National parks/Game Reserves/Game Control Areas and 815 Forest Reserves.
i. 1 500 km of tidal coast line (800 km mainland, the rest is islands). j. 1 500 km2 of intertidal zone, and fringe reef.
k. 1 100 km2 of mangrove forest. l. 80 Important Bird Areas (IBA), 50% for migratory water birds.
m. 5.5 % of land area is in 4 key Ramsar sites (See below), n. 100s coral and sand islands.
o. 2,266 km2 of land area is in 4 key Marine Protected Areas (See below).
3.2. River Basins of Tanzania Tanzania is divided into 9 river basins, the largest of which is the Rufiji system which drains from both the Ruaha and Kilombero catchments and covers 18.5% of the country by area and is especially important for hydro-power generation and irrigation. The inland drainage system of the rift valley lakes makes up 15.9% as does the drainage of Lake Tanganyika, followed by Lake Victoria and Ravuma river systems at about 11% each.
Wembere Swamp
LakeBalangida Pangani
System
Wami System
Ruvu System
BahiSwamp
Ugalla
Rukwa-KavitiSystem
MalagarasiMoyowosiSystem
Lake Tanganyika
LakeRukwa
Usangu Flats Kilombero Valley
Liwali Swamp
Lake Nyasa0 200 km
N
LakeManyara
LakeNatron
LakeEyasi
KEY
LakesWetlands

20
Fact Box: 21 The 9 River Basins of Tanzania
Sl No Basin Name
Area Water Use
(km2) % H
EP (M
W)
Irrig
atio
n
Live
stoc
k
Dom
estic
Indu
stry
Fish
ery
1 Pangani 56300 5.8 1 1 1 1 1 1 2 Wami 72930 7.5 1 1 1 1 3 Rufiji 177420 18.4 1 1 1 1 1 4 Ruvuma 104270 10.8 1 1 1 5 Nyasa 47245 4.9 1 1 1 1 6 Internal 153802 15.9 1 1 1 7 Rukwa 88000 9.1 1 1 1 1 8 Tanganyika 151000 15.6 1 1 1 1 1 9 Victoria 115400 11.9 1 1 1 1 1 Total: 966367 100 3 9 8 9 4 6
Fact Box 22; Size of the 9 River Basins Catchment and Primary Water Uses
3.3. Protected Wetlands of Tanzania: A protected wetland is any wetland that is protected by legislation either as a PA (ie GR, GCA, NP, NCA, etc), or marine park, or forest reserve, or Ramsar Site, or WMA, or under new Wildlife Act and EMA. The United Republic of Tanzania is the largest country in East Africa, encompassing a total area of 945,262 km2. Since 1890, Tanzania has gradually devoted about 30-40 % of land and water surface area to conservation.
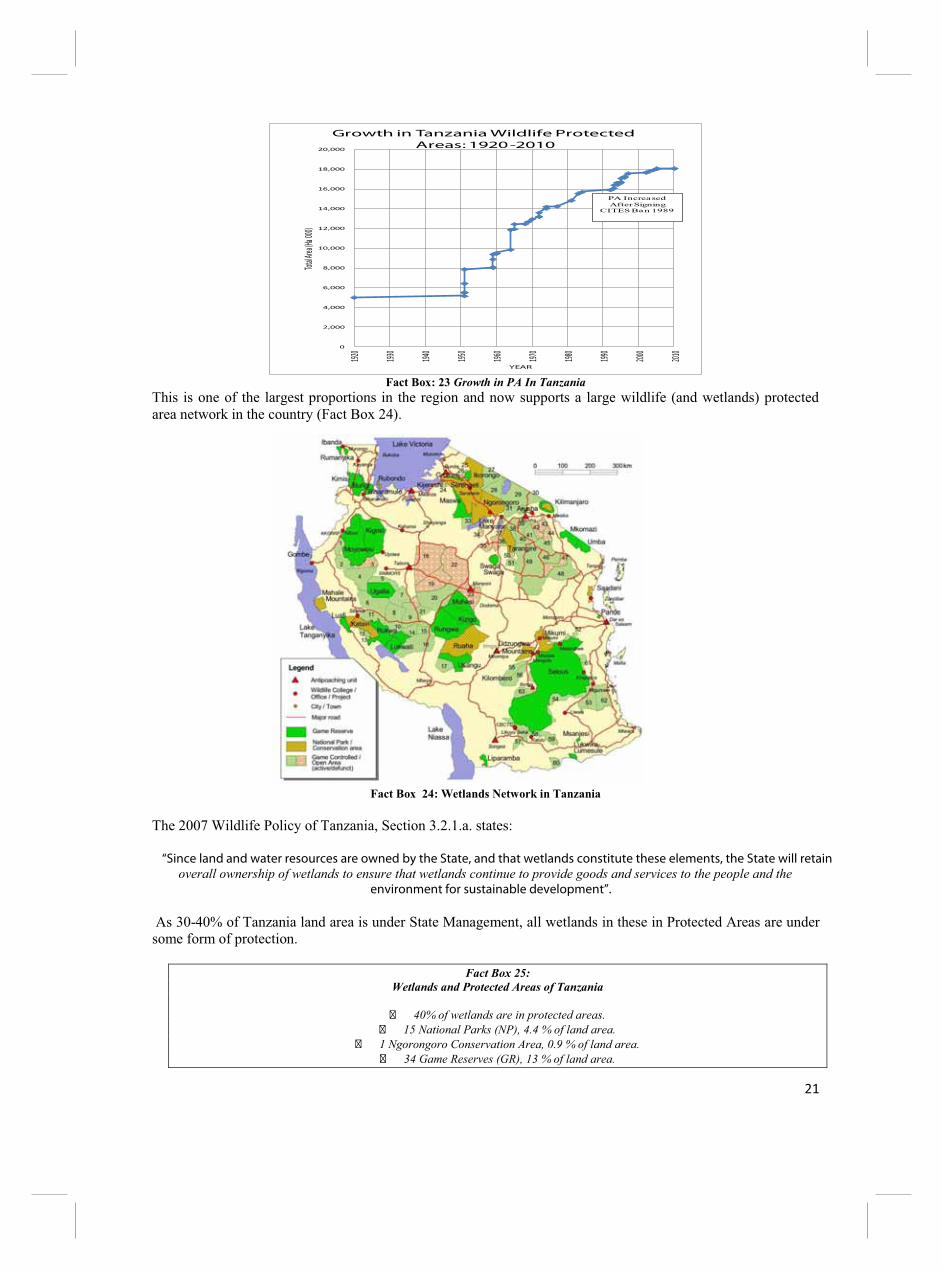
21
0
2,000
4,000
6,000
8,000
10,000
12,000
14,000
16,000
18,000
20,000
1920
1930
1940
1950
1960
1970
1980
1990
2000
2010
Total
Area
(Ha 0
00)
YEAR
Growth in Tanzania Wildlife Protected
Areas: 1920-2010
PA Increased After Signing
CITES Ban 1989
Fact Box: 23 Growth in PA In Tanzania
This is one of the largest proportions in the region and now supports a large wildlife (and wetlands) protected area network in the country (Fact Box 24).
Map 2: Protected Areas of Tanzania
Fact Box 24: Wetlands Network in Tanzania The 2007 Wildlife Policy of Tanzania, Section 3.2.1.a. states:
“Since land and water resources are owned by the State, and that wetlands constitute these elements, the State will retain overall ownership of wetlands to ensure that wetlands continue to provide goods and services to the people and the
environment for sustainable development”.
As 30-40% of Tanzania land area is under State Management, all wetlands in these in Protected Areas are under some form of protection.
Fact Box 25: Wetlands and Protected Areas of Tanzania
� 40% of wetlands are in protected areas.
� 15 National Parks (NP), 4.4 % of land area. � 1 Ngorongoro Conservation Area, 0.9 % of land area.
� 34 Game Reserves (GR), 13 % of land area.

22
� 38 Game Control Areas (GCA), 5.5% of land area. � 815 Forest Reserves (FR), 15 % of land area (3% overlap with wildlife PA’s).
� 143 Hunting Blocks. � 33 Wildlife Management Areas (WMA) underway, 35 000 km2, 200 villages, 12 with user rights.
� 31 key game corridors between wetlands.
In addition, under the Marine Parks and Reserves Act of 2004, key marine areas are also protected, and 0.3 % (2,266 km2) of land area is in 5 key Marine Protected Areas, which can be considered as protected wetlands.
Fact Box 26: Wetlands in Marine Protected Areas of Tanzania
� 750 km2 Tanga Coastal MPA. � 822 km2 Mafia Island MPA. � 668 km2 Mnazi Bay MPA.
� 36 km2 Dar es Salaam Reserve. � ? ha Chumbe Marine Park (private).
It must be noted that 60% of land in Tanzania is village land, and as such the management of all resources in these areas, including wetlands, is under the policy of CBNRM. The 2007 Wildlife Policy makes provision that communities can get access user rights as Authorized Associations (AA) and be allowed to manage wildlife and wetlands by establishing a Wildlife Management Area (WMA), for the protection of wildlife and wetlands. The 2009 Wildlife Act also creates a new category of PA, notable “Wetlands Reserves” or areas, for which, legislation guidelines are under development. The EMA (2004) has categorized wetlands as fragile, sensitive environments and the VPO is in the process of developing regulations for areas classified as “protected wetlands”
Fact Box 27: Tanzania is also at the Cross-Roads of 2 major Bird Flyways Linked to wetlands (Roggeri, 1995)
Over 300 species of birds migrate between the EU and Africa, a large number use freshwater habitats and Tanzania is at the epi-center of 2 major flyways, the East African and Asia/India. Wetlands offer the birds food, shelter and water, and due to flooded, often muddy condition, offer birds protection from terrestrial predators and therefore wetlands are also major breeding and roosting grounds, or resting areas. Tanzania has many wetlands that are registered with AEWA as Important Bird Areas (IBA). These are mostly wetlands, typified by their waterbird populations that make up the key biodiversity species. Two of Tanzania’s Ramsar sites have been specifically set aside for water-birds, notably: � Lake Natron for Lesser Flamingo. � Malagarasi/Moyavosi for the shoebill and wattle crane.

23
Fact Box 28: Tanzania has Many Important Bird Areas (IBA) (Baker, 2004)
Water connects us all! It is life giving, and wetlands are the source of all water! Although water is a renewable resource, it is nevertheless finite (i.e. we do not have an unlimited supply of fresh water on our planet). Once we use it all up, there will be no more water. Recent global studies show that Tanzania has one of the world’s most precarious water balance. With respect to population and water availability, Tanzania was ranked one of the highest in water scarcity index. This is a feature that will become compounded by global warming.
Fact Box 29: Global Water Scarcity Index
Water is often taken for granted. Consequently the value of wetlands as sources of “all water” is under estimated. The Water Policy (2004), points out that if mankind in Tanzania continue to grow and to use water at the current rate of consumption of 1700m3/capita/year, we will run in scarcity of water in 2025.

24
Fact Box 30: Projected Population and Water Demand In Tanzania.
It is therefore important we “conserve water and use it wisely”. This is the theme of several policies and legislations described in Chapter 6, to protect water and wetlands
3.4. Ramsar Classification of Types of Wetlands Tanzania has many types of wetlands which can be listed and described by the wetland system classification of the Ramsar Convention, namely: 1. Marine/Coastal Wetlands
Occurs in Tanzania
Ramsar Classification
√ A Permanent shallow marine waters in most cases less than six metres deep at low tide; includes sea bays and straits. √ B Marine subtidal aquatic beds; includes kelp beds, sea-grass beds, tropical marine meadows. √ C Coral reefs. √ D Rocky marine shores; includes rocky offshore islands, sea cliffs. √ E Sand, shingle or pebble shores; includes sand bars, spits and sandy islets; includes dune systems and humid dune slacks. √ F Estuarine waters; permanent water of estuaries and estuarine systems of deltas. √ G Intertidal mud, sand or salt flats. √ H Intertidal marshes; includes salt marshes, salt meadows, saltings, raised salt marshes; includes tidal brackish and freshwater
marshes. √ I Intertidal forested wetlands; includes mangrove swamps, nipah swamps and tidal freshwater swamp forests. √ J Coastal brackish/saline lagoons; brackish to saline lagoons with at least one relatively narrow connection to the sea. K Coastal freshwater lagoons; includes freshwater delta lagoons. Zk(a) Karst and other subterranean hydrological systems, marine/coastal.
2. Inland Wetlands
√ L Permanent inland deltas. √ M Permanent rivers/streams/creeks; includes waterfalls. √ N Seasonal/intermittent/irregular rivers/streams/creeks. √ O Permanent freshwater lakes (over 8 ha); includes large oxbow lakes. √ P Seasonal/intermittent freshwater lakes (over 8 ha); includes floodplain lakes. √ Q Permanent saline/brackish/alkaline lakes. √ R Seasonal/intermittent saline/brackish/alkaline lakes and flats. √ Sp Permanent saline/brackish/alkaline marshes/pools. √ Ss Seasonal/intermittent saline/brackish/alkaline marshes/pools. √ Tp Permanent freshwater marshes/pools; ponds (below 8 ha), marshes and swamps on inorganic soils; with emergent vegetation
water-logged for at least most of the growing season. √ Ts Seasonal/intermittent freshwater marshes/pools on inorganic soils; includes sloughs, potholes, seasonally flooded meadows,
sedge marshes. √ U Non-forested peatlands; includes shrub or open bogs, swamps, fens. √ Va Alpine wetlands; includes alpine meadows, temporary waters from snowmelt. Vt Tundra wetlands; includes tundra pools, temporary waters from snowmelt.
√ W Shrub-dominated wetlands; shrub swamps, shrub-dominated freshwater marshes, shrub carr, alder thicket on inorganic soils.

25
√ Xf Freshwater, tree-dominated wetlands; includes freshwater swamp forests, seasonally flooded forests, wooded swamps on inorganic soils.
Xp Forested peatlands; peat swamp forests. Y Freshwater springs; oases.
√ Zg Geothermal wetlands. Zk(b) Karst and other subterranean hydrological systems, inland. Note: “floodplain” is a broad term used to refer to one or more wetland types, which may include examples from the R, Ss, Ts, W, Xf, Xp, or other wetland types. Some examples of floodplain wetlands are seasonally inundated grassland including natural wet meadows, shrublands, woodlands and forests. Floodplain wetlands are not listed as a specific wetland type herein. 3. Human-made wetlands
√ 1 Aquaculture (e.g.fish/shrimp) ponds. √ 2 Ponds; includes farm ponds, stock ponds, small tanks; (generally below 8 ha). √ 3 Irrigated land; includes irrigation channels and rice fields. √ 4 Seasonally flooded agricultural land (including intensively managed or grazed wet meadow or pasture). √ 5 Salt exploitation sites; salt pans, salines, etc. √ 6 Water storage areas; reservoirs/barrages/dams/impoundments (generally over 8 ha). √ 7 Excavations; gravel/brick/clay pits; borrow pits, mining pools. √ 8 Wastewater treatment areas; sewage farms, settling ponds, oxidation basins, etc. √ 9 Canals and drainage channels, ditches.
Zk(c) Karst and other subterranean hydrological systems, human-made.
a. Marine/Coastal Wetlands - Saline water: These include areas of land covered with salty water throughout all or part of the year. Major types of coastal wetlands are mud flats, marshes, mangrove swamps, estuaries and deltas, and intertidal zones. There can be several categories: � Coral reefs: Found offshore, in parts of the coast around Zanzibar, Tanga, Mtwara, Dar es Salaam, and Mafia. � Estuarine wetlands: Where the river meets the sea and is a mix of salt from tides and freshwater from the river, like
Rufiji delta. � Costal Shoreline/Intertidal Zone: Along the shores on the mainland, Zanzibar and coastal islands make up the bulk of
the coastline and salt pans and marshes. � Soda wetlands: Can be inland or coastal, very saline due to volcanic run-off or saline penetration inland, like Lake
Natron, Greater Momella, Bahi, Eyasi, Magadi.
b. Inland Wetlands - Fresh water. Inland wetlands, includes areas of land covered by freshwater throughout all or part of the year. Major types of freshwater wetlands include swamps, springs, marshes, pools, rivers, flood plains, oxbow lakes, permanent or temporary, forested or non forested wetlands. Inland wetlands of Tanzania may include rift valley short streams that drain inland. Inland long rivers that originate from highlands may also meander through the plains forming lakes, swamps, marshes and flood plains. These drain into the Ocean or into closed Lake Basins. There can be several categories: � Alpine wetlands: Occur in mountain country where melted snow can be the most important source of water. � Arid wetlands: May be dry for most the time, and fill up with rain water and remain wet for some time. � Riverine wetlands: Connected by rivers, found along edges of rivers, streams and creeks.
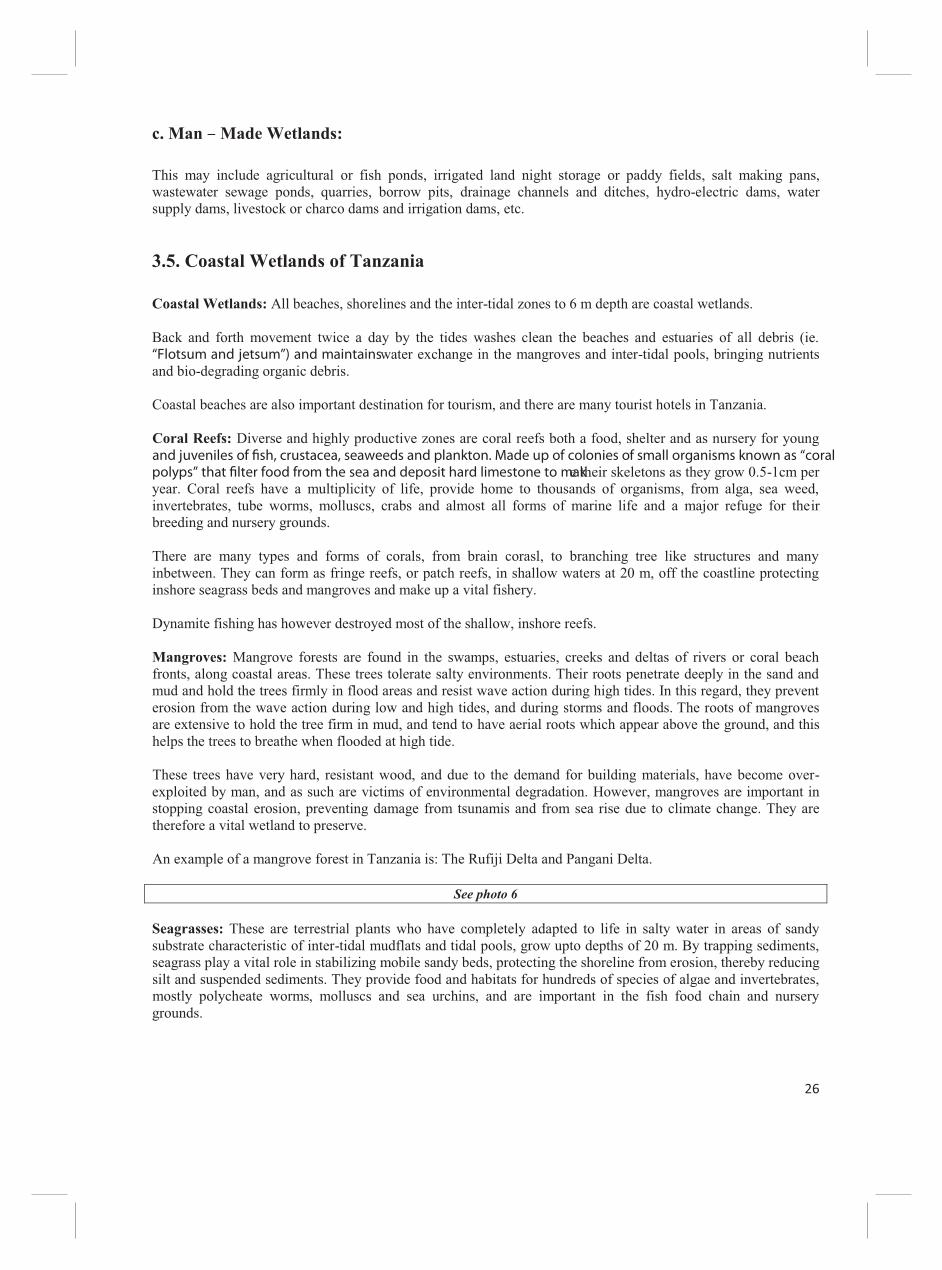
26
c. Man – Made Wetlands: This may include agricultural or fish ponds, irrigated land night storage or paddy fields, salt making pans, wastewater sewage ponds, quarries, borrow pits, drainage channels and ditches, hydro-electric dams, water supply dams, livestock or charco dams and irrigation dams, etc.
3.5. Coastal Wetlands of Tanzania Coastal Wetlands: All beaches, shorelines and the inter-tidal zones to 6 m depth are coastal wetlands. Back and forth movement twice a day by the tides washes clean the beaches and estuaries of all debris (ie. “Flotsum and jetsum”) and maintains water exchange in the mangroves and inter-tidal pools, bringing nutrients and bio-degrading organic debris. Coastal beaches are also important destination for tourism, and there are many tourist hotels in Tanzania. Coral Reefs: Diverse and highly productive zones are coral reefs both a food, shelter and as nursery for young and juveniles of fish, crustacea, seaweeds and plankton. Made up of colonies of small organisms known as “coral polyps” that filter food from the sea and deposit hard limestone to make their skeletons as they grow 0.5-1cm per year. Coral reefs have a multiplicity of life, provide home to thousands of organisms, from alga, sea weed, invertebrates, tube worms, molluscs, crabs and almost all forms of marine life and a major refuge for their breeding and nursery grounds. There are many types and forms of corals, from brain corasl, to branching tree like structures and many inbetween. They can form as fringe reefs, or patch reefs, in shallow waters at 20 m, off the coastline protecting inshore seagrass beds and mangroves and make up a vital fishery. Dynamite fishing has however destroyed most of the shallow, inshore reefs. Mangroves: Mangrove forests are found in the swamps, estuaries, creeks and deltas of rivers or coral beach fronts, along coastal areas. These trees tolerate salty environments. Their roots penetrate deeply in the sand and mud and hold the trees firmly in flood areas and resist wave action during high tides. In this regard, they prevent erosion from the wave action during low and high tides, and during storms and floods. The roots of mangroves are extensive to hold the tree firm in mud, and tend to have aerial roots which appear above the ground, and this helps the trees to breathe when flooded at high tide. These trees have very hard, resistant wood, and due to the demand for building materials, have become over-exploited by man, and as such are victims of environmental degradation. However, mangroves are important in stopping coastal erosion, preventing damage from tsunamis and from sea rise due to climate change. They are therefore a vital wetland to preserve. An example of a mangrove forest in Tanzania is: The Rufiji Delta and Pangani Delta.
See photo 6 Seagrasses: These are terrestrial plants who have completely adapted to life in salty water in areas of sandy substrate characteristic of inter-tidal mudflats and tidal pools, grow upto depths of 20 m. By trapping sediments, seagrass play a vital role in stabilizing mobile sandy beds, protecting the shoreline from erosion, thereby reducing silt and suspended sediments. They provide food and habitats for hundreds of species of algae and invertebrates, mostly polycheate worms, molluscs and sea urchins, and are important in the fish food chain and nursery grounds.

27
Rocky Shores and Cliffs: Due to the fossil coral nature of the shoreline, Tanzania coast and islands has a predominate coral rocky shore and cliff line. These are important buffers against aggressive seas, high tides and tsumanis, but also are a habitat for shellfish crabs and rocky pool dwelling species. Lagoons: Partly separated from the sea by low elongated strips of sand or reef, shallow in nature, flushed daily by tides, unless cut off by sand bars. Home to hundreds of resident species of fish and invertebrates, some which wash in and out with the tide. Are an important source of food for local communities who collect fish, shellfish, octopus and crabs from these areas.
See photo 9
3.6. Inland Wetlands of Tanzania Swamps: Swamps are very similar to marshes, but with a tendency to have more standing water. They are the areas with little water, more or less a permanent floodplain and completely or partially covered by plants. Their water can be salty or fresh. Swamps with fresh water depend upon rain water and river flooding to fill them up, and this can occur frequently. The land is usually soft and absorbs water easily, and becomes “water logged” due to high water table, but is not as boggy as a marsh. Also the area maintains many creatures such as frogs and birds. The vegetations which are found in a swamp are often short grasses, which may not be as numerous to those found in the marshes. In swamps, except for mangroves, there are generally no big trees or plants that can prevent the sun rays to penetrate, and the water temperature can be quiet high, with extremes in cold and hot seasons. Swamps with salty water depend on rain, winds and tides to flood the area. These saline swamps have great importance in the fishing of crab-like fish (crustaceans) and breeding and nursery of juvenile fish and prawns, and can be categorized by the growth of unique, salt tolerant plants, know as mangrove trees. Examples of swamps in Tanzania are: Kagera, Bahi and Usangu.
See photo 1 Marshes: Marshes are areas of low, wet ground, of poor drainage, often with little water, distinct from swamps by being smaller in magnitude, having boggy, muddy areas, wet almost all year round, but no permanent, static water, sometimes flooded. The ground can be completely or partially covered with plants, mainly sedges, long grasses or floating vegetation, but no trees. The well known marshes in Tanzania are the ones with “mafunjo” a reed like plant s used for weaving mats. In certain cases, water in the marshes can come from underground as seepage. Methane, the gas that is formed by the decayed plants, can also be released from marshes. An example of marshes in Tanzania is Mzimbazi creek.
See photo 2 Springs: A spring is a place with water coming naturally from underground. Often this is known as “artesian”. The seepage can come from an upland wetland, high goundwater table, or be from a tributary or a river, or underground stream, or volcanic intrusions or pipes. Many people get their drinking water from this form of wetlands as the water coming out the ground is considered fresh and uncontaminated. In some parts of Tanzania the downstream from these springs, could form

28
important crop and vegetable growing areas. In southern highlands of the country this Wetlands farming is commonly known as “vinyugu” , or valley bottom cultivation. Springs commonly have green grasses around their edges. Sometimes the water in the main stream from a spring can be deep or fast running, such that grasses do not grow in the main stream. There are springs which in volcanic areas come from deep underground and they can have hot water (up to 45oc) and are sulphurous and full of minerals (i.e. soda) said to be good medicine for skin diseases and bathing. Example of an area of volcanic springs in Tanzania are: Around Lake Natron and Lake Manyara.
See photo 3 Flood Areas/Plains: Flood plains are areas found at the edge of rivers, lakes and swamps. These areas are prone to flooding during the rains. High rainfall can cause over flow on the river, lake and swamp edges. The water overflows on land causing a temporary flooding of the low lying areas. Floodplains are often characterized by “oxbow” lakes, that are parts of the river that has been cut off from the main river. Generally, floodplain areas are covered with grasses throughout the year. Trees and bushes may only grow on the edges. It is not uncommon however, for floodplains to be completely dry of all water in the dry season. Generally flood plains are very potential for growing crops such as rice and vegetables. These areas are highly subjected to encroachment by agriculture (eg Usangu and Kagera swamps), settlement (eg Mzimbazi creek), industry (eg Mtoni Kijiji) and livestock grazing (eg. Ihefu). Floodplains in Tanzania can be extensive and are very important for wildlife and livestock. They provide water and grazing area for most animals during the dry season. Wetland floodplain forms crucial wildlife corridors and migration routes for wild animals as they are able to move from one floodplain to another in search of dry season water and grazing. Rufiji and Kilombero or Usangu valley in Tanzania is an example of areas where floods take place frequently.
See photo 4 Mountain Crater Lakes: Crater lakes occur at the top of volcanic mountains. They are formed as a result of volcanic activity, where rainfall can fill up the crater of an extinct volcano. These lakes can be full of minerals, due to the volcanic matter and usually very nutrient rich and very productive in algae. Some Crater Lakes are freshwater, like Lake Chala, below Mount Kilimanjaro. Other crater lakes are alkaline and an important home and feeding area for the flamingos, like Lake Empakai and Magadi (ie in Ngorongoro Crater). An example of a crater lake in Tanzania is: Empakai Crater Lake in Ngorongoro.
See photo 5 Lakes: Natural areas of permanent fresh or alkaline water can be small in size like Lake Balangida in Dodoma and can also be extremely large like the popular Lake Victoria in East Africa. Lakes and may also vary in depth from a few meters (e.g. Lake Natron in Northern Tanzania) to hundreds of meters (e.g. Lake Nyasa in South West Tanzania) to over 1000 meters, Lake Tanganyika in Western Tanzania. Because of their permanent nature, Lakes are very essential haven or sanctuary for bio-diversity, and are sites of remarkable evolution: Lake Nyasa alone has over 900 species of fish and Lake Tanganyika between 400-600 species. Lakes are also major areas for fisheries, thus provides substantial animal protein (Lake Victoria). Some lakes in Tanzania have been formed as a result of in the rift valley created due to tectonic plate movement, and they can be freshwater like Lake Tanganyika, or alkaline/soda laike Lake Eyasi, Lake Manyara and Lake Natron.

29
See photo 10
3.7. Man-made/Non-natural Wetlands Not all wetlands are natural, some are man-made. Wetlands can result from the water contained by human beings to form dams or ponds for several purposes such as production of hydro electrical power (H.E.P), or for cattle watering, for fish farming, for rice growing, for sewage waste treatment, for mining or for making salt. These areas of man-made wetlands, have plants and animals similar to those found in the natural wetlands. In the dry land areas of Tanzania, around Tabora and Shinyanga, traditionally people practice rain water harvesting irrigation schemes whereby farmers construct water retaining bunds” (ie. where small dykes are built across water courses to retain water for 3-4 months of the year for livestock and crop production such as paddy). This is a very extensive practice, and traditional irrigation of this form makes up 80% of all irrigation systems (Water Policy 2004), unregulated, this represents a major retention of water in dryland catchments, and could be harmful for downstream users.
Fact Box 31: Man-made Wetlands
� 1000’s ha of traditional irrigation using ‘water harvesting schemes made up of water retaining bunds” creating temporary wetlands,
especially in dry land areas. � 265 000 ha of “formal” rice f ields.
� 1000’s man-made dams often called “charco” dams for water storage for livestock. � 197 salt work wetlands.
� 4 HEP dams (Nyumba ya mungu, Mtera, Kihansi and Kidatu). � 1000’s sewage stabilization ponds, mine slug dumps, abandoned gravel quarries, borrow pits, etc.
� 1000’s of fish ponds.
An example of a man-made wetland in Tanzania is: Nyumba ya Mungu dam, Mtera, Kihansi and Kidatu.
See photo 7 Agricultural Wetlands: Includes areas where irrigation is carried out and where we find dams, weirs and water drainage systems designed for irrigated agriculture, including rice paddy fields, vegetables, out of season green maize, dry season cassava, or for watering livestock. These efforts have made many dry lands in the world suitable for agriculture, converting them to wetlands. Examples of agricultural wetlands in Tanzania are: Rice and Sugar cane grown in Kilombero valley in Morogoro, rice cultivation in Dakawa (Morogoro) and Ndungu (Kilimanjaro) etc.
See photo 8 Traditional Irrigation: In the dry land areas of Tanzania, around Tabora and Shinyanga, traditionally people practice valley bottom cultivation, mainly for vegetables and in dry land areas, “stream bed bunding”. Small dykes across water courses retain water for 3-4 months of the year for livestock and crop production. This extensive practice, and other traditional irrigation of this form makes up 80% of all irrigation systems. If unregulated, this represents a major retention of water in upland and dryland catchments, and could be harmful for downstream users. Rice paddy: Tanzania has over 300 000 ha of formal rice paddy, created by mechanical bunding and river diversion to produce paddy. Plans are afoot to expand this to 1 million ha, which could have major consequences for wetland encroachment and diversion of water away from key wetlands.

30
HEP Dams: Tanzania in the past derived 95% of its electricity from HEP, but today with gas power turbines, Tanzania relies on HEP for 65% of power generation. There are 4 major HEP dams (Nyumba ya mungu, Mtera, Kihansi and Kidatu) and several smaller units. Livestock Dams: As most cattle occur in dryland areas they are either grazed and watered in wetlands, or in man-made water retention dams or charco’s. Fish Ponds: Aquaculture is a relatively new but growing area of activity amongst the rural farmers, with 8 seed centers and thousands of ponds, growing mainly tilapia amounting to 1200t/yr and seaweed about 8000 t/yr. Salt Works: All salt in Tanzania comes from some 200 salt evaporation farms, which also produce a surplus for export. Sewage Works: In most big towns and cities and for big industries they use sewage stabilization ponds to bio-digest the wastes before letting outflows to rejoin streams and rivers.
Work Box 3a: Review Questions:
1. Take an A4 paper and draw a map of Tanzania indicating the locations of the key wetland areas
2. What % of Tanzania is covered by wetlands…? 3. What % of wetlands are located on village land and what % are located in Protected Areas…?
4. How many marine protected Wetlands are there in Tanzania…? 5. How many Ramsar Sites are there in Tanzania…?
6. In what year will Tanzania experience water shortage at current consumption rates…?
Group Work:
1. On an A4 piece of paper, draw a map of your area (e.g. village) and insert all the different wetlands that you know…?
2. Beside each, place the local name of each wetland…? 3. Next to each wetland list the key uses by your community of that wetland…?
4. Indicate if any of these uses are damaging the wetland…? 5. Look at Fact Box 38, the list of all wetlands, tick those that are in your area..?
Work Box 3b: Review Questions:
1. List 4 types of freshwater wetlands…? 2. List 2 types of salt water wetlands…?
3. List one type of alkaline/soda wetlands…? 4. List 4 types of man-made wetlands…?
5. What are the 4 main hydro-electric power generating dams in Tanzania…? 6. How many salt works wetlands are in Tanzania…?
Group Work:
1. On your village area map of wetlands, beside each wetland, write down what type it is…? 2. Differentiate if salt water, freshwater or alkaline…?
3. Estimate the total area of each wetland in hectares and write on the map…? 4. List the main species of plants found in each wetland…? 5. List the main type of animal found in each wetland…?

31
CHAPTER FOUR
IMPORTANCE OF WETLANDS IN TANZANIA
This section outlines the socio-economic, biological and environmental values of wetlands to mankind.
a. Linking ecosystem services with functions. b. Direct: provisioning (products, food, water, fiber, fuel, bio-chemicals, genetic material...
c. In-direct: regulating (flood control, groundwater replenishing, shoreline stabilization, water purification, sediment retention, reservoir of bio-diversity, climate change mitigation...)
d. Option: supporting (bio-diversity, nutrient cycling, pollination,. e. Non-use: cultural (cultural values, spiritual, aesthetics, education, etc).
f. Economic Importance (irrigation, HEP, pastoralism, water supply, wildlife, fish, building materials, etc.)
4.1. Wetlands Ecosystem Services and Functions Wetlands are the most biologically complex and productive ecosystems that provide many functions that benefit society, including water, nutrient and energy cycles. Water is life, and wetlands are the source of all water! Their ecosystem services (ie the benefits we get from them) can be worth as much as USD 5 000-20 000/ha. They provision water not only for all mankind and livestock (Fact Box 32), but also for the survival of 60-70% (MEA, 2005) of all bio-diversity (both aquatic and terrestrial).
0.0
5.0
10.0
15.0
20.0
25.0
0.0
500.0
1000.0
1500.0
2000.0
2500.0
3000.0
3500.0
4000.0
4500.0
Econ
omic
Serv
ices (
USD/
ha 00
0)
Glob
al W
etlan
ds Ec
onom
ic Va
lue (
USD/
Year
Billi
on)
Wetland Type
Global Valuation of Wetland Ecosystem
Services (Ramsar, 1997)
Wetlands Value USD/ha (000)
Wetlands Value USD/Year (Billion)
Fact Box 32: Global Value of Wetland Services
The importance of wetlands is that they are vital in sustaining life but the pressure on the sustainability of their ecosystem services has been increasing as the human population increases. Wetlands are important due to their many faceted ecological, environmental, climatic, economic, social and cultural benefits and life support services to mankind and all biodiversity. In this regard, we depend on water in wetlands for our survival, but despite this , few people appreciate how important wetlands are in sustaining not only people’ s lives but also animals (domesticated and wildlife) and plants. Wetlands have many values (Fact Box 33) and many life support services, which can be categorized as: Direct Values: Are those that can be derived directly from exploiting nature. Indirect Values: Services performed by wetlands that benefit mankind. Optional Values: The possible future use or application for direct conversion by man of a wetland to meet growing human needs.

32
Non-use Values: Difficult to measure but is an indicator of the socio-cultural benefits that humans derive from wetlands.
Fact Box 33: Environmental Values of Wetlands (IUCN, 2007)
The importance of wetlands to mankind and to bio-diversity, are described below.
4.2. Ecological Benefits of Wetlands Wetland provides numerous ecosystem services such as: water, food, energy, house building and construction materials, economic opportunities, livelihoods, medicines, transport, recreation, cultural values flood prevention and local climate change regulation.
Fact Box 34: Wetlands Services Provide Tanzania with:
a. Water for home needs, mining, wildlife, livestock, industry, sewage and waste disposal.
b. Food in the form of salt, fish, bush meat (although illegal), edible plants, livestock, irrigated crops, agricultural produce and vegetables.
c. Pasture in the form of dry season grazing for livestock and wildlife. d. Energy from fuel wood, charcoal, bio-fuels and hydro-power.
e. Building materials and decorations in the form of sand, coral lime, ingredients for cement, timber, poles (mangroves), reeds or thatch grass, wild flower, clays for walls, pots and brick making, materials and fibers for mats, hats, string and bamboo for furniture
and wine making. f. Economic opportunities from livelihoods, transport and tourist attractions.
g. Medicines, plants and animals that cure many ailments. h. Transport water ways for boats, ships, ferries, canoe transport and reeds and palms for making canoes.
4.2.1. Preservation of Biodiversity Wetlands are habitats for aquatic plants and animals, are very productive and rich in biota, and have the ability to sustain and provide water, food and shelter for many terrestrial species of flora and fauna. The magnitude of biodiversity can be analyzed as follows: Species Diversity: This describes the different types of species that can co-exist in one environment. Wetlands generally tend to be very diverse with many types of plants and animals. Wetlands are known to have fifty (50) times more plant types (= bio-diversity) than protected areas, and up to eight (8) times the productivity of the plants in an agriculture field (See above).

33
Coral reef wetlands contain some of the greatest diversity of species on our planet. Some of the older freshwater wetlands, like Lake Nyasa, for example, has 800 - 900 species of fish, and this diversity in one lake, is greater than the whole fish diversity of the European Union (EU). This fish diversity can be equated to the famous “Darwin’ s Galapogo’s Island Finches”, they are a feature of evolutionary adaptation to an ever changing wetland condition. Ecological System Diversity: Wetlands have an array of different types of habitats and consequently can provide home to a larger range of creatures which depend on these habitats. The diversity of different types of ecological systems that are found in wetlands is large, including ecological systems such as swamps, rivers, lakes, oceans, etc.
Photo No.10: Coral reef bio-diversity
4.2.2. Soil Erosion Control and Wetlands In many wetlands the soil is held by the roots of wetlands vegetation such that the soils are protected from erosion during flooding. Wetlands are therefore especially important in providing this function along the edges of streams, rivers, water holes, lakes and coastal areas. A good example of protective wetlands vegetation is mangrove forests. Mangroves protect the estuaries and beaches from the erosive action caused by wind and waves. Without mangroves, people would have had to build walls to protect the land from the wave erosion. Studies show that mangroves have the ability to prevent storms and hurricane damage against waves (eg Tsunamis) of more than four (4) meters height.
4.2.3. Flood Control and Wetlands Many wetlands, especially floodplains or valley bottom swamps, or areas with grass and reeds, act as buffer, or barrier to help in reducing the aggressiveness of floods and river flows. In floodplains, the widening of the flow and the vegetation, act as damping flows; reducing the frequency of occurrences and limiting the destruction that could happen if there is a sudden, rapid rise in flood waters in downstream, due to excessive rainfall on hills. After heavy rainfall, the rivers flood the valleys. These valleys, hold the water, act like a flood buffer, and allow a limited amount of water to pour downstream, until the rivers return to normal condition. Wetlands are therefore believed to be natural “regulators” in the control of floods. However, catchment’s damage due to deforestation is causing increased run-off and coupled with encroachment this is reducing the wetland flood buffering capacity, raising the threat of flood risk.
4.2.4. Water System/Water Sources and Wetlands Wetlands are very important in the provision of surface water and in the re-charge and protection of ground water sources. Many springs, rivers and wells have their sources from wetlands. Wetlands allow water to percolate or seep deep into the ground. Wetlands vegetation can hold water, like a “sponge”, so it is trapped in a wetland, and surface water is available all year round, even in dry seasons. This property of wetlands is life giving. It helps re-charge underground water, feeds springs and can make rivers run all year round. Unfortunately, due to encroachment by agriculture, livestock, settlement and land reclamation, the SWM Research Agenda suggests that nearly 50% of Tanzania’s wetlands have been damaged WD (2008). This means that through carelessness and neglect we have already lost 50% of our natural ability to store water on land. This is a very serious loss!

34
4.2.5. Water Filtration/Purification and Wetlands In addition, the same study (WD, 2008) estimated that 90% of surface wetlands was contaminated with human waste. Water in some wetlands passes underground and is, in the process, filtered or purified, so that when this water comes up from the ground, forming rivers, tributaries, ponds or springs, it is clean and safe to drink. Some wetland plants can also provide filtration. They become special filters of the water that passes through them and in the process clean it of harmful substances or silt (eg typha). Plants in wetlands can also eliminate dangerous chemicals and pathogens from water. They can absorb the toxins or kill bacteria and some viruses that can affect fish, plants and animals, even humans and this is the principle of sewage oxidation ponds. In-general, wastes including liquid, sewage and solid wastes from humans and livestock are carried by water in streams and rivers, and generally end up in the wetlands. Here they accumulate and can destroy habitat or become a threat to animals and fish. This waste accumulation can make the water “polluted”, unsafe and unsuitable for livestock and humans for drinking and washing. Due to important roles that wetlands perform, these wastes (both in solid and liquid form) can be easily treated. The treatment efficiency depends on the amount of wastes being deposited into the wetland (ie. the higher the amount of waste load, if it is beyond the natural carrying capacity, the lower will be the level of the natural treatment efficiency of a wetland and vice versa). Wetlands have the ability to absorb and filter wastes and pathogens, but in some cases, the growing population of mankind is now at a level where our pollution in water (especially sewage) far exceeds that of the plants and wetlands natural capacity to process these wastes. Once the wetlands ability is exceeded, we are gradually poisoning our water, killing our wetlands and its associated bio-diversity and ecosystem services.
4.2.6. Climate Change Control and Wetlands Wetlands are carbon sinks, they can absorb large quantities of carbon, estimated at 100 tC2/ha/yr, either in the form of carbon fixing by living plants, or in areas known as “peat lands” or “permafrost bogs”, carbon can be stored at 1000 tC/ha.
0
200
400
600
800
1000
1200
1400
Car
bo
n S
tora
ge
(C
t/h
a)
Ecosystem Type
Ecosystem Carbon Storage Potential
Fact Box 35: Carbon Storage Potential of Wetlands
We are all aware that green house gases (GHG) especially carbons due to burning fossil fuels, are impacting on the planet’s climate and leading to global warming. This is evident in the loss of the ice cap (a wetland and potential source of water for the Pangani Basin wetlands) on Mt Kilimanjaro since 1980, it has declined by 80%.

35
Wetlands, however, can also be areas that help to absorb our carbon wastes, as they can fix and preserve large deposits of carbons either in the form of living plants (eg mangroves, alga, coral reefs), or in areas known as “peat lands” or “permafrost bogs”. The latter are frozen areas of water logged ground, not common in Tanzania, but found in the Arctic circles. Burning, clearing or draining of wetland vegetation areas contributes to a release of CO2, and damages the wetlands ability to fix further carbon, thus adding to greenhouse gasses. Peat lands are also water logged, boggy or marshland areas, where dead organic material is slowly fossilizing. Peat lands act as “carbon sinks”. Degradation of this area, or its drainage such as drying the land for grow crops, bio-fuels, or exposure to cattle trampling and grazing, may lead to accelerated release of stored carbon, and these emissions can contribute further to global warming.
4.3. Economic Products of Wetlands We use wetlands for different purposes, including: fishing and hunting for food, materials for building, water for industry, drinking, cooking, washing, gardening, sewage disposal, for livestock, hydro-power and irrigation, and wetlands support wildlife for tourism, and all this we call, “wetland ecosystem services”.
Fact Box 36: % Contribution to a Village, District and Region’s Economy from Wetlands in Tanzania
Wetlands have become a great source of livelihood and income to the national economy and local people. Some of the economic activities from these areas are:
0%
20%
40%
60%
80%
100%
Firewood (100%)
Wood tools (96%
)
Palm products (75%
)
Medicinal plants (71%
)
Wild vegetables (71%
)
Wild fruits (67%
)
Roofing poles (50%)
Reeds (46%)
Building poles (45%)
Palms (45%
)
Grass (42%
)
Leaves & stems (25%
)
Fishing (21%)
Essential oils (16%)
Hunting (15%)
Clay (12%)
Plant cosmetics (10%
)
Clay pottery (9%)
Wild honey (7%
)
Insects (6%)
Beeswax (5%)
Timber for sale (4%
)
Charcoal (1%)
% h
holds
Fact Box 37: Wetland Livelihoods derived by Mtanza Msona Village, Tanzania (IUCN, 2007)
Fact Box 38:
Economic Services and Livelihoods Provided by Wetlands
a. 95 % electricity is from hydro-electric power (HEP) fed from wetlands, (eg. Usangu Basin) or fossil fuels from geological wetlands (eg Songo Songo).
b. 95 % of domestic, irrigation, industrial, mining and livestock water is derived from wetlands. c. 80% of irrigation is traditional schemes encroaching in wetlands.
d. 95% of rice is grown in wetlands.

36
e. 850 000 ha of wetlands have potential for future rice irrigation conversion. f. 95 % of vegetables are grown in wetlands.
g. 95 % of wildlife depend on wetlands for grazing and water. h. 95 % of all game corridors/wildlife migration routes are between wet and dry season wetlands.
i. 66-90 % rural communities derives their protein either from livestock grazing in wetlands, or from bushmeat (illegal), game meat, insects or fish from wetlands.
j. 95% of the 23 million cattle and all livestock are water and graze in wetlands during dry season. k. 50% of non-forest products, medicines, fibers for mats and ropes, bamboo for furniture or wine, clay for pots, etc is from wetlands
products. l. 50% or more of building materials is from wetlands, in the form of thatch, poles, clays (for walls, brick making etc), coral lime, fossil
coral limestone for bricks and cement manufacture and sand mining, m. 95% table salt is from 197 salt works in coastal and inland modified wetlands.
n. 95% of tourism (coastal and wildlife) depends on wetlands. o. 1.3 USD billion economy (33% GDP) depends on wildlife and wetlands tourism.
p. 1.3 USD billion is total estimated value of ”nyama choma” industry derived from pastoralism (TNRF, 2009 study) q. 50 USD million/year is illegal wildlife hunting (bush meat) value of 1998 (Estimated by IUCN/TRAFFIC, 2000/1998)
4.3.1. Food and Agriculture in Wetlands: Many wetlands are very fertile and support crops like: rice, maize, fruits, vegetables, etc. for example, Kilombero river valley, Usangu valley, Rukwa lake valley. The use of water for irrigation represents one of the highest consumptive uses of water in Tanzania, and therefore the greatest threat to wetland integrity:
Fact Box 39: %Water Consumption in Tanzania
Formal irrigation schemes in Usangu, are a major form of use of wetlands, and over 80% of all schemes are for traditional irrigation such as valley bottom cultivation in highland wetland areas and bunding (ie building dykes or polders across river valleys) or damming of dry river beds in dry land areas (e.g. Shinyanga).
Fact Box 40Irrigation Uses of wetlands in tanzania

37
Traditional Irrigation Schemes (Informal): Defined as: Any irrigation scheme that has been initiated and operated by farmers themselves, with no intervention from external agencies, included schemes base on traditional furrows for production of fruits and vegetables in highland areas and simple water diversion in lowland areas. The Water Policy (2004) states traditional schemes make up 80% of all irrigation schemes, and can fall into several categories: Vinyungu or Valley Bottom Irrigation: Have simple, rustic diversion structures, either in wetlands in valley bottoms
for fruit or vegetables (eg. hills of Mbeya and Iringa). Rain Water Irrigation or Water Harvest Schemes: Initiated by subsistence farmers themselves, often a long historic
cultural background, introducing simple techniques to artificially control the availability of water to crops. Includes flood recession irrigation and/or bunding across low lying wetlands in semi-arid areas, to retain water for 3-4 months of the year to grow crops (eg. Tabora and Shinyanga).
River Bed Irrigation: Informal irrigation for crops, mostly vegetables grown in dry river beds, or adjacent flood plains (eg. Ruaha Valley).
Traditional Irrigation Schemes: Generally informal rice paddies around formal schemes, making use of seepage or surplus water flows, often necessitating filling of one paddy before the next and so on, wasting water to seepage and evaporation. The water intake is made of local materials, stone, soil, wood. There are no possibilities for closing the intake and control the amount of abstracted water. The main canal is unlined and there are in general no secondary and tertiary canals. There are no drainage systems (eg. Mbeya, Kilimanjaro, Arusha and Pwani).
Smallholder Irrigation Schemes (Formal): Irrigation schemes have several criteria, all of which relate to either having canals to convey water, multiples of canals and/or intakes providing water to a scheme or village undertaking. The smallholder irrigation schemes are based on their degree of modern development, categorized into groups (eg Mbeya, Kagera and Mara):
Partially Improved Schemes: Can apply to traditional schemes, initiated by semi-subsistence farmers, on which there
has been a subsequent intervention assisted by an extension agent in the form of construction of either a concrete intake which make it possible to close and regulate the abstraction. No improvement of infrastructure and no drainage system.
Improved Schemes: A concrete intake has been constructed, improvement and lining of main canal, some improvements of infrastructure as secondary canals and distribution facilities. Probably no drainage system.
Modern Schemes: Formally planned, designed and fully developed for which full facilities have been provided by an external agent. Either a concrete intake, lined main canals and secondary and tertiary canals, proper distribution facilities (no cascading), proper drainage systems for back flow to river. And, in most cases, and element of management provided by the government, NGO or other external agent.
Large State/Private Farms: There are mainly two large state irrigation schemes in Usangu wetlands namely Kapunga and Mbarali irrigation schemes. These two farms (each approximately 3000 ha) tend to use water over an extended period from September to July in preparing fields and maintaining water supply up to and beyond harvesting. With field preparation involving large amounts of water and considerable time between first watering and transplanting, it is estimated that approximately 650 mm of water is used in wetting up soils. Farmers and farm operators also tend to maintain deeper water depths - about 220 mm water. In all, the irrigation schemes probably use over 2300 mm of water throughout the season.

38
Fact Box 41: Irrigation by Region and % Traditional (Environmental Statistics 2005)
Almost all vegetables especially tomatoes, and onions are grown in wetlands (e.g. along the Ruaha Road, Baobab Valley in southern Tanzania).
4.3.2. Pastoralism and Wetlands Due to the presence of many sweet grasses and adequate water, many wetlands in Tanzania are used by pastoralists for grazing their livestock, especially during dry seasons when water and grass are limited elsewhere. It is this behavior that brings livestock in conflict with other wetland ecosystem services (See Section on Threats). Livestock, however, are a major source of animal protein, comparable in importance to fish.
0
5
10
15
20
25
1996 1997 1998 1999 2000 2001 2002 2003 2004 2005 2006
Anim
al Pr
otein
(Kg/
Capit
a/Ye
ar)
YEAR
Total Animal Protein
Fish
Livestock
Fact Box421: Estimated Importance of Fish and Livestock to Human Nutrition in Tanzania (Economic Survey, 2006)
There are about 23 million heads of cattle (and perhaps as many sheep, goats and pigs) which depends on wetlands for dry season grazing and watering. Although livestock sales make up 3.5 % of GDP, recent studies by TNRF suggest that this may be worth as much as 1.3 USD billion is total estimated value added by the ”nyama choma” small business derived from pastoralism (TNRF, 2009 study). Two main types of livestock production systems occur in or are wetlands dependent, namely the pastoralist and agro pastoralist. The pastoralists who more or less depend on livestock keeping as the main socio economic activity is practiced by immigrant herders, the Sukuma, Gogo, Masaai and Barbaig. This system uses the wetlands natural grassland as the main source of forage. The original inhabitants had a very strong belief that the wetlands were guarded by ancestors who should not be annoyed. The access to the wetlands was controlled by elders and the chief. The arrival of other ethnic groups changed the pattern of utilization by invading every part of the wetlands. The three main types of livestock production systems are summarized in table below (NIRAS, 2009) and can be described as:

39
Pastoralist (nomadism/Semi-nomadism): Make up only 3% of households (SOER, 2008 = 0.004%), own 14-27% of the national herd (SOER, 2008 = 20%, NIRAS 2009 = 43.1%) and are defined as a farming system where livestock owners depend solely on livestock for subsistence and 50% of income. This is a traditional production system, characterized by seasonal movement/migrations in search of water and pasture, utilizing unimproved communal pasture lands (Fig. 5). The movement is between wet season and dry season grazing, generally around wetlands or sources of water. Movement from wetland to dry land and vice versa is constantly maintained to avoid disease, floods, access to water and reduce over-grazing. Increased livestock numbers, human population growth and expansion of arable lands has lead to disintegration of this system, and migrating herds experience more and more conflict. Pastoral system is concentrated in the northern plains and is practiced in traditional grazing areas where climatic and soil conditions do not favour crop production. The main roles of livestock in this system are subsistence, store of wealth and source of cash incomes. Under this system, there were about 7.9 million cattle or 43.1% of the national herd. The system is found in semi-arid areas, including parts of Shinyanga, Singida, and Dodoma.
Agro-pastoralists: Make up only 7% of households (SOER, 2008 = 40%), but own 80% of national herd, contributes 80% of beef production, and whose farming system depends on livestock and crop farming, with 25-50% of their income from livestock on communal grazing land, and > 50% from cropping activities, rotating crops to replenish soils. SOER (2008) describes 2 types, extensive involving shifting cultivation, and intensive with more sedentary cultivation. Adding livestock to their farms helps farmers diversify risk and extract value from otherwise valueless or low-value by-products. Crop residue becomes feed, manure becomes fertilizer. Agro-pastoralists may be pastoralists that choose to settle to cultivate areas to feed their families and live under conditions resembling those of the mainly subsistence-oriented smallholder farmer. Combining crops and livestock also has the potential to maintain ecosystem function and health and help prevent agricultural systems from becoming too brittle, or over connected, by promoting greater biodiversity, and therefore increased capability to absorb shocks to the natural resource base. Agro-pastoral systems are thriving, increasing at a rate of more than 2%/year, with formal recognition of associations and organizations of livestock keepers to obtain formal legal recognition of traditional grazing rights as envisaged in the new Land Act. About 1.4 million (37%) agricultural households (out of 3.9 million) are engaged in this system, about 10.3 million (56.7%) cattle.
System % Of National Herd
Management Main Production Factors
Feed Source Water Source
A. TRADITIONAL: Pastoral 14 Nomadic
Semi sedentary Land/grazing Wetland
Range grazing Wetland
Agro-pastoral 80 Transhumant/Sedentary Land/grazing Labour
Range grazing Crop by-products
Wetland Well, Dam
Agricultural Negligible Sedentary Land labour
Crop by-products Household waste/feed
Well, Dam
Peri-urban Negligible Sedentary Labour Household waste/Feed Well B. MODERN: Ranching 6 Commercial feedstuff Well, Dam
4.3.3. Source of Energy and Wetlands Energy demand for industry, for urban and rural households, is one of the highest demands on wetlands in Tanzania today, mostly for hydro-power generation (Fact Box 43). While the use of fuelwoods and charcoal for domestic energy is leading to deforestation, affecting flows to downstream wetlands. It is a developmental challenge (See Section on Threats)!

40
Fact Box 43: Power Generated by Source in Tanzania (Economic Survey, 2006)
Man-made wetlands also acts as a seasonal, storage reservoirs and sources of water for all of the generated hydro-electric power (HEP) which is the main driver of Tanzania’s tourism, industry, mines, urban and commercial economies. In the Hydro-Electric Power stations, water is dammed and allowed to flow in a regulated manner through turbines, which generate electricity. Dams like Nyumba ya Mungu in Kilimanjaro and Mtera in Iringa are some of the man-made wetlands (i.e. water storage dams) used to produce HEP.
4.3.4. Building Materials and Wetlands. Wetlands are a major source of our day to day construction material demands for human settlement and house construction. Some examples are: wood and poles, thatching grass and reeds for roofing or walls, bamboo for basket making, house fencing, mat and bed making, furniture and roof and wall construction, fibers for bed and roof making, and clays for flooring, making bricks, pots, ovens and filling walls. Lime from burning living coral, found in coastal wetlands, is traditional cement, but is very destructive as it damages living reefs. Cutting fossil coral blocks from ancient wetlands, is also common for coastal housing and limestone from fossil corals is also a key ingredient in cement manufacture. Sand and pit sand are mined from wetlands for building materials.
4.3.5. Tourism and Wetlands The natural beauty and diversity of animals and plants in many wetlands make them to be tourist attractions. Many tourists come to visit Tanzania for its wildlife and wetlands. Tourists come to see freshwater wetlands such as Lake Victoria, Tanganyika, Natron, Momella, Manyara and River Malagarasi, Rufiji and the Kilombero valley. Most tourists however, come to see the wildlife spectacle. This can be both for sport hunting as well as photographic tourism. All wildlife in our Protected Areas are dependent on wetlands, especially for dry season grazing and water. In addition, tourists come to relax and enjoy Tanzania’s coastal wetlands, its beaches, to look at marine life in the corals of the Indian Ocean, and to enjoy sport fishing.

41
Fact Box 44: Growth and Economy of Tourism in Tanzania
Tourism is now one of Tanzania’s biggest income generating activity, earning valuable foreign exchange revenue to help poverty reduction, and most of this can be attributable to our coastal and PA wetlands. In 2007/8 tourism generated nearly USD 1.3 billion (Fact Box 44). The tax revenue from this has helped to sponsor other sector programs in response to MKUKUTA, Tanzania’s poverty reduction strategy.
4.3.6. Fish and Wetlands: Fishing activities in wetlands are also carried out by the local communities and some industrial trawlers as a livelihood potential in providing both nutrition and income source. The fishery estate of Tanzania is very diverse:
Fact Box 45: Tanzania Wetlands Fishery Estate
a. 58 000 km2 freshwater bodies (Lake Victoria, Tanganyika and Nyasa are main fishery).
b. 223 000 km2 Exclusive Economic Zone (EEZ) (Shared with Zanzibar) (## % inside the reef). c. 500 Beach Management Units (BMU) formed for CBNRM in Lake Victoria (most are non-functional).
d. 1000’s fish ponds. The wetlands fishery services (SOER 2006) are diverse and ranges from fibers that are used in making traditional nets, traps and fishing lines, to long grasses used in producing certain juices which is useful for fish-net protection. The fish production from wetlands is substantial:
Fact Box 46: Wetland Fishery Services
a. 320 500 metric tonnes/year from freshwater fisheries (2005).
b. 54 970 metric tonnes/year from marine fisheries (2005). c. 142 million USD exports (2005) from marine & freshwater.
d. 10 % of total export values. e. 100 million USD is the export value of Nile Perch alone.
f. 120 000 artisanal fishermen (2003), roughly doubled since 1995. g. 30 000 rural people involved in aquaculture).
h. 170 in 2004, foreign vessels in the marine fisheries, increased from 10 in 1998. i. 9.5 Tsh billion collected as State revenue in 2003-4.
j. 9.8 Tsh billion earnings from domestic freshwater and marine fish production. k. 7.5 kg/capita fish contribution is 45% of animal protein consumption.

42
Unfortunately, due to the use of unsustainable fishing techniques, like undersized or mosquito nets, dynamiting of coral reefs, use of poisons, catching of undersized fish, fishing in breeding season or nursery areas are all adding to a depletion of the stock, and declining fish catches (SOER, 2008) (See Section on Threats).
4.4. Education and Wetlands: Wetlands are valuable sites to provide practical training to students and the community at large. Traditionally, many of our wetlands customs and cultures (eg superstitions amongst fishermen) are derived from our traditional knowledge of wetlands, taught to us by our parents and forefathers (e.g. vegetables cultivation). Many poor people depend on these teachings for their livelihoods (like fishing, collection of medical plants, hunting, etc).
4.5. Medicine and Wetlands: The existence of different natural plants in wetlands provides us with many opportunities for traditional medicines. Salt water in some wetlands is believed to cleanse some skin ailments, minerals from marine fisheries is good source of calcium supplement to humans, soda from Lake Natron helps improve cattle digestion, traditional medicines are found in wetland plants. Wetlands are therefore very important to help rural communities, where access to modern medical services is limited.
4.6. Transportation and Wetlands. Wetlands can provide us a means of water transport by canoes, boats and ferries. Also wetland trees, like palms or bamboos, can be made into canoes for transportation of goods and for fishing platforms. Reeds in some areas are used to make reed boats for fishing.
4.7. Worship and Wetlands. Wetlands are sometimes sacred places used by some communities as traditional places of worshiping. Such wetland sites are treated as sacred sites of cultural significance and places of rituals, and hence are valued and respected. Due to the nature of their work and the risk involved some fisher folks tend to be very magical-religious and establish sacred shrines and secret societies revolving around wetlands.
4.8. Recreation and Wetlands In today’s modern living, many communities use wetlands for recreation, as potential areas for local and international tourism, for comfort and relaxation, for angling, for water sports, and as hotel, bar and restaurant sites. (eg almost all livestock and wildlife, get food and water from wetlands, and therefore the USD 1.3 million recreational, “ nyama choma” industry, and the USD 1.3 billion tourism industry is based on wetland services. The degradation of wetlands can therefore lead to disastrous impacts on our livelihoods and the nation’s economic growth.
“No wetlands, no power, no industry, no food, no wildlife, no tourism, no economy, no poverty reduction!”

43
4.9. Other Uses Salt is also obtained from wetlands in the coastal areas, in what are called salt works, where they use salt evaporation pans to get rid of water, to collect salt crystals. Wetlands are also source of wild fruits and natural foods, and are a source of water and pollen for bee keeping. Natural products harvested from wetlands include: Edible insects (eg termites), birds, rodents and mammals (i.e. Bushmeat) or their skins, oils, bones and teeth products. The wildlife products trade is an unknown entity due to its clandestine nature, but TRAFFIC (2000) estimated at that time this was a USD 50 million/year industry, benefiting upto 66% of rural communities. Wetlands are also important for survival and provide traditional food sources as a coping strategy in times of emergency, like droughts or floods.
Work Box 4: Review Questions:
1. Mention 4 life support functions of a wetland…?
2. What % of power is generated by wetlands…? 3. What % of vegetables are grown in wetlands…?
4. How much money does tourism bring to Tanzania each year…? 5. What social benefits do we get from wetlands…?
Group Work:
1. On your area map of wetlands, beside each wetland, write down what life support services it gives…? 2. List the main crops grown in each wetland…?
3. List the main type of livestock grazing in each wetland…? 4. Show where vegetables are grown near wetlands…?
5. Show if fish are derived from each wetland…? 6. Show what building materials you get from wetlands…?

44
CHAPTER FIVE
THREATS TO WETLANDS IN TANZANIA This section looks at the major threats, pressures and consequences on wetlands from use by man and the pressures from the environment.
a. Global Threats to Wetlands.
b. Threats to Wetlands in Tanzania, an Overview. c. Industrial, livelihood and perception threats.
d. Industrial: HEP, large scale irrigation, plantations, climate change, pollution (mining, solid and liquid), water over-abstraction, e. Livelihood: Small scale irrigation (eg vegetables), agricultural encroachment, over-hunting, over-fishing, deforstation (mangroves),
catchment damage (run-off), wild fires, pollution (domestic), over use NTP (eg. Coral lime making, fibers for mats, building materials, etc).
f. Perception: Wetlands as wastelands, human health threats, animal health threats,
5.1. Global Wetland Degradation Threats as applies to wetlands refers to: human action in wetlands and their catchments which degrades the wetland ecosystem and its services, such as over-use of resources, pollution, encroachment, climate change, etc. A recent assessment for WWD 2010, carried out by the Ramsar Secretariat in a study of global pressures on wetlands came up with the following as consequences of global deterioration in wetlands management:
Fact Box 45: Global Degradation to Biodiversity due to Poor Management of Wetlands (Ramsar WWD 2010)
a. Of the 826 global waterbird species, 17% are considered threatened.
b. Of the 1,138 waterbird populations whose trends are known, 41% are in decline. c. Waterbirds are more threatened than all birds and their status has deteriorated faster in the last 20 years.
d. 38% of the fresh water-dependent mammal species are globally threatened (eg. manatees and river dolphins). e. 21% of wetland mammals are more threatened, than terrestrial mammals and waterbirds.
f. 33% of the world’s fresh water fish species are threatened. g. 26% of the world’s fresh water amphibian species are considered threatened
h. 42% of all amphibian species are declining in population. i. 72% of the 90 species of fresh water turtles are globally threatened.
j. 6 of the 7 species of marine turtles are listed as threatened. k. 43% of crocodilians are threatened.
l. 27% of coral-building species are considered threatened. Global bio-diversity is thus under threat from poor management and unsustainable exploitation of wetlands, and more recently, by global warming.
List of Wetland's Animals Threatened in Tanzania?
a. Kihansi spray toad, Kihansi Gorge. b. Puku in Kilombero Valley.
c. Shoebill and wattled crane in Malagarasi wetland. d. Lesser Flamingo in Lake Natron.
e. Dudong in Kilwa.

45
5.2. Threats to Wetlands in Tanzania Since 1960’s the population of Tanzania has increased 5 fold (Wildlife Policy, 2007). This high population growth has caused a change in land use priorities. Over population has lead to an ever increasing demand for wetland services such as a need for more food, water, energy, income, industry and livelihoods. This has progressively caused many problems like encroachment damaging 50% of wetlands, while poor sanitation and waste dumping has polluted an estimated 90% of wetlands (WD 2008, Wetlands Research Agenda). This degradation of wetlands ecosystems services and their regenerative capacity through unsustainable use and economic development, have led to serious environmental consequences.
With our current population estimate of 44 million, expected to double in the next 25-30 years (MKUKUTA, 2010), unless we act now, we are likely to see increased demands and a possible collapse in wetlands and their livelihood services in the near future resulting in a threat to both the survival of mankind, plants and animals (wild and domesticated).
Fact Box 46: Human Actions that Destroy Wetlands in Tanzania:
a. Pollution: By dumping of domestic, urban, mining and industrial wastes, sewage, solids and the like.
b. Drainage: Re-claiming for agriculture, to build roads, houses and cities or mosquito control. c. Encroachment: Clearing wetlands to establish plots for agricultural activities (like sugar cane or rice cultivation, fish keeping, bio-
fuels and vegetable growing). d. Unsustainable Mining: For salt, sand, coral lime, fossil coral limestone, soda ash, or gold and metal panning.
e. Damming: For reservoirs for domestic water, livestock watering dams (eg charco dam), mining, irrigation and/or hydro-electric power (HEP).
f. Burning wetlands: To remove wild animals, or during poaching to drive animals, to kill insect pests or to clear for improved grazing. g. Overgrazing: By pastoralism damaging the water carrying capacity and vegetation cover, leading to erosion, compacting the ground
releasing greenhouse gasses and accelerated run-off. h. Over-fishing: By use of under sized fishing net, removal of juvenile fish, use of dynamite or explosives or poisons, or fishing during
breeding seasons and in fish breeding and nursery grounds, netting or trapping at river mouths affecting fish breeding migrations, seine or drag netting damaging habitats like aquatic plants or corals, damaging or reducing recruitment rates.
i. Over-hunting of wildlife: (including birds), often illegal, for subsistence meat (ie Bushmeat) or to trade in products like Bushmeat, ivory, skins, teeth, medicines, etc.
j. Over harvesting of timber products: Over cutting of mangrove (and wetland trees = palms or acacia) for poles (fuelwood and charcoal), damage to bamboo and palms for wine making or cutting for furniture and roof materials, cutting Borassus palms for
canoes. k. Over-harvesting of non-timber products: Clays for bricks, pots and cutting palm leaf or aquatic reeds for making mats, string, palm
thatch for house building, overharvesting live corals for lime burning. l. Over-use of water: Diversion or in-efficient use of water for irrigation, mining, industry, livestock or domestic and urban needs.
m. Global Climate Change: Is affecting weather patterns leading to flooding or drought, and increased evaporation all of which wetlands are the most vulnerable to this impact.
n. Catchment Deforestation: Is changing river flows, leading to excessive run-off, flooding, erosion and siltation of wetlands. Unsustainable utilization of resources (wetland) is being brought about by the following activities.
5.2.1. Unsustainable Agriculture. Unsustainable agriculture practices like expansion of farmland, inefficient technologies, over-use of water for irrigation, cultivating in marginal areas, like slopes and excessive use of chemicals, are all affecting wetlands.
Our growing population is demanding for more and more food. That means more and more people are carrying out agriculture activities, and are expanding into more fragile ecosystems, encroaching deeper and deeper into wetlands. Examples include valley bottom cultivation (vinyungu), bunding or polders or damming in semi-annual river beds (Tabora), in areas that are seasonally flooded (Usangu and Kilombero rice) and by abstraction from rivers and lakes for irrigation (e.g. Usangu rice). All these activities are leading to more encroachment on wetlands and an estimated 50% reduction in wetlands areas. This is pushing wetland services to a limit, harming wetland areas, changing wetland functions, leading to loss in natural storage capacity, over-extraction of water,

46
diminishing seasonal and downstream water flows, causing early drying of river flows and wetlands, threatening plant and animal life, as well as humans and livestock. Cultivation in areas of steep slopes and along river banks and the edges of flooded areas, coupled with catchment damage (from fire and deforestation), is leading to increased run-off rates, resulting in downstream flooding that contributes to soil erosion and siltation. This, further damages the wetlands capacity and has consequences for downstream communities. When farmers use non-bio-degradable pesticides (such as DDT), herbicides and some fertilizers in their farms, the chemicals can persist in the soils, washed down, enter the rivers and wetlands, by run-off. These chemicals can either, directly and adversely affect people, livestock, plants and animals, especially fish in the rivers and wetlands. Or, indirectly, some fish and animals, even humans, will end up having large amounts of these poisons accumulating in their bodies from eating the contaminated plants, fish and other animals. Or by drinking the water, they will be poisoned by these chemicals (eg spills from mine or industrial slug dams can poison rivers).
a. Trends in Irrigation In Wetlands. The irrigated area in Usangu wetlands is dynamic and varies from year to year depending on the availability of water in the rivers for diversion (Fact Box 47). In a very wet year the area under irrigation in the wet season can go up to 42000 ha whereas in a dry year the area under irrigation remains in the range of 17000-24000 ha. The maximum potential irrigable area is estimated to 55000 ha. The figure below depicts the increase in population and irrigated area in the Usangu wetlands.
Fact Box 47: Trends in Population and Irrigation Development: Usangu.
b. SWOT Analysis of Irrigation in Wetlands. 95 % irrigation depends on wetlands for wet and dry season water??
Fact Box 48: Wetland problems or threats associated with (traditional) irrigation.
a. Soil erosion.
b. Downstream impact of reduced water. c. Poor infrastructure leading to leakages.
d. Water contamination/pollution. e. Water and land rights conflicts.
f. Over-use of water. g. Poor water (use efficiency)/management.
h. Loss/displacement of biodiversity. i. Conflict over water use.
j. Valley bottom cultivation issues. k. Spread diseases/alien plants. l. Encroachment by agriculture.
m. Fish ponds lead to excessive water loss.
47
5.2.2. Over-stocking Livestock. Unsustainable livestock practices like exceeding the carrying capacity, encroachment into fragile areas, spreading of diseases and trampling are all leading to wetland degradation. Traditional pastoralism has an inbuilt cultural tradition of rangeland management practice. However, this traditional knowledge and practice can no longer sustain the high herd numbers which have increased to near or beyond carrying capacity. To avoid overstocking, pastoralist are now forced to migrate into non-traditional areas, generally into wetlands, where they experience conflict with local land users. Further, as we convert more and more land to agriculture, so is there an increase in competition for land. This results in conflicts between farmers and pastoralists. There are today more animals than the 20 million Total Livestock Units (TLU) natural carrying capacity of the traditional pastoralist areas (WD, 2010, Livestock Guide to Wetlands). This size of herd cannot be sustained by natural, biological production alone. Pastoralist therefore have had to migrate from overgrazed areas to find new pasture. Moving from wetland to wetland, crossing settled areas, entering areas not traditionally occupied by pastoralists, encroaching on wildlife migratory routes (e.g. Usangu, Kilombero, etc), means that pastoralists are experiencing conflict, and this needs to be resolved. In addition, when livestock go to drink and feed on pasture in wetlands, they cause environmental damage. For example cattle produce greenhouse gases, like methane (CH4), which adds to global warming. Also due to their migration, their waste products spread diseases like rift valley fever, foot and mouth, anthrax, etc. In the wet, migration away from wetlands, livestock in the catchment, or woodlands adjacent to wetlands, can lead to overgrazing in these area. This damages the surrounding ecosystem, removing water retention capabilities of the soils, leading to further increase in run-off rates, causing soil erosion, leading to flooding and siltation in wetlands. Overgrazing the grass in wetlands, leads also to loss of sponge qualities, and reduces perennial flows. Trampling damages the wetland, compacts the mud, and compacts soils, reducing water retention and percolation. The grazing down of wetland vegetation by cattle reduces its buffer capacity to both stop floods and to reduce seasonal flows. Further, livestock trampling dry wetland surfaces cause the dry mud to powder and therefore be susceptible to erosion and wash away in the first floods, adding to siltation downstream. Burning of wetlands by pastoralists at the end of the dry season to entice a fresh flush of grass, further harms the grasses, reducing productivity and surface cover and kills slow moving animals (like snakes, frogs, turtle) and micro-organisms. This is posing threats on wetlands and the Vice Presidents Office (2006) through a strategy for Urgent Action on Land and Catchment Management had to ban livestock keeping in some wetlands (like the Usangu Basin).
Key questions to make livestock a WFI
a. What is the carrying capacity of the wetland (including time period/seasonality)? b. Which plant/animal species are most threatened?
c. How best can livestock movement data be collected and who can collect it and is there capacity to monitor? d. Are there existing stock routes and designated entry/exit points for livestock?
e. What arrangements can be made to make available supplementary feed during times of shortage of pasture? f. To what extent are the local communities sensitized/educated on sustainable use of the wetland?
g. Is there an existing by-law (district/village-levels) that can be applied to limit livestock movement? h. Which specific office will be the focal point for livestock grazing activities in the wetland?
5.2.3. Unsustainable Fishing Unsustainable practices, over-extraction, harvesting in breeding and nursery grounds and during critical seasons are all harming the productivity of wetland fisheries.
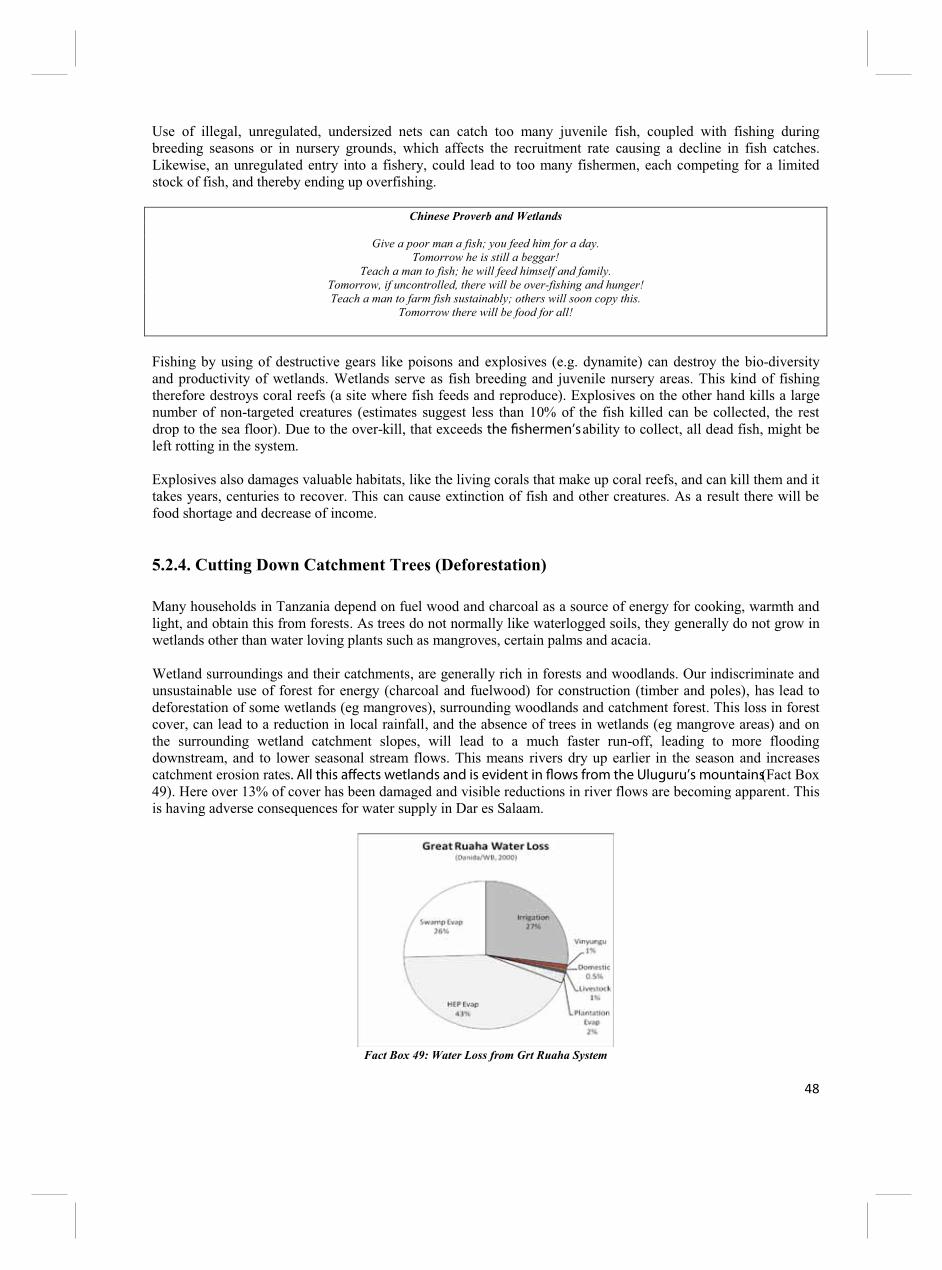
48
Use of illegal, unregulated, undersized nets can catch too many juvenile fish, coupled with fishing during breeding seasons or in nursery grounds, which affects the recruitment rate causing a decline in fish catches. Likewise, an unregulated entry into a fishery, could lead to too many fishermen, each competing for a limited stock of fish, and thereby ending up overfishing.
Chinese Proverb and Wetlands
Give a poor man a fish; you feed him for a day. Tomorrow he is still a beggar!
Teach a man to fish; he will feed himself and family. Tomorrow, if uncontrolled, there will be over-fishing and hunger! Teach a man to farm fish sustainably; others will soon copy this.
Tomorrow there will be food for all!
Fishing by using of destructive gears like poisons and explosives (e.g. dynamite) can destroy the bio-diversity and productivity of wetlands. Wetlands serve as fish breeding and juvenile nursery areas. This kind of fishing therefore destroys coral reefs (a site where fish feeds and reproduce). Explosives on the other hand kills a large number of non-targeted creatures (estimates suggest less than 10% of the fish killed can be collected, the rest drop to the sea floor). Due to the over-kill, that exceeds the fishermen’s ability to collect, all dead fish, might be left rotting in the system. Explosives also damages valuable habitats, like the living corals that make up coral reefs, and can kill them and it takes years, centuries to recover. This can cause extinction of fish and other creatures. As a result there will be food shortage and decrease of income.
5.2.4. Cutting Down Catchment Trees (Deforestation) Many households in Tanzania depend on fuel wood and charcoal as a source of energy for cooking, warmth and light, and obtain this from forests. As trees do not normally like waterlogged soils, they generally do not grow in wetlands other than water loving plants such as mangroves, certain palms and acacia. Wetland surroundings and their catchments, are generally rich in forests and woodlands. Our indiscriminate and unsustainable use of forest for energy (charcoal and fuelwood) for construction (timber and poles), has lead to deforestation of some wetlands (eg mangroves), surrounding woodlands and catchment forest. This loss in forest cover, can lead to a reduction in local rainfall, and the absence of trees in wetlands (eg mangrove areas) and on the surrounding wetland catchment slopes, will lead to a much faster run-off, leading to more flooding downstream, and to lower seasonal stream flows. This means rivers dry up earlier in the season and increases catchment erosion rates. All this affects wetlands and is evident in flows from the Uluguru’s mountains (Fact Box 49). Here over 13% of cover has been damaged and visible reductions in river flows are becoming apparent. This is having adverse consequences for water supply in Dar es Salaam.
Fact Box 49: Water Loss from Grt Ruaha System

49
Forest destruction due to uncontrolled bush fires, is leading to deforestation of the wetland catchments. This damages the properties of the river basin, and can lead to lower rainfall on the hills, faster run-off rates, which brings flooding and soil erosion. Excessive flooding and siltation of wetlands leads to large amount of silt and wastes enter the wetlands silting them up, and damaging their functions and water storage capacity (e.g. Lake Jipe, Nyumba ya Mungu Dam). In some of the tree wetlands, for example in the mangroves, unregulated and over cutting down of these trees does not only cause erosion but also destroy root system of the mangroves where many sea creatures make their habitats, and which are valuable nursery and feeding grounds for fish and crustaceans. Once the mangroves are gone or die, it also exposes the area to aggressive erosion from waves, leading to a loss in beaches and reduces buffering against tsunamis and climate change.
5.2.5 Improper Disposal of Solid and Liquid Wastes in Wetlands Wetlands are often mistaken as wastelands! Many people consider wetlands as dumping grounds or sources of animal and human health problems (See Fact Boxes 50 and 51). Ramsar WWD 2010 estimated that mankind produces excessive wastes and in Western cultures like the USA, 9-10 ha/capita are the estimated area needed for biologically productive land, wetlands and sea required to provide the resources we use and to absorb our waste. In Tanzania, this figure is about 1.5 ha/capita, below the global average of 2.1 ha/capita, however, Tanzanian scientist believes that 95% of Tanzanian waters are polluted or contaminated in some way by human wastes (SWM Research Agenda, 2008), notably:
Fact Box 50: Pollution in Nyumba Ya Mungu Dam
Liquid Wastes/Sewage: Many sewage and liquid waste disposal systems from human settlements, industries and mines have been directed towards wetlands and dumped in areas such as swamps, rivers, lakes and oceans. Chemicals in this water can endanger the lives of the living things in the wetlands and those who make use of the water from the wetlands. Over enrichment from organic loading can increase biomass productivity in wetlands, but, too much will place an excessive load on the natural decomposing functions, polluting wetlands. As soon as the wetlands capacity to process organic loads is exceeded, wetlands build up in wastes, and the decomposing materials consume the oxygen, leading to de-oxygenation, or produce hydrogen sulphide which are toxic and can kill fish and other aquatic organisms. Moreover, waste water, especially raw sewage can lead to contamination of wetlands with pathogenic bacteria, viruses and parasites that cause human intestinal diseases like cholera, dysentery, typhoid, diarrhea, and lead to water borne parasites like bilharzias, intestinal worms, etc.

50
Fact Box 51: Diseases Associated with Wetlands
Solid Wastes: Many urban and rural wetlands have been used as waste dumps, mostly for garbage and industrial waste. These solid wastes are generally non-biodegradable (i.e. plastics), and therefore have been accumulating in the wetlands, leading to environmental pollution in those areas, as well as encroachment on wetland flows, leading to flooding.
5.2.6. Urban, Dams and Road Construction: Development of infrastructure can impact wetlands. City construction of offices, industry, roads, tarmac parking and paving, and housing, airports, harbours, etc can lead to land reclaim of wetlands for structures. This can restrict flows, leads to flooding. Likewise, road construction between cities can be restrictive on water run-off, unless well planned bridges. All these man-made structures can divert natural flows, or increase run-off and deliver excessive water and associated contaminants, adversely affecting wetlands. Human excavations, borrow pits can fill up, become wetlands, spread water borne diseases and malaria. Human toilets can seep wastes and disease into underground water or leak into rivers when flooded. Dam construction can flood back and damage wetlands, reducing the sponge effects and retarding seasonal water storage and flows. Dams can limit downstream flash floods, but also restrict flows. This can lead to early seasonal dry out of flood plains that depend on seasonal floods for recharge. This in turn will affect biological process, in particular the function of these floodplains as fish breeding and nursery grounds as well as provisioning of water and grazing area for livestock and wildlife during dry season. Most construction projects and dams therefore need to undergo Environmental Impact Assessment (EIA) before development. This helps us to assess the likely impacts and damage before construction so that mitigating measures can be put into place during site selection which is mainly being done before construction.
5.3. Climate Change and Wetland Damage in Tanzania. Climate is about the water cycle. Increased temperatures will cause coral bleaching, glacier melt, sea rise and greater loss due to evaporation. Change in rainfall will increase drought risk, reduce flows, increase flood damage. As wetlands are all about water, of all ecosystems, they will be the greatest impacted. Climate change is a result of global carbon emissions from fossil fuels and other human activities giving rise to greenhouse gas emissions (like CO2 and methane). These gases reflect heat in the atmosphere and prevent the

51
sun’s heat from escaping (known as the “greenhouse effect”). Gradually, in time this heat retention is leading to global warming, currently estimated in the next 30-40 years to be 2-3oC higher than normal.
Fact Box 52: Temperature Increase in Kilimanjaro
One of the key adverse effects of climate change will become evident on “water security”. In the next 30-40 years, this will manifest itself in changes in weather pattern, evident in more severe droughts and floods (Fact Box 52), rising sea levels, higher evaporation rates all leading to dramatic changes to wetland ecosystems. Given that wetlands are the all-year round water storage reservoirs for man, plant, livestock and wildlife, they will need special management attention. Tanzania’s economic base is dependent on the use of natural resources, rain-fed agriculture and biomass for household energy. The economy is highly vulnerable to the adverse impacts of climate change and to extreme weather events. The impacts are already evident. Due to increasing temperatures, the adverse impacts of climate change are now felt in all sectors of the economy and are threatening human life, economic and social activities.
Fact Box 53: Climate Change in Tanzania (NAPA, 2007)
� Climate change is all about water, wetlands are natures water store and therefore will be most affected.
� 21 meteorological stations show a steady increase in temperature for the past 30 years. � Severe, recurrent droughts have triggered the recent devastating power crisis.
� Drop of water levels of Lake Victoria, Lake Tanganyika and Lake Jipe. � The dramatic recession of 7km of Lake Rukwa in about 50 years.
� 33% of the coral reef is permanently damaged by dynamiting or coral bleaching. � 80% of the glacier wetlands of Mount Kilimanjaro lost since 1912, and will be gone by 2025.
� Intrusion of sea water into water wells is affecting Bagamoyo town. � Inundation means Maziwe Island in Pangani District, will go under water.
� 2005 GDP grew only by 6.8%, attributed to severe drought triggering food shortage and power crisis. � The agricultural sector only grew by only 5.2%, attributed to the prolonged drought in 2005/2006.
� Malaria (a climate-related disease) prevalence has increased in areas where it was not common (e.g. Kagera region, Lake Victoria, Lushoto and Amani.
Tanzania has prepared a national Action Plan of Action (NAPA) against Climate Change. In the next 20-30 years, Tanzania anticipates climate change to have an impact as follows (on wetlands) (WU/WD COP 15 Paper on Wetlands, 2009):

52
Fact Box 54: Declining Flows in Ruaha NP
Drought: Global temperature rise will lower rainfall patterns, increase evaporation rates (5-15%) and the inner, dry land areas of Tanzania, already marginal for man and livestock (e.g. Tabora, Shinyanga, Natron, etc) will experience even dryer conditions, witnessing a mass migration or die-off of livestock (As is already evident around Natron). Temperature: Rise in sea temperature by 2-3 oC will mostly likely lead to further coral reef bleaching, and die off adversely affecting the inshore marine fishery and tourism. High water temperature is also associated with high algal and pathogenic blooms (e.g. cyanobacteria in Lake Natron), intensifying effects of pollutants, pesticides, salts, etc. Sea Level Rise: Coastal wetlands, mangroves, salt pans and low lying islands will be negatively impacted by sea level rise estimated at 3-4 m, drowning out some islands, low lying dwellings, giving rise to damage to sea walls, hotels, harbours, bridges, beach erosion, tidal surges, and the like. Given 50% of people live along the coast, this will be significant. Rainfall: Projections 30-40 years from now, in some tropical areas, 10-40% increases in rainfall while in drier regions, 10-30% less rainfall. Conditions will be exacerbated (will get worse, going to extremes). Changes will occur in time and volume of rainfall, run-off rates and the like giving rise to storms, flooding, rivers bursting banks, mud slides, wash away, over-topping, changes in coastal salinity, sediments and mangrove quality, affecting marine fish and invertebrate breeding and nursery areas. Invasive Plants: Alien plants such as salvinia and water hyacinth are likely to flourish and spread in wetlands. Glaciers: Snow covers, a form of wetland, are predicted to decline, reducing season flows in dependent rivers, declining water availability in areas supplied by melt water, like Mt Kilimanjaro and Pangani River system, a major food and HEP producing area.
Work Box 5: Review Questions:
1. What % of waterbirds in the world are threatened…?
2. What % of fish in the world are threatened…? 3. List 5 key causes of threats to wetlands in Tanzania…?
4. What is climate change caused by…? 5. Why has 80% of Mount Kilimanjaro ice melted away…?
6. List 3 things that will be affected by climate change in Tanzania…?
Group Work:

53
1. On your area map of wetlands, beside each wetland, write down human and animal threats to the wetlands…?
2. List the main threats to wetlands in your area…? 3. For each threat, list the main reasons for the threat
4. Is climate change evident in your area, if so how has it manifested itself, what damage do you see…? 5. Interview your elders, talk about climate change and list what damage they have seen in their time…?

54
CHAPTER SIX
WETLANDS AND POLICY IN TANZANIA
This section looks at history of wetlands, policy and the law and how they relate to wetlands management.
a. NAWESCO institutional arrangement (include the diagram but refer to AFM for roles of various levels Wetlands Institutions (Management/Res/TOT) Roles of NWWG/WU/PMO-RALG, Roles/TORs, etc.
b. Wetlands and Local Government. c. Trans-boundary Protocols.
d. Vision 2025 (MDG 7 = water and environment and IBA as critical sites, fish, etc). e. Arusha manifesto.
f. MKUKUTA/Poverty Strategy. g. MNRT Strategic Plan 2011-13. h. National Biodiversity Strategy.
i. National Wetlands Strategy (draft). j. Policy, Laws and Wetlands.
� Wildlife Policy and Laws. � Water Policy and Laws.
� Land Policy and Act (4) and Village Land Act (5). � Environmental Policy and EMA.
� Local Government Policy/Act/D*D. � Livestock Policy/Acts/Regulations.
� Agriculture/Irrigation Policy/Acts/ Regulations. � Fisheries Policy/Acts/ Regulations.
� Wetlands WMA Strategy (i.e. Wetlands Reserves) � Tourism Policy/Act/NC Regulations.
� Forest Policy/Acts/Regulations (ie Mangroves). � Investment Policy. � Mining Policy/Act.
� Marine Parks and Reserves Policy/Act. � Education. � Gender.
� Sewage and waste. � Natural Disasters.
� Climate Change (NAPA). � Wetlands and Health (HIV/AIDS).
a. Wetlands Tax Based Economy. b. Wetlands and Protected Areas.
c. Wetlands Research Agenda. d. EIA and SEA of Wetlands.
e. List of National Wetlands Projects/Programs. f. Wetlands Management Planning.
� Wetlands Integrated Management Plans (Ramsar Sites). � Integrated Coastal Zone Management Planning (ICZM).
� Single Species Action Plans (AEWA). � Districts Wetlands 3 Year Management Plan (DDP).
� Wetlands Reserve Management Plan (ie. WMA and PA GMP). � Wetlands Management inclusion in Village LUP and VDP.
6.1. Holistic Management & Wetlands Wetlands management is not simple, it is a mix of sectors all intertwined (inter-linked). They all share in common a need for, “wise use of water”. Wetlands are not governed by any single policy or law, nor by any one sector nor ministry. They are cross-cutting in nature and require multi-sector, holistic and integrated water

55
resource management (IWRM). Harmonized co-management by all user groups is key. This means an inter-play between ecosystem: socio-economic status of users: technology availability: the institutions, policies and laws governing access and use rights.
Fact Box 55: Inter-related Factors Governing Wetlands Management Wetlands policy is embedded in the Wildlife Policy 2007, with the Ministry of Natural Resources and Tourism (MNRT) as the overall custodian. To achieve its developmental aspirations, the vision of MNRT is:
“Sustainably Managed and Utilized Natural and Cultural Resources and Responsible Tourism” To achieve this, new strategies and programs appeared in the MNRT Strategic Plan 2010-2013. These initiatives are aimed at:
“full integration of natural resource management under the national framework”. The national framework is: Vision 2025, MKUKUTA, Planning and Budget Guidelines under the Medium Term Expenditure Framework (MTEF) and Decentralization by Devolution (D*D). This Framework recognizes the important contribution of natural resources to national economic development, food and energy security and poverty reduction, and therefore equally applies to wetlands. The MNRT Strategic Plan (2010-13) notes that in the past, policies and programs in fisheries, forestry, wildlife, wetlands and tourism, have tended to be mono-sector oriented. The resultant challenges brought about by unclear roles and fragmented natural resource administration between central and local government, lead to conflicts between sectors. Recognizing that parallelism between local and central government leads to duplication of effort, and a wastage of resources, the MNRT Strategic Plan calls for greater harmony between sector policies, including vertical and horizontal integration to remove conflicts, and to improve participation through a common approach to Community Based Management of Natural Resources (CBNRM).
Partners/Alliance- Donors/Funding Agents
- Civil Society Organisations/NGOs- Private Sector- Globalisation
- Conventions/Protocols/CBD- Agenda 21/World Summit/NEPAD
National Resources- Grants/Tax based economy
- Advocacy- Human capital/Institutional memory
- Government/Civil Society/Private Sector inputs- Technology
SE System Techno System- Political/Civil rights - Education opportunity
- Social/Economic rights - Extension/Outreach services- Gender equality - Information sharing mechanisms
- Healthcare/Family Planning - Livelihood skills- Security & protection - IGA/ALS
- Policy/Legal framework - Capacity building institutes- Democracy/Governance Empowerment - Technology transfer
- Trade opportunities (Self sustaining) - Training materials/Aides- Social/Relief services
POVERTYAccess ManagementRights Knowledge(CBNRM) (Husbandry)
NR/Ecosystem- Land/Soil type
- Food (Crops, livestock, etc)- Wild produce (Fish, wildlife, plants, herbs, etc)
- Energy (Fuelwood, electricity, etc)- Minerals- Water
- Waste/Sanitation/Pollution- Natural disasters (Floods, drought)
- Climate
Legal tool box Technical tool box

56
6.2. Policy and Laws Governing Wetlands Wetlands are governed by several major Policies and Acts, namely Agriculture, Forestry, Wildlife, Water, Environment, Livestock, Irrigation, Fisheries, Local government, Land Use Commission. What is a Policy: Policy is a political statement, a guideline for strategic action. Policy provides high level guidelines of how stakeholders can be involved. It provides the following;- � Guide for development plans in different sectors like land, environment, wildlife, education, etc. � Elaborates the strategy, how to implement such plans. � Guides the needs for clear laws, rules and regulations which are required to guide decision making and
control use. What are Laws: Laws are a legal statement that show stakeholders, their responsibilities, obligations to mind the rules as laid down, limitations and punishment if actions go against the law, and are designed to regulate and control irresponsible or unsustainable behavior. � This establishes for institutions, those which have the right and authority of decision making and of resource
use. � Establishes sanction of rights and punishment given to any violation of the laws and rules. � Guide behavior and help the judiciary to enforce the implementation of the law.
6.2.1. Arusha Manifesto: The foundation of Tanzania’s natural resource policy was laid in 1961, when the Father of the Nation, the First President, the late Mwalimu Julius K. Nyerere, made a proclamation that:
“The survival of our wildlife is a matter of grave concern to all of us in Africa. These wild creatures amid the wild places they inhabit are not only important as a source of wonder and inspiration, but are an integral part of
our natural resources and of our future livelihood and well being” . Based on this policy setting, protected areas have since increased dramatically, by 83%.
6.2.2. Wetlands in the Wildlife Policy (2007): Know as the Arusha Manifesto, the above policy continues to guide conservation in Tanzania and lead to the Wildlife Policy of Tanzania (WPT) which was first formulated in March 1998 and revised in March 2007, the new policy aim is:
“To conserve, manage and develop wildlife and wetlands resources and sustainable utilization that will contribute to poverty reduction”.
Respecting that 70% of livelihoods depend on natural resources, and acknowledging that human population growth, survival and poverty needs are leading to competition with wildlife, the Policy includes, amongst other things: a. Equal attention to the conservation of wetlands as wildlife. b. A shift in emphasis from conservation through protectionism, to include joint, participatory management and
wise use of natural resources, by user groups. The intention is to involve a broad section of stakeholders, and by devolving responsibility for management to the lowest appropriate level, to user groups, the aim is to empower community engagement in conservation through

57
decentralized, local government structures. This is in line with government policy to instill Community Based Natural Resource Management (CBNRM) through Decentralization by Devolution, (= DeNRM). Some of the strategies adopted by the policy that have significance for wetlands management include: a. Wildlife Management Areas (WMA): Creating a new kind of protected area, jointly managed by state with
communities, by establishing Wildlife Management Areas (WMAs) on village land. This adds value to key wildlife corridors (e.g. 31 identified by TAWIRI, 2009) and is aimed at alleviating wildlife-human conflict.
b. Tourism: Promoting the legal use of wildlife and wetlands, especially coastal, and its products (i.e. sea food, trophy hunting), through consumptive and non-consumptive use, encouraging tourism, that brings equitable sharing of revenue to the rural communities around PAs and in WMAs and concessions. Consequently, tourism has grown significantly, is now the highest contributor to the GDP.
c. Game Ranching: Permitting game farming, ranching, zoos and sanctuaries allow for private sector to engage in wildlife conservation, including wetlands management.
d. Wetlands Reserves: Allows government and communities to set aside core wetland areas as under state protection to ensure perpetuity of resource management.
e. Ramsar Sites: Wetlands are under semi-protection, according to the Global Convention.
6.2.3. Wetlands and the Poverty Reduction Strategy (MKUKUTA II): Recognizing the plight of wildlife and the need to allow use rights to wildlife and wetlands to alleviate poverty, the 2007 Wildlife Policy has influenced MKUKUTA II (2010) to adopted strategies that integrated rural development with wildlife and wetland conservation. This acknowledges the intrinsic value of wildlife and wetlands to poverty alleviation in rural communities. MKUKUTA II (2010) is focused on livelihood security needs, and guidelines on sustainable use from wetlands, are under preparations.
6.2.4. Wetlands and the Forest Policy (2009): The Forest Policy emphasizes on the need for wetland conservation through critical watershed management. It re-iterates that the most important watershed areas will be identified and new catchment forest reserves established in areas of high watershed value. Management objectives will be defined according to management plans, with specific provisions for the protection of water sources such as rivers, streams, wells and wetlands. Local community and other stakeholder involvement will be encouraged in the establishment and management of buffer zones as well as in the overall catchment forest protection through joint management agreements as in PFM. To achieve this, research and information dissemination will be strengthened in order to improve watershed management and soil conservation.
6.2.5. Wetlands and the Agriculture Policy (1997): The Agriculture Policy, emphasized on promotion of integrated, sustainable use and management of natural resources such as land, soil, water and vegetation. Recognized is the importance of environmental issues in agriculture development and taken into account are the linkages with sustainable natural resources use, in the production of commercial goods (e.g. fuel wood for tobacco). The Policy requires that it is crucial for the long-term future of the country that Tanzania’s natural resources (soil, water, forests, wildlife) be managed so that agricultural production is sustainable and that negative externalities are kept to a minimum. The new Irrigation Policy (2010), main focus is on large scale irrigation, and acknowledges the Water Policy (2002) notation that 80% of irrigation is by traditional methods. Guidelines for sustainable traditional irrigation in wetlands are under preparations.

58
Livestock Policy (2009) does not mention much about sustainable pastoralism in wetlands, but guidelines for sustainable pastoralism are under preparation.
6.2.6. Wetlands and the Water Policy (2002): The Water Policy (2002) aims at sustainable water use and conservation through the following: a. Water quality monitoring to identify extent and status of the quality of water resources for early detection. b. The “polluter pays” principle shall apply based on set standards for in-stream flows, industrial effluents and other waste
discharges to meet environmental objectives. c. Factories, municipal authorities, large irrigation schemes and mining operations will be required to collect and keep
accurate records of the quality of effluents they discharge into receiving water bodies. d. Creation of public awareness in protection water resources from pollution including inappropriate use of agrochemicals
Further, the Policy aims to have in place water management systems which both protect the environment, ecological system and biodiversity, through provision of scientific information on the requirements to maintain the health and viability of riverine and estuary ecosystems, and associated flora and fauna. The Policy is more focused on water supply and sanitation, and provides little in the way of guidelines for sustainable wetlands management.
6.2.7. Wetlands and Environment Policy (1997) The overall Environment Policy objectives are to ensure sustainability, security and equitable use of resources for meeting the basic needs of the present and future generations without degrading the environment or risking health or safety. And, to prevent and control degradation of land, water, vegetation, and air which constitute our life support systems.
6.2.8. Wetlands and Environment Management Act(EMA) 2004 The Environment Management Act, Section 47, specifically singles out wetlands, by empowering the Minister to: a. Declare any area which is ecologically fragile or sensitive to be an Environmental Protected Area. b. Take into account the natural features and beauty of the area, flora and fauna, unique or special geographical,
physiographical, ecological or historic and cultural features, or any special scientific feature or biological diversity.
c. Consider the interests of the local communities. d. Comply with any international obligation under any agreement to which Tanzania is a member (eg Ramsar). Under Section 51 any area can be declared be environmentally sensitive area and protected, and under Section 52, this includes swamps and wetlands. Section 54 allows, in consultation with Sector Ministry, this to be extended to a river, river bank, lake or lakeshore as a protected area and impose any restrictions as he considers necessary for its protection from environmental degradation. Under Section 55, in consultation with responsible minister, Council and LGA, guidelines are under preparation to prescribe measures for the protection of riverbank, rivers, lakes and lakeshores, and lay down the laws and offence or permit system. As applies to ocean or natural lake shorelines, riverbank or water reservoir or wetland, this Act restricts: a. The erection, construction, placing, altering, extending, removing or demolishing a structure in or under.

59
b. The excavation, drilling, tunneling or disturbing. c. The introduction of plant any part of a plant, plant specimen whether alien or indigenous, dead or alive. d. The depositing of a substance likely to have adverse environmental effects. e. Re-direction or blocking from its natural course or drainage thereof. Under Section 56 after consultation with the Minister responsible for land, declare any area to be a protected wetland, and placed under the jurisdiction of the Sector Minister (in this case MNRT) to make regulations and guidelines, and makes mandatory the regular provision of information on the management and status of wetlands (ie SOER). Under Section 57 no human activities of a of permanent nature or which are likely to compromise activities in or adversely affect conservation shall be conducted within 60 metres of the ocean or wetlands, lake shorelines, river bank, water dam or reservoir.
6.2.9. Wetlands and Fishery Policy (2007): The Fisheries Policy (2007) and Fisheries Regulations (2009) is more focused on commercial (FW/SW) fishery development, and caters for CBNRM through Beach management Units (BMU) which provides a means for users to apply for fishing rights in wetlands. Guidelines for sustainable fisheries are under consideration. Currently there is an active drive for aquaculture development, which will have a potential impact on wetlands. Fish ponds tend to lose water from evaporation (= 1.5m/year), to seepage (= 1 m/year) and thus represent a net loss in water from a basin or wetland system. This needs careful management.
6.2.10. Wetlands and Tourism Policy (1999): The focus is more on the economics of coastal & wildlife tourism. Guidelines on integrated coastal management for sustainable eco-tourism in wetlands have been prepared.
6.2.11: Wetlands, Energy and Minerals Policy: The Energy Policy (2003) focus is on HEP, Biofuels and petroleum products. There is little reference to wetlands, but all HEP schemes have respected the EIA process (eg a classic case is the Kihansi spray toads). Future guidelines may need to consider sustainable energy and wetlands, and in particular to safeguard against possible disasters like oil spills. The Minerals Policy (2009) looks to improve the economy through mineral exploration. There is a provision that strategic mining may take place in PA, and guidelines and standards under preparation, will take into account protection of wetlands.
6.2.12. Wetlands and the Health Policy (1990): Provides for sector cooperation on health matters, and states that Village Primary Health Care Committee will be responsible for solving health problems at the village level. These Committees provide a link between experts and villagers to ensure cooperation in issues related to development and good health, and need to be extended to include wise use of wetlands.

60
6.2.13. Local Government Policy (1990), Act (1982) and Village Land Act (1998): Under the Local Government Policy, the aim is for all sectors to devolve responsibility for sector management to the lowest appropriate authority, the local government both district and village level. The Local Government Authority Act 7 and 8 (1982), empowers Village Government to create functional committees for NRM like wildlife, wetlands, forests and fisheries. Formation of these institutions follows laid down sector legislation and the process is harmonized in 6 basic, but universal steps to achieve CBNRM. To synchronize planning, budgeting and reporting, district governments used laid down guidelines for Medium Term Expenditure Framework (MTEF) published as a MTEF Manual (2010). Under the MTEF, the districts are only allowed a few targets per sector, and in PFM and SWM, these have become aligned to 4 identical MTEF targets. Regulation 39, of Village Land Regulations, each Village Assembly once consulted and made aware of the opportunity for CBNRM, meet, debate and if agreeable, issue signed Meeting Minutes to officially registering their intent to join a union, to pool land, for a “designated communal area” (eg , WUG, WMA or BMU). To be recognized as a legal under the Village Land Act (Section 17), the user group must form a CBO, submit its Constitution and obtain a Registration Certificate from the Societies Ordinance. As per Village Land Act (Section 13), participating villages, in order to pool “communal village land” (= WMA), must put forward recommendation to the Village Assembly, in the form of a Village Land Use Plan (LUP). Further, under the Village Land Act (Section 11), all villages in a joint union to manage a common resource shared by more than one village, shall at some point enter into a “joint village land use agreement” for the designated area, based on a joint management plan, based in individual LUPs. Local Government Act, Section 163, allows, based on the Management Plan, the village prepare by laws which must be approved by District Council to become law. The Village Land Act (Section 17) allows villages who have thus set aside land, to now enter agreement with a body corporate to rent (Section 28) land from the Village Council for its operations (eg. eco-tourism), provided it fits the LUP (28.3.b.ii). All these stages spell out a harmonious 6 step approach by all sectors to achieve CBNRM which is one of the guiding principles of SWM.
Urgent Action Plan for Wetlands and Catchment Management (2006): Such is the importance of wetlands, that their management during a time of crisis, was included in the 2006 Prime Minister’s
Office “Urgent Action Plan for Wetlands and Catchment Management”. Whereas this still remains as
the operational tool, the Urgent Action called for longer term solutions to irrigation, pastoralism, etc, and the SWM Program is seen as the future approach.
6.3.14. International Protocols/Conventions
Some of the embracing and key international policies/legal instruments that Tanzania is signatory to and that affect wetland management are discussed below.
Sl No
Conventions, Treaties & Protocols Year Instated
Tanzania Status Comments
1 International Protection of Birds (1950) E Superseded by Ramsar. Calls for protecting birds and flyways.
2 Plant Protection (1951) R (11.1985)
Legal basis for protection of flora
3 Fishing and Conservation of Fishing and Living (1958) ? Sustainable use of shared stocks, including aquatic

61
Resources of High Seas animals. 4 UN High Seas Convention (1958/
82) R Legal order to peaceful, equitable uses of the seas
(waters), conservation of resources, and protection of the aquatic environment.
5 African Nature Conservation and Natural Resources
15.9.68 R (12.74)
Designed to protect African wildlife from over-exploitation by hunters. Aim was to promote CBNRM protocol where wildlife is important to livelihoods.
6 Wetlands of International Importance (Ramsar) 1971 R (2.99)
Conservation and wise use of wetlands of significance. Tanzania has 4 such sites.
7 Protection of World Cultural and National Heritage (UNESCO)
1972/5 R Collectively preserves cultural and natural history sites of universal value. Selous GR is a heritage site.
8 International Trade in Endangered Species of Flora & Fauna (CITES)
3.3.73 F (2.80)
International cooperation in control on trade in endangered wildlife. Regulates trade.
9 UN Convention on Law of the Sea 1975/ 82
F (1984)
Protocols for aquatic species (wildlife) management.
10 UN Conservation of Migratory Species of Wild Animals
1979 R Collective agreement between countries to protect those wildlife that migrate across boundaries. Prohibits taking of endangered species in the IUCN Red Book.
11 FAO International Undertaking on Plant Genetic Resources
11.83 S Ensures plant genetic resources of economic importance are preserved and well managed.
12 Ban on Import and Control T. Boundary Movement of Hazard Wastes within Africa (Bamako)
31.1.91 F (4.93)
Regulates generation of hazardous wastes, precautionary approach when disposing and to avoid dumping in Africa. Would apply to mineral prospecting & mining.
13 UN Conference on Environment & Development (Rio)(Agenda 21)
1992 S (1992)
Set the global pace for preparing NEAPs and revising Environment Policy. Now superseded by WSSD.
14 UN F/Work Convention on Climate Change (UNFCCC, Kyoto Protocol)
1992 R (8.02)
Global agreement to stabilize greenhouse gas emissions, without affecting food production and sustainable development.
15 UN Convention on Biological Diversity (CBD)(Rio)
22.5.92 R (3.96)
Protects bio-diversity of significance, its sustainable use and fair and equitable use.
16 ECE Convention on the Protection and use of T. Boundary Watercourses and International Lakes.
10.92 Na Although not signatory, proposes guidelines for integrated watershed management.
17 UN Convention to Combat Desertification (Paris) 17.6.94 R (4.97)
The convention mitigates against the effects of drought. Plans to mitigate adverse conditions.
18 Cooperative Enforcement Operations on Illegal Trade in Wild Flora and Fauna (Lusaka Agreement)
8.8.94 F (12.96)
In support of CITES, more specific to the region to enforce the rules for cross-border trade and smuggling.
19 UN Convention on Law of Use of International Watercourses
1997 ? Although not signatory, lays down principles for management of shared watercourses.
Africa-Eurasia Waterbirds Agreement (AEWA) 1999 (S)
To protect flyways.
20 CMS 1999 21 Conservation and Management Straddling Fish
Stocks (UN Law of the Sea) 11.12.01 ns Addendum to aquatic resource management.
6.4. SADC Protocols/Conventions
Some of the embracing and key regional policies/legal instruments that also influence wetland management are discussed below:
Conventions, Treaties & Protocols Tanz Status Comments
1 SADC Permanent Joint Commission 1984 S As member state abides by SADC treaties and policies. 2 Zambesi River Action Plan (ZACPLAN) 1987 S Acceded to a joint planning initiative to develop
regional cooperation on environmentally sound management of the basin.
3 SADC Joint Commission of Cooperation Treaty (JCC)
1992 S Legal institutional framework for cooperation amongst member states.
3 Songwe River Boundary Stabilization Agreement 1990 S Joint Permanent Commission to regulate annual floods. 4 (Marine) Fisheries Policy and Strategy 1994 E Collective resource management to raise production,
improve processing and marketing, protect resources. 5 Protocol on Shared Watercourse Systems in
SADC 1995 S Rules of utilization without prejudice to sovereign
rights, cooperation, information, equitable use, exotics,

62
pollution, etc.. 6 Revised Protocol on Shared Watercourse in
SADC S This amendment provides for agreements on specific
watercourses. 7 Regional Water Resources Management Centre
(Proposed) C Proposes a regional research, data collection and
dissemination to assist collective planning. 8 SADC Trade Protocol 1996 S This governs the rules of trade in the region and applies
also to cross-border trade.. 9 SADC Energy Protocol 1996 S Instills the rules and HEP protocols for sustainable
development. 10 SADC Protocol on Transport, Communications &
Meteorology 1996 S Governs aquatic transportation, marine environmental
damage, for spills, dumping of wastes, etc.. 11 SADC Water Protocol 2000 S Collective agreement on specific watercourses. Governs
water use. 12 SADC Protocol on Fisheries 2001 ? Collective principles for all fisheries management
(shared or unshared). 13 Wildlife Conservation and Law Enforcement 2002 S
(2002) Collective management & enforcement of cross-border trade in wildlife products.
14 Zambezi River Basin Water Commission (ZAMCOM)
Due 7.04
C Consolidated agreement on utilization/management of the Zambezi basin.
15 Lake Malawi Convention on Sustainable Development
(2003) C Proposed Joint Commission to manage Lake Malawi and its basin.
Key: E = Endorsed S = Signed
P = Participating F = Entered into force.
C = Considering
6.5. The Ramsar Convention and Tanzania We are all linked by water, and share the same global reservoir of water, and so the global survival of humanity, depends on a collective and global response to sustainable management of our planet’s wetlands. The International Conference on wetlands, held in 1971, in a town called Ramsar, in Iran, was a global discussion on the international awakening and realization of the importance of wetlands to our planet’s survival. We therefore all have a global, social responsibility to sustainably manage wetlands for the survival of all mankind, for today and tomorrow.
Ramsar’s Mission
“The conservation and wise use of all wetlands
through local, regional and national actions and international co-operation, as a contribution towards achieving sustainable development throughout the world”.
Wetlands harbor some of the world’s greatest bio-diversity and all mankind, wildlife, birds and fish are dependent on wetlands for habitat, food, water and breeding. We all share in common, the same global, migratory bird species whose flyways criss-cross the planet. Migratory birds in Africa are the same birds that also live in Europe. As such, it is a matter of international cooperation to see that these resources are preserved, through global action and local management of wise use. The convention agreed at this 1971 Conference, is now known as the ‘Ramsar Declaration on Wetlands with International Status’ . It has to-date been signed by over 193 countries, that have all agreed to manage their wetlands sustainably and wisely, setting aside key sites of international importance, as “Ramsar Sites” so as to offer them global protection.

63
Fact Box 56: What is the Ramsar Convention About?
a. The Ramsar Conference aims at defining the importance of wetlands to us all,.
b. It is an international tool for global interaction in responsible wetland management. c. It provides the tools for analysis for more sustainable, wise use.
d. It guides the establishment of wise use of wetlands for conservation and protection. e. It guides research activities.
f. It provides technical and financial support for Ramsar Sites. g. Once listed, a Ramsar site qualifies for global support from interested donors.
h. It provides CEPA support and materials for wetlands. i. It provides technical and advisory support for wetlands management.
Every country which signed this declaration has agreed to establish and protect key wetlands. Any wetland environment, if registered in the ‘list of wetlands with international status’, is afforded international recognition, protection and support. The Danish government for instance has since 2001 supported the establishment and Management of Tanzania’s 4 Ramsar Sites and was joined by Belgium Technical Cooperation (BTC) in 2006 to support Kilombero Valley Ramsar Site and in 2011, extended this to Mafia, Kilwa and Rufiji Ramsar Site. The latter has also been a traditional domain of support by WWF. Every 3 years, all parties get together at what is called a Conference of the Parties (COP). The last COP was in Korea in 2008, and the Ramsar Strategic Plan that all countries, including Tanzania are implementing, currently runs from 2009-13. At the 2008 COP, Tanzania was also elected to represent E. Africa on the 40th Ramsar Standing Committee, a position currently held by the VPO. Not all the countries in the world have signed the declaration and to-date there are 1900 areas globally, that have been listed in the register of ‘Wetlands with International Status.’
History of Achievements in the SWMP Since joining Ramsar: 1. 2000 signing of the Ramsar Convention. 2. 2000 the 32 500 km2 Malagarasi-Muyovozi Ramsar Site (MMRS) established to protect Sitatunga, shoe bill and wattle crane, and as
and example of papyrus/permanent swamps. 3. 2001 NAWESCO (National Wetlands Steering Committee) appointed as the national wetlands policy oversight body, is represented
by 9 sector ministries at PS level, Chaired by MNRT. 4. 2001 the 2 250 km2 Lake Natron RS (LNRS) established to protect75% of world’s Lesser Flamingo and as an example of a soda,
alkaline wetland. 5. 2002 the 7 950 km2 Kilombero Valley (KVRS) established to protect 75 % of world Puku and as an example of lowland, freshwater
flood plain. 6. 2002 the 5 970 km2 Rufiji-Mafia-Kilwa Marine RS established to protect the marine park coral reefs, dugongs, turtles, fish,
mangroves and sea grasses species as an example of a marine wetland. 7. 2002 NWWG (National Wetlands Working Group) established, chaired by the Director of Wildlife, made up of 35 technical agencies
and NGOs, to advise NAWESCO and to implement the SWMP. 8. 2003 Wetlands Unit in Wildlife Division created as the National Wetlands Secretariat. 9. 2003-6 NAWESCO first National Wetlands Strategic Action Plan (= inauguration of SWMP). 10. 2003-7 MNRT with support from Danida implements the MMRS project (including 2 districts). 11. 2004 STRP National Focal Point appointed to advise the Ramsar Scientific and Technical Review Panel 12. 2004 Director Wildlife and WCST appointed as Ramsar CEPA Focal Points. 13. 2004-13 MNRT supported by Danida implements the SWMP (includes 14 pilot districts and 2 RS). 14. 2006-9 NAWESCO second National Wetlands Strategic Action Plan (= SWMP) 15. 2007-13 MNRT supported by BTC implements the KVRS project (includes support to 2 districts). 16. 2007 first draft National Wetlands Strategy (was not approved by Cabinet). 17. 2007 Wildlife Policy, after lengthy participatory process, gives equal emphasis to wetlands and wildlife. 18. 2007 SWMP and PFM align under a unified approach under MTEF Administration and Finance Manual. 19. 2008 NAWESCO approves the strategy for decentralized approach to SWMP. 20. 2008 first draft of SWMP Technical Manual. 21. 2008 first draft SWMP Research Agenda for inclusion in TAWIRI national research agenda. 22. 2008 first draft SWMP guide to sustainable pastoralism in wetlands. 23. 2008 first draft SWMP guide to sustainable irrigation in wetlands. 24. 2009 first draft SWMP guide to district inventory of wetlands. 25. 2009 first draft SWMP CEPA guide to sustainable wetlands management. 26. 2009 first draft strategy for wetlands and climate change (for COP 15). 27. 2009 first draft Single Species Action Plan for Lesser Flamingo.

64
28. 2009 Wildlife Act that empowers the creation of a new category of wildlife protected areas for bio-diversity conservation known as, wetland reserves and wetland areas.
29. 2010 first draft policy brief on sustainable wetlands management for DPG-E. 30. 2010 first draft concept note on DENRM and wetlands. 31. 2010 MNRT Strategic Plan 2010-13 includes delivery of a National Wetlands Management Strategy. 32. 2010 MNRT receives first Blue Globe Award at CBD COP 10 in Japan for efforts to manage LNRS. 33. 2011 VPO takes over Ramsar Secretariat. 34. 2011 VPO embarks on Protected Wetlands Regulations. 35. 2011 PMO-RALG issues 4th Edition of Administration and Finance Manual (AFM) for PFM and SWM. 36. 2011 MNRT publishes first CEPA Resource Book for SWM. 37. 2011 Hombolo College offers first in-service short course on AFM for SWM. 38. 2011 First National Wetlands Management Strategy for a SWMP published. Tanzania became the 120th country to sign the declaration in 2000. In Tanzania, wetland areas occupy about 10% of total land area, of which, over 5% of land area (ie wetland and catchment) is designated as 4 key Ramsar sites. Other wetlands are either fall under Protected Areas (40%) or village land (60%)(See Fact Box 38). There are many species of birds, fish, animals and plants which are only found in wetlands. These are known as the “wetland bio-diversity”. In many cases, you can identify the wetlands by just looking at the plants and animals found in it (eg typha wetland, or papyrus wetland, etc).
Fact Box 57: What does Ramsar Convention Mean for Tanzania?
This implies that Tanzania has an obligation to:
a. “ develop a national wetland policy on wise use b. to conduct wetland inventories, and
c. “ to prepare and implement management plans for key areas”. To declare a Ramsar Site as important, it must contain more than 1% of the global bio-diversity of any one species, or at least 20,000 individuals. Tanzania’s 4 Ramsar Sites therefore each have a unique habitat for a particular species, notably:
� Shoe bill (Muyovozi-Malagarasi Ramsar Site), � Lesser Flamingo (Lake Natron Ramsar Site), � Puku (Kilombero Valley Ramsar Site) and � marine fish (Rufiji-Mafia-Kilwa Ramsar Site).
To-date, 5.5 % of land area in Tanzania, is in 4 key Ramsar sites, as follows:
Fact Box 58: Tanzania’s 4 Ramsar Sites and why they are Important?
� 32 500 km2 Malagarasi-Muyovozi RS (2001) (protecting sitatunga, shoe bill and wattled crane, a papyrus/permanent swamp).
� 2 250 km2 Lake Natron RS (2001)(protecting Lesser Flamingo, a soda, alkaline wetland). � 7 950 km2 Kilombero Valley RS (2002)(protecting Puku, a lowland, freshwater flood plain).
� 5 970 km2 Rufiji-Mafia-Kilwa Marine RS (2003)(protecting marine park coral reefs, dugongs, turtles, fish, mangroves and sea grasses species, a marine wetland).
Work Box 6:
Review Questions:
1. What is the key Ministry in wetlands management? 2. Which 3 policies influence the regulation and utilization of wetlands…?
3. List 5 Ministries that make up NAWESCO…? 4. List 3 actions on wetland which are considered as offences under EMA 2004.
5. How far from a wetland does EMA restrict any kind of human activity…?

65
Group Work:
1. In your area list sector extension agents working with you in wetlands…?
2. List also if there are any NGOs, and donor funded projects, etc…? 3. Do you have a wetlands management plan…? 4. Have you included wetlands in your LUP…?
5. Have you included wetlands in your Village Plan…? 6. Is your wetland included in the Districts Development Plans…?

66
CHAPTER SEVEN
COMMUNITY MANAGEMENT (CBNRM) OF WETLANDS IN TANZANIA:
This section describes how local communities can mainstream wetlands management in local government through the national SWM
Program of Tanzania.
a. Objective of CBNRM and SWM. b. Introduce SWM MTEF 4 Targets (1. In DDP, 2. 6 steps CBNRM, 3. Implement WFI, 4. Capacity Building)
c. CBNRM of Wetlands Described.
� Formation user groups. � Boundary marking and mapping.
� Resource assessment. � Management plans.
� By laws. � User rights.
7.1. What is CBNRM of Wetlands? Community Based Natural Resource Management (CBNRM) is the management of natural resources at the lowest form of appropriate local governance, usually at the user group level, under the village government Wetland is supposed to be preserved by all social groups, especially the user groups, and can be divided into three sections: 1. Users: The people living in the given area, and users of the resource (ie pastoralists, irrigationists, farmers,
fishermen, hunters, etc). 2. Decision makers: at the local and central government level and village government. 3. Activists or NGOs: who promote environmental conservation. These users need guidelines of best practice in utilization of wetlands. It is very important for the community who invests and uses wetlands and wetlands products, that they must do so in a sustainable manner. Current practices of unregulated use of wetlands for agricultural purposes, like traditional irrigation and pastoralism, need to be reviewed and improved. Any environmental effects should be well understood prior to any kind of investment, notably through EIA’s. Community users of the wetlands should be fully involved in all stage of wetlands planning, management and conservation, and should own and implement the solution for sustainable management.
Some Examples of CBNRM Organizations
a. Forests: Through Participatory Forest Management (PFM) (over 2000 villages). b. Fisheries: Through Beach Management Units (BMU) (over 500 villages).
c. Wildlife: Through Wildlife Management Areas (WMA) under Authorized Associations (AA) (over 200 villages), d. Wetlands: Through SWMP, linked to PA,s WMAs and 4 Ramsar sites (+100 villages).
e. Catchment Management: Through Water User Group/Association (WUG/As) to protect water sources (+/- 1000s).

67
In the case of CBNRM as applied to Sustainable Wetlands management Program (SWMP), this is currently being tested in 14 pilot Districts so as to develop a systematic approach to CBNRM of wetlands under the government policy of Decentralization by Devolution (D*D). What this means is that the government’s reform policy in all natural resource sectors aims to empower the lowest user groups (the community) to both own and sustainably manage their resources on village land in accordance with the Village Land Act (1998) and bring this under local governance through the Local Government Act (1982). Most sector policies have therefore devolved natural resource extension services to Local Government Authorities (LGA), and have empowered village governance as both the user and manager of its resource base. This is known as:
a. “Participatory Resource Management” if on village land, or b. “J oint Management or Co-Management” if on public or state land.
This Resource Book is about engaging community participation in wetlands resource management through local initiatives through CEPA to stimulate joint action and sustainable use.
7.2. What is the Hierarchy of Management for CBNRM? CBNRM is all about management at the lowest appropriate level. Under decentralization, CBNRM is also about mainstreaming resource management by a link from Local Government Authority to the resource user = the local community. This hierarchy extends from user group, to village government, to districts and regions to PMO-RALG and sector Ministry. In the case of wetlands, the overall policy falls under the umbrella of the multi-sectoral, National Wetlands Steering Committee (NAWESCO) as the national and inter-ministerial coordination body, and from there is linked to the Convention of Parties (COP) under the Ramsar Convention, as the international coordination body:
Fact Box 59: The Institutional Hierarchy in Wetlands Management
Users (Farmers, fishers, hunters, brick maker)
User Groups (CBO, BMU, PFM, etc) Local User Groups (Wetlands Management Plans)
Village Natural Resource Committee (VNRC) Village Land Use Plans (LUP)
Village Development Committee (VDC) Village Development Plans (VDP)
Village Government Wildlife Management Area (WMA) General Management Plans (GMP)
Authorized Association (AA) Districts Development Plans (DDP)
District Council (DC) Ramsar Site/Protected Area Integrated Management Plan (IMP)
River Basin Authority (RBA) River Basin Management Plan (RDMP)
Ministry of Natural Resources and Tourism) MNRT Sustainable Wetlands Management Program (SWMP)
NAWESCO/NWWG International Ramsar Convention (Ramsar)
Ramsar Secretariat 160 Ramsar Member Countries (COP)

68
7.3. Local Government Planning and Wetlands. The way CBNRM is structured in policy, means that various resource user groups, through their Village Natural Resource Committees (VNRC) are to plan for sustainable use, and to develop local strategic wetlands management plans. What this means is that to bring wetlands under wise use, there are four levels or stages of MTEF Targets as follows:
The 4 MTEF Targets of SWM (and PFM) � Target 1: District Wetland Inventory undertaken and Strategic Plans for priority sites included in District Development Plans (DDP).
� Target 2: Wetland site brought under community management (by completion 6 CBNRM steps). � Target 3: Site management plan implemented through community action or micro-projects or WFI.
� Target 4: Capacity development and support.
Once a district has assessed its wetland resources, it chooses priority sites to include in the DDP for funding, first to undergo the 6 steps that lead to CBNRM (See below), and then to implement wise use micro-projects to mitigate against unsustainable practices. Part of the process is to develop site management plans that integrate into and are harmonious with the Village Land Use Plans (LUP). In this way, mainstream wetland management into the Village Development Plans (VDP), makes them an integral part of the DDP. If the villages decide to form a BMU, Wildlife Management Area (WMA), or are adjacent to a Protected Area (PA) or a Ramsar Site, their wetlands plans are included in the fisheries, WMA or PA General Management Plan (GMP), and in turn, are submitted to district authorities for approval and inclusion in District Development Plans (DDP). In turn, these DDPs are consolidated at Regional and national level as part of the national Sustainable Wetlands Management Program (SWMP). This is what is known as a Sector Wide Approach (SWAp) to planning. This program approach allows development partners (DP) and central government to dialogue on support and funding, and presents a framework for LGA and NGOs and others to lobby for support. All these planning steps are in response to the national obligations to the international community, known as the “Ramsar Convention”.
7.4. What is the Objectives of SWMP and CBNRM? The Development Objective of the Sustainable Wetlands Management Program (SWMP) of Tanzania is: Sustainable Wetland Management approaches implemented widely in Tanzania and contributing to improvement of livelihoods. This is a long-term goal and 10-15 years of support is envisaged to be needed to achieve this. The Immediate Objectives however, are two-fold: 1. A national level framework and support functions for sustainable wetland management operational. Outputs = SWM Institution in place with capacity in legal and technical tool boxes for SWMP implementation. 2. Wise use principle being applied in all wetlands. Outputs = Best practices for SWM through wise use in place, with technical support and funding facility for Wetlands Friendly Investments (WFI) by user groups. SWMP is a nation-wide program to support CBNRM of wetlands under D*D.

69
7.5. The Institution of SWMP: The Government, when revising the Wildlife Policy, in 2007, saw it proper to put equal emphasis on wildlife, as on wetlands. This was primarily because wetlands as ecosystems provide services which make up key wildlife corridors and habitats, and are the only source of water for all wildlife, human, livestock, agriculture, energy, mining, urban and industrial needs.
“No wetlands, no power, no industry, no food, no wildlife, no tourism, no economy, no life…..!”
The institution of SWMP is managed at many levels (Fact Box 60), according to the institutional, tenure arrangements that govern state and wetlands management, notably: a. Wetlands in State Land or Reserves: Wetlands in protected areas, state or reserved land and areas of
critical importance, like Ramsar Sites, remain under central government administration, through MNRT, implemented at the site level through the PA or Ramsar Site Project Manager (PM) = approx 40% of area.
b. Wetlands Joint Management and PA Boundaries: Joint Wildlife Management are arrangements between
state and community to share responsibility, through establishing Wildlife Management Areas (WMA) or through Community Based Conservation (CBC) along the boundaries of PA or along key wildlife migration routes. This is a joint initiative by the MNRT and PMO-RALG, administered through District Natural Resource Advisory Boards (DNRAB).
Wetlands and Village Land: Wetlands on village lands come under the administration of the LGA and PMO-RALG, with MNRT providing a supportive, supervisory, technical and monitoring role = approx 60% of area.
7.5.1. The Role of NAWESCO: SWMP is currently overseen by a governing body, the National Sustainable Wetlands Management Steering Committee (NAWESCO). Made up of 9 wetland dependent Ministries at Permanent Secretary (PS) level, NAWESCO is the policy oversight body of the Ramsar Convention and therefore of SWMP with the objectives: “To effect the coordination role of the government in implementation of the Ramsar Convention on Wetlands”.
Fact Box 61: The 9 Ministries that make up NAWESCO
1. Ministry Of Natural Resources and Tourism (Chair).
2. Ministry of Water & Irrigation. 3. Ministry Of Livestock and Fisheries Development.
4. Ministry Of Lands, Housing and Human Settlement Development. 5. Ministry Of Agriculture and Food Security.
6. Ministry Of Energy and Minerals. 7. Vice President’s Office - Environment.
8. Prime Minister’s Office, Regional Administration and Local Government. 9. President’s Office, Planning Commission.
NAWESCO functions to: a. Coordinated decisions on any major wetland related matters, harmonizing sector and DPG plans, strategies
and policies guiding national development programs, projects and plans to be executed in wetland areas. b. Consider wetland related decisions or conflict resolution and resolve overall SWMP relevant issues. c. Secure the inclusion of relevant actions and resolutions into Ministerial plans and budgets in order to
facilitate implementation of the Ramsar Convention.

70
d. Endorse SWM programs and guide the Secretariat in implementation (i.e. WD).
Fact Box 62: Institutional Arrangements of SWMP
7.5.2. The Role of MNRT: NAWESCO is chaired by the Ministry of Natural Resources and Tourism (MNRT) with the aim of guiding sectors and development partners (i.e. donors, NGOs and CSO) to harmonize with government policy under the Joint Alignment Strategy for Tanzania (JAST). The mission of MNRT towards the Wildlife (and Wetlands) Sub-Sector therefore is: “To conserve, manage and develop wildlife and wetland resources and sustainable utilization that will contribute towards poverty reduction” MNRT aims to achieve this through (Wildlife Policy 2007): a. Administration and regulation of wetlands (i.e. under the Ramsar Convention). b. Promote stakeholder participation in conservation and sustainable utilization of wetlands resources. c. Promote wetlands resources for economic growth. d. Promote information sharing, nationally, regionally and internationally.
71
With the signing of the Ramsar Convention on 13th August 2000, Tanzania, through MNRT as the National Ramsar Focal Point, has also agreed to: a. Develop a National RAMSAR Strategic Plan/Program (= SWMP). b. Establish and maintain a National Wetlands Coordination Body (i.e. NAWESCO and its advisor, NWWG). c. Appoint an Authorized Representative of the Convention (i.e. Wildlife Division). d. Develop a national wetlands policy (= Wildlife Policy, 2007). e. Carry our wetlands inventories, designate important wetlands as Ramsar site and prepare management plans. f. Foster international cooperation through exchange of information and training. g. Respect Resolutions of RAMSAR COP, and provide regular National Wetlands Status Reports to Ramsar. h. Organize World Wetlands Day, 2nd February each year.
7.5.3. The Role of NWWG: NAWESCO is assisted by a technical advisory body made up of 35 (plus) institutions, the National Wetlands Working Group (NWWG), which meets regularly to coordinate and share experiences between sectors. NWWG is mandated to: a. Coordinate mainstreaming of wetlands in all national programs, projects and institutions. b. Facilitating communication and exchange of information on wetland issues. c. Develop, maintain and enhance links between different wetland stakeholders. d. Assisting decision makers with technical advice in wetland issues. e. Function as the management forum for the national SWMP, to harmonize programs and work plans. f. Report to NAWESCO. NWWG is made up of several sub-committees who deal with: a. Community Participation/CBNRM. b. Research and Training. c. Planning and Management. d. CEPA. e. Water birds/AEWA, and f. Inventory and Monitoring.
7.5.4. The Role of WD and Wetlands Unit: The Wildlife Division (WD) in the Ministry of Natural Resources and Tourism (MNRT) is the Secretariat to these bodies, through the Wetlands Unit (WU). The WU has a mandate to support all sectors at levels of implementation of the SWMP, from central to local government, NGO, private sector and the public at large. To do this, WU has several desks, namely: a. Wetlands Unit (or Section) Component Leader. b. Wetlands Unit Desk for Coordination of NAWESCO, NWWG and RAMSAR. c. Wetlands Unit Desk for CEPA, Research and Training. d. Wetlands Unit Desk for PA and LGA (i.e. DeNRM) Management, Wetlands Inventory and M&E. The Wildlife Policy (2007) role of central government to SWMP is designated to the Director of Wildlife to: a. Administer wetlands laws, and all types of wetlands resource user rights and licenses. b. Formulate wetlands strategies and programs for policy implementation, coordinate harmony between sectors. c. Administer management plans for wetlands in PAs and Ramsar Sites.

72
d. Provide technical assistance & set professional standards in wetland conservation, management & utilization. e. Coordinate Local Government Authorities (LGA), NGO, private sector, research, training, etc.
7.5.5. Role of PA and Ramsar Site Project Managers (PM): The objectives of the PA network are to: a. Identify, establish and sustainably manage key wetlands, wetland reserves and to preserve wetlands species. b. Provide opportunities for public enjoyment of scenic wetlands areas, and for sustainable use of wetlands. c. Rehabilitate key wetlands. d. Create opportunities to access natural resources in wetlands for rural development. e. Work with LGA around the PA and communities through WMA process. The key role of PA and Ramsar Site PM’s is to: To ensure the sustainable and joint management of the wetlands under their jurisdiction. The PA PM and the Ramsar PM are responsible for: a. Sustainable management of a key wetlands/specific Ramsar Site/wetlands of importance, in their jurisdiction. b. Joint management of trans-boundary wetlands (e.g. with local communities, district authorities, inter-district
or inter-region). c. The same duties and responsibilities as LGA, aligned to the 4 MTEF targets as in the AFM Manual, which
include: � Target 1: Wetlands Included in Development Plans (i.e. Ramsar Site IMP, PA or WMA GMP or DDP): � Target 2: Wetlands included in boundary Village Management Plans (LUP). � Target 3: Village Wetland Friendly Investments (WFI)/Micro-projects implemented in boundary villages. � Target 4: PA/Ramsar Site Capacity in Wetlands Developed.
7.5.6. PMO-RALG and Wetlands: Whereas 30-40% of wetlands fall under Protected Areas (PA) and therefore the jurisdiction of MNRT and PMs, 60-70% of wetlands are on village land and therefore under management by Local Government Authority (LGA). Accordingly, the Prime Minister’s Office for Regional and Local Governm ent (PMO-RALG), has been involved in SWMP since 2004, and in January 2009, strengthened its Directorate of Sector Coordination (DSC) by adding a SWM Coordination function. The interface between PA and village land calls for greater cooperation between MNRT and PMO-RALG and LGA. Cooperation is a key so as to ensure that upstream use of water is not over-exploitive to the detriment of downstream users. Crucial to any water use is to strive to strike a balance between environmental flows needed to maintain sustainable life downstream, and those using the water at source or upstream. Sectors like Water, Irrigation, Livestock, Agriculture all look at water use “in situ”, but it is the wetlands managers, NAWESCO, NWWG, MNRT, PMO-RALG, PA Managers and LGA that must ensure upstream and downstream harmony and equity. It is their combine role to ensure that water use is not at the expense of in-situ nor downstream biodiversity nor other sector livelihoods. This interface occurs at Local Government level. Processes of LGA therefore apply to sustainable wetlands management on village land, and where this borders a PA, must be done in conjunction with PA Managers. Collaboration between PA Managers and LGA for horizontal planning involving border communities is therefore vital to ensure holistic, Integrated Water Resource Management (IWRM).

73
WMAs therefore offer an ideal mechanism for management of wetland (and wildlife) by creating “buffer zones around PAs and wetlands which are key game corridors. For this purpose stakeholders should meet at village level, to take stock and plan, to ensure wetlands management enters Village Development Plans (VDP), District Development Plans (DDP) and PA General Management Plans (GMP). Village, District, Regional, Zonal, NWWG and NAWESCO meetings are therefore a hierarchical framework to ensure stakeholder coordination and synergy through alignment, consolidation and monitoring for feedback and technical support. PMO-RALG therefore has a key coordination function and in 2007, issued the Administration & Finance Manual (AFM) to synchronize participatory forestry and wetlands to the MTEF planning systems.
7.5.7. Role of DSC and Wetlands: In PMO-RALG, the coordination role of PFM and SWM is assigned to the Directorate for Sector Co-ordination (DSC). Under the DSC, there is an Environmental and Natural Resources (ENR) Unit. This Unit includes a Game Officer as SWM Coordinator to look after the implementation of the SWMP. The ENR Unit is responsible for: a. Coordination of all PFM and SWM activities at LGA level, counterpart to WD/MNRT. b. Coordinating Regional and Zonal activities for the consolidating of the planning and budgeting of all PFM
and SWM activities, guiding according to program guidelines (i.e. setting ceilings, monitoring against AFM, etc), reporting to steering committee (i.e. NFP/NAWESCO) and donor.
c. Coordination the flow of funds from donor to DSC, Regions and Districts, and accounting back through consolidated M&E, reporting and audit.
d. Conducting needs assessment, and coordinating training and administrative technical support.
7.5.8. Role of Local Government and Wetlands: LGA are to implement the Wildlife Policy (2007), notably for wetlands, to: a. Provide wetlands extension services. b. Formulate, approve and enforce wetlands by laws. c. Provide technical support and conservation education (CEPA) to villages and Councilors. d. Prepare physical inventory and implement development plans to protect wetlands.
7.5.9. Role of Regional Secretariat (RAS) and Wetlands: The RAS shall appoint an officer to be the SWM Regional Focal Person (RFP). This officer is responsible for:- a. Raising awareness of participatory SWM in the Regional Secretariat (ie sensitize the Regional Management
Team - RMT) and the Districts. b. Promote the implementation of SWM in their Districts. c. Coordinate through 2/year inter-district, Regional Meetings, synchronizing and consolidating planning,
budgeting and reporting, in line with national guidelines, MTEF and AFM. Scrutinize and consolidate work plans, budgets, physical and financial reports for formal submission to PMO-RALG and NAWESCO.
d. Monitoring and evaluating District implementation, consolidating M&E Reports for PMO-RALG and NAWESCO.
e. Providing technical support to backstop the SWMP and provide hands-on capacity development in their Districts.

74
The RAS shall also assign a Regional Planning Officer and Regional Accountant to support the SWMP. The Regional Focal Person will work with these officers to ensure proper planning and reporting of SWMP activities in the Region, as per MTEF (and AFM).
7.5.10. Role of District Council and Wetlands: In each District, the District Executive Director (DED) has appointed an Officer to be the SWM District Focal Person (DFP), who, shall organize, coordinate SWM in the district, working with the District Facilitation Team (DFT) to carry out the MTEF Targets described above: a. Target 1: Develop a district inventory of wetlands resources, identifying priority and suitable, key areas for
participatory management and include a staged approach in a 3 year District Strategic Site Management Plan, as part of the DDP.
b. Target 2: For key wetlands, assist the identified village(s), one by one, to complete all of the 6 CBNRM steps needed to achieve the authorization of CBNRM and put user rights agreements and community management plans in operation.
c. Target 3: Assist communities to effectively manage their wetlands sustainably in accordance with their management plans through micro-project wetlands friendly investments or mitigation interventions.
The DED shall also assign a Planning Officer and Accountant to support the SWMP, and the SWM Focal Person will work with these officers to ensure proper planning, budgeting and reporting of activities, as per MTEF and M&E Reports, guided by the AFM Manual.
7.5.11. Role of Village Government and Wetlands: Implementation of SWM is undertaken at village government and user group level, supported by technical Officers from the District (i.e. the District Facilitation Team - DFT): The Village activities include: a. Target 1: To issues minutes confirming commitment to bring wetland under SWM. b. Target 2: Carry out all 6 steps to secure CBNRM of their wetland resources. c. Target 3: Secure resources and implement mitigating and economic activities or wise use micro-projects that
support sustainable resource management. Monitor and supervise sustainable use for domestic and commercial purposes through revenue collection, record keeping and routine patrols by village guards/scouts.
7.5.12. Role of Private Sector and Wetlands: To support government in conservation, development and sustainable utilization of wetlands, through investment.
7.5.13. Role of NGOs and Wetlands: To support government financially and technically in conservation and management of wetlands, providing CEPA and assisting LGA with extension services.

75
7.5.14. Role of Development Partners (DP) and Wetlands: SWMP provides a framework for a programmatic approach to SWMP, and it is NAWESCO as the umbrella organization to provide the leadership, to coordinate between DPs and international NGOs. In line with JAST, accordingly, NAWESCO is to motivate projects in water, wetlands, coastal and CBNRM of wildlife to come under the SWMP framework.
7.6. CBNRM and Wetlands: According to Wildlife Policy (2007), all wetlands, like wildlife, are state property. User rights need to be secured! Local government therefore has a key role to play in joint wetlands management on village land (60% of land area), and PA management, is responsible for instilling joint CBNRM in wetlands in and around PAs (40 % of land area). Ramsar principles of wise use of wetlands, calls for community mobilization so that current, in situ “wetland investments”, livelihoods such as: pastoralism, traditional irrigation, agricultural cropping, fishing, hunting for food, harvesting non-forest products, etc, become more sustainable, “wetland friendly investments (WFI)”. SWM is about working in wetlands, with wetlands issues and stops at the wet/dry land interface generally defined by the growth of bush and trees! Trees, other than certain palms, mangroves and acacia, do not generally grow in wetlands, as they cannot tolerate water logged soils. SWMP is a government program and as such it follows normal government planning processes and is guided by MTEF.
Fact Box 61: Local Government Budget and Planning Cycle
� September - Ministry of Finance starts planning for next financial year. � Nov – Dec - Central government budget frame is approved by Cabinet.
� Jan – Feb - Local government Planning and Budget Guidelines are issued by PMO-RALG. (NB needs to be first approved by NAWESCO).
� Feb – Mar - Local government budget preparation (NB SWM District stakeholders meet and then consult RFP).
� April - Budgets are approved by District Council and revenue and grant figures are submitted to PMO-RALG and MOF for inclusion in the draft national budget.
� June – Aug - Parliament approves national budget. � July 1 - Beginning of Financial Year.
In PFM and SWM there is no difference in the step-wise approach to CBNRM, and this has lead to the adoption of one harmonious AFM Manual, designed by PMO-RALG in 2007, and modified in 2011. The following is a simplified step-by-step approach, a logical, sequence of events, to be followed for every wetlands site and outlines steps that have to be completed for each village in each site, before that site can be said to have been brought under CBNRM or SWM:
7.6.1. SWM at District Level: The district objectives for SWM under D*D are: Sustainable management of natural resources (ie forest, wetlands, wildlife, etc) through community participation (= CBNRM under D*D) and wise use to improve livelihoods, without compromising ecosystem services.

76
At district level there are primarily the following stages as applies to SWM: To achieve Target 1: District Wetland Inventory undertaken and Strategic Plans for priority sites included in District Development Plans (DDP), the following outputs are involved: � Output 1: District wetland inventory and map, prioritizing key sites. � Output 2: Key wetland sites included in 3 year Strategic Management Plan, part of DDP. � Output 3: Through DDP, village by village support to bring wetlands under SWM. The sequence of steps/activities under this MTEF Target will include: Step 1: District Wetland Inventory and Map, Prioritizing Key Sites. � Stage 1: DFT desk rapid district-wide resource assessment analysis of district wetlands resources (ie examine
district map). List all sites by area in ha, current uses and pressures produce a District Inventory Summary. � Stage 2: From the district map (1:50 000) DFT draft a map of all district wetland resources (mapping those
as listed above). � Stage 3: DFT from above list, begin to identify a number of the key sites, ranking by priority their wetland
areas (based on economic and livelihood values to districts or SWM problems). � Stage 4: District inventory and map of wetlands are then published as District Wetlands Inventory, as part of
the District State of the Environment Report (SOER) under EMA. � Stage 5: Selected DFT members now visit the 1-2 select, priority strategic wetland areas. Complete the site
inventory. Consult the selected communities on suitability for establishing participatory wetland management and assess/confirm interest and secure minutes from communities to participate in CBNRM under SWMP.
Step 2: Key Wetland Sites Included In 3 Year Strategic Management Plan, Part Of DDP. � Stage 1: DFT members prepare 3 year District Wetlands Strategic Site Management Plan/Program for all key
sites. This has time schedule and actions to achieve Target 2. The aim is integration of the step by step CBNRM approach to the selected 1-2 key sites into the 3 year District Development Plan (DDP).
� Stage 2: DFT members now prepare the Annual District Development Plan, including the SWMP budget, integrating the 1-2 key site management plans sequence of activities (i.e. timing of 6 CBNRM steps), into the DDP.
Step 3: Through DDP, Village By Village Support To Bring Wetlands Under SWM. � Stage 1: DFT work with Village to carry out the 6 CBNRM steps (AFM target 2), village by village until
complete all stages for the selected 1-2 priority sites. The reason for districts to first do an inventory of all sites (Target 1 of AFM), is, it is not possible, nor practical nor cost effective to work on all sites all at the same time. Based on the district wide site inventory, districts establish batches of 2-3 key sites to work on at a time, working through each village one by one in sequence. The work plan for bringing each site under CBNRM (ie undertaking the 6 steps in sequence for each village, for each site) is then developed as a site management plan, and all the selected key site plans combined, make a 3 year Strategic Wetlands Site Management Plan for that District. This is incorporated into the 3 year District Development Plans (DDP), and until these sites are brought fully under CBNRM (ie all villages have the wetlands in village plans), the focus should not shift to include new sites nor new villages.

77
7.6.2. SWM at Village Level: To achieve Target 2: Wetland site brought under community management (by completion 6 CBNRM steps) there are a number of outputs that need to be achieved (Fact Box 62)
Fact Box 62: The 6 CBNRM Steps to SWM:
� Step 1: Form and make operational the VNRC (or related sector user group or CBO).
� Step 2: Undertake resource boundary marking and PRA mapping. � Step 3: Participatory resource assessment and future needs.
� Step 4: Develop resource management plan as part of VD Plan and inclusion in LUP. � Step 5: Develop wise use by laws (and approval by District).
� Step 6: Secure user rights (e.g. BMU licenses, WMA etc, approved.). The sequence of activities that are to be implemented once only for any village, per priority site, include: CBNRM Step 1: Village Awareness of SWM and VNRC/User Group Formation. � Stage 1: Introduction and general awareness raising at village level on SWM, what it is about and on rights
and responsibilities under SWM (i.e. at Village Council and Assembles level). � Stage 2: Facilitation of formation/election, training of Village Natural Resource Committees (VNRCs), or
establishment of thematic user group which can be a BMU, WMA or WUG/A, by developing and registering CBO constitution.
CBNRM Step 2: Wetlands Inventory, Resource Assessment, Boundary Marking and PRA Mapping. � Stage 1: Survey and demarcation of village land, marking village wetland boundaries on sketch map. � Stage 2: Drawing of a PRA sketch map of the wetland, village uses, etc. CBNRM Step 3: Wetlands Inventory and Resource Assessment. � Stage 1: Facilitation of community participatory in wetland use survey and needs assessments vs resources
available. � Stage 2: Prepare detailed wetland site inventory, ecological parameters, uses, etc. � Stage 3: Conduct with village, SWOT analysis to identify unsustainable use and future resource use and
pressures. � Stage 4: Draw uses and future needs on the PRA map of the wetland. CBNRM Step 4: Wetlands Management Plan Part of VDP/LUP. � Stage 1: Facilitation of drafting of Village wetland 3 Year Site Management Plans (i.e. to encompass
mitigation measures to problems and wetlands friendly investments (WFI), mitigating actions, etc). � Stage 2: Presentation of wetland plan to village government and once approved, inclusion in VDP. � Stage 3: Inclusion of mitigation measures through SWM or WFI micro-project interventions. � Stage 4: Work with LUP teams, provide data, maps, resource assessments, existing use, planned needs,
SWOT analysis, etc and guide LUP teams to incorporate wetlands management in their LUP process. CBNRM Step 5: By Laws Prepared And Approved. � Stage 1: Facilitating the development of village wetland management by laws (guided by sector laws for
BMU, WMA, WUG/A, etc). � Stage 2: Get approval of By Laws by Village Assembly. � Stage 3: Get approval of By Laws by District Assembly.

78
CBNRM Step 6: Secure SWM User Rights. � Stage 1: Facilitation of declaration Village Land Wetland Reserves at Village and District levels by
completion of application form if WMA, application for licences if BMU, user rights if WUG/A, etc. � Stage 2: Facilitation and/or preparation of Joint Management Agreements (eg through WMA process), and
securing user rights from appropriate directorate. To achieve Target 3: Site management plan implemented through community action or micro-projects by implement mitigating measures or wise use (e.g. wetland friendly investment = WFI) as community micro-projects. � Stage 1: Micro-projects must be in the VDP, and must be SWM related, addressing a wetland problem as in
the wetlands management plan. � Stage 2: DFT must guide the village through each stage as per the micro-project plan, assisting with
technical support, credit facilities, purchase of productive items, training, M&E, etc. � Stage 3: The options for sustainable micro-project activities under this target include all micro-project
activities for SWM such as Wetland Friendly Investments (WFI) or Wise Use Livelihoods in wetlands, notably:
Examples of WFI
a) Support to pastoralism: Developing pastoralist groups, improving unsustainable rangeland management, implementing grazing
rotation models, improving marketing to reduce herds, establishing water points at pressure point, limiting entry through licensing schemes, etc, all, to reduce pressure from grazing on wetlands.
b) Support to sustainable fishing practices: Developing user groups (ie BMUs), use of less destructive gears (ie changing mesh size), setting quotas, closed seasons or closed breeding areas, improving processing to add value, improved marketing and landing
facilities (eg hygiene) introducing “culture based” fisheries. c) Support to sustainable hunting: Developing legal means to hunt for food or value added through tourism (eg. under the WMA
process). d) Promotion of sustainable use of non-forest wetland products: Promoting wise use of wetlands materials such as palm leaf for
weaving mats or thatch, clay for brick or pot making, salt making, etc. e) Support to existing traditional irrigation or wetland cropping schemes: (e.g. rice, valley bottom vegetables, maize encroachment in
wetlands, etc) to improve efficiency of water use (of existing schemes and not to be used to expand new systems). Addressing key points of water inefficiency, such as improvements to regulate intakes to avoid seasonal wastage, improved flows between fields to
avoid having to fill all fields to reach the last, improved through flow channels and improved water return drainage. f) Entrepreneurship: Establishment and operation of credit or savings groups and schemes (SACCOs).
� Stage 4: This may include purchase one off, of limited items in support of village management (record
books, monitoring forms, bicycles), however investment in productive items like beehives, boats, fish nets, treadmill pumps, etc must be provided under SACCOS to be sustainable.
� Stage 5: Training of VNRCs/user groups (i.e. policy, laws, patrol and scouting, wardening, law enforcement and financial/administrative matters of micro-projects/SACCOS, etc).
It must be noted that micro-projects are a culmination all the above participatory CBNRM steps. They address community needs based on a participatory SWOT analysis. Communities diagnose problems and how to overcome and mitigate problems of unsustainable practices. The aim is to instill wise use and make environmentally friendly livelihood investments as have been described in the Village Management Plans.
7.6.3. Capacity Support to Districts To support districts to implement the above AFM Target 4 provides support for village>district>regional>central coordination meetings and M&E. For office support, communications, etc. As well as training and technical capacity building if needed To achieve Target 4: The following capacity building activities are carried out:

79
1: District Capacity Development: Capacity building in program activities to be carried out at start of program and can include refresher courses if needed due to new DFT staff appointments: � Stage 1: DFP carries out general awareness rising on CBNRM of wetlands at district level (ie of councillors,
of heads of department, of DFT etc). � Stage 2: MNRT and PMO-RALG training of DFT in CEPA Guide, SWM Manual and AFM Manual and
other Technical Guidelines. 2: Coordination and Reporting:
Coordination, monitoring and planning activities to be carried out 1-2 times a year to report to Steering Committee and application for new funds. � Stage 1: DFP/selected DFT members conduct 1/year M&E visits to wetlands to extract/update data for
district reporting (As per M&E format or inventory updates) to submit to PMO-RALG through RFP. � Stage 2: Bi-annual District Stakeholders Meeting for coordination by DFP of all stakeholders in the site
involved in implementing CBNRM activities in SWM (e.g. DFT, associated NGO, PA Managers, Facilitators, involved private sector, etc), to prepare district joint reports, work plans and budgets for each site to submit to PMO-RALG through RFP.
� Stage 3: Attendance of DFP/DPLO at bi-annual “Regional Meetings” organised by RFP to present and consolidate all district M&E into regional reports, work plans and budgets, for technical advice and quality control before submitting to PMO-RALG, and before going to District Council.
� Stage 4: RFP attendance at “Bi -annual Zonal meetings” organised by PMO-RALG to present and consolidate all district reports and AWB as regional M&E, reports, work plans and budgets into national report.
3: Support for Operational Costs: Office costs, to support district operations: � Stage 1: Stationary materials for preparation of quarterly and annual reports and submission to RFP. � Stage 2: Contribution to recurrent cost: communication, internet access, energy, water. (NB Maintenance and
service of pool vehicle is included in Tsh/km rate, inclusive of fuel and service). The above activities may be implemented by District Officers, other Public Officers cooperating with the District or may be outsourced to NGOs and other service providers.
Work Box7:
Review Questions:
1. What are the 2 objectives of SWM?. 2. What does AFM stand for?
3. What are the 6 CBNRM steps to SWM?. 4. What are the 4 MTEF Targets to SWM?
5. List 3 key micro-project activities in SWM.
Group Work:
1. For each of the problems identified in your wetlands, suggest a SWM micro-project. 2. Chose 3 micro-projects as priority and list them.
3. For each micro-project list the activities needed to be successful. 4. Beside each activity, estimate the materials needed.
5. Calculate the cost of each activity.

80
CHAPTER 8
WETLANDS FRIENDLY INVESTMENTS (WFI) IN TANZANIA
This section introduces the concept of wise use by looking at ways in which current investments in wetlands can be made into wetland friendly investments (WFI) by applying Ramsar wise use principles.
a. Principle Guidelines for Wise Use of wetlands
b. Introduction to Wetlands Investments vs Wetlands Friendly Investment (WFI) Concepts. c. What are Wetland Micro-Projects?
� Sustainable Pastoralism/Over-grazing.
� Sustainable Traditional Irrigation/Agricultural Encroachment. � Sustainable Fisheries (and why not Fish Farming).
� Sustainable Wildlife, Bushmeat Hunting & Eco-tourism. � Sustainable Non-Timber Products/IGAs (and not tree planting except mangroves/beekeeping).
� Waste Management. � Catchment Deforestation and Wetlands.
� Restore Wetlands.
8.1. Wise Use Principles The wise use principles leading to Wetland Friendly Investments (WFI) is embedded in the Ramsar Convention inArticle 3.1 which states that the Contracting Parties: "shall formulate and implement their planning so as to promote the conservation of the wetlands (included in the List), and as far as possible the wise use of all wetlands in their territory". Ramsar has defined wise use as: "The wise use of wetlands is their sustainable utilization for the benefit of humankind in a way compatible with the maintenance of the natural properties of the ecosystem". Sustainable utilization is defined as: "human use of a wetland so that it may yield the greatest continuous benefit to present generations while maintaining its potential to meet the needs and aspirations of future generations". The natural properties of the wetland ecosystem are defined as "those physical, biological or chemical components, such as soil, water, plants, animals and nutrients, and the interactions between them". These wise use provisions of Ramsar apply to all wetlands and their support systems. The concept of wise use seeks both the formulation and implementation of general wetland policies and legislation at all levels. It requires that the wise use of specific wetlands becomes an integral part of sustainable development (eg inclusion in Village and District Development Plans) and is part of the institutional and organizational arrangements of resource use and its governance at all levels from central, to local government to user group
Benefits from wise of wetlands
� sediment and erosion control � flood control maintenance of water quality and abatement of pollution,
� maintenance of surface and underground water supply, � support for sustainable fisheries, grazing and agriculture,
� outdoor recreation and education for human society, � provision of habitat for wildlife, especially waterfowl, and
� contribution to climatic stability;

81
Wise use calls for a review to overhaul traditional techniques of current wetland investments (ie uses such as pastoralism, irrigation, fishing, etc). There is a need for inclusion of more wise use technologies in development processes to overcome unsustainable use (ie over-grazing, inefficient use of water, over-fishing, etc). This shall be done through the elaboration of Wetland Friendly Investments (WFI) guidelines, through pilot projects and training of appropriate staff in the disciplines which will assist in implementation of wetland conservation action and policies.
Identifing wise use priorities for wetlands in a national and district context, includes:
a. Inventory of wetlands, identifying key economically important sites and evaluation of the direct benefits and values both in-situ (eg livelihoods) and downstream (eg hydro-power).
b. Listing unsustainable or environmentally unfriendly problems with these current wetland use practices. c. Defining the key conservation and management priorities needed to overcome the current and unsustainable uses and practices.
d. Integration of these environmental considerations in all planning of current and future direct wetland use patterns, paying particular attention to sustainability of maintaining the benefits and values of current uses, through the application of more WFI technology.
e. This should include also the regulated utilization of the natural elements of wetland systems such that they are not over-exploited or damaged.
f. Establishment of nature reserves in wetlands, when of biodiversity importance, and g. Consideration of restoration of wetlands whose benefits and values have been diminished or degraded.
The objective of wise use therefore focuses on making environmentally friendly current livelihood use patterns in wetlands and does not seek to take users out from the wetland and give them alternative
livelihoods!
8.2. Best Practices for SWM through Wise Use in Place Best practice means the most efficient technology that ensures sustainable and productive use of wetland resources. Wetland Friendly Investment (WFI) are those investments or livelihoods currently engaging in wetland resource use, which, through wise use, best practices are made more environmentally friendly and therefore sustainable.
8.2.1. Current Wetland Investments and Impacts As described in Chapter 5, current livelihood uses of wetland services are not necessarily sustainable, and needs more wise use approaches, notably:
a. Pastoralism: Overstocking is leading to overgrazing and damage to wetland grasslands. b. Irrigation: Water abstraction for irrigation exceeds the river flows in low seasons, causing damage to
downstream users, biodiversity and hydro-power. c. Fisheries: Overharvesting or using destructive techniques is damaging the fishery, reducing productivity. d. Wildlife: Poaching of wildlife around wetlands is damaging the population and migration routes. e. Non-timber Products: Over-extraction of resources like fibers, soils, corals, etc is degrading wetland
qualities. All the above wetland investments need to be brought under more wise use technology to become WFI.

82
8.2.2. Wetlands Wise Use and Sustainable Development: The following are the ways of utilizing wetlands in a sustainable way: a. Use small areas of wetlands for irrigation and do not use the whole area, or take all the water for crop
growing. Leave some water in the wetland to cater for environmental needs. b. Improve the efficiency of irrigation, and allow more water to go downstream. c. Control the amount of waste, solid and liquid that you dispose of in the water of wetlands, or do not dispose
wastes nearby (or have toilets near water), where it will drain into the wetlands. d. Use wetland water sparingly, to conserve it and preserve the wetlands. e. Preserve springs, do not burn grasses, reeds or trees which has natural roots in the wetlands. This will lead to
erosion. f. Use plants which do not have a high water demand (eg ban eucalyptus), which can suck a wetland dry. g. Preserve natural vegetation and grasses that grow in the wetland to prevent erosion and excessive flooding
and siltation. h. Restore back to original status any wetlands destroyed by crop or irrigation use so as to ensure continuity of
water circulation. i. Control and regulate animal keeping within wetland areas, especially during the dry season, limit overgrazing
and damage to what water is left in dry season. j. Only harvest plants (i.e. for mats, etc) fish, birds and wildlife (Bushmeat) within acceptable limits based on
carrying capacity, and respect breeding seasons and breeding grounds.
8.3. Sustainable Livestock Management In Wetlands
8.3.1. Introduction to Pastoralism WFI: Pastoral, agro-pastoral (including agricultural), peri-urban and commercial ranching systems as well as a general conceptual model for livestock systems have been presented as a basis for this training guide. Wetlands are an important component of natural resources which are integral to pastoral and agro-pastoral systems. Developing a sustainable grazing model that addresses wetlands conservation issues would require the concerted efforts of both central and local governments, specifically, supported by appropriate legislature and the technical expertise
Key questions to answer to make a livestock wetland investment, into a WFI:
a. What is the carrying capacity of the wetland (including time period/seasonality)? b. Which plant/animal species are most threatened?
c. How best can livestock movement data be collected and who can collect it and is there capacity to monitor? d. Are there existing stock routes and designated entry/exit points for livestock?
e. What arrangements can be made to make available supplementary feed during times of shortage of pasture? f. To what extent are the local communities sensitized/educated on sustainable use of the wetland?
g. Is there an existing by-law (district/village-levels) that can be applied to limit livestock movement? h. Which specific office will be the focal point for livestock grazing activities in the wetland?
The WFI components of a grazing model in wetlands would be powered by: a. Established livestock carrying capacity. b. Designated open and closed grazing seasons. c. Designated maximum number of livestock per person/family allowed into the wetland. d. Demarcated areas suitable for grazing (in LUP). e. Maximum number of livestock per grazing season per grazing area. f. Instruments for monitoring pasture levels, including key plant species. g. Designated and controlled stock routes including entry and exit points. h. Introducing well-designed grazing fee regimes (to be used for rehabilitation). i. Prohibitive penalties for offenders (Laws and By-laws).

83
j. Local expertise to collect required data/information on a regular basis and summarized for monitoring status. The principle theme for this Guide has been to propose systems for sustainable grazing. Since there are no systems that can operate successfully under the current high stocking rates, and the single policy of overwhelming importance (applicable in all wetlands) is the “overall reduction of cattle numbers to be within carrying capacity limits!”.
8.3.2. WFI Options in Pastoralism Several options for actions are open to assist the authorities to reduce and sustainable manage the livestock numbers in the wetlands that, if they succeed will lead on to other (smaller) WFIs. They are: a. Rangeland Management of Wetlands: It is important for wetlands to be given a reprieve of all livestock pressure at its most critical period, just prior to the rainy season, when the vegetation is at its lowest, and most critical, fragile and susceptible to overgrazing. This would allow time for the grassland to recover to full biomass, before allowing livestock in again. b. Regulation of Access to Wetlands: Introduce entry quota and fees for rights to graze and have high punitive grazing fees. This is one way of recognising the value of the wetlands as a economic good, a resource that user rights must be regulated and access rights preserved for future generations. c. Establishment of Agro-pastoralism in Wetlands: Under Village Land Act, through LUP there is scope to set aside plots within the Village Grazing Areas for leasehold purchase by migrant pastoralist and local livestock owners. This will introduce a level of ownership and associated responsible planning of wetland season grazing by owners and resident livestock. d. Alternate WFI Options: In addition to or as part of the above a number of additional WFI would be feasible: a. Introduction of fodder trees; b. Fencing subdivisions to allow rotational grazing, and pasture improvement e.g. using seeded Guinea grass; c. A pilot urea-molasses project, and d. Improved straw utilization. And embedded in the new laws of Livestock Identification, Registration and Traceability Act, 2010 (12-2010.pdf) and the Grazing Land and Animal Feed Resources Act, 2010 (13-2010.pdf) include: a. The Livestock Identification, Registration and Traceability Act, 2010 shall have the following basic components (a) the national livestock identification; (b) the national livestock registration; and © the national livestock recording and movement control (Part II of the Act). The Act declares compulsory livestock identification and registration areas (Part II section 5 (1-9), registration of livestock and premises for traceability (Part II, section 6 (1-9), specification, application and age limit for livestock identification devices (Pat II, section 7 (1-2), livestock identification numbering system (Part II, section 8(1-2) and acquisitions and application of livestock identification devices (Section 9 (1-3). b. The Grazing Land and Animal Feed Resources Act, 2010 stipulates safeguarding and development of grazing lands (Part III, section 16(1-2), management of communal and strategic grazing-land (Part III, section 17 (1-3), grazing-land development (Part III, section 18 (1-3), grazing-land management (Part III, section19 (1-2) and stock rate and measures in case of excess livestock units (Part III, section 20(1-5). c. The Act also sets restriction on the manufacture, importation or sale of animal feed resources (Part IV (a), section 21 (1-4), Composition of animal feed resources (Part IV (b), Section 31 and Adherence to names and standards of feed resources Part IV (b), section 32 (1-2) and Prohibition or limitation of manufacture and sale of risky or hazardous product (Part IV (b), section 33 (1-2). Besides, the Act provides general provisions for the protection of grazing land (Part V, section 37 (a-g).

84
8.3.3. Rangeland Management of Wetlands: To address the serious problem of the destruction of the subsoil structure and early vegetation flush, there needs to be a bylaw publicized under the new 1ivestock laws, under EMA and in accordance with the Local Government Act, governing that livestock may only graze and water in any wetland when the soil is dry, and must be moved just before the onset of the rains. The actual decision of closure will be made by the District Commissioner advised by agriculture and livestock specialists. It is likely that this will mean that cattle will have to be taken elsewhere for six months of the year. Each District will be responsible for its own closure decision; dates will differ from one District to another and from one year to the next. Any animals left on the wetland after closure will be subject to seizure and only returned to the owner on payment of a heavy fine otherwise they will be sold off. The belief that such an action will succeed rests on the fact that for many years there were no resident cattle, and pastoral cattle were brought to the wetlands under a transhumant system that had them remaining there for only three months or so. Although there is no record of the numbers of cattle involved, this was obviously environmentally sustainable since the wetlands remained stable during that time.
8.3.4. Regulation of Access to Wetlands: Resident cattle generally stay on village land reserved for livestock. Migrant, pastoralist cattle, in the village plans for wetlands, will have dry season highs and lows in the wet season based on land use plans. Thereafter, the very first action should be to introduce realistic grazing fees. In the past, district fines of 500Tshs were imposed on cattle in certain areas when cattle were found to be grazing without permission. But the fine was too small, so the pastoralists merely paid up and continued offending. To effect a major reduction of grazing cattle, it will be critical to set the grazing fee at a level that causes owners to decide whether they should move elsewhere, or reduce their herd size, and this will be a matter for detailed discussion with the District and Ministry staff. This consultancy recommends that the following features of a fee system should be considered based on an assumed animal value of 400,000Tshs. per head: a. The fee once paid will entitle the animal to remain in the wetland for life and to graze freely during the dry
season as proclaimed by the authorities, and the owner will get a receipt; b. To identify that cattle fees are paid the government will import a specifically designed and numbered set of
tags that can be seen from a distance, and cannot be bought by the general public for use (examples shown in Annex 1);
c. The numbers will go in a serial order, and one tag will be placed in each ear and the individual tag numbers recorded against the owners name;
d. The last three numbers will be hot branded on the left hind leg, (it may also have a brand denoting its own particular wetland);
e. These precautions will make it easy to see which animals have been registered (using modern technology a microchip could be implanted but although highly secure it would not be easily read);
f. Suckling calves would be hot branded with the wetland brand but would not pay the fee until the next year, when they would be charged the full adult amount;
g. The fee should be set at a high amount such as a third or a half of the average value of a mature animal. Since it is for life, perhaps 10 years, even a fee of 200,000 Tshs. would only amount to 20,000Tshs.a year. Moreover, the high fee demanded for a calf or yearling would force the owner to consider whether he really wants to keep it instead of selling it, and,
h. The penalty for non compliance would be 500,000Tshs. Fees for occasional grazing by outsiders for a single season should also be publicized to be paid by pastoralists wishing to bring their cattle in during one dry season only. They would not be allowed to come in as of right; if the wetland condition is poor no tags may be issued for that season. The proposed arrangements are:

85
a. In relation to a 200,000 Tshs. lifetime fee, the single year fee would need to be about 50,000 Tshs.; b. A different style of tag would be used without numbers on them, they would be colour coded with a different
colour for each year, and, c. Each wetland area would decide in advance how many tags it would issue for the year, in relation to the state
of its grazing resource. Authorities must approach the subject of fee setting with some care, the fees should reflect the state of the wetland and not what the owner is thought to be able to afford to pay. If it decides to set the fees at say an “affordable” level of 100,000Tshs (or less), and as a result the cattle numbers are not reduced, then there will be a crisis in the following wet season when there will not be enough places in the village livestock lands to maintain all of the cattle that have been registered. Such an outcome would be an embarrassment for the authorities and it would only be overcome once again by forced expulsion (and return of fees) or at least a campaign for supplementary feeding. Agreed, the proposed fees are deliberately set high but the object is to protect the wetlands by substantially reducing the numbers of cattle there. The 12 billion Tshs. that could be collected in the first year would enforce the sale of cattle or their removal. Equally, it will pay for the recruitment of assistant livestock officers (plus motorcycles) and additional police support to enforce the bylaws. However, in succeeding years a team would tour the villages tagging and branding the yearlings and calves only, raising only 2 – 3 billion Tshs. The collection of fees, tagging and branding would be the responsibility For tagging and branding animals will fall to the District Agriculture and Livestock Development Officer (DALDO). The DALDO in the said wetlands will be provided with a number of ear-tags that he will issue to village livestock extension officers (VALEOs) to sell and ear-tag and brand all livestock in his area. All animals more than 9-months old will be ear tagged. Calves less than 9 months will be branded with the Wetland Brand. At the end of the month, the VALOs would report to DALDO office and remit the money collected through the sale of ear-tags for that period. The sales would be supported by receipts that include the names of the livestock keepers and the tag numbers and issued to them. Once the VALEOs hand the money to the DALDOs office then more ear tags will be issued to him. This process will be repeated over time until all fees have been collected from the cattle in the wetlands. To enhance selling and tagging livestock in the selected villages, the VALEOs will be given a bonus for the number of tags sold to boost the working morale. This bonus will be decided upon by the DC and DALDO of the wetland district.
8.3.5. Establishment of Agro-pastoralism in Wetlands: A second radical solution to maintaining cattle all year round in the wetlands is to promote the sale of the cattle lands to the cattle owners. This will promote responsibility among owners by allowing them to assure themselves that they can keep their animals somewhere nearby when the wetlands are closed for grazing. This would be a new departure for land ownership in Tanzania; but our proposal would be limited only to the three major wetlands in the first instance, only to livestock grazing land in the villages, and only to the villages that volunteered to be a part of the pilot project. Legal provision for this could be passed under the Participating villages would offer for leasehold sale the land that is shown in their village plan as for the use of livestock. The lease should be of a sufficient period that the buyer can expect that if he improves the grazing his children will benefit, say by a lease of 50 years. Prospective buyers would have to fence the perimeter of their plot as a condition of purchase and show their plan for providing cattle drinking water (roof collection or a small charco dam and pipe supply). Failure to maintain the fences, or to install water supplies, would be a break of the leasehold conditions and the village could apply to reclaim the farm unit from the buyer.
The advantages accruing to the participating villages are:
a. An agreed (major) part of the sale money would go to the village for their use, the remainder would go to the District to register and administer the lease;
b. There would be an annual rental income to the village from the leased land;

86
c. They would select the stock owners to whom they sell, and choose ones they would want to have as neighbours thus avoiding conflict (“good fences make good neighbours”);
d. They could also agree on sale terms for straw grazing or delivery, and, e. The land would be more likely to be improved.
In the first instance the proposal should be interesting for the few villages that have little or no cattle owners and an excess of livestock land. The village council should rise to the chance to raise capital from livestock owners even though they lose direct control over the land that they sell. Assuming an interest is shown in participation the first villages could be assisted in preparing their plans for the sale, but whether there would be enough funds from the WU or whether support could come from the first year grazing fees would have to be investigated.
8.3.6. Additional WFIs: a. Introduction of fodder trees: A wetland friendly investment to help maintain the fences as well as to provide more feed should then become attractive to the new owner. Fodder trees of Leucaena spp can be promoted by supporting the production of saplings. The trees can be planted in the fence lines where they will help to support the wires and reduce maintenance costs. Also they will provide leguminous browse fodder and shade for the cattle. b. Subdivision fencing: Will allow the new owner to use rotational grazing, resting a pasture better grazing management to (that has no interest under communal ownership) can now be promoted. c. Pasture improvement: Using seeds, all or part of a pasture can be closed off for a season to allow planting, weeding, flowering, and light grazing all of which will take about a year, in order to establish a more productive pasture. d. Urea Molasses distribution: The proposal by the consultants to promote the manufacture of molasses based supplements was considered inappropriate, and so it was not followed up. However, it is again put forward as a WFI. It is doubtful whether the sums of money on offer for the WFIs could have more than a minor part to play in starting the venture. More likely it would be able to give encouragement, and perhaps later help with promotional material. The Kilombero Sugar Company takes its responsibility for promoting welfare in the Valley and supporting small business initiatives so we would expect that they would be favourably disposed towards a carefully prepared pilot project. Among other things the initial proposal would need to consider: i. The design of the final ration (total daily intake) of the cattle; ii. Therefore the role of the supplement; iii. Whether liquid is better than a solid based supplement iv. The distribution system for the liquid feed; v. Storage requirements; vi. Whether a local sales method must be considered; vii. The projected final price to be paid by the stock owner, and, viii. The prospective cost benefit of the feed to the buyer. Although it appears to be a simple thing to test by mixing up a few litres and see how it goes, but experience has taught that, unless the whole system is designed at the outset, pilot trials fail more often than they succeed. e. Improved straw utilization: with better relationships with other villagers it should be easier to gain access to straw, either to graze it in the field or to bring it to his holding. Then with urea-molasses supplementation animal production will increase dramatically. While past attempts to settle nomadic pastoralists have failed the combination of land shortages and financial inducements will gradually cause the pastoralists (especially agro-pastoralists) to respond to the advantages of improving grazing to increase their cattle productivity or help to hold more animals, and they will become open to more initiatives to improve their husbandry skills. In fact they will become less like pastoralists and more like livestock farmers.

87
8.4. Sustainable Irrigation Management In Wetlands For each improvement to the situation, this section describes for irrigation, suggested designs to describe, simple remedial actions, in the form of step by step approaches to micro-projects that communities can carry out. These are recommend recipes for Wetland Friendly Investments for extension workers, to give ideas to communities during PRA planning and during O&OD, so communities/users can mitigate the problems. Given are detailed methodology of each in a format extension workers can use to develop micro-projects.
8.4.1. Introduction to WI Problems: The principle theme for this Guide has been to propose systems for sustainable irrigation. Several options for actions are open to assist the authorities to reduce and sustainable manage the irrigation in the wetlands that, if they succeed will lead on to other (smaller) WFIs. They are:
List of WFI for Traditional Irrigation Micro-projects (From 2009 NWWG workshop):
a. Proper intakes, regulate open and closing. b. Improve supply canals.
c. Install drains. d. Install furrows for field to field irrigation is used.
e. Synchronize irrigation times and dates. f. By laws.
g. Better training in operations and maintenance.
Main problem is loss of water through this irrigation system is 7 fold (16 % efficiency) during dry season, because of:
WFI to Improve Irrigation Efficiency
a. More recently, schemes tend to encroach on wetlands (low lying areas) as the best site to develop paddy or grow crops. b. Uncontrolled intake (through poor management and poor infrastructure) means that water throughout the year (12 months) is diverted and sits in the field where evaporation loss (1.5m3/m2) and seepage (1.5m3/m2) adds to water loss, in excess of water rights.
Sometimes because they do not close the intake when not cultivating. Locks are not placed on the gates. c. 10-15% from seepage or spillage from supply canal.
d. 30-40% from cascading from one paddy to the other, sometimes 4-5 to reach the late farmer. Sitting water is taken from system and losses to evaporation and seepage.
e. 20-30 % from improper drainage. Water does not return to the main flow, so water soaks away and is lost to river flow or wetland. f. The above are technical, but poor management of schemes is also a problem. Need change in awareness both of community,
extension and engineers. g. Water pollution, due to water back into system. Also abuse of toxins to kill ducks and fish.
8.4.2. WFI Suggestions: To solve the above problems, solutions for micro-projects include:
WFI in Irrigation
a. Encroachment: EMA requires development agency to ensure undertake EIA to protect wetland. Also EMA and water act, limits permanent development 60-200 m from a river bank (wetland). Ramsar classifies rice paddy as a wetland, it enhances bio-diversity,
and so the EIA must make a balance on livelihoods and “wise use”. b. Intake: Finance a water user association to coordinate this investment, to establish by laws, to manage water user rights as per
permit and to manage seasonal flows. Water authority must check on flows as per permits, and ensure gates are locked. Advocate for simple, cost effective, farm designs, with affordable, community built and manage water barriers and intakes (like stone filled
gabions!). c. Supply canal: District development funds is to ensure canals are maintained, proper construction to resist flood damage, but not
costly cement lining. Some water loss is acceptable as it re-charges the wetland. d. Cascade filling: Encourage community to establish furrows on the side of a field to permit field to field water flow. Advise synchronized cropping. By laws on common timetable, so close water when all are cropped (eg. enforce 1st June close all intakes).
e. Drainage: Improve simple, earthen drainage canals to collect and take water back to river/wetland.

88
f. Awareness: For all the above need manual, CEPA materials and committed extension delivery services, coupled with capacity building to make O&OD process more aware of the SWOT analysis to restore the wetlands. Advocate short season rice to reduce
period under flooding. g. Pollution: Need to regulate through EIA. Create awareness and law enforcement. If polluted, best to NOT return the water to river.
Valley Bottom WFI: Three systems: a. Bunding in dry area river beds to hold water in field for 3-4 months. b. Expose water table for growing crops in valley beds in river or in steep areas. c. Divert small streams to irrigate crops or fish ponds. Problems: a. Pollution of water systems from pesticides and fertilizers. b. Adds erosion and sedimentation. c. Loss in bio-diversity loss, due to clearing of vegetation. Suggestions to make wetland friendly: a. Introduce by laws at village level, specific to type of vinyungu, distinguishing between charco dam and river. b. Enforce EMA that no cultivation 60 m from river bank. c. Clarify the definition of 60 m to the community. Make them aware. d. Encourage other IGA. e. Plant selected, choose less water use, indigenous trees within 60 m to reduce evaporation (eg. ficus and fruit
trees) as a way to increase income, such as bee keeping. f. Drain water (Rainfall harvesting???) in wet season and store in dams for use in dry. Dams to be constructed
away from river, for crop production in dry season. g. To encourage proper utilization through forming water users association (WUA) whose practice must be
compatible to environment of that place. Association by laws must be culturally responsive to traditional ways.
h. Use ground water extraction for irrigation (eg boreholes).
8.4.3. Recommendations for improving irrigation water management a. Irrigation management at farm level: The following measures should be implemented to sustain irrigated agriculture at farm level: a. Restricting the area of dry season non-rice cropping under irrigation; b. Reducing the depth of water in rice fields from 18 cm to 12 cm; c. Using short season varieties for late-transplanted rice; d. Shortening the time taken to prepare fields and transplant rice; e. Locating nurseries in upstream areas; f. Except for nurseries, agreeing a start date of irrigation (e.g. not before 1st November); g. Banning of very late transplanting after an agreed date to be negotiated each year depending on the climate
and river flows; h. Effectively banning (through early cessation of irrigation, and no second irrigation after harvesting)
secondary re-growth of rice; i. Ceasing irrigation 3-4 weeks before expected harvesting date; j. Encouraging the use of furrows in vijaruba to convey and control water; k. Utilizing smaller vijaruba where possible; l. Zoning priority land and identifying land not to be cultivated unless it is very wet; m. Agreeing the closure of the main intake for an agreed period during the dry season;

89
n. Moving out of abandoned land; o. Encouraging contiguous cultivation and discouraging late leasing of plots in both upstream and downstream
areas; p. Reducing intake flows during heavy rainfall periods; q. Installing boreholes to reduce losses via canal distribution of domestic water (this also improves quality of
drinking water). b. Increase in irrigation efficiency and productivity Irrigation efficiency/productivity is a multi-faceted collection of indicators varying in space and time. In irrigation systems, irrigation efficiency can be defined in terms of crop consumptive water use, irrigated area, harvested crop yield and total amount of water stored in the fields for the entire growing period. In this case, no single indicator can explain the irrigation efficiency/productivity. Rather, a combination of different water and non-water management indicators can give a better and more accurate picture. However, irrigation efficiency/productivity is important because when it is improved, it may lead to saving of water for inter-sectoral allocation within or outside the system, catchment or basin. c. Improving Institutional arrangements There is great need for clear definition and assignment of specific responsibilities, not only to the Ministry of Water and Agriculture but to all relevant ministries/departments which should be involved in the irrigation development programmes. The is also great need for defining the roles or responsibilities of villagers in the planning, construction and management of irrigation schemes in their villages. Conceptually, in order to achieve efficient management, control, minimal duplication of efforts and better allocation of resources, irrigation development should be under the control of one institution.. As goals or benefits are multisectoral, there is a great need for cooperation or participation of all relevant ministries/department. Representatives from those institutions should work as a team at regional, district, divisional or ward levels (if any). In this way expertise and cooperation from several sources could be solicited. Yet only the Ministry of Water or Agriculture alone would have the overall responsibility for irrigation development. At divisional or ward level, there should be irrigation extension services in order: a. To help villagers to identify their water problems and formulate plans of solving these problems along the
path of self-reliance; b. To assist in mobilizating of villagers to participate fully in irrigation development programmes; c. To assist in the establishment and functioning of village irrigation committees; d. To educate villagers on the socio-economic benefits of having improved irrigation in the villages; e. To train and supervise irrigation scheme attendants in the villages; f. To render technical assistance to villagers in the maintenance and operation of the village irrigation scheme; g. To form a connecting link between district authorities and villages. d. Involvement of women in irrigation planning and management Women, as primary users and beneficiaries of irrigation schemes, contribute greatly towards the sustainable irrigation management. Although the water policy stipulates that village water committees must be composed of not less than 50% women members, participation of women in management has been minimal in most irrigation schemes. Poor operation of irrigation schemes can be attributed to lack of or delayed involvement of the primary users, that is women, and also if the technology used does not comply with their preferences they always tend to reject it. e. Village ownership of Improved irrigation scheme The sense of ownership of modern/improved irrigation scheme from the village point of view must be acquired right from the inception of the irrigation scheme installation process. The way irrigation scheme is introduced to

90
villagers, will to a large extent determine villagers’ attitude towards the scheme after its completion. If the installation of the water scheme is a result of the felt need of villagers, chances will be great for villagers to have a sense of ownership for the scheme after its completion. The need of the scheme to the villagers should be created through the educational process in which social and economic benefits will have to be explained e.g. sustainable crop production and food security. The other way of creating a sense of ownership and responsibility is by involving villagers in the irrigation scheme from planning and decision-making through designing, construction, operation and management. This kind of involvement will help to instil in their minds, a sense of local ownership and responsibility, which will ensure that they actually use the scheme, prevent damage to it, repair it when out of order and help in achieving the benefits expected from the irrigation scheme. This will ensure that the scheme functions all year around. If there is no feeling that this “scheme is ours” and that it is important that it works for the common good, there will be no one to take responsibility for its operation and management.
8.5. Sustainable Wildlife Management in Wetlands Wildlife are under threat from anthropogenic actions, and wetlands represent a major conflict zone as they are at a cross-roads between human and wildlife needs, form major migratory corridors and are areas of conflict between wildlife and livestock.
Anthropogenic Pressures on Wildlife
a. Prey availability: Prey for predators is becoming diminished due to loss from poaching, habitat destruction, grazing competition with domestic livestock, etc.
b. Land use/Cover Change: Agricultural expansion limits migration, erodes wildlife corridors, causes conflict, etc. c. Anthropogenic Killing/Persecution: Indiscriminate methods of killing where human conflict arises threatening life, livestock or crop
damage (eg using poisoning, snare lines, traps, etc), or accidental such as road kills, etc. d. Inadequate Management: Killing for food (Bushmeat) or for products (ivory, skins, horns, etc) in PA and outside, due to no respect
for legal framework, ineefective anti-poaching, lack of education and non-involvement of user groups, lack of land use plans, slow WMA process, etc
e. Disease: Could be human related (eg from rabies from domestic animals/livestock or toxins from pesticide use, cattle dipping or from refuse dumps).
f. Inter-specific Competition: Competition between species due to crowding (eg Lions can prey on others). g. Unregulated Tourism: Both the disturbance from photographic eco-tourism and the pressures from hunting tourism, and live trade,
etc
WMA Steps: WMA can add value to wildlife on village land and have a laid down procedure to follow:
1. Village Assembly agrees to form WMA based on Village Council recommendation (Signed minutes).
2. Villages form a CBO and register it at Ministry of Home Affairs (CBO Constitution).
3. The CBO prepares a Strategic Plan (10 Year Strategy).
4. Villages prepare Land Use Plans, surveyed and registered (District approved land certificate).
5. Land use plans are subjected to Environmental Impact Assessment. (EIA Report).
6. Villages prepare by-laws to support the land use plans (By Laws approved at District).
7. CBO prepares a Resource Management Zone Plan (or GMP) (WD approved)
8. CBO applies to Director Wildlife for AA status (WD gives AA Certificate).
9. CBO/AA applies for user rights (WD gives User Right Certificate).
10. CBO/AA applies to WD for hunting block (WD awards Block)
12. CBO/AA enter investment agreements (PPP Contracts)
13. WMA investments subjected to EIA (EIA Report)

91
8.6. Climate Change Mitigation and Wetlands (NAPA, 2007): The following are the some of the ways of mitigating climate change effect on wetlands in a sustainable way through WFI:
Suggestions for Climate Change Mitigation WFI
a. Improve water efficiency in crop production, especially irrigation, to boost production and conserve water. b. Introduce alternative farming systems which capitalize on water harvesting systems in dry land areas (eg rainwater bunding).
c. Develop alternative water storage programs (such as dams) and advance new technologies for communities to store domestic water captured from roof tops.
d. Establish more community based catchments conservation and management programs in key watersheds. e. Explore and invest in alternative clean energy sources (e.g. Wind, Solar, bio-diesel, etc). to compensate for potential future lose in
hydro-power potential. f. Develop community wetland wild fire prevention plans and programs, and fire breaks.
g. Establish and strengthen community awareness programs on preventable major health hazards from water borne diseases. h. Implement sustainable tourism activities in the wetlands areas.
i. Relocation of vulnerable communities from low-lying coastal areas. j. Enhance wildlife extension services and assistance to rural communities in managing wildlife resources through value added eco-
tourism ventures through WMAs. k. Establish more water harvesting and recycling programs.
l. Construction of artificial structures, (e.g., sea walls) and artificially placing sand on the beaches and coastal drainage to protect, and introduce new high water beach management systems.
m. Establish good land tenure system and facilitate sustainable human settlements, so that they will own and protect resources on their land.
Noting wetlands have a high carbon fixing and storing capacity, it is possible that they could benefit from future funding under the global carbon fund called Reduction of Deforestation and Degradation (REDD). WFI could also target to fix carbon in wetlands (eg through aquatic weed management) and prevent further degradation of the carbon storage capacity of wetlands (eg by restoration), and benefit from payment for services at USD 5-10/Ct. What this means is that western industries who have a high carbon debit, could pay communities to fix carbon and benefit from carbon credits from this system.

92
CHAPTER NINE CONCLUDING REMARKS AND WAY FORWARD
This concluding section looks as the way forward
9.1. General Remarks The information contained in this book provides a useful gateway for CEPA outreach institutions for informing the local councilors, community and students about the importance of wetlands and how they should be managed sustainably. It also stresses on the desire that development must be consultative and participatory by all the local residents, taking into account all their needs, so that all their use of wetlands, could be incorporated into a holistic planning process which must be in line with MTEF and mainstreamed in LGA planning processes so as to eliminate potential conflicts and instill a multi-sector, holistic approach from central to village level. It is a call to action for all stakeholders to protect wetlands and to use them sustainably and wisely for the benefit of the present and future generations. It is further a wish of this Guide to stimulate more knowledge research for all stakeholders in the conservation field, and it is an aim that the CEPA outreach will provide policy makers, planners and decision makers with awareness of wetland services and functions for more informed decision making. The importance of wetlands should be increased in national education programs, and the aim of this Guide is to help, to increase this awareness. It also highlights how wetlands can be wisely used to generate income, in ways which are compatible with environmental protection and add value to resource use, eg eco-tourism. Emphasis is also placed on the legislation, on the purpose of the bans and restrictions in wetland use, highlighting both the necessity for such restrictions, and the consequences if they are ignored. Increase environmental awareness at all locations, especially in wetland areas where the majority of residents are farmers, should help encourage the application of more sustainable, agro-environmental programs. In addition, seminars in combination with techno-economic packages (like sustainable irrigation, sustainable livestock, etc) are recommended to encourage wise use, but also to consider the cultivation of crops which are more suitable to the natural climatic conditions of the area, i.e. crops, which do not need intensive irrigation and are therefore, more suited to the area, and more water friendly.
9.2. Way Forward for SWMP:
Fact Box 63: Suggested Next Steps for SWM:
1. SWMP: Government and DP need to develop a SWM Program document and secure joint & sector support under JAST, perhaps
as an integral part of the DeNRM SWAp. 2. SEA: Strategic Environmental Assessment of wetlands needs to show policy makers the economic importance of wetlands in
general and key ones in particular. 3. SWM Regulations: WD and VPO to formulate guidelines for wise use of wetlands and wetland reserve regulations.
4. Awareness: All NAWESCO sectors, Central & Local Government need greater awareness of economic value of wetland services to include SWM in N, D & V Dev Plans.
5. SWM Guidelines: Government needs to prepare best practice thematic guidelines for wise use of wetlands (= WFI). 6. Training: Capacity building in SWM and AFM needs to be anchored at government colleges (Mweka and Hombolo).
7. CEPA: The capacity of MCT to outreach more schools and communities needs to be strengthened, and added to plans for an Environmental Education Center.

93
REFERENCES The following references were consulted and quoted in text: ASDP (2006) Irrigation Master Plan: 180p. Baldus and Caldwell (2004), Tourist Hunting and its Role in Development of WMAs in Tanzania. Game ranching Symposium, Paris: 45p. Danida/WB (2000)
Economic Survey (2006), Ministry of Planning, Environmental Statistics (2005), Environmental Statistics: 2005, National Bureau of Statistics: 90p Internet (2003). Utete Celebrates world wetlands day February 2nd 2003. IUCN (2007) Economic Assessment of Wetlands. 20p. MCT (1995) Kiongozi Cha Mwalimu Juu ya Ardhiowevu . Malihai Clubs of Tanzania, School Clubs Brochure on Wetlands: 20 p MKUKUTA (2010) Poverty Reduction Strategy II: 200 p. NAPA (2007) National Action Plan of Action for Climate Change: 200 p. PMO-RALG (2007) Administration and Finance Management Manual for PFM and SWM: 110 p. Ramsar WWD (2010) Wetlands and Climate Change. World Wetlands Day Brochure: 20p. Ramsar WWD (2011) Forests for Water and Wetlands. World Wetlands Day Brochure: 20 p Roggeri (1995) Tropical Freshwater Wetlands, Kluwer Academic Publishers (Netherlands): 349p. SOER (2006) State of Environment Report. Division of Environment, VPO: 159 p. SOER (2008) State of Environment Report. Division of Environment, VPO: 290 p. Statistical Abstracts (2002), National Bureau of Statistics: 131 p. T.J Davis (eds). (1993) Towards the Wise Use of Wetlands. Report of the Ramsar Convention. Wise Use Project. Tanzania Wildlife Magazine (2001) (Kakakuona) No. 21 of April- June 2001, The World Wetlands day. TNRF (2009) Pastoralism. TRAFFIC (2000) Vice Presidents Office (2006) Strategy for Urgent Action on Land and Catchment Management: 14 p. WCST (2003) Wetlands Fact Box: 10 p. Wildlife Division (2008) SWM Research Agenda: 100 p.

94
Wildlife Division (2008) Review of SWM Manual. NWWG CEPA SC meeting Proceedings: 150 p. Wildlife Division (2008) Review of CEPA Wetlands Strategy and Materials. NWWG CEPA SC Meeting Proceedings: 220 p. Wildlife Policy (2007) Wildlife Policy: 50 p. Millennium Ecosystem Assessment (MEA), 2005. Assessment: Ecosystems and Human Well- being: A Framework for Assessment. Island Press

95
Fact Box 37:
Key Wetlands Terms and Definitions
Use this Fact box to supplement the definitions given of acronyms, it’s a dictionary of useful terms, a user friendly means of reading the
text and of understanding the words used and for teaching the vocabulary of wetlands management. Agro-chemicals: Man-made chemicals such as pesticides, herbicides and fertilizers used in agriculture and livestock
husbandry. Aquaculture: The farming of fish. Authorized Association: Means a community-based organization (CBO) whose primary objective is to conserve wildlife resources on
village land for the benefit of the local community members who are ordinarily residing in that area and who are given the user right mandate by the Director of Wildlife to do so on village land that has been designated as a WMA.
Biodiversity: The variety of life or species in an area that makes up the ecosystem or habitat, plus the genetic wealth
within a species and the components of the ecosystem in which the organism lives. Biomass: The amount of organic matter plant or animal that lives in a given area. Buffer Zones: Areas of unconverted (to human use) ecosystem (either wetland, forest or PA) that is left in the system to
protect or buffer the area from human and development impacts that would otherwise adversely affect the area or migration corridor.
Bunds: Small walls surrounding an area either to keep water in (eg rice field) or out (tide or flood surge) of an area,
and is usually made of compacted clay soils and commonly used in dry land areas as “rainwater harvesting
irrigation schemes”. Bushmeat: Any product (legal or illegal) from a wild animal that is sold or consumed as food, is considered as
Bushmeat. Carrying Capacity: Is the ability of the environment to sustain a certain amount of pressure from use by man or animal.
Exceeding this will lead to environmental degradation. Catchment: All the area containing a water course that drains down into the lowest point, the wetland area, surrounded
by a watershed and the surrounding catchment is that area excluding the wetland. Climate Change: Is a global phenomenon where, as a result of burning fossil and carbon fuels (ie oil, gas, coal, fuelwood,
peat, charcoal, bush fires), carbon dioxide emissions and other greenhouse gases (eg methane, etc) are released in the atmosphere are preventing the escape of heat from the earth, causing global warming, melting ice caps, rising sea levels and enhancing drought risk, changing weather patterns.
Closed basin: A river basin where the drainage collects all water from rainfall and seepage internally into a wetland that is
not connected to any other system. Co-management: Means the shared responsibility between state and community in the joint, participatory, wise use
management of a resource for the common good of the local community and the nation at large, usually formalized through some CBNRM act (eg like JFM, AA or BMU).
Common Land: Refers to land in a village owned by the community as a whole and which is to be recorded as such in the
Village Land Registry. Most village land forests fall within common land. Core Protected Areas: Means National Parks, Game Reserves, Ngorongoro Conservation Area (NCA), Wetlands Reserves and any
other protected (conservation) area declared under the Wildlife Conservation Act (2009) or any other law (ie Environment Management Act, Marine Parks and Reserves Act, Forestry Act, etc).

96
Conservation: Means an option for protection, management and sustainable utilization of resources, habitat, ecosystem and the non-living environment supporting such resources, habitat or ecosystem, with actual or potential use value so that it can continue to function normally to fulfil its functions and provide goods and services.
Conservation Areas: Includes “protected areas”, set aside by law as: Game Reserves (GR), Game Controlled Area (GCA),
Corridor Area, Migratory Routes, Buffer zone and dispersal zone, Wildlife Management Areas (WMA), National Parks (NP), Ngorongoro Conservation Area (NCA), antiquities (historical, cultural, sacred or traditional) areas, marine parks and reserves, forest reserves (FR), catchment forest, wetland reserves, Ramsar sites, species management area, etc.
Conversion: Changing the former condition of the environment through some human intervention, such as encroachment
in wetlands that changes or alters their functions due to removal of natural vegetation and replacement by crops, or in-filling for urban or agricultural or industrial development.
Commercial: The sale of products for profit and personal gain, part of the economic community that trade in natural
resource products. Community: The public at large, generally associated with village living people who use the environment but could also
be the economic community, people who trade in the environmental goods and products. Community Based Conservation: Community involvement in conservation around PA or on village land = CBC. Corridor (Game) Is land area, along migratory or transit routes used by wildlife moving from one ecosystem to another in
search of basic needs, habitat, food, water and breeding grounds, generally between wet and dry season grazing and watering areas (TAWIRI recently listed 31 new game corridors).
Councilor An elected member of the District Council coming from Ward level. Declaration Public notification at the district level that a natural resource (forest, fish, wetlands or wildlife) has been set
aside and declared for management purposes by the village. Effected through notification to the District Executive Director and through recording in the District Register of Village Land Reserves.
Decomposition: The natural process which breakdown organic matter by biological, chemical and physical process by
microbes, insects and animals Degradation: Means the reduction in the quality of ecosystem functions, services, habitats, plants, animals, soils, water and
other natural components. Development: An activity carried out in an ecosystem or its catchment/surroundings that will alter, change or affect the
existing status quo or conditions of the environment in a process known as conversion. Diversion: To change the course of flow of run-off or river, stream or spring (generally for human use) so that it no
longer flows downstream and is lost from the natural flows. Drainage: The artificial removal of water or exclusion of water or change in water flow patterns from and to a wetlands
either due to abstraction for other uses, diversion, damming upstream, waste dumping, etc. Ecosystem Is a dynamic complex of plant and animal organisms and food web associations (including human pressures)
and their interaction with the environment in which they live and breed. Ecosystem Services: The benefits that mankind and other biodiversity derives from ecosystem functions that support life,
livelihoods and economic development. Eco-tourism: Tourism based on the scenic beauty of nature, wildlife, wetlands, coastal beaches, ecology, etc where the
biodiversity is the main attraction for photography or game viewing. Effluent: Liquid wastes produced by humans, either biological or chemical or sewage, that is dumped in the aquatic
system, generally as pollution.

97
Encroachment: The act or process of converting all or part of a ecosystem like a wetland into some other form or use, either for agriculture, industry, urban or pasture.
Environmental Flow: Is the minimum water flow that needs to be maintained within a river ecosystem to sustain its ecological
functions, biodiversity and ecosystems services. Evaporation: Means the loss of water from a system due to the conversion from a liquid to gas state either due to heat, by
waterfalls or evapo-transpiration by plants. Export: Means to take or cause any trophy to be taken to any place outside the country. Floodplain: The land either side of a river or lake or wetland like a marsh that floods periodically with excess water flow
when the river or lake rises due to excessive run-off. Flood Recession Irrigation: Schemes established along river banks that are watered by the frequent flooding of the wetlands when the
river flows over its banks. Focal Person: Refers to Program Focal Person or Officer at National, Regional or District level (eg. In forest, fish, wetlands
or wildlife), who has been appointed by management as the lead person in the area for the particular type of resource described.
Forest: All land bearing a vegetative association ecosystem, dominated by trees of any size, exploitable or not, and
capable of producing wood or other products. Forest Land: Land with standing trees, or land set aside for the purpose of forestry. Forest Reserve: A forest protected area, either for production of timber and other forest produce or for protection of forests,
biodiversity and important water catchments, under the terms of the Forest Act. Fresh water: Water that contains little dissolved materials so that it is drinkable (potable) and not salty. Game Controlled Areas: Means an area declared to be a Game Controlled Area by an order made under section 15 of the Wildlife Act
and can include both open areas and village lands. Game Reserve: Means reserved area for highest category of managing wildlife resources whereby both consumptive and non
consumptive use is allowed and regulated by the Director of Wildlife. Gazettement: Public notification at the national level through announcement by the Minister in the Government Gazette
that a natural resource (ie. forest, fish, wetlands, marine or wildlife) has been reserved, protected or sustainably managed. Any NR and a VLR may be gazetted. Gazettement is voluntary for a VLR, which may remain a Declared Reserve with same effect (eg WMA).
General Land: Means Government or “open land”, land owned by either central or local governments and under the
ultimate authority of the Commissioner of Lands. Gravity-fed Irrigation: Schemes where water is diverted from a natural source and conveyed by canals to irrigated fields. Groundwater: Subsurface water in permeable rock strata often the overlying soil is saturated and damp. Hunting: Means any act directed or incidental to the killing of wild animals. Hunting Quota: Means number of animals set aside based on scientific data for the purpose of hunting over a given period Hunting Block: Means any area with game animals which has been delineated or set aside and approved by the Director of
Wildlife for trophy hunting. Hydrology: The study of the movement of water through the hydrological (water) cycle, from clouds, to rain, on land,
run-off into streams, rivers, lakes and sea, and back by evaporation. Institution: A public or private organization responsible for management of a resource, sector or area.

98
Inventory: A process of documenting or listing the bio-diversity and ecosystem resources and their status as a
description of the environment and its condition. Invertebrates: Animals without backbone, eg insects, snails, worms, etc. Irrigation: Means the use of water applied to a particular location for crop growing. Irrigation Efficiency: Is the ratio between amount of water used for crop growth versus the amount diverted for that purpose. (ie it
measures the losses along the way = efficiency of use). Irrigator Organizations: Means the association of all farmers in an irrigation scheme, organized primarily to optimally manage the
operation and maintenance of the scheme. Joint Venture: Means an arrangement between village authorities (or CBO) and a private sector partner for investment in
specific business activities on village land for joint sustainable management and development of the resource base, for the benefit of the village land owners.
Land Use: Means activities carried out on a given piece of land. Local Govern Authority: A Municipal or District Council, comprising an elected Councilor from each Ward in the District, and a main
function of which is to support Village Councils. Local Community: As ascribed in the Local Government Act (1982), means people living next to a natural resource (ie. forest,
fish, wetlands or wildlife) who are the primary user group and managers. Management Authority: Is a recognized, established institution with the mandate to manage a particular PA, piece of land or wetland
(eg AA of WMAs). Management Zone A subdivision of a natural resource (ie. forest, fish, wetlands or wildlife) into different management areas for
specific management objectives (such as biodiversity, recreation, community use). National Park Is a reserve of natural or semi-natural land, declared or owned by a Government, set aside for human
recreation and enjoyment, animal and environmental protection and which is restricted from most development and zero utilization of wildlife.
Observer Means a tourist accompanying a tourist hunter but he or she is not hunting. Open Basin: A catchment basin in which run-off is captured and flows outward. Open water: Wetland where the emergent vegetations are absent, usually due to depth and is flod in central parts or fast
flowing sterams. Pastoralism Is the tradition of nomadic herding of cattle, generally dependent on wetlands for dry season grazing and
watering. Pathogens: Organisms that are harmful, mainly virus, bacteria and fungus that causes disease in humans and animals. Peat: Soil comprising mainly organic materials that is partially decomposed, black in colour, high in carbon
content, wet all year round. Percolation: Like seepage, the passage of water through the soil and rock substrate to the water table Photographic Tourism: Means non consumptive use of wildlife resources whereby a tourist does not include taking-off of wildlife. Poachers: Means someone who kills or takes or possess wild animals or part there-of illegally. Pollution: The addition of materials (solid, liquid, heat or gas) into the environment that alters its state, reduces its
functions and is harmful to the ecosystem.
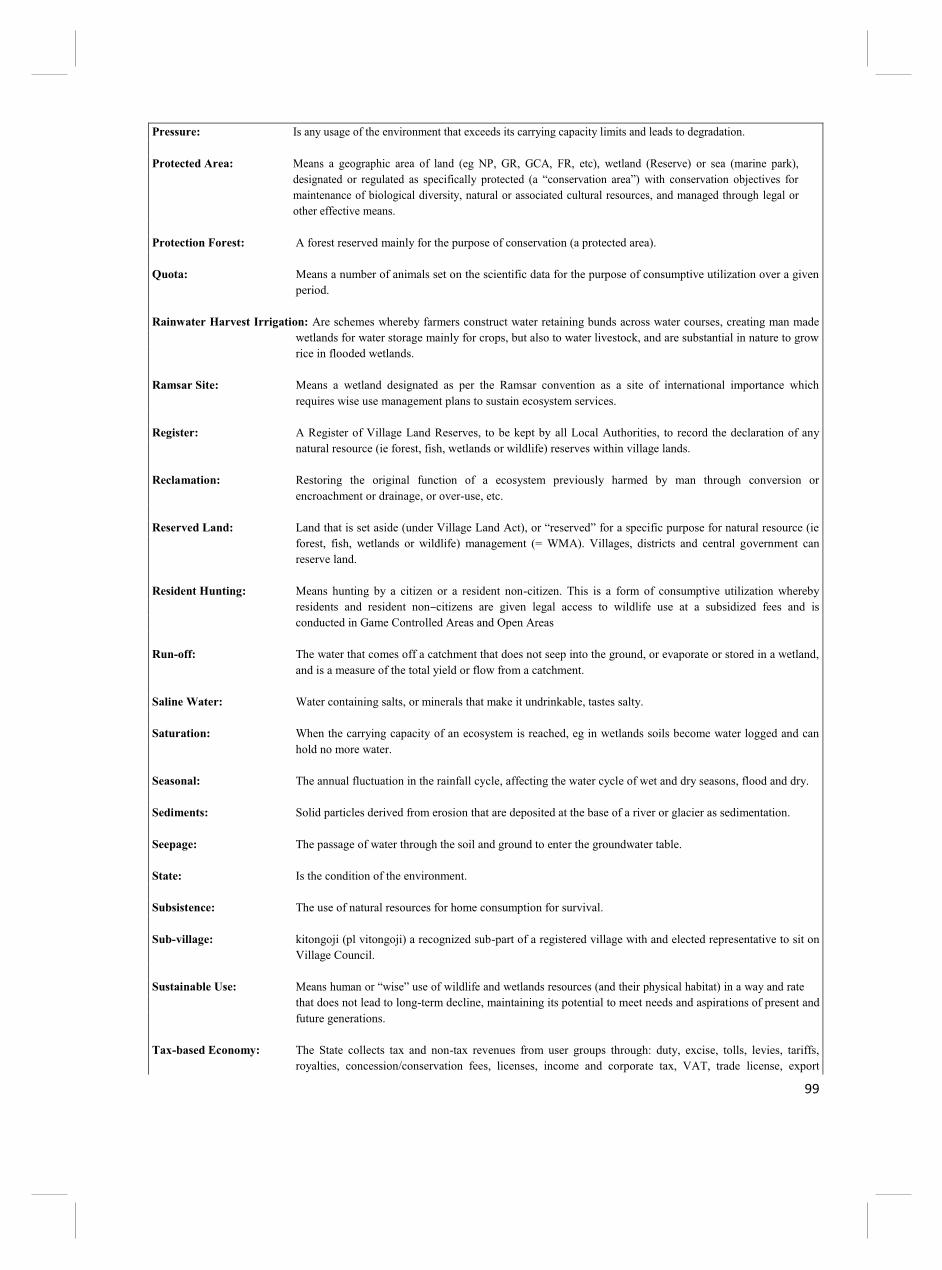
99
Pressure: Is any usage of the environment that exceeds its carrying capacity limits and leads to degradation. Protected Area: Means a geographic area of land (eg NP, GR, GCA, FR, etc), wetland (Reserve) or sea (marine park),
designated or regulated as specifically protected (a “conservation area”) with conservation objectives for maintenance of biological diversity, natural or associated cultural resources, and managed through legal or other effective means.
Protection Forest: A forest reserved mainly for the purpose of conservation (a protected area). Quota: Means a number of animals set on the scientific data for the purpose of consumptive utilization over a given
period. Rainwater Harvest Irrigation: Are schemes whereby farmers construct water retaining bunds across water courses, creating man made
wetlands for water storage mainly for crops, but also to water livestock, and are substantial in nature to grow rice in flooded wetlands.
Ramsar Site: Means a wetland designated as per the Ramsar convention as a site of international importance which
requires wise use management plans to sustain ecosystem services. Register: A Register of Village Land Reserves, to be kept by all Local Authorities, to record the declaration of any
natural resource (ie forest, fish, wetlands or wildlife) reserves within village lands. Reclamation: Restoring the original function of a ecosystem previously harmed by man through conversion or
encroachment or drainage, or over-use, etc. Reserved Land: Land that is set aside (under Village Land Act), or “reserved” for a specific purpose for natural resource (ie
forest, fish, wetlands or wildlife) management (= WMA). Villages, districts and central government can reserve land.
Resident Hunting: Means hunting by a citizen or a resident non-citizen. This is a form of consumptive utilization whereby
residents and resident non–citizens are given legal access to wildlife use at a subsidized fees and is conducted in Game Controlled Areas and Open Areas
Run-off: The water that comes off a catchment that does not seep into the ground, or evaporate or stored in a wetland,
and is a measure of the total yield or flow from a catchment. Saline Water: Water containing salts, or minerals that make it undrinkable, tastes salty. Saturation: When the carrying capacity of an ecosystem is reached, eg in wetlands soils become water logged and can
hold no more water. Seasonal: The annual fluctuation in the rainfall cycle, affecting the water cycle of wet and dry seasons, flood and dry. Sediments: Solid particles derived from erosion that are deposited at the base of a river or glacier as sedimentation. Seepage: The passage of water through the soil and ground to enter the groundwater table. State: Is the condition of the environment. Subsistence: The use of natural resources for home consumption for survival. Sub-village: kitongoji (pl vitongoji) a recognized sub-part of a registered village with and elected representative to sit on
Village Council. Sustainable Use: Means human or “wise” use of wildlife and wetlands resources (and their physical habitat) in a way and rate
that does not lead to long-term decline, maintaining its potential to meet needs and aspirations of present and future generations.
Tax-based Economy: The State collects tax and non-tax revenues from user groups through: duty, excise, tolls, levies, tariffs,
royalties, concession/conservation fees, licenses, income and corporate tax, VAT, trade license, export

100
licenses, tourism licenses, etc as part of the income for the State to fund the civil services to provide sector governance, law enforcement, extension/training, research, infrastructure and social services, etc. Without making “users/polluters pay”, the State is subsidizing NR use, and is dependent on donors for NRM funding.
Threat: The likelihood of an action or inaction by humans and animals that can harm, the environment, destroy or
degrade its functions and quality Transpiration: The transfer of water through a plant and its evaporation from the leaves into the atmosphere. Tourist Hunting Means consumptive use of wildlife by visiting foreigners whereby intended visitors prefer to obtain animal
trophies and pay high fees for the privilege. Trophy Means any animal alive or dead, and any horn, ivory, tooth, tusk, bone, claw, hoof, skin, meat, hair, feather,
egg or other portion of any animal and includes a manufactured trophy. Trophy Dealer Means any person who is licensed to capture, buy, sell, keep, transport, cut, carve, polish, clean, mount,
preserve or process trophies for commercial purposes. Village Means a registered village, whose members are known as the Village Assembly. They may elect their own
government [Village Council]. This Council manages its own land area [Village Area]. This includes land held by individuals, households and groups as ‘private land’, and land owned by all the villagers, known as ‘common land’ and its natural resources (ie forest, fish, wetlands or wildlife).
Water Table: The upper limit of groundwater stored in the soils or substrate. Water User Association: An organization joining water users around a common source to unite to manage water needs sustainably
and can be made of multi-sector users, notably irrigators, miners, livestock keepers, fishers, hydro-power, wildlife, domestic and industrial.
Wetlands Irrigation: Schemes developed by farmers in valley bottoms whereby water is used to grow vegetables or fish farming
using the natural saturation and rich soil conditions. Wildlife Management Area: Means an area set aside by Village Council for the purpose of conservation of wildlife and other biological
natural resources for which user rights is given under the Wildlife Act. Wetlands: Areas transitional between terrestrial and aquatic environments where the water table is near the surface or
on land and contains a biodiversity of its own. Classified either as marsh, fen, peatland, or water, either natural or man-made, permanent or temporary, static or flowing, fresh, brackish, salty or alkaline, including and inland lakes and coastal marine areas upto depths of 6 metres (at low tide), islands, riparian, mangroves or inter-tidal coastal zones.
Wetland Functions: The ecological processes within a wetland that supports its ecosystem and biological and hydrological
cycles. Wetland Reserves Any wetland declared under the Ramsar Convention as a wetland reserve or protected area (= Ramsar Site),
and as elaborated under EMA and the Wildlife Act 2009, that has been declared by the Minister as a protected area.
Wise Use Sustainable utilization of natural resources (ie forest, fish, wetlands, marine or wildlife) for the benefit of
present and future generations of mankind and other bio-diversity on which man depends.

101
Fact Box 38:
A List of The Important Wetlands of Tanzania
Wetland Name Location Area PA Type (Grid Ref) (ha 000) Status FW Soda SW Bahi Swamp 5o51'S/34o59'E 125.0 1 Balangida Lake 4o22'S/35o18'E 6.0 1 Balangida/Lelu Lake 4o40'S/35o09'E 4.0 1 Balangida Lelu Swamp 4o28'S/34o57'E 25.0 1 Bisongo Lake (Kagera) 2o08'S/30o58'E 0.5 1 Burigi Lake 2o01'S/31o14'E 7.0 GR 1 Burungi Lake 4.0 1 Chada Lake (Rukwa)(Katavi NP) 6o58'S/31o15'E 1.5 NP 1 Chala Lake 0.5 1 Chagu Lake (Moyowosi GR) 0.5 MMRS 1 Eyasi Lake 3o24'S/34o43'E 116.0 1 Duko Lake (Kagera) 1o30S/30o46'E 1 Eluanata Dam (Arusha) 1.1 1 Gorigor Swamp (Ngorongoro NP) 0.5 NP 1 Gombe River Floodplain 3o50'S/32o16'E 32.0 1 Gombe/Mtoni/Igombe wetlands 3o50'S/32o16'E 250.0 1 Gwelu Lake (Kagera) 1o20'S/30o30'E 0.5 1 Hombolo Dam (Wami) 1.5 1 Igombe Dam 1.3 1 Ihefu Swamp 4.0 GR 1 Ikamba Lake (Burigi) 1o24'S/31o30'E 12.5 1 Indian Ocean Coastline (1500 km) 150.0 1 Jipe Lake (Pangani) 3o31'S/34o11'E 1.0 1 Kafufu/Chada Swamp 7o05'S/31o19'E 1 Kagera River Wetlands 1o19'S/30o33'E 35.0 (RSu/w) 1 Kagera Swamps 111.6 1 Kalimawe (Mkomasi GR) 1.0 1 Katabi Lake (Kagera) 1o59's/30o57'E 0.5 1 Katavi/Stalike Floodplain 6042'S/31o08'E 24.0 NP 1 Katavi Lake (National Park) 6o43'S/31o00'E 2.5 NP 1 Kasare Lake (Arusha NP) 0.5 NP 1 Kashanga Lake (Kagera) 1o53'S/30o51'E 0.5 1 Kashani Lake (Kagera) 1o34'S/30o49E 0.5 1 Kazinga Lake (Kagera) 2.01'S/30o56'E 0.5 1 Kidata Dam (Ruaha) 7o47'S/37o01'E 1.0 1 Kifuka Swamp (Pangani) 4o05'S/38o11'E 1.0 NP(?) 1 Kigosi Floodplain 3o50'S/32o16'E 14.0 1 Kikuletwa Swamp (Pangani) 4.2 1 Kilombero Floodplain (Rufiji) 7o44'S/35o33'E 626.5 KRS 1 Kisigo Swamp/Floodplain (Ruaha) 5o33'S/34o22'E 20.0 1 Kitangire Lake 4o00'S/34o10'E 11.5 1 Kitwai Swamp & Floodplain (Pangani) 4o51'S/37o11'E 15.8 1 Latham Island 0.003 1 Lekandiro Lake (Arusha NP) 0.5 NP 1 Lweru Kwa Kalambi (Kagera) 1o59'S/30o52'E 0.5 1 Logaria Lake (Serengeti NP) 0.5 NP 1 Longil Lake (Arusha NP) 0.5 NP 1 Mafia Island Coastline 1.0 1 Mafia Island Marine Park 85.0 MP 1 Mafunzi Swamp (Katavi NP) 1 Magadi Lake (Arusha/Ngorogoro NP) 0.5 NP 1 Mangrove Swamps 196.0 1 Manyara Lake 41.3 1 Masimba Lake (MMRS) 1.0 MMRS 1 Masirori Swamp (Mara River) 1o27'S/34o11'E 30.0 1 Msaginya Floodplain (Rukwa) 6o46'S/31o16'E 22.0 1 Mkalinzu Lake 7o52'S/37o49'E 0.5 1 Mkomazi Swamp (Pangani) 4o12'S/38o04'E 4.0 1 Momela Lakes (Arusha NP) 0.7 NP 1 Moyowosi Floodplain 250.0 MMRS 1 Moyowosi Swamps 3o55'S/30o55'E 320.0 1 Mtemba Swamp (highland) 8o41'S/32o02'E 0.5 1 Mtera Reservoir (Dam on Ruaha) 7o06'S/35o55'E 61.0 1 Mujuju Lake (Kagera) 1o36'S/30o51'E 0.5 1

102
Nondwa Dam 6o21'S/35o20E 0.5 1 Natron Lake (Wet Years) 85.5 NRS 1 Natron Lake/Swamp 12.0 NRS 1 Ndutu Lake (Ngorongor NP) 1.0 NP 1 Ngorongoro Crater 3o05'S/35o29'E 0.5 NP 1 Nyahua Floodplain (Eyasi) 5o52'S/33o21'E 11.0 1 Nyakatale Lake (Kagera) 1o22'S/30o39'E 0.5 1 Nyamagoma Lake (MMRS) 1.0 MMRS 1 Nyasa Lake (Shoreline 305 km) 750.0 1 Nyumba ya Mungu (Dam)(Pangani) 3o41'S/37o27'E 18.0 1 Pangani River Wetland 90.0 1 Ruaha/Tame Floodplain 6o15'S/34o53'E 0.5 1 Ruaha/Lufugwa Floodplain 7o12'S/35o17'E 10.0 1 Ruaha/Babu Wetland 6o48's/35o43'E 24.0 1 Ruaha/Mbungu Wetland 7o31'S/35o47'E 20.0 1 Rubondo Island NP (Victoria) 2o36'S/31o51'E 1.0 1 Rufuji/Lambo Swamp 7o22'S/38o15E 1.0 1 Rufuji Floodplain 0.5 1 Rukwa Lake 406.0 1 Rukwa Floodplain (North) 129.0 1 Rukwa Floodplain (SW) 39.0 1 Rukwa/Kufufu/Kavu Floodplain 6o23S'/30o44E' 43.0 1 Rungwa/Rukwa Swamp 7o01'S/33o59'E 1.0 1 Ruvu Floodplain (Gonabis) 7o16'S/37o51'E 36.0 1 Ruvu Floodplain (Kidunda) 7o07'S/38o15'E 7.2 1 Ruvu Estuary Swamp 6o27'S/38o58'E 0.5 1 Sagara Lake ? 85.0 MMRS 1 Shuriro Swamp 36.0 1 Silale Swamp (Tarangiri NP) 0.5 NP 1 Singida Lake 1.0 1 Singida Swamp 4o49'S/34o44'E 6.0 1 Sanijo Lake (Arusha NP) 0.5 NP 1 Tanganyika Lake (Shoreline 650 km) 1350.7 1 Tulusia Lake (Arusha NP) 0.5 NP 1 Tarangire NP Swamps 60.0 NP 1 Tame (Ruaha) Floodplain 6o35'S/35.12'E 0.5 1 Twamwala Lake (Kagera) 1o36'S/30o50'E 0.5 1 Ugalla/Wala Floodplain 90.0 MMRS 1 Usangu Flats 150.0 1 Victoria Lake (Shoreline 1420 km) 3375.6 1 Wami Mkata Floodplain 6o26'S/37o04'E 80.0 1 Wami Floodplain (Nguru) 6o16'S/37o32'E 13.5 1 Wembere Floodplain (Eyasi) 4o12'S/34o10'E 140.0 1 Yaida Swamp (Eyasi) 3o52'S/34o56'E 16.2 1 1 Zanzibar Coastline 0.2 1 Ziuwe Wetlands (Sigara) 5o14'S/31o07E 85.0 1
Total 9810.7 95 16 7
Key: FW = Freshwater, Soda = Soda/Caustic, SW = Salt water

103
PHOTO ALBUM
Photo. No 1: Swamp
Photo No 2: Marshes

104
Photo No. 3: Springs
Photo No 4: Flood Plain

105
Photo No 5: Mountain Crater Lakes
Photo No 6: Mangroves

106
Photo No 7: Man-made/Non-natural Wetlands
Photo No 8: Agricultural Wetlands

107
Photo No 9: Coastal Wetlands
Photo No 10: Coral reef bio-diversity

108
Photo No 11a: Livestock in Wetlands b. Over-stocking Livestock.
Photo No 12: Brick making in the flood plain

109
Ramsar’s message on the World Water Day-2012
“The World is thirsty because we are hungry” , “ Saving water means more food for people” and Wetlands are t he Pillars of Survival. Imagine the shock of waking up one morning to discover that there is no water coming out of our taps. The reality is that access to improved drinking-water sources is already a daily issue for billions of people worldwide; today, water scarcity affects more than 40 percent of the people on our planet. Today’s World Water Day message is thought-provoking: “The World is thirsty because we are hungry” and many of our actions, such as the management of irrigation systems and domestic water supply, need to be improved to reduce water loss. Take a minute to think of all the water used to produce the food we eat. Our world is thirsty and a key consequence of the water crisis is to threaten our food security, which relies on fresh, clean water.
The Ramsar Convention on Wetlands has long noted the high dependence of local communities on wetland resources, particularly in developing countries and notably in terms of small-scale subsistence agriculture, domestic water supply, and other uses that may contribute directly to poverty alleviation. It has therefore been part of Ramsar’s mission to increase awareness of the connection between wetlands and water use, demonstrating the opportunities and constraints for using wetlands to address specific water management issues such as water storage, flood regulation, improving water quality and helping to create sustainable livelihoods through wise use. There is an increasing recognition of the values of healthy freshwater wetlands. Yet there is still a growing need to recognize that healthy inland water ecosystems provide reliable, clean water for direct human uses but also for keeping coastal areas healthy. Food security is not only dependent on healthy freshwater wetlands but also on healthy marine and coastal wetlands such as mangroves, coral reefs and sea grass beds – all of which play crucial roles in ensuring an enduring supply of marine products such as fish, shellfish, algae, etc., that form an integral part of our diet. These marine and coastal ecosystems are connected to inland waters and there is a need to protect the marine environment by addressing the connectivity between terrestrial, freshwater, and coastal and marine ecosystems. The importance of wetlands for the environment and for human livelihoods has traditionally been underrated by policy- and decision-makers because of the difficulty of assigning financial values to a wetland ecosystem's benefits, goods and services. Of some help for wetlands in this area, the Ramsar Secretariat will be working with the Economics of Ecosystems and Biodiversity (TEEB) initiative in the coming month to raise awareness of the global economic benefits of biodiversity and to highlight the growing costs of biodiversity loss and ecosystem degradation. TEEB and Ramsar will prepare a specific report on the economics of water and wetlands, for launch later this year. The Ramsar Secretariat reaffirms its commitment to the conservation and wise use of wetlands as a contribution to securing the quantity and quality of fresh water that is required to sustain human well-being.
Ramsar Secretary General (2012)
Ever increasing demands are put on the earth’s biosphere. Ecological functions and habitats (including wetlands) are
destroyed at unprecedented rate. Poverty eradication, fuel, food security, provision of fresh water, soil conservation and human health all depend directly upon maintaining and wise using of the world’s natural resources. There is therefore a
strong interdependence between conservation and sustainable use of water resources and sustainable development. And one cannot talk of water for people before considering the sources. For better achievement, efforts should be directed to determination and valuing ecosystem services by involving all stakeholders in development and reinforcement of Payment of the Ecological Services (PES) for in deep ecology, nature is seen as an ultimate source of, and location of value .This would aid to walk on the concept of Water for People and lastly People for Water.
Lotha S. Laisser, CEPA Desk MNRT

Tanzania Na onal Single Species Ac on Plan 2010-2020 for the Conserva on of the Lesser Flamingo (Phoeniconaias minor) 90
For further informa on, please contact: Director Wildlife, Wildlife Division, PO Box 1994, Dar es Salaam, Tanzania.
E-mail: [email protected]., Phone: 255 22 2866408, 2866376, 2866418.
Fax: 255 22 2865836, 2863496
Tanzania Lesser Flamingo Single Species Ac on Plan (SSAP)
Wildlife Division

Tanzania Na onal Single Species Ac on Plan 2010-2020 for the Conserva on of the Lesser Flamingo (Phoeniconaias minor)
MINISTRY OF NATURAL RESOURCES AND TOURISMWILDLIFE DIVISION
THE UNITED REPUBLIC OF TANZANIA
Sustainable Wetlands Management Program
Tanzania National Single Species Action Plan2010-2020 for the Conservation of the Lesser
Flamingo (Phoeniconaias minor)
February 2010For the establishment of Community Based Natural Resource Management of Wetlands

Tanzania Na onal Single Species Ac on Plan 2010-2020 for the Conserva on of the Lesser Flamingo (Phoeniconaias minor) ii
For further informa on, please contact:
Director Wildlife, Wildlife Division,
PO Box 1994, Dar es Salaam, Tanzania.
Phone: 255 22 2866408, 2866376, 2866418.
Fax: 255 22 2865836, 2863496.Foreword
E-mail: [email protected].,
© Wildlife Division, 2011

Tanzania Na onal Single Species Ac on Plan 2010-2020 for the Conserva on of the Lesser Flamingo (Phoeniconaias minor) iii
Acknowledgements
The Director of Wildlife wishes to acknowledge the following:
Prepared with Financial and Technical Assistance from: Danida support to Sustainable Wetlands Management Program (SWMP), helped fund the mee ngs, workshops and prin ng of the rst dra and publica on. Flamingo Land, supported the publica on of the nal document. The support from BirdLife Interna onal for the par cipa on of regional specialists to a end mee ngs, is highly appreciated.
Acknowledgement is extended to: Wetlands Unit Staff , Wildlife Division who did the compila on of this document with technical support from John D. Balarin.
Further, he would like to acknowledge the contribu ons received from: Ma Aeberhard, Dr. Julius Arinaitwe, Neil Baker, Dr. Brooks Childress, Tim Davenport, Dr. Hazell Thompson, Ken Mwathe, Lota Melamari, Paul Ndang’ang’a (Facilitator) and (the late) Miriam Zacharia.
The Co-edi ng inputs are appreciated from: Members of the Na onal Lesser Flamingo Ac on Planning Stakeholder Mee ngs of May 2009 and February 2010, and the NWWG AEWA Sub-Commi ee and Wetlands Unit, notably: Herman Keraryo, Charles Mulokozi, Lothas Laisser, Africo Simon, Imani Nkuwi, Hassan Namkeleja, Thade Clamsen, Shombe Hassan, Rajabu Hochi, Emilian Kihwele, D. Paul, Charles Masanja, Roman Masawe, Sophia Masoka, Elias Mungaya, Twaha Twaibu, Abdallah Shah, Davida Shilla, John Wambura, Mihindi Basso, Dr. Victor Kakengi, Alex Kisingo, Augus n Lorry, Elikana Kalumanga, Masegeri Tumbuya, Kazungu Erik, Rehemma Tibanyenda, Joseph Saningo, Frida Labore, S. L. Bulu, Davida Rukiko, Adayo Karamia, Simon Charles, Nashon Macokecha, S. B. Mawanja, John Likwe, Frida Joseph, Cosmas Nguya, Yohana Mgaluka, Allan Shamy, Mike Ole Mokore and Popilou Mkoma.
Special thanks are due to the following ins tu ons and NGO: BirdLife Interna onal (BirdLife), Royal Society for the Protec on of Birds (RSPB), Wildlife Conserva on Society Tanzania (WCST), Tanzania Bird Atlas Project (TBAP), Natural Light Films, IUCN SSC, Wetlands Interna onal, World Wildlife Fund (WWF Tz), AEWA, TAWIRI, CAWM Mweka, UDSM, IRA, SUA, Na onal Environment Management Commi ee (NEMC), Ministry of Natural Resources and Tourism (MNRT), Vice Presidents Offi ce-Division of Environment, Wildlife Division, Singida DC, Ngorongoro DC, MCT, PMO-RALG, IPI, TANAPA, NCCA, Hanang DC, Karatu DC, Monduli DC, Baba DC, Mbulu DC and others, too numerous to men on.
Subsequent Reviews:
This rst a empt is a rolling, 10-year Na onal Single Species Ac on Plan (SSAP). It shall give rise to the rst 5 year Integrated Management Plan (IMP) of Lake Natron, a cri cal, key Ramsar site for the survival of the East Africa Lesser Flamingo sub-popula on. It will guide the incorpora on of appropriate ac ons in the three-year, District Development Plans (DDP) of associated districts and the associated 5-10 years Wildlife Management Area (WMA) General Management Plans (GMP). As such, rolling reviews and updates shall take place every 3-5 years so as to align appropriate ac ons based on results on the ground. The NWWG AEWA Sub-commi ee shall be the oversight body, advising the NWWG and NAWESCO, monitoring progress. An emergency review will be undertaken if needed.
Recommended Cita on:
Wildlife Division (2010), Tanzania Na onal Single Species Ac on Plan for the Conserva on of Lesser Flamingo Phoeniconaias minor. Ministry of Natural Resources and Tourism, Dar es Salaam, Tanzania.

Tanzania Na onal Single Species Ac on Plan 2010-2020 for the Conserva on of the Lesser Flamingo (Phoeniconaias minor) iv
Foreword
The Government, when revising the Wildlife Policy (2007), saw it proper to place equal emphasis on wildlife, as on wetlands. Wetlands had to-date been considered wastelands, unsustainably managed, taken for granted, undervalued! To-day, we realize that although wetlands make up less than 10% of land area, nevertheless their “cri cal, life support services” are the most important to sustain our lives, our wildlife, our food and water, our economy, our hydro-energy, and our rural livelihoods. Na onal ac ons, such as the Single Species Ac on Plans are therefore key to the sustainable management of our resources and their biodiversity, so as to sustain ecosystem func ons.
Lake Natron Ramsar Site:
In 2001, the Government, declared Lake Natron a Ramsar Site, in apprecia on of its interna onal signi cance as one of only 5 known world-wide natural breeding sites, home to 75% of the global popula on of Lesser Flamingo. Whereas in the 60’s, Protected Areas could be set aside with minimal con ict, government in 2007, cognizant of the growing popula on, made an important policy statement, “that to sustain wildlife and wetlands, wise use and management will depend on how the public perceive the importance of conserva on now, and for future genera on’s”. Science and technological advancement, coupled with training and understanding is therefore key to any ac on plan! Broad based knowledge of life support values, of economics and of livelihood opportuni es from ecosystem services can change a tudes to current, unsustainable resource use. Awareness of best prac ces for wise use, changes percep ons and values and empowers appropriate ac ons. Importantly, users need informa on and science base knowledge is needed to in uence decision making and planning of future, sustainable resource use! This Ac on Plan for Lesser Flamingo, its associated complex of soda lakes, feeding and breeding, is based on the principles of “wise use”.
Users of This Ac on Plan:
For sustainable wetland management, the Wildlife Policy calls for greater coopera on between Wildlife Division, TAWIRI, TANAPA, other sectors, academia, NGO, private sector, local government and Protected Area Managers. This Ac on Plan therefore is the responsibility of all managers and users, alike, to ensure implementa on through na onal and local development plans. To ensure user applica on, in areas where Lesser Flamingo are to be found, this calls for development and BirdLife partners, outreach programs, Wildlife Clubs, Extension Services, Community Based Conserva on (CBC), Community Conserva on Services (CCS), Schools, Community Based Natural Resource Management (CBNRM) projects, Malihai Clubs, WCST, district offi cers and schools, to work with Central Government and Protected Area Management to mainstream ac ons.
Focal Ac on Areas:
Lesser Flamingo sites, especially Lake Natron, provides local livelihoods with poverty reduc on services, like: pastoralism, irriga on, food produc on, water, bush meat as food, fuelwood, etc, but also has economic poten al for eco-tourism, hydro-electric power, commercial irriga on and mining. Coupled with the consequences of global climate change, this Ac on Plan calls for more “environment friendly uses”, to ensure appropriate mi ga ng ac ons and wise use through best prac ce, notably: “wetland friendly investments” (WFI).
This Ministry is grateful to Danida for nancial and technical support. We wish to thank the par cipa ng interna onal partners (Flamingo Land and BirdLife Interna onal) and local organiza ons, especially the AEWA Sub-Commi ee, the NWWG and the staff of the Wetlands Unit, who made this publica on possible. It is now up to every government sector, local government, user groups, NGO, investors and development partners, to ensure these undertakings are mainstreaming in local ac ons, and in wetland friendly investments to support sustainable ecosystem services in the areas where Lesser Flamingo are to be found.
.............................Ms Maimuna K. Tarishi, Permanent Secretary.

Tanzania Na onal Single Species Ac on Plan 2010-2020 for the Conserva on of the Lesser Flamingo (Phoeniconaias minor) v
List of Acronyms
AA Authorised Associa onAEWA African-Eurasian Migratory Water Birds AgreementAWF Africa Wildlife Founda onCBC Community Based Conserva onCBD Conserva on of Biological Biodiversity (Conven on)CBO Community Based Organisa onCBNRM Community Based Natural Resource ManagementCCS Community Conserva on ServicesCEPA Communica on Educa on and Public AwarenessCITES Conven on on Interna onal Trade in Endangered Species of Wild Flora and FaunaCMS Conven on on the Conserva on of Migratory SpeciesDC District CouncilDCA Directorate Civil Avia onDDP District Development PlanDeNRM Decentralized Natural Resource ManagementDW Director WildlifeEAP Environmental Ac on PlanEIA Environmental Impact AssessmentEMA Environmental Management ActENSDA Ewaso-Njiro South Development Authority (Kenya)FD Fisheries Department FZS Frankfurt Zoological Society.GCA Game Control AreaGEF Global Environment Facility.GMP General Management PlanIBA Important Bird AreaIMP Integrated Management PlanIUCN Interna onal Union for Conserva on of NatureIWRM Integrated Water Resource ManagementKFS Kenya Forestry ServiceKWS Kenya Wildlife ServiceLF Lesser FlamingoLUP Land Use PlansMCT Malihai Clubs of TanzaniaMNRT Ministry of Natural Resources and TourismNAWESCO Na onal Wetlands Steering Commi eeNWWG Na onal Wetlands Workings GroupNBSAP Na onal Biodiversity Strategic Ac on PlanNEAP Na onal Environmental Ac on PlanNEMC Na onal Environmental Management CouncilNP Na onal ParkPA Protected AreaPM Project ManagerRAMSAR Conven on on Wetlands of Interna onal ImportanceRSPB Royal Society for the Protec on of BirdsSEA Strategic Environmental AssessmentSOER State of Environment ReportSSAP Single Species Ac on PlanSUA Sokoine University of Agriculture

Tanzania Na onal Single Species Ac on Plan 2010-2020 for the Conserva on of the Lesser Flamingo (Phoeniconaias minor) vi
SWMP Sustainable Wetlands Management ProgramTAFIRI Tanzania Fisheries Research ins tuteTAWIRI Tanzania Wildlife Research Ins tuteTBAP Tanzania Bird Atlas ProjectUDSM University of Dar es SalaamUNEP United Na ons Environment ProgrammeUNESCO United Na ons Educa onal, Scien c and Cultural Organiza onVDP Village Development PlanVPO-DOE Vice Presidents Offi ce- Director of EnvironmentWCS Wildlife Conserva on Society (New York)WCST Wildlife Conserva on Society of TanzaniaWD Wildlife DivisionWFI Wetlands Friendly InvestmentWMA Wildlife Management AreasWU Wetlands UnitWWF World Wide Fund for Nature

Tanzania Na onal Single Species Ac on Plan 2010-2020 for the Conserva on of the Lesser Flamingo (Phoeniconaias minor) vii
Execu ve Summary
The Lesser Flamingo (Phoeniconaias minor) (LF), the smallest amingo species in size, but the most numerous in number, is an ornithological spectacle of high and diverse ecological and economic value in East Africa. It is a major global, charisma c tourist a rac on, and an iconic symbol of conserva on, popular in tourism and in zoos. Despite its numbers, this bird is currently categorised as globally “Near Threatened”, listed in the 2009 IUCN Red List of Threatened Species. Popula on declines over the past 30 years of 20-40% are es mated, and some major recent, mass die outs in the order of 100 - 200 thousand birds, suggest that this species may be considered to qualify for a “threatened category” in the near future. Its vulnerability is highlighted by the fact that there are only ve known, natural, regular breeding sites in the world, and that 75-80% of the global popula on, the whole of the East Africa stock (EA), depends en rely on Lake Natron for its breeding success and survival. This Ac on Plan takes into account that all the EA LF breed at Lake Natron, and no-where else!
This regional sub-popula on is shared by Tanzania, Kenya, Uganda and Ethiopia and ranges between 1.5-2.5 million, of an es mated global popula on of 2-3 million (Wetlands Interna onal, 2006). The bird’s natural habitats, par cularly within the East Africa Ri Valley face threats of diff erent magnitudes. Without concerted and carefully focused conserva on ac ons, the Lesser Flamingo risks joining the IUCN Red List of “Vulnerable” category of species. This Ac on Plan, therefore is cognizant that the East African sub-popula on share the same common regional sub-popula on pool. That the Lesser Flamingo is largely con ned to nine of the major Ri Valley soda lakes, and therefore each country has a trans-boundary responsibility to jointly manage the current, shared popula on. The Ac on Plan is cognisant that a mishap in one country could have dire consequences for the others! Joint ac on is called for.
Natural resource managers face a major challenge, not least is the global concern about climate change and the wholesale losses and degrada on of natural habitats due to excessive human pressure on ecosystem services. This Ac on Plan outlines how li le is known of the bird, of its biology and ecology, of its key habitats and, of the threats it faces, and how to manage them. Most important of all, near nothing is known of its breeding, and the signi cance of Lake Natron. Clearly there is a need for research, to enhance knowledge and understanding of the bird, its biology, its habitats, of human pressures, and of its economic importance. This scien c knowledge can become the basis for informed decision making, leading to “wise use”, and remedial ac on through local sustainable management strategies. The aim is a “win-win” situa on. Targeted is to reduce human pressures on those shared ecosystem services, so as to ensure both sustainable livelihoods and bio-diversity survival. A key strategy in this Ac on Plan is to add value through tourism to avoid long term resource use con ict, achievable through establishing Wildlife Management Areas (WMA) in key sites.
To be in synchrony with trans-boundary ini a ves by neighbouring countries and in line with global ac ons, the Tanzania LF Single Species Ac on Plan (SSAP) has been aligned with the “2008 Kenya Na onal Lesser Flamingo Ac on Plan”. It is also harmonised with the “2006 Interna onal Lesser Flamingo Species Ac on Plan”, and follows the AEWA 2005 recommended “SSAP Guidelines”. Emphasised are the probable con icts with anthropogenic ac vi es in the catchments, with agro-industrial, mining, tourism, economic and livelihood developments. Causes of frequent Lesser Flamingo mortality in Kenya and Tanzania appear related. Linked to cyanobacteria toxins and infec ous diseases, pollu on from heavy metals and pes cides, food stress brought about due to lake level uctua ons or sedimenta on (the la er due to overgrazing, agriculture conversion or deforesta on in the catchments) or due to drought, a long term feature of the fragile, desert like, Ri Valley environment. The Ac on Plan takes into account these stresses are likely to intensify due to global clima c change.
The Government of Tanzania is commi ed to nature conserva on, and to discharge its responsibility in line with the precau onary and wise use principles of the Ramsar Conven on which it signed in 2001. Central government policy, legal and technical support frameworks aim at suppor ng local governments and local communi es, to include and implement sustainable management through their Village and District Development Plans (DDP). One focus of the Ac on Plan is to form appropriate ins tu onal arrangements, especially Community Based Natural Resource Management (CBNRM) (eg. WMAs) implementable through decentraliza on, or Decentralized Natural Resource Management (DeNRM).
To implement this SSAP, Tanzania looks to work closely with all stakeholders, notably: the Lesser Flamingo

Tanzania Na onal Single Species Ac on Plan 2010-2020 for the Conserva on of the Lesser Flamingo (Phoeniconaias minor) viii
range states in East Africa (and Southern Africa), the Flamingo Specialist Group of the IUCN Species Survival Commission and Wetlands Interna onal, the World Wide Fund for Nature (WWF), Wetlands Interna onal, BirdLife Interna onal, Conven on on the Conserva on of Biological Diversity (CBD), Ramsar Conven on on Wetlands, Conven on on the Conserva on of Migratory Species (CMS), and African-Eurasian Waterbird Agreement (AEWA), and Royal Society for Protec on of Birds (RSPB), amongst others. The Ac on Plan vision is to par cipate ac vely in the proposed Interna onal Lesser Flamingo Working Group (under the AEWA Framework).
A decentralised approach to CBNRM, leading to Integrated Water Resource Management (IWRM) is being deployed as the key strategy to address the challenges that the Lesser Flamingo face. This includes establishment of new Ramsar sites (eg Lake Manyara), mainstreaming this SSAP in local government District Development Plans (DDP), implemen ng this SSAP through the Integrated Management Plans (IMP) of key wetlands sites (like Lake Natron) and of inclusion in the General Management Plans (GMP) of key protected area (like Manyara NP, Ngorongoro Conserva on Area, Arusha NP, etc) and crea on of WMAs or wetland reserves in key sites. The call for local ac on in communi es that live with the Lesser Flamingo, will be through adop on of this SSAP in village land-use planning (LUP). The Ac on Plan notes LUP and WMA processes are key to CBNRM, to protect the environment, regulate and manage the use of natural resources and livelihoods, to ins l harmony, to ensure sustainability of ecosystem func ons.
No ng a lack of scien c based informa on for informed decision making, research and key site monitoring will be given priority. The aim is to build a sound scien c knowledge base on the amingos, their environment, and of human threats on shared ecosystem services, to make these sustainable and secure for bio-diversity and local livelihoods. Special a en on will be to water resource conserva on, restora on of environmental ows or catchment degraded sites within the watersheds, designa on and protec on of the lakes for improved
conserva on status, enforcement of environmental standards together with compliance with EIA and environmental audit procedures. The Ac on Plan advocates sustainable agricultural prac ces and u lisa on of natural resources by industry and catchment communi es will be promoted through training, Communica on Educa on and Public Awareness (CEPA), especially through Wildlife Clubs (ie. MCT and WCST) and by Wetland Friendly Investments (WFI) and micro-project programmes.
This Ac on Plan implementa on framework is the Environment Management Act (EMA) and Wildlife Policy and Act. It will contribute to increased awareness on the mandatory need for a State of the Environment Report (SOER) of wetlands, and associated Lesser Flamingo popula ons. Hopefully, this approach shall inspire further research and monitoring to ll the knowledge gaps, and implementa on shall be mainstreamed in the Environmental Ac on Plans (EAP) of District Development Plans (DDP). The Government is acutely aware that it lacks resources, human and nancial to implement this plan. Therefore, to spread the load, the Wildlife Division, as the Ramsar authorised representa ve, shall s mulate eff ec ve and coordinated mi ga on of threats and management ac ons by all stakeholders. The Ac on Plan envisages partnership ac ons by central government, local government, local communi es, private sector, research and higher educa on organiza ons, non-governmental organiza ons (NGO), CEPA agents, as well as with those, who share the trans-boundary responsibility, and interna onal development partners.
In Kenya, the current tourism value of the species has far greater signi cance than in Tanzania, but hopefully, with the publicity following the 2009 release of the Disneynature feature lm, “Crimson Wing”, this has poten al to change. It is important therefore that the region rally in harmony to emphasise the importance of working together, in synergy, of the poten al of bene ng from local, na onal and trans-boundary ac on. Protec on of the shared catchments of the various wetlands inhabited by this species, is important. Likewise, all partner countries must ins l the same harmony in policy, legisla on and wise use prac ces for catchment industry, agro-industry, local development and community livelihoods. A sense of regional coopera on in sustainable management is needed! Joint protec on ac ons are called for due to the nomadic or i nerant (ie trans-boundary migratory) nature of this species. It is therefore important that the Ac on Plan encourages all countries with the shared popula on to consider including all key sites and habitats in their SSAP, to maintain the same level of standards.
A number of common biodiversity conserva on projects, protected area strategies, local government, NGO ac ons and private sector ini a ves are underway in the Ri Valley in Kenya and Tanzania. All these eff orts relate to the economic bene ts of local people and the conserva on of the Lesser Flamingo, and therefore need

Tanzania Na onal Single Species Ac on Plan 2010-2020 for the Conserva on of the Lesser Flamingo (Phoeniconaias minor) ix
to be integrated, synchronised and harmonized locally and with trans-boundary ac ons. The Ac on Plan notes to synchronise ac on and coordinate eff orts, a Regional Network is needed.
The most cri cal threats to the survival of the Lesser Flamingo in Tanzania are thought to be the loss and/or the degrada on of its specialised habitats. Habitat degrada on results from altera on in hydrology and hydro-chemistry, aff ected by changes in rainfall, water ow and water quality due to over-abstrac on for irriga on, or catchment conversion to agriculture, or damage due to deforesta on (for mber or fuel or due to wild res) or erosion due to overgrazing by pastoralists, or poor land use management prac ces, and res or climate change. Threats of high importance in some feeding lakes (mostly in Kenya, but also suspected of Lake Manyara), include poisoning (par cularly by cyanobacteria toxins and pes cides) and infec ous diseases (mycobacteriosis and avian cholera). Threats of lower regional, but signi cant local importance include at Lake Natron the proposed local extrac on of soda salt (ash). Current use by the Maasai community as a small scale salt industry has no eff ect on the amingos, and could be considered to be a sustainable/posi ve use of the lake providing local income and employment. But over-riding these are the poten al, but currently in abeyance, threats to Lake Natron of proposed, large scale investments in water extrac on for hydro-power or salt plants (Kenya), large scale irriga on (Tanzania and Kenya) and the prospect of industrial soda ash mining in Lake Natron. These threats are ranked in this Ac on Plan for ac on.
This 10-year plan envisions joint ac on, ensuring ‘a stable, viable and healthy East Africa popula on of the Lesser Flamingo’. It aims at local and trans-boundary coopera on in stabilising the popula on size and distribu on of the Lesser Flamingo in the region within the next ten to een years.
The main objec ve of the Tanzania SSAP is: “The adop on of the Interna onal SSAP objec ves (Sec on 3.1.3), domes cated to Tanzania condi ons”.
The expected outputs from the Tz LF SSAP, are1. All key breeding and feeding sites are maintained in good ecological condi on.2. Breeding colonies are not disturbed.3. The eff ects of poisoning and/or diseases, reduced.4. Harves ng and trade in live specimens has no eff ect on the Lesser Flamingo popula ons.5. Minimised collisions with manmade structures.6. Minimised human disturbance at non-breeding sites.7. Scien c knowledge gaps lled.8. Ins tu onal and administra on arrangements for implementa on of the LF SSAP, in place.
The focus of the Tanzania LF SSAP will be on the following key sites, de ned as mee ng Ramsar criteria of 1% of bio-geographical popula on (ie + 20,000 birds), listed in 2 categories, in order of priority for the Lesser Flamingo:
Unprotected key sites, and therefore priority for management, and associated district government:
dna ,CD odignoL & orognorogN )yaw/u ,sAMW 2 dna sACG 2 yb detcetorP( - nortaN ekaL .1Ramsar PM.
2. Lake Manyara - (only 50% protected by Manyara NP) Baba DC.3. Lake Eyasi - Ngorongoro, Meatu and Karatu DC.4. Lake Burungi - (67% protected inside WMA) Baba DC.5. Lake Kitangiri - Meatu and Iramba DC.6. Singida Lakes - Singida DC.7. Lake Balangida Lelu - Hanang DC.8. Bahi Swamp - Dodoma Rural and Manyoni DC.
awkuL-awkuR detcetorp traP( - awkuR ekaL .9 GR) Mpanda, Chunya, Mbozi & Sumbawanga DC.
Key sites, but protected and therefore not of immediate priority, as already under some form of protected management:
10. Momella Lakes - (67% protected by Arusha NP).11. Lake Empakai - (100% protected by NCA).

Tanzania Na onal Single Species Ac on Plan 2010-2020 for the Conserva on of the Lesser Flamingo (Phoeniconaias minor) x
12. Lake Magadi (100% protected by NCA Crater lake).13. Lake Ndutu (100% protected by Serenge NP).
In summary, the key strategic ini a ves to achieve the objec ves of the Ac on Plan are to:
1. Local Government Ac on: Mainstreaming ac on in decentralised policy & legisla on, through local government development plans (DDPs and VDPs).
2. Key Site Ac ons: Through key site IMP/GMP, ins l species & habitat conserva on and wise use. 3. Key Site Monitoring: Through monitoring keep a record of popula on trends, catchment and site condi ons.4. Informed Decision Making: Through research, provide knowledge on linkages between biology and
catchment condi on for informed decision making on policy and development planning. 5. Awareness Raising: Increase communica on, educa on and public awareness (CEPA) around key sites,
advoca ng for “wise use” where unsustainable prac ces threaten ecosystem services.6. Training: Provide training to management ins tu ons (like local government, NGO and CBO), and 7. Community Based Natural Resource Management: Enhance community involvement, adding value and
bene t sharing through Wildlife Management Areas (WMA).8. Mobilise Resources: All stakeholders, central and local government, civil society and private sector have a
role to play to pool resources to support sustainable use of these key ecosystems for the long term bene t of mankind.
This ac on plan is seen as a rolling plan, to be re-visited as more informa on becomes available, to be updated should an emergency arise.

Tanzania Na onal Single Species Ac on Plan 2010-2020 for the Conserva on of the Lesser Flamingo (Phoeniconaias minor) xi
Contents
Acknowledgements ........................................................................................................................................ iiiForewords: ................................................................................................................................................ iv
Lake Natron Ramsar Site: ..................................................................................................................... ivUsers of These Ac on Plans: ................................................................................................................ ivFocal Ac on Areas: ............................................................................................................................... iv
List of Acronyms ............................................................................................................................................. vExecu ve Summary ........................................................................................................................................ vii1.0. INTRODUCTION .................................................................................................................................... 1
1.1. Background to This Ac on Plan ................................................................................................... 11.2. Timeline of Prepara on of this Ac on Plan ................................................................................. 21.3. Approach Adopted in Preparing this Ac on Plan ........................................................................ 3
2.0. CURRENT STATUS OF LESSER FLAMINGO ............................................................................................. 42.1. Taxonomy ..................................................................................................................................... 42.2. Distribu on and Popula on ......................................................................................................... 42.3. Migratory Movements ................................................................................................................. 72.4 Protec on Status: ........................................................................................................................ 82.5 Rela onship With Other Biodiversity Strategies And Projects .................................................... 92.6. Habitat Requirements .................................................................................................................. 92.7. Biology and Ecology ................................................................................................................... 112.8. Threats and Poten al Threats (Problem Analysis) ....................................................................... 132.9. Stakeholder Analysis .................................................................................................................... 14
3. Tanzania Lesser Flamingo Ac on Program ............................................................................................ 153.1. Interna onal Vision, Aim and Objec ves .................................................................................... 153.2. E Africa, Regional Vision, Aim and Objec ves ............................................................................. 163.3. Kenya’s Vision, Aim and Objec ves: ............................................................................................ 163.4. Tanzania Vision, Aim and Objec ves: .......................................................................................... 163.5. Tanzania Proposed LF SSAP Expected Outputs: ........................................................................... 17
4.0. Ac on Plan for Tanzania Lesser Flamingo ............................................................................................ 215.0. Monitoring And Evalua on (M&E) Plan ............................................................................................... 216.0. Resource Mobiliza on And Implementa on Strategy .......................................................................... 21
List of FiguresFigure 1: Map of the Key Lesser Flamingo Alkaline Soda Lakes in the East Africa Ri Valley. ..................... 56Figure 2: Distribu on of Lesser Flamingo in Tanzania and Sites which meet Ramsar Criteria. .................... 56Figure 3: Trends in Lesser Flamingo Numbers in Kenya: 1992-2007............................................................ 57Figure 4: Migratory Movements of Individual Lesser Flamingo (Satellite Tracked for 9 Months). .............. 58Figure 5: Seasonal Trends in Lesser Flamingo Numbers in Lake Manyara, Tanzania. .................................. 59Figure 6: Threats to Survival during Lesser Flamingo Life Cycle in Eastern Africa. ...................................... 60
List of TablesTable 1: Non-breeding Lesser Flamingo Regional Popula on Es mates (2003-2007). .............................. 62Table 2: Es mates of Lesser Flamingo Popula ons in East Africa: 1996-76. .............................................. 63Table 3: Popula on Es mates of Lesser Flamingo in Major Sites in Tanzania. ........................................... 64Table 4: Popula on Es mates of Lesser Flamingo in Major Sites in Kenya. ............................................... 65Table 5: Lesser Flamingo Breeding Observa ons: 1954-89. ....................................................................... 66Table 6: Breeding Observa ons of Lesser Flamingo at Lake Natron (1991). .............................................. 67Table 7: Threat Importance Ranking for Lesser Flamingo in Tanzania Water Bodies. ................................ 68

Tanzania Na onal Single Species Ac on Plan 2010-2020 for the Conserva on of the Lesser Flamingo (Phoeniconaias minor) xii
Table 8: Interna onal Conven ons and Agreements of Relevance to the Lesser Flamingo (Tanzania). .... 71Table 9: Tanzania Na onal Laws and Policies A� ec ng the Conserva on of Lesser Flamingo. .................. 73Table 10: Stakeholder and Their Impacts on Lesser Flamingo and their Habitats in Tanzania. ................... 75Table 11: Exis ng Projects Relevant to Lesser Flamingo Conserva on. ....................................................... 77Table 12: Risks and Opportuni es for the Conserva on of Lesser Flamingo in Tanzania. ........................... 78Table 13: Logical Framework of Kenya’s Vision, Aim and Objec ves for Lesser Flamingo SSAP. .................. 79Table 14: Proposed Framework for Lake Natron Integrated Management Plan. ......................................... 80Table 15: Logical Framework of Tanzania’s Medical Team SSAP for Lesser Flamingo: 2010-2016. ............ 82Table 16: Proposed Monitoring and Evalua on Table for Lesser Flamingo SSAP. ........................................ 21
List of Annexes ................................................................................................................................................ 23
atnemelpmI :1 xennA on of the SSAP for the Conserva on of Lesser Flamingo and its Shared East Africa Regional Ecosystem for the Improvement of Local livelihoods. A Proposal to the Ramsar Secretariat, COP 10. ......................................................................................................... 24
Annex 2: List of Poten al Threats to Lesser Flamingo in Tanzania. .............................................................. 31Annex 3: Threats to Lesser Flamingo In Kenya (Using Problem Tree Analysis, from Kenya SSAP). .............. 34
eht rof secivreS metsysocE nortaN ekaL fo tnemeganaM elbaniatsuS eht rof hcraeseR deilppA :4 xennAConserva on of Lesser Flamingo (adapted from Natural-light Films). ......................................... 35
Annex 5: Bibliography of Lesser Flamingo (adopted from Kenya SSAP). .................................................... 40

Tanzania Na onal Single Species Ac on Plan 2010-2020 for the Conserva on of the Lesser Flamingo (Phoeniconaias minor) 1
TANZANIA LESSER FLAMINGO NATIONAL SINGLE SPECIES ACTION PLAN: 2010-2020.
1.0. INTRODUCTION
1.1. Background to This Ac on Plan
The need for a concerted ac on to conserve the Lesser Flamingo (LF) has long been recognized, and stakeholders at a global level workshop in September 2006, developed an “Interna onal Single Species Ac on Plan (SSAP) for global ac on for the conserva on of the Lesser Flamingo”. This interna onal document formed the framework basis of this Tanzanian Na onal SSAP, which has been prepared in accordance with the “2005 AEWA Guidelines on the Prepara on of Na onal Single Species Ac on Plans for Waterbirds”.
In order to ensure synchrony and harmony, this Ac on Plan has also drawn heavily on the “2008 Kenyan, Na onal Single Species Ac on Plan for the Conserva on of the Lesser Flamingo”. The aim, is to ensure a joint, synchronised trans-boundary ini a ve. Further, Tanzania also proposed to Ramsar COP 10, a regional ini a ve, “To form a EAC Network to Implement the Single Species Ac on Plan for the Conserva on of the Lesser Flamingo in the Shared East African Regional Ecosystem”. This network involves Tanzania, Kenya, Uganda and Ethiopia (See Annex 1). Although it was not funded by the Ramsar Secretariat, it nevertheless forms a framework for cross-border collabora .secivres metsysoce derahs dna kcots derahs a fo erac ekat ot PASS siht tnemelpmi ot no
Prepared with the approval of the Na onal Wetlands Steering Commi ee (NAWESCO) and its technical body, the Na onal Wetlands Working Group (NWWG), the Tanzania SSAP is in line with Tanzania’s Na onal Wetlands Strategic Ac on Plan 2006-2006, and is the product of the NWWG AEWA Sub-commi ee who is responsible for oversight to monitor and guide its successful implementa on.
In addi on, recognizing that research is the key to providing the much needed knowledge for the informed decision making to be er manage the bird and its habitats, Tanzania in 2008, as an off shoot of the Disneynature feature lm on the amingos of Lake Natron, “Crimson Wing”, also developed a proposal, the “Global Ac on for the Sustainable Management of Lake Natron Ecosystem Services for the Conserva on of the Lesser Flamingo” (Disneynature, 2008) (Annex 4). This la er outlines the knowledge gap, and went on, together with Ramsar Secretariat, AEWA, Disneynature, Wildlife Conserva on Society (WCS) and World Wide Fund for Nature (WWF), to develop as a proposed “Trust Fund for the Lesser Flamingo” (Ramsar 2008). This was a mechanism to fund the research and subsequent development needs. This fund is in abeyance, due to the global economic downturn, but nevertheless, the research plan forms an important supplement to this Plan, and is included as part of TAWIRI’s future research agenda.
The SSAP emerges with support from the 2004-2013 Danida nancial and technical support to Sustainable Wetlands Management Program (SWMP). This Program support, had a component for Lake Natron, en tled, “the Establishment of a Management Framework for Lake Natron, for Improved Livelihoods”. The approach here is that this SSAP is a founda on to the development and implementa on of the Integrated Management Plan (IMP) of the Lake Natron Ramsar Site (a dra is given in Table 14). Since 2007, implementa on has been underway through the District Development Plans (DDP) of the 2 districts, namely Ngorongoro and Longido. This entails the involvement of the local community, local private sector and NGOs (Birdlife Interna onal and African Wildlife Founda on – AWF), in the conversion of 2 Game Control Areas (GCA)(ie Lake Natron North and South), into a Wildlife Management Area (WMA).
This SSAP therefore guides the way for the mainstreaming of Lesser Flamingo conserva on into the associated local government plans (at district and village level), associated protected area (PA), or WMA or wetland IMP or GMP, and is linked to the na onal agenda on CBNRM of wetlands through WMAs, na onal wetlands research agenda and na onal training in wetlands, and is geared for trans-boundary coopera on.

Tanzania Na onal Single Species Ac on Plan 2010-2020 for the Conserva on of the Lesser Flamingo (Phoeniconaias minor) 2
1.2. Timeline of Prepara on of this Ac on Plan
Milestones in the development of this SSAP are as follows, in accordance with the steps in the AEWA Guidelines:
Step 1: Iden ca on of a Coordinator:
a. July 2006: 12 SSAPs, including LF, are included in the NAWESCO 3 year Strategic Plan 2006/7-2008/9.b. July 2008: Wetlands Unit, as Secretariat to NAWESCO and its technical body, NWWG, as the coordinator of
AEWA and RAMSAR related ac vi es, takes up the responsibility to coordinate prepara on of the Lesser Flamingo SSAP, through the NWWG AEWA technical sub-commi ee, supported by Danida.
Step 2: Iden ca on and Priori za on of addi onal species requiring a SSAP:
a. August 2006: First na onal mee ng on the LF SSAP to input into the context of the Interna onal LF SSAP. b. September 2007: Workshop in Nairobi on the Interna onal SSAP for the Lesser Flamingo.c. February 2008: RAMSAR mission on Lake Natron Soda Mine, EIA, involves consulta on with Kenya and
Uganda. Agreement is reached on importance and need to prepare jointly a Lesser Flamingo SSAP, a joint Regional LF SSAP Network (Annex 1) and a dra framework for an Integrated Management Plan (IMP) for Lake Natron, is prepared (Table 14).
d. April 2008: Proposed regional network on Lesser Flamingo SSAP sent to Ramsar COP 10 (Annex 1). Proposal was not funded.
e. November 2008: LF SSAP placed on TAWIRI Na onal Research Agenda during a workshop by the NWWG Research sub-commi ee.
f. September 2008: Proposal sent to World Bank to host donor support for SSAP. Mee ng did not take place. g. January 2009: Funding proposal sent to IUCN, WCS and BirdLife partner’s to seek donor support for SSAP
and for regional, consulta ve workshop. Funding did not materialise.
Step 3: Iden ca on of Working Groups:
a. July 2008: AEWA Sub-Commi ee of NWWG is assigned as the coordina ng body for the SSAP, assisted by its secretariat, the Wetlands Unit and lead agents, WCST and TAWIRI.
b. January 2009: Kenya and Tanzania BirdLife partner’s second regional mee ng, to develop the ac on plan to support development of the LF SSAP. Li le nancial support was forthcoming to support the prepara on of this SSAP.
c. March 2009: Through NAWESCO, WU decide to con nue the LF SSAP prepara on under Danida support.
Step 4: Status Report as Background Data:
a. May 2008: Stakeholders meet to discuss how to integrate Lake Natron IMP into District Development Plans, outline key concerns.
b. September 2008: Research plan for Lesser Flamingo developed with DisneyNature, as part of the background to the SSAP.
c. April 2009: Wetlands Unit carry out rapid “survey of key wetlands sites” for Lesser Flamingo and collect data for dra Background Report to LF SSAP.
Step 5: Produc on of SSAP as per Format:
a. July 2008: Kenya and Tanzania BirdLife partners rst regional mee ng to develop rst dra logical framework for the Lesser Flamingo SSAP.
b. April 2009: WU prepare rst dra Background Report for Tanzania SSAP for Lesser Flamingo.c. May 2009: NWWG AEWA Sub-commi ee meet, review zero dra SSAP background report, and produce
rst dra Tz LF SSAP. d. January 2010: BirdLife secured funding from Jensen Founda on to support development (and
implementa on) of LF SSAP, around Lake Natron.e. February 2010: Regional stakeholder consulta ve mee ng held to review and endorse the nal Tz LF SSAP.f. March 2010: Final dra LF SSAP presented to NWWG for approval and forwarded to NAWESCO for

Tanzania Na onal Single Species Ac on Plan 2010-2020 for the Conserva on of the Lesser Flamingo (Phoeniconaias minor) 3
endorsement.g. February 2012: Final LF SSAP goes to print and lodged with AEWA Secretariat for comments and approval.
Step 6: Implementa on of SSAP:
a. July 2008 onwards: LF SSAP has been mainstreamed in 2 key districts development plans.b. June 2009: Project Manager Lake Natron appointed. This post is fundamental to implementa on of Tz SSAP
in Natron. c. May 2010: Lake Natron stakeholder orienta on of key districts, Protected Area (PA) management, NGOs and
development partners of AWF support to Lake Natron WMA, to implement SSAP and include monitoring through the District (Wetlands) SOER.
d. July 2010: (onwards): LF SSAP implemented through district and Protected Area management plans.
Step 7: Monitoring of Implementa on and Impact:
• May 2010 (onwards): Wetlands Unit, Director Sector Coordina on (DSC) PMO-RALG and Royal Danish Embassy (RDE) undertake annual monitor of LF SSAP progress around Lake Natron, through district reports.
Step 8: Reviews:
• May 2013 (onwards): Rolling reviews and updates shall take place by AEWA Sub-commi ee of NWWG, every 3-5 years so as to align appropriate ac ons based on results on the ground.
1.3. Approach Adopted in Preparing this Ac on Plan
Stakeholders in Tanzania, in February 2008, following the Ramsar review mission of the Lake Natron Soda Mine ESIA, develop the framework for an Integrated Management Plan (IMP) for Lake Natron (Table 14). The IMP was to be based on implementa on of a Na onal Ac on Plan for the Lesser Flamingo through the crea on of a WMA. This was driven by the realiza on that the need for conserva on of the Lesser Flamingo in Tanzania had elicited a lot of global a en on due to the proposed Soda Mine and its ESIA. The way forward therefore requires a coordinated, mul -stakeholder, mul -na onal and mul disciplinary approach and ac on. Development of a LF na onal ac on plan would help in focusing ac on, and by engaging a mul ple of relevant stakeholders, would bring about coordina on, deriving synergy and commitment to a common cause.
This Na onal Ac on Plan was therefore developed through a process that included: • A dra threat list by key lake (Table 2) (Annex 2).• A dra logical framework (Table 15).• A Background Report.• A review of what was known and published of the Lesser Flamingo biology (Annex 5).• Learning from the makers of the Disneynature movie, Crimson Wing.• A research proposal for Lesser Flamingo and (Annex 4)• Development of a proposal for a regional ini a ve (Annex 1).
Throughout, the AEWA/CMS Interna onal Ac on Plan was used as a guide. Its domes ca on however, has drawn extensively on the Kenya Na onal Ac on Plan. It was considered crucial that Kenya and Tanzania are in synchrony. The rst dra , as a Background Report was subsequently edited by the AEWA Sub-commi ee of NWWG. It was then presented to a na onal/regional stakeholder consulta ve workshop, as the basis for naliza on of this document, before going to NWWG for approval and presenta on to NAWESCO for endorsement. The broad based consulta on was not as wide as had been originally planned. Primarily, this was because local donor support did not materialize. The Lake Natron Trust Fund between Ramsar and AEWA/WWF/WCS and Disneynature never took off and regional support, had to await funding of BirdLife through Jensen Founda on. This took me, and did not allow funding for engagement of all stakeholders. The prepara on was therefore dependent on Danida funds for preparing Lake Natron IMP.
The Ac on Plan has a lifespan of 10 years, a medium term budgeted ac on plan of 5 years. It is a rolling plan, guiding implementa on through na onal, local government and protected area managers. As such, it shall be

Tanzania Na onal Single Species Ac on Plan 2010-2020 for the Conserva on of the Lesser Flamingo (Phoeniconaias minor) 4
reviewed and updated every 3-5 years, along with the normal decentralised, local government MTEF planning cycles. An emergency review will be undertaken if there are sudden major changes or local investments liable to adversely aff ect the popula on. Monitoring and evalua on of the progress of the ac on plan in mee ng its objec ves shall be carried out once a year by the AEWA Sub-Commi ee of NWWG, in accordance with decentralised progress repor ng, and annual evalua ons (Table 16).
2.0. CURRENT STATUS OF LESSER FLAMINGO
2.1. Taxonomy
Taxonomic Classi ca on
Kingdom: AnimaliaPhylum: ChordataClass: AvesSuperorder: CarinataeOrder: CiconiiformesFamily: PhoenicopteridaeGenus: Phoeniconaias (G. R. Gray 1869)Species: Phoeniconaias minor (Geoff roy Saint-Hilaire 1798)
Scien sts consider that the taxonomic rela onships of amingos have been diffi cult to establish. Historically, they have been thought to be most closely related to Anseriformes (geese), Charadriiformes (wading birds) or Ciconiiformes (storks) by diff erent researchers. Recent DNA analyses have shown that amingos are most closely related to the Podicipedidae (grebes).
They are divided into two clades based on their gene c similari es: one containing Phoenicopterus ruber, Phoenicopterus roseus and Phoenicopterus chilensis and the other containing Phoeniconaias minor, Phoenicoparrus andinus and Phoenicopterus jamesi.
2.2. Distribu on and Popula on
2.2.1. Global Distribu on and Popula on Status
Tanzania Lesser Flamingo Fact File:
Natron is the only site the EAC Lesser Flamingo’s breed (ie. Kenya, Uganda, Tanzania & Ethiopia)2.5 million birds, 75% of global popula on, depend on breeding and rst feeding at Natron.9 East Africa soda lakes (ie Kenya & Tanzania), are the feeding range of the EAC Lesser Flamingo.25 USD million/year is the es mated tourism value of Flamingos to the EAC.
The Lesser Flamingo (Phoeniconaias minor), the smallest amingo species in size, is a spectacular bird of high and diverse ecological and economic values in tourism and zoos. Despite being the world’s most numerous amingo, this bird is currently classi ed as globally “Near Threatened” by the 2008 IUCN Red List of Threatened
Species (BirdLife Interna onal, 2008). The main reason for this is that the bird has very few breeding sites with only 5 “known natural breeding” sites globally and a single ar cial site. All these sites are threatened by either anthropogenic ac ons (mining, agro-industry and pollu on) or the early aff ects of climate change (a drying climate in southern Africa). There is also a downward trend in the global popula on es mate. Counts suggest a 20-40% decline in recent decades and if this trend were to con nue it would soon meet IUCN criteria for up-lis ng to “Vulnerable” status.
The Lesser Flamingo red list report has more accurate lis ng of reasons for the Near Threatened classi ca on (h p://www.iucnredlist.org/details/144723).
The largest regional sub-popula on, es mated at 75% of the total global Lesser Flamingo numbers, occurs on the 9 alkaline-saline lakes of the Great Ri Valley in East Africa (Figure 1). This East African sub-popula on faces

Tanzania Na onal Single Species Ac on Plan 2010-2020 for the Conserva on of the Lesser Flamingo (Phoeniconaias minor) 5
many real and poten al threats (Table 7, Annex 2 & 3) as indicated by recent mass die off s of tens of thousands of birds.
Key among these threats are:
:tnempoleveD cimonocE .a Large agro-industry demand for water for commercial irriga on, mining, hydro-power and a more long standing threat, soda ash extrac on from Lake Natron. Literature shows that the soda ash proposal is as old as 1996, was proposed again in 2007, but currently in abeyance subject to the EIA.
:serusserP doohileviL .b Low river ows aff ec ng water cycles and sedimenta on of feeding grounds due to catchment overgrazing and deforesta on for fuel or due to re damage, and loss of water due to small scale catchment irriga on, pollu on, disease and habitat loss.
:egnahC etamilC labolG .c Condi ons of these alkaline lakes are exacerbated by the harsh, but fragile climate zones preferred by the bird, desert like, where droughts are rather frequent, the intensity of which are likely to increase due to climate change.
Lesser Flamingos have many important roles, both economic (through eco-tourism) and ecological. Their popula ons and concentra ons in East Africa are unique and of global, regional and na onal conserva on concern, and economic value (ie whereas the tourism value in Tanzania may be a low USD 1-5 million, in Kenya its es mated of USD 26 million, BirdLife pers obs). The birds are sensi ve and respond to seasonal (and manmade) changes in the environmental condi ons of their habitats. Their movements between the lakes are indica ve of the nature of the inter-connected, inter-dependent linkages between food chains, ecological and biological, shared between the saline-alkaline lakes in the region (Figure 1), but the details of which are virtually unknown. For this reason, any ac on plan must call for regional and trans-boundary ac ons (as in Annex 1). The publicity of the suspected recent decline in popula on numbers and the world press given to the proposed Lake Natron soda mine, and the recent Disneynature feature lm, “Crimson Wing”, has brought the plight of the Lesser Flamingo to the a en on of interna onal conserva on organisa ons and global agreements. This in turn has led AEWA to suggest the need for special ac ons to manage the birds, to mi gate their declining trends, and a call to global ac on, by asking countries to produce Na onal SSAPs.
Es ma on of the total global popula on varies due to diff erent coun ng techniques. The nature of the bird’s habitat and its irregular, o en nocturnal mass movement between lakes, makes accurate es mates problema c, par cularly as methodologies are not standardized and that es mates uctuate wildly between observers, and the me diff erence between studies. Compounded by the fact that as birds tend to y at night, they can be here today, gone tomorrow, making total counts impossible! Composites of high and low counts of global non-breeding popula ons over the past 10 years, suggest a wide range from 865,000 to 2,720,000 (a mean of 1,750,000 birds), of which the east Africa sub-popula on ranges from 830,000 to 2,200,000 (a mean of 1 million) (Table 1).
Four separate regional popula ons are recognised for conserva on purposes (Table 1). It is known that some interchange occurs between the East and West African popula ons and it is suspected between Southern and East African popula ons as these are gene cally similar and stable. It is also likely that there is irregular movement between East African Ri Valley sites and those on the Indian sub-con nent, but the full signi cance and extent of these connec ons is unknown
The regional sub-popula ons are:
:acirfA tsaE .a Between 1.5 and 2.5 million: >75% of total, occurs mostly on the nine alkaline-saline lakes of the Great Ri Valley in East Africa.
:aidnI .b Approximately 400,000 occur in north-western India and Pakistan centred on the Rann of Kutch or Kachchh (Kutch is the Pakistani spelling) but breeding is irregular and subject to much disturbance.
:acirfA nrehtuoS .c Between 55,000 and 65,000: Are es mated to be, in southern Africa but this popula on is currently in decline due to poor breeding success at the two main sites (Simmons & Versfeld in press), and McCulloch (in press). These numbers could be a feature of the recent poor breeding success at Etosha Pan and Sua Pan (Botswana), or a re ec on of the success of the new, man-made breeding site at Kamfers Dam, or due to some other factor that needs to be explained.
:acirfA tseW .d Between 15,000 and 25,000 are es mated from counts in West Africa. A ny popula on that is almost certainly not sustainable without immigra on from other regional popula ons as the only known

Tanzania Na onal Single Species Ac on Plan 2010-2020 for the Conserva on of the Lesser Flamingo (Phoeniconaias minor) 6
breeding site is under increasing threat. Reported to have breed in 2009 at A out Es Saheli, in Mauritania (Sidaty and Daf, 2010).
Figures given above are taken from Wetlands Interna onal (2006). It is always diffi cult with an i nerant bird like this to predict if the counts are accurate and sta s cally/scien cally valid across Africa and across me, given diff erences in observers, methodologies and the birds movement pa erns? Diff erent observers tend to extrapolate out from counts in diff erent ways and this creates wildly diff ering results as there is no standardised or regular, unbiased method. The numbers are therefore indica ve and not absolute!
2.2.2. Distribu on and Popula on Status in East Africa:
Recognising that any Tanzania na onal SSAP for the Lesser Flamingo cannot be de-linked from the regional popula on, in-order to ensure harmony, this sec on includes reports from the 4 countries that share the same sub-popula on. These birds are poten ally one and the same i nerant popula on, that share the same gene pool and ancestry.
a. Tanzania
In Tanzania the Lesser Flamingo is largely con ned to the Ri Valley soda lakes of which 50-60% occur inside or adjacent to protected areas (Figure 1, Table 2 and 3).
Concentra ons that meet the Ramsar criteria of 1% popula on (ie 20 000) have been counted at Lakes: Natron, Eyasi, Manyara, Magadi, Empakai, Momella, Ndutu, Burunge, Balangida Lalu, Kitangiri and Singida. (Baker & Baker 2002, Mlingwa & Baker 2006), and Bahi Swamp (Baker in prep) and most likely occur at these sites on a regular basis. Lake Rukwa, which will be the key lake for movement between Eastern & Southern popula ons most probably holds high numbers on a regular basis but has never been counted, and the local PA management notes birds have been absent in recent mes.
High concentra ons o en exceeding several hundred thousand birds, occur at lakes: Natron, Manyara (Figure 5), Empakai and Eyasi.
Large numbers are seldom seen far from the Ri Valley, but records by Tanzania Bird Atlas Project (TBAP) show a wider dispersal range (Figure 2) (Baker & Baker in prep). Successful, breeding in Tanzania has only been recorded at Lake Natron during the past 50 years, but prac ce nest building has been observed at Lakes Rukwa, Momella, Manyara and Eyasi (Baker pers comm), but outside of Natron, no records show successful breeding elsewhere in Tanzania, and there are no records of any kind pre-da ng this sta s c from Tanzania (Table 5).
In East Africa, the popula on in the period 1990’s to 2009 es mated at diff erent mes throughout the year, uctuated between 1.5 and 2.5 million birds (Table 2). Due to the uctua on in numbers and irregular data, it is
not possible to draw much fact from the na onal popula on es mates.
Distribu on quality data in Tanzania is good as it is derived from the Tanzania Bird Atlas Project, based on 1 150 observa ons reported by birdwatchers na on-wide, and covers all months of the year (Figure 2). Popula on es mates data however is weak as there has never been a coordinated regional nor na onal census. The large es mate range is the result of infrequent counts (o en only es mates) that ignore large-scale movements of birds among sites and range states, resul ng in low minimum counts and high maximum counts for individual sites. In par cular, the minimum counts are rather meaningless especially as they rarely, if ever, represent a total count of any par cular site. Several of the Ri Valley oor lakes (which are rather shallow) can be completely dry in years of poor rainfall, hence zero would be a minimum. In addi on, data is subject to seasonal varia on, which can be high as exhibited by recent counts on Lake Manyara. Figure 5 shows a seasonal range from 9 to 640 thousand birds. The data is therefore only indica ve of popula on numbers.
Lesser Flamingos have also been recorded in several other sites, but in lower numbers including: coastal salt

Tanzania Na onal Single Species Ac on Plan 2010-2020 for the Conserva on of the Lesser Flamingo (Phoeniconaias minor) 7
works and inter dal habitats (Table 2 and 3).
b. Kenya:
In Kenya, the Lesser Flamingo is largely con ned to the Ri Valley soda lakes (Figure 1, Table 4). Major concentra ons are found at Lakes Nakuru, Bogoria and Elementeita. Concentra ons of feeding birds could once upon a me exceed one million at lakes Nakuru and Bogoria (But this has not been the case within the past 15 years)(see below). They are seldom seen far from the Ri Valley.
In Kenya the na onal popula on, in the period 1992 to 2007 es mated in the months of January, uctuated between 280,000 and 1,450,000 birds with a mean of 940,000 (Figure 3). This is a non-breeding popula on, but a few a empts have been recorded (Table 5). In most years, the na onal popula on es mates were above 750,000, while low es mates of less than 400,000 birds were recorded in the years 1996, 2004, 2005 and 2007. Data quality in Kenya is good for lakes counted on a regular basis. It is derived from the past 20 years of regular bi-annual waterbird counts. The large es mate range is the result of frequent large-scale movements of birds among sites and range states, resul ng in low minimum counts and high maximum counts for individual sites. Here again, the minimum counts are rather meaningless as several lakes are known to dry out completely in extreme years, with zero birds.
Lesser Flamingos have been recorded in several other sites, but in lower numbers including Lake Magadi, Lake Naivasha, Lake Simbi, Amboseli Na onal Park, Dandora Sewage Ponds, Lake Ol Bolossat, Dunga Swamp, Lake Baringo and Mombasa Salt Works among other sites, especially along the coast.
c. Uganda:
Es mated popula on ranges from 44 to 17,000 with a 1999 high of 62,800. This is a non-breeding popula on in alkaline soda lakes, 97-100 % in protected areas, all IBAs, but none in Ramsar Sites.
Found in Lake Kasenyi, Lake Kyambara, Lake Munyanyange and Lake Nyamunuka.
d. Ethiopia:
Es mated popula on ranges from 3,300 to 24,000 with a 1992/3 high of 243,000. This is a non-breeding popula on, 18-38% in protected areas, 100% in IBAs, but none in Ramsar Sites.
Found in several loca ons: Akaki-Aba Samuel wetlands, Lake Abijata, Lake Awassa, Lake Chitu and Green Lake. Believed to have breed in 2005 in Lake Abijata, producing 3,000 chicks.
2.3. Migratory Movements
2.3.1. Global movements
The Lesser Flamingo is regularly seen in 30 countries from West Africa, across sub-Saharan Africa and along the SW Asian coast to South Asia, and occurs as a vagrant in 26 addi onal countries and territories. However, its global popula on is concentrated in 73 sites, in just 12 primary range states, each of which regularly holds >1% of the breeding or non-breeding popula on (over 20,000 birds). Lesser Flamingos are regularly found in the geographical region of West Africa, East Africa, Southern Africa and South Asia. Con rmed regular breeding is con ned to only ve natural (and one manmade) sites in four of these countries.
When not breeding, the Lesser Flamingo occurs in virtually all sub-Saharan countries and from the Arabian Peninsula to India. It is an i nerant species with ocks constantly on the move between feeding sites that are o en in diff erent countries and several hundred kilometres apart. These movements occur mostly at night.

Tanzania Na onal Single Species Ac on Plan 2010-2020 for the Conserva on of the Lesser Flamingo (Phoeniconaias minor) 8
2.3.2. East African Movements
The Lesser Flamingo is highly nomadic. In East Africa, the number of individuals on a given lake has been shown to double or halve in a period of just two weeks (Figure 5). This makes total counts diffi cult, renders the es mates above meaningless, and makes management of stocks impossible.
To understand individual movements of amingos, a four-year study, was undertaken (from October 2002) at Lake Bogoria, with satellite transmi ers affi xed to seven adult male Lesser Flamingos (Figure 4). The individual birds showed diff erent movement pa erns, which included frequent visits to a network of sites. The study showed that the key sites network for Lesser Flamingos in East Africa consists of seven alkaline lakes in Kenya (Logipi, Bogoria, Nakuru and Elementeita) and Tanzania (Natron, Manyara and Eyasi) and an ephemeral fresh/alkaline wetland in central Tanzania (Bahi Swamp). The total distances individuals travelled during the study period varied from 684 km to 19,750 km, some ying a distance of >900 km away from the tagging site. What was signi cant about this study is that the birds all followed the same ight path, a straight line up and down the Ri Valley, visi ng the same select lakes (Childress 2007; B. Childress, pers. comm.). None of these birds visited the coast or any of the many peripheral sites, and none le the East Africa region.
A satellite tagging study of 3 Greater Flamingos in Tanzania showed similar North-South movements along the Ri Valley but with two birds visi ng the coast for varying amounts of me (Baker et al., 2006).
2.4 Protec on Status:
In Tanzania, the level of protec on off ered to Lesser Flamingo can be demonstrated by:a. The protec on status of the sites it occupies (Table 3).b. Interna onal and regional conven ons which are of relevance (Table 8), and c. Relevant na onal laws, policies and ins tu ons that protect the species and its habitat (Table 9). The Lesser Flamingo is a protected species (interna onally) and it is illegal to deliberately set out to kill, capture (young or adults) and to trade in live animals, or their products, or to destroy their nests or harvest their eggs in all of the primary range states, including Tanzania. Only in Tanzania, it is perfectly legal to trap, maintain in cap vity and export lesser amingos provided permits are rst obtained from the Director of Wildlife. This protec on is derived from the above interna onal trea es and na onal legisla on, and in Tanzania, through village by laws, plans are to include this in local government legisla on, through the WMA process. The penal es vary among countries, include heavy nes and jail sentences. The Tanzania quota for trade in live Lesser Flamingos is 1,600/year.
The recent interest in amingos caused by the campaigns against the Soda Mine on Lake Natron, means that generally, the a tude of the public and conserva on authori es in Tanzania, toward the Lesser Flamingo is posi ve, although it is not well known among the public in those lakes in more isolated, and inhospitable places. Conserva on authori es in Tanzania, consider the Lesser Flamingo a species of special concern that needs to be protected. As a result, in 2001, Lake Natron was established as a key Ramsar site, and several other sites are in protected areas or declared IBAs (Table 3).
Facts About The Natron Ramsar Site
Ramsar Site No: 1TZ002Site Name: Lake Natron BasinDesigna on Date: 04-07-2001Coordinates: 02°21’S 036°00’E
Eleva on: 600 m - 3000 mRamar Site Area: 224,781 ha
Loca on: Ngorongoro and Longido Districts, Arusha Region, Northern Tanzania.Transboundary: Con guous with the Kenyan catchment.
Ramsar Criteria: 1 ,2 ,3 ,4 ,5 ,6 ,7• 100% of the EAC and 75% of the global popula on of Lesser Flamingo, breed at Natron.• 3 Acalapia cichlid sh species are endemic to Natron (with more suspected specia on).• Spirulina platensis an alga, is unique to Natron, and cri cal to Lesser Flamingo feeding.
• 100 000 Palaear c, migratory water birds.
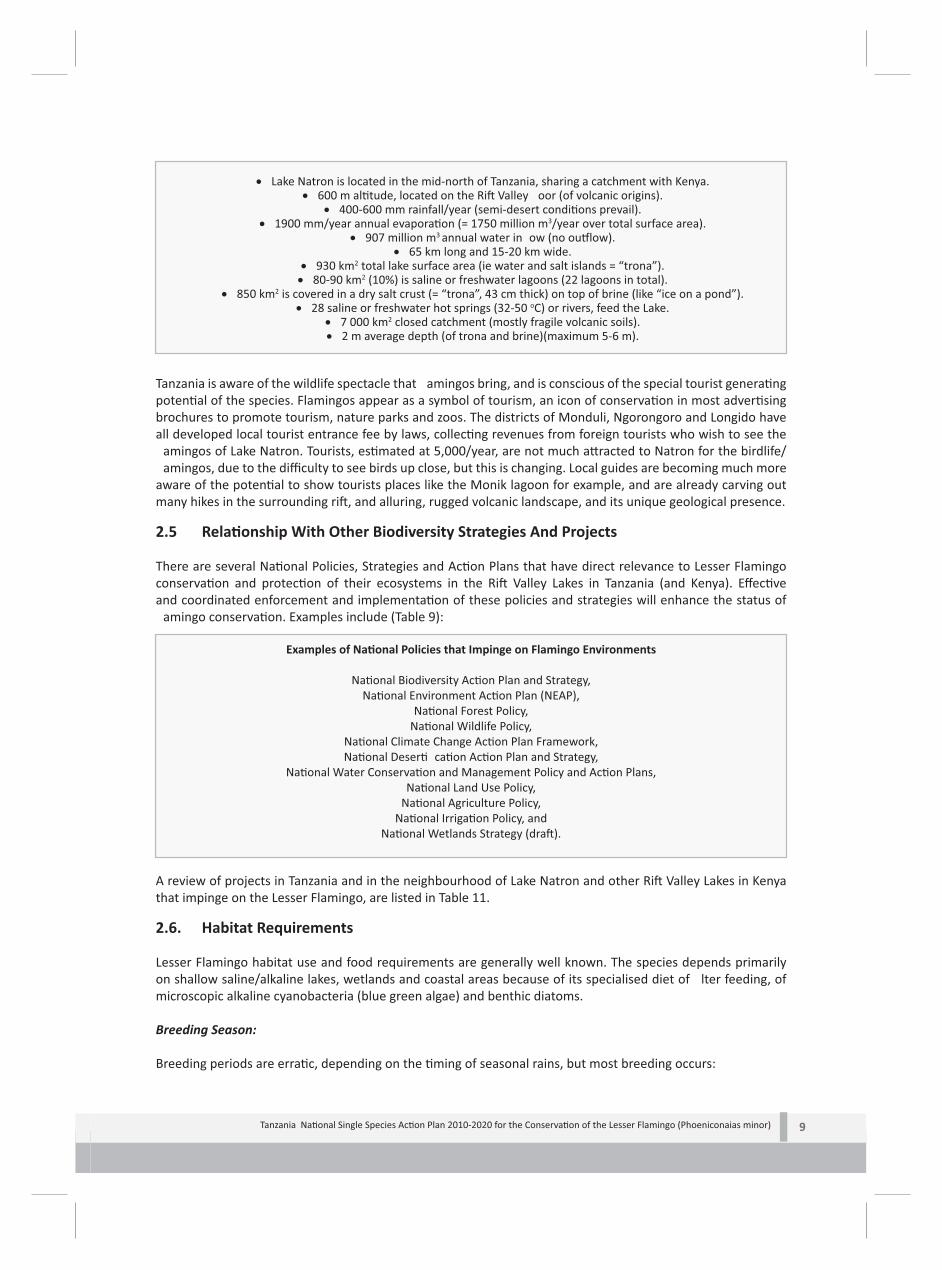
Tanzania Na onal Single Species Ac on Plan 2010-2020 for the Conserva on of the Lesser Flamingo (Phoeniconaias minor) 9
• Lake Natron is located in the mid-north of Tanzania, sharing a catchment with Kenya.• 600 m al tude, located on the Ri Valley oor (of volcanic origins).
• 400-600 mm rainfall/year (semi-desert condi ons prevail).• 1900 mm/year annual evapora on (= 1750 million m3/year over total surface area).
• 907 million m3 annual water in ow (no ou low).• 65 km long and 15-20 km wide.
• 930 km2 total lake surface area (ie water and salt islands = “trona”).• 80-90 km2 (10%) is saline or freshwater lagoons (22 lagoons in total).
• 850 km2 is covered in a dry salt crust (= “trona”, 43 cm thick) on top of brine (like “ice on a pond”).• 28 saline or freshwater hot springs (32-50 oC) or rivers, feed the Lake.
• 7 000 km2 closed catchment (mostly fragile volcanic soils).• 2 m average depth (of trona and brine)(maximum 5-6 m).
Tanzania is aware of the wildlife spectacle that amingos bring, and is conscious of the special tourist genera ng poten al of the species. Flamingos appear as a symbol of tourism, an icon of conserva on in most adver sing brochures to promote tourism, nature parks and zoos. The districts of Monduli, Ngorongoro and Longido have all developed local tourist entrance fee by laws, collec ng revenues from foreign tourists who wish to see the amingos of Lake Natron. Tourists, es mated at 5,000/year, are not much a racted to Natron for the birdlife/ amingos, due to the diffi culty to see birds up close, but this is changing. Local guides are becoming much more
aware of the poten al to show tourists places like the Monik lagoon for example, and are already carving out many hikes in the surrounding ri , and alluring, rugged volcanic landscape, and its unique geological presence.
2.5 Rela onship With Other Biodiversity Strategies And Projects
There are several Na onal Policies, Strategies and Ac on Plans that have direct relevance to Lesser Flamingo conserva on and protec on of their ecosystems in the Ri Valley Lakes in Tanzania (and Kenya). Eff ec ve and coordinated enforcement and implementa on of these policies and strategies will enhance the status of amingo conserva on. Examples include (Table 9):
Examples of Na onal Policies that Impinge on Flamingo Environments
Na onal Biodiversity Ac on Plan and Strategy,Na onal Environment Ac on Plan (NEAP),
Na onal Forest Policy,Na onal Wildlife Policy,
Na onal Climate Change Ac on Plan Framework,Na onal Deser ca on Ac on Plan and Strategy,
Na onal Water Conserva on and Management Policy and Ac on Plans,Na onal Land Use Policy,
Na onal Agriculture Policy,Na onal Irriga on Policy, and
Na onal Wetlands Strategy (dra ).
A review of projects in Tanzania and in the neighbourhood of Lake Natron and other Ri Valley Lakes in Kenya that impinge on the Lesser Flamingo, are listed in Table 11.
2.6. Habitat Requirements
Lesser Flamingo habitat use and food requirements are generally well known. The species depends primarily on shallow saline/alkaline lakes, wetlands and coastal areas because of its specialised diet of lter feeding, of microscopic alkaline cyanobacteria (blue green algae) and benthic diatoms.
Breeding Season:
Breeding periods are erra c, depending on the ming of seasonal rains, but most breeding occurs:

Tanzania Na onal Single Species Ac on Plan 2010-2020 for the Conserva on of the Lesser Flamingo (Phoeniconaias minor) 10
Breeding Seasons in 5 Global Breeding Sites
1. November and April in Botswana.2. November and January in Namibia.3. September and November in South Asia (India).4. November and February in southern Africa.5. October and January in Tanzania.
Breeding however, can occur all year round in Lake Natron, if condi ons are right (Figure 6 and Table 6). Large colonies are evident a er large rainfall events. Regular smaller colonies on fringes of Gelai ats occur even during the dry season, on retrea ng water edges. Suggests the bird has adopted, too, a dry and wet season strategy (Aeberhard, per obs). Regular breeding in West Africa has not been con rmed, but incidences have been documented (Sidaty and Daf, January 2010 in Senegal Delta, West Africa). During breeding periods, if there has been suffi cient rainfall and breeding condi ons are suitable, Lesser Flamingos congregate at the above 5 well-known and regular breeding sites, frequently in large mixed breeding colonies with Greater Flamingo.
The East African popula on has not bred outside of Lake Natron, Tanzania, in the last 50 years. Past records (Table 5) show that it bred in large numbers in Kenya at:
• Magadi (1962).• Turkana (1957).• Logopi (1978). • Bogoria (1979/80). A empts perhaps at prac ce nes ng.
The four other known, regular, large scale natural breeding sites, and a few vagrants, notably:
• East Africa: The only known breeding site currently in East Africa is Lake Natron. • Southern Africa: Two regular natural breeding sites in southern Africa (Makgadikgadi Pans in Botswana, 800
pairs in 1978 and 54 000 pairs in Etosha Pan in Namibia, in 1971). • South East Asia: Two in India (Zinzuwadia and Purabcheria salt pans). The site near Bela in Great Rann of
Kachchh in India, reported 1000-2250 breeding pairs in 1973, has yet to be documented.
Yet to be con rmed are:
• West Africa: Breeding at A out es Sâheli in Mauritania in 1965, 900 pairs (but has yet to be con rmed). (See de Naurois, R. 1965) and 2400 couples in January 2010 (Sidaty and Daf, 2010).
• Ethiopia: Breeding at L ake Abijata, in Ethiopia, in 2005, produced 3,000 chicks. (See Flamingo 16, 2006). • Zambia: Breeding in Mweru Wan pa Lake in Zambia, in 1955, some 630 breeding pairs were believed
unsuccessful. (The Lesser Flamingo is now considered a rarely-seen vagrant in Zambia, Childress et al., 2008).
Of these breeding sites, only Etosha Pan and the two sites in India are offi cially protected.
Breeding on a new ar cial island, has also been recorded in S. Africa, notably:
• S. Africa: Kamfers Dam in S. Africa, a recent, man-made, protected breeding site, in 2008, produced 9,000 chicks.
Although this site is under increasing threat from urbaniza on it has shown that “ar cial islands” are worth considering and indicates that a shortage of suitable nes ng sites is a key constraint to the survival of the species. This also suggests that natural breeding areas could be enhanced with man-made interven ons.
Breeding habitat requirements:
Key to breeding success of the Lesser Flamingo are:a. Inaccessibility: Inaccessible to, and minimum disturbance from humans, mammals and avian predators.

Tanzania Na onal Single Species Ac on Plan 2010-2020 for the Conserva on of the Lesser Flamingo (Phoeniconaias minor) 11
b. Seasonal Flooding: Subject to seasonal ooding that is shallow (and calm), but suffi ciently deep and long las ng to so en the nes ng material and prohibit terrestrial predators from land access, reaching the nes ng colony. Seasonal ooding not only triggers nes ng but helps to protect nests.
c. Caus c Waters: Preferably waters of a caus c nature to add to the “moat” eff ect of protec ng nests and young, and of enhancing primary produc on of the amingo’s food, cyano-bacteria.
d. Nest Material: Material that is so enough a quan ty (ie one nest weights 7 kg) to excavate within reach of the nest site, yet will harden to form the nest mound and will resist weathering from light rain (and not too muddy!).
e. Abundance of Food: Within easy “suitable” reach or days ying distance or from the lake, of a good “reliable” feeding site for the parents (eg Birds feed at Manyara and Empakai when nursing young at Natron).
f. Availability of Freshwater: With suitable freshwater springs/supply for juvenile birds to either drink and bathe (or for dilu on of lake brine to produce suitable environment for primary produc on or for enrichment of organic muds as food for pre- edging stages)(See below).
g. Available Juvenile Feeding: Now considered more important, are mud- ats were young can nd food supplements in the organic muds. At some point the chicks, edged or not, start to self provision. Ma Aeberhard (Pers Obs, 2008) witnessed (and lmed) young un edged chicks s rring up muds with feet and beak, drinking the s rred up liquids and physically inges ng mud lumps. Further, edged juveniles were observed to spend signi cant me at Natron a er leaving the colonies, star ng to feed on benthic diatoms with increasing effi ciency as parental provisioning declines, and lter feeding den on develops. Whether this food supplement is necessary for successful breeding, or simply advantageous to recruitment (by providing addi onal, supplementary nutri on) is a point to be researched.
The hot springs at Natron do have a role in the breeding and recruitment of amingos, providing rela vely fresh water, rich in mineral nutrient from the underground springs, crea ng areas of rich, organic muds as nursery feeding grounds. Without this supplement, Root and Brown (1975) observed young at Lake Magadi took an addi onal 20 days to edge, extending edging me from 70 days at Natron to 90 at Magadi. Could the 30% increase in me represent the propor on of food the young self-provision in Natron, which was not possible in the nutrient poor Magadi?
Feeding habitat requirements:
Key to the feeding biology of Lesser Flamingo are:
a. Hydro-chemistry: Water chemistry that enables high produc vity and growth of cyano-bacteria and diatoms, as food for both adults and juveniles.
b. Mud Surface: Wet mud suppor ng the growth of diatoms and organic material (ie Awfuchs = organic muds).c. Calm Waters: Several hours each day when the surface of the water is suffi ciently calm to enable the
amingos to lter feed. If the surface of the water is not calm, they are unable to feed and are con ned to the limited areas of wet mud.
2.7. Biology and Ecology
2.7.1. Produc vity & Survival
Individual Lesser Flamingos, it is believed, do not breed annually and their clutch size is one. Between 1953 and 1962, es mated mean breeding success in ve major breeding a empts observed at lakes Natron (Tanzania) and Magadi (Kenya) was 41-43% (range: < 5% - 70%) of eggs laid (Brown and Root, 1971). Most of the mortality occurred during the rst three weeks. Key sources of loss were (Figure 6):
a. Preda on: Preda on (ie. marabou storks, sh eagles and vulture have been reported). Brown & Root (1971) believed the main predator at the me was the Egyp an Vulture. Ma Aeberhard (Per obs, 2008) observed no vultures at all at Natron (but did see lappet faced vulture preda on in Botswana). He did observe that sh eagles predate chicks at Natron, along with other eagles (ie tawny eagles, steppe eagle), and witnessed
signi cant direct marabou preda on. The consequences of the la er, included considerable nest deser on,

Tanzania Na onal Single Species Ac on Plan 2010-2020 for the Conserva on of the Lesser Flamingo (Phoeniconaias minor) 12
and the sca ering through panic of chicks (which might explain numbers of lost and starving chicks on the ats). Direct preda on and indirect preda on (through disturbance) are totally linked in this case. Aeberhard
also witnessed to a lesser degree, preda on of chicks by jackal as the crèches made landfall on the eastern shores, and occasionally by marsh mongoose.
b. Deser on: Nest deser on (due to disturbances by predators, tourists, low ying aircra , etc). c. Mud Traps: Ge ng entrapped in the mud surrounding the nes ng area. d. Soda Anklets: Anklets of soda forming on the legs “and body”. Ma Aeberhard (Pers comm 2008) observed,
o en chicks have accreted soda on plumage. Some bills and eyes were observed welded shut. e. Egg Deaths: Heavy rainfall during breeding can lead to soda accumula on on the eggs, suff oca ng the
embryo, leading to pre-hatch mortality. This has given rise to several reports of alleged “nes ng failure”, which in fact are dead eggs washed up in next seasons oods.
Lesser Flamingos can live upto 40 years in the wild. This was es mated from the recapture of a bird ringed 41 years earlier by Brown and Root (Childress 2004). They have an es mated genera on length of 22-24 years. There is insuffi cient data to es mate annual mortality/survival.
2.7.2. Life History.
Lesser Flamingo Pro le:
• 40 year average life span.• 3-4 years to maturity.
• 28 day incuba on period, both sexes incubate.• 80-90% hatch rate (loss due to nest drowning, salt accre on, preda on, abandonment due to stress).
• 70 day to edging (Fed daily by parent’s “crop milk”, sourcing food at night from nearby lakes).• 8 day leave nest, form crèche.
• > 30 day rst feeding in organic mud (Far more signi cant than earlier recorded).• 40 % success rate (loss due to preda on, salt accre on, injury, separa on due to stress).
• 3 months immature birds con nue to feed (before rst ight out of the Lake).
Breeding:
Believed to reach sexual maturity at 3-4 years of age, Lesser Flamingo adults generally breeds following seasonal rains that provide the ooding necessary to isolate remote breeding sites from terrestrial predators and provides the so muddy material for nest building. Nests are built from soda and mud or crystalline soda substrate. Mean incuba on is 28 days. Chicks leave the nests at 6-8 days and migrate in crèches to water or feeding areas. Fledging takes ~70 days (although the one me recorded breeding took place in Lake Magadi, it took 90 days). Lesser Flamingos do not breed readily in cap vity, but have breed in a man-made island (Kamphers dam, S. Africa).
Feeding:
Feed on species of microscopic cyano-bacteria and benthic diatoms found only in alkaline lakes, saltpans, saline lagoons and estuaries. Feed primarily by walking and, in deep water, swimming, ltering the algae and diatoms with a specialised bill that contains up to 10,000 microscopic lamellae. Pre- edgling stage is also believed to feed directly on “organic muds” in the shallows of foreshore mud ats, prior to forma on of the beak and development of the lter mechanisms (M. Aeberhard, pers. comm.). Aeberhard goes on to observe that when Natron is in full breeding with mass colonies of young, adults are ac vely seen ying between Natron and Manyara and Empakai poten ally feeding themselves so that they can produce suffi cient crop milk for the young. Crop milk unique to the species is produced in the crop as a red, milky substance, believed to contain blood.
Outside breeding season:
In Eastern Africa they congregate in huge ocks on major feeding lakes, but can disperse widely amongst the Ri Valley lakes, coastal and other inland water (Figure 1).

Tanzania Na onal Single Species Ac on Plan 2010-2020 for the Conserva on of the Lesser Flamingo (Phoeniconaias minor) 13
2.8. Threats and Poten al Threats (Problem Analysis)
2.8.1. Cri cal and High Threats:
The most “cri cal” threats to the survival of the Lesser Flamingo are listed in Annex 2 and 3, and for Tanzania (Table 7). Factors causing or likely to cause very rapid popula on decline of more than 30% over 10 years or three genera ons, are thought to be:
a. Habitat Loss and Degrada on
The loss and/or the degrada on of the LF specialised breeding and feeding habitat is aff ec ng its survival, and of par cular concern is hydrological changes resul ng from ac vi es altering water cycle (caused by river damming and increased water abstrac on for irriga on, mining, tourism or domes c needs), bringing about hydro-chemical changes in water quality (due to poten al soda mining, drought, over abstrac on leading to increased salinity, pollu on, or eutrophica on due to fer lisers, sewage or industrial effl uent run-off , etc). Notably:
1. Mining Ac vi es: The loss and/or degrada on of the key breeding sites (eg Lake Natron) due to possible mining ac vi es (eg soda ash) and related changes in hydro-chemical balance due to water needs.
2. Over-grazing: Catchment damage aff ec ng hydro-logical cycle due to erosion and run-off increase from overgrazing in fragile landscape environments, reducing percola on recharge of ground water (eg. Natron and Eyasi), excessive ooding and silta on of foreshore and turbidity, reducing produc vity of lagoons.
3. Global Climate Change: Given the fragile nature of the almost desert like ecosystem of alkaline lakes (ie 400-600mm/year rainfall), any slight change in weather pa ern would have consequences for the hydro-chemistry (eg Lakes Natron, Manyara and Magadi/Ngorongoro, as witnessed in 2009 drought). Climate change can be over-arching in its eff ects and this may need adapta on considera on in future revisions to the Tz LF SSAP.
4. Fer lizer and Pes cide: Farming in the catchment leading to residues owing downstream and pollu ng the lake, could contribute to die outs (eg Lake Manyara).
5. Abstrac on for Human Use/Irriga on: Excessive use of water for catchment irriga on and domes c needs are reducing ows, aff ec ng hydrology in fragile, shallow lake ecosystems (eg. Lakes Manyara, Bahi, Natron and Burungi). This could be exacerbated by proposals to increase irriga on schemes in the catchments. Considera on needs to be given to more ra onal, more effi cient water use.
b. Toxicology, Disease and Harvest:
• Agro-chemical: Due to high levels of agriculture in catchment, likelihood of downstream contamina on is high (eg. Manyara).
c. Preda on, Compe on:
• Predators: In par cular Marabou and bird predators on Lake Natron.
2.8.2. High and Medium Threats
Threats of “high to medium importance” (factors causing or likely to cause rapid declines, ie 20-30% over 10 years or three genera ons) were determined to include:
a. Habitat Loss and Degrada on
1. Road Construc on: Bringing dust and disturbance due to close proximity (eg Singida Lake).2. Deforesta on and Bush res: Deforesta on from anthropogenic ac vi es like fuel and mber cu ng,
uncontrolled burning and agricultural clearing is leading to silta on or sedimenta on from soil erosion and increased run-off (= reduced percola on), could adversely aff ect feeding and nes ng. Including burning of springs can change the water dynamics.

Tanzania Na onal Single Species Ac on Plan 2010-2020 for the Conserva on of the Lesser Flamingo (Phoeniconaias minor) 14
b. Toxicology, Disease and Harvest:
• Toxicology and Disease: Poisoning (par cularly by cyano-bacteria toxins) and infec ous diseases (mycobacteriosis and avian cholera) exist as poten al threats, if coupled with climate or other hydro-chemistry changes.
All other threats, including human disturbance of non-breeding sites, small scale salt extrac on, collision with overhead structures, compe on with other species for food and breeding sites are perceived as being threats of local importance (factors causing or likely to cause negligible decline). A detailed descrip on of threats is presented as the basis to guide Protected Area, District and village Development Planning, for inclusion in site IMPs and PA GMPs, notably:
a. A lis ng of general threats (adapted as per Interna onal SSAP, to Tanzania) are provided in Annex 2.b. Threat importance rankings at key core lake sites for Tanzania, are in Table 7. c. A problem tree analysis of threats (global, but with ranking as presented by Kenya SSAP) (Annex 3).
Despite “protected area” status of some areas, like the NCAA lakes, water extrac on in the catchment for tourism, is a big issue for Magadi (ie Ngorongoro crater) lake (from the rim tourist lodges), and Empakai will soon have a new lodge, as will Masek in Serenge NP (which, by extension this includes Ndutu as they share a water table). Plans for Masek included a de-salina on plant (which will increase lake salinity). So there will poten ally be possible signi cant degrada on of these sites in the near future.
c. Mass Mortali es:
A recent study by Kihwele (2009) notes mass die-off s in Lake Manyara (and Momella) in July-August 2004. He es mated 15 000 birds, but Park staff es mates suggested 43 850), February 2008 and August-September 2008 (= 1 000). The deaths were concentrated around: Jangwani, Msasa, Endalla, Bagayo, Endabash and Maji Moto areas, mostly along only the western shoreline of the park, along the boundary receiving run-of from Kidatu hills area, a rich agricultural farming area.
Believed was a similarity to deaths in Kenya, from cyanotoxins. Popula ons were high at the me 640 000- 1.5 million birds. In May 2005, some 37,000 were es mated to have died at Lake Manyara derived from physical counts of dead birds along the eastern shoreline (N. Baker pers. comm.).
Notably, alleged “mass die-off s of birds and eggs” have been reported at Natron, but Ma Aeberhard (Pers com, 2008) notes these reports might in fact refer to dead birds/eggs which were naturally accumulated over signi cant periods of me (on the soda at) and washed up into strand lines around the shores during signi cant ooding events (ie they were not mass die outs as was originally thought, but a wash of last year’s dead eggs
and juveniles to shore!).
d. Harves ng:
Considera on is needed to make the trade in live birds more sustainable in the long term, but current trade of 1,600/year may not be signi cant. However, loss due to poor capture and handling, can give rise to a higher loss than these numbers suggest. In addi on, cap ve deaths due to diffi cul es in feeding ar cial forms of food, may result in a high a ri on rate, requiring regular top-up by capture from the wild.
2.9. Stakeholder Analysis
Stakeholders and ins tu ons whose ac vi es have a direct impact on amingo conserva on are many and varied. They range from central government, local government, public ins tu ons (ie TAWIRI, SUA, UDSM, etc), civil society groups (NGOs), community based organiza ons (CBOs), private sector organiza ons, tourists, landowners and local communi es. The key oversight body of this Tz LF SSAP is the NWWG AEWA SC. The stakeholder impacts on LF, range from posi ve ini a ves that support amingo conserva on to nega ve impacts that may be scaled from low to very high on the species and their habitats, as indicated in Table 10.

Tanzania Na onal Single Species Ac on Plan 2010-2020 for the Conserva on of the Lesser Flamingo (Phoeniconaias minor) 15
2.10. Risks and Opportuni es Likely To In uence Success of Ac on Plan Implementa on
There are several ini a ves, programmes and ac vi es that have created opportuni es for be er conserva on of the amingos (Table 11). These need to be integrated, expanded and developed further as a basis of enhancing amingo conserva on. On the other hand, there are many land use and development processes that exacerbate
the risks and threats to amingo conserva on. These need to be mi gated through mul -sectoral and inter-regional ini a ves as a basis of enhancing amingo conserva on. Some of the risks are:
a. Failure to secure adequate technical and nancial support to implement the LF SSAP.b. Policy makers do not consider LF conserva on a priority versus local poverty reduc on development needs,
and it is not included or not given support in VDP, DDP, GMP, etc.c. Global climate change con nues unabated and exacerbates the local fragile environmental condi ons,d. Inter-regional coopera on fails to contain possible toxicological or disease condi ons spreading from one
stock to the other.
3. Tanzania Lesser Flamingo Ac on Program
The following is abstracted from the AWEA Interna onal LF SSAP as the over-arching guide of the development objec ves of the Tz LF SSAP.
3.1. Interna onal Vision, Aim and Objec ves
3.1.1. Interna onal LF SSAP Aim:
The removal of the Lesser Flamingo from the IUCN Red List of Threatened Species globally and in each of its four regional popula ons by 2020.
OVI = Based on IUCN Red List criteria.
3.1.2. Interna onal LF SSAP Objec ve:
To stabilize the size and distribu on of regional and global non-breeding popula ons at 2009 levels by 2012.
OVI = Based on a coordinated annual African/Asian Waterbird Census surveys and tri-annual aerial surveys. (Provided a suitable method of coun ng can be developed).
3.1.3. Key Results to be achieved by Interna onal LF SSAP:
1. Ensuring that all key breeding and feeding sites are maintained in good ecological condi on. (OVI = measured by water levels, salinity and food prey (micro-bacteria and diatom) at key sites are maintained at levels that are ideal for Lesser Flamingos).
2. Ensuring that breeding colonies are not disturbed by human ac vity. (OVI = measured by ve-year mean level of breeding success at ≥50%).
3. Reducing the eff ects on regional popula ons of toxicological and/or infec ous diseases. (OVI = measured by mass die-off s in the East African regional popula on eliminated).
4. Ensuring that harves ng of eggs and trade in live specimens has no eff ect on the regional Lesser Flamingo popula ons. (OVI = measured by popula on viability analysis (PVA) to con rm that harvest is within the safe limits of exploita on, that na onal legisla on on egg harves ng is passed and enforced and CITES recommenda ons on trade are properly implemented).
5. Minimising collisions with manmade structures. (OVI = measured by number of reported LF mortali es due to collision with man-made structures declined to 25 % of the 2009 level).
6. Minimising human disturbance at non-breeding sites. (OVI = measured by no reports of human disturbance at non-breeding sites).
7. Filling knowledge gaps. (OVI = measured by monitoring reports and research reports in scien c publica ons and that funding for necessary research can be obtained).

Tanzania Na onal Single Species Ac on Plan 2010-2020 for the Conserva on of the Lesser Flamingo (Phoeniconaias minor) 16
3.2. E Africa, Regional Vision, Aim and Objec ves
This is seen as the regional, over-arching guide to the developmental objec ves of the EA LF SSAP.
3.2.1. Regional Aim
To stabilize the size and distribu on of the regional breeding and non-breeding popula ons.
3.2.2. Regional Objec ves
Regional coopera on between Tanzania, Kenya, Uganda and Ethiopia to harmonise and coordinate the implementa on of na onal LF SSAP, to bene t the East Africa sub-popula on as a whole.
See Annex 1.
3.3. Kenya’s Vision, Aim and Objec ves:
The Logical framework of Kenya’s SSAP is summarised in Table 13 as a basis to harmonise with the Tanzania SSAP, given that they are the same, shared stock.
3.3.1. The Kenya Vision is:
A stable, viable and healthy East African popula on of the Lesser Flamingo.
3.3.2. The Kenya Aim is:
To stabilise popula on size and distribu on of the Lesser Flamingo at an average number of no less than 900 000 individuals within the next ve to ten years.
3.3.3. The Kenya Objec ves are:
a. All key sites maintained in good ecological condi on.
b. Disturbance stopped at key non-breeding sites and at sites where birds are known have a empted to breed or to have tradi onally bred.
c. Impact of poisoning and diseases on Lesser Flamingo popula ons reduced.
d. An opera onal na onal and regional network and collabora on programme for the conserva on of the Lesser Flamingo ini ated and sustained
e. Knowledge gaps on aspects of the Ecology of Lesser Flamingo such as popula on numbers and distribu on, threats, values, and causes of die-off s lled.
3.4. Tanzania Vision, Aim and Objec ves: 3.4.1. Tanzania’s LF SSAP Aim:
To stabilize the size and distribu on of the na onal breeding and non-breeding LF popula ons at 1.5 million birds in key sites by 2020, through local na onal and regional ac on (Table 15).
3.4.2. Tanzania LF SSAP Objec ves:
The aim of Tanzania SSAP is: Adop on of the Interna onal SSAP objec ves (Sec on 3.1.3), domes cated to Tanzania condi ons.

Tanzania Na onal Single Species Ac on Plan 2010-2020 for the Conserva on of the Lesser Flamingo (Phoeniconaias minor) 17
The expected outputs from the Tz LF SSAP, area. All key breeding and feeding sites are maintained in good ecological condi on.b. Breeding colonies are not disturbed.c. The eff ects of poisoning and/or diseases, reduced.d. Harves ng and trade in live specimens has no eff ect on the Lesser Flamingo popula ons.e. Minimised collisions with manmade structures.f. Minimised human disturbance at non-breeding sites.g. Knowledge gaps lled.h. Ins tu onal and administra on arrangements for implementa on of the LF SSAP, in place.
3.4.3. Tanzania Key LF Sites: The focus of the Tanzania LF SSAP will be on the following key sites, de ned as mee ng Ramsar criteria of 1% of bio-geographical popula on (ie + 20,000 birds), listed in 2 categories, in order of priority for the Lesser Flamingo (Table 15):
Unprotected key sites, and therefore priority for management, and associated management:• Lake Natron (Protected by 2 WMAs, u/way) Ngorongoro & Longido DC, and Ramsar PM.• Lake Manyara (only 50% protected by Manyara NP) Baba DC.• Lake Eyasi Ngorongoro, Meatu and Karatu DC.• Lake Burungi (67% protected inside WMA) Baba DC.• Lake Kitangiri Meatu and Iramba DC.• Singida Lakes Singida DC.• Lake Balangida Lelu Hanang DC.• Bahi Swamp Dodoma Rural and Manyoni DC.• Lake Rukwa (Protected Rukwa-Lukwa GR) Mpanda, Chunya, Mbozi & Sumbawanga DC.
Key sites, but protected and therefore not of immediate priority, as already under some form of protected management:
• Momella Lakes (67% protected by Arusha NP).• Lake Empakai (100% protected by NCA).• Lake Magadi (100% protected by NCA Crater lake).• Lake Ndutu (100% protected by Serenge NP).
3.5. Tanzania Proposed LF SSAP Expected Outputs:
The following emerge as an adapta on of the interna onal LF SSAP guide, domes cated to Tanzanian condi ons and needs:
3.5.1. Strategic Guiding Principles: The Tanzania LF SSAP is guided by na onal policies and strategies, and these are highlighted below as a strategic guide to tailor the Tanzanian ac ons in line with domes c ini a ves, notably:a. Integrate Lesser Flamingo into Planning: The main strategic thrust will be to mainstream the Tz LF SSAP
ac ons into local government (ie VDP, DDP and PMO-RALG) and Community Based natural Resource Management (CBNRM), in protected area (ie through IMP, GMP, etc), at na onal level (through MTEF, EAP, SOER, MDA Strategic plans, etc) and regional management/development plans (through regional networks).
b. Joint Ac on: To network stakeholders in a synchronised, combined local and trans-boundary ac on, for collabora on in the conserva on of the Lesser Flamingo (ie through the NWWG AEWA SC for na onal networking at the EA LF SSAP Regional Network).
c. Key Site Management: To take local ac on to iden fy and maintain all key sites, especially Lake Natron, by implemen ng community micro-projects (or Wetlands Friendly Investments = WFI) to maintain catchment and wetlands in good ecological condi on, reduce the impact of catchment degrada on (from irriga on, agriculture, deforesta on, uncontrolled res, overgrazing and tourism), poisoning and diseases on Lesser Flamingo popula ons.
d. Protect Key Sites: To extend protec on (ie through declaring addi onal Ramsar Sites or wetlands reserves

Tanzania Na onal Single Species Ac on Plan 2010-2020 for the Conserva on of the Lesser Flamingo (Phoeniconaias minor) 18
or IBAs or WMAs) to further limit disturbances at Lake Natron, and at other key unprotected, non-breeding sites (like Manyara and Eyasi), and other known a empted breeding sites.
e. Research Key Sites: To establish research facili es and capacity, to ll knowledge gaps, on aspects of the ecology of the Lesser Flamingo (ie popula on numbers and distribu on, threats, values, and causes of die-off s, linking breeding and feeding biology to hydro-chemistry, studying migra on, doing annual census, etc), and
f. Capacity Development: To build capacity and awareness in Lesser Flamingo and ins l key site management (ie local village and district authori es) by providing scien c based knowledge for informed decision making and expanding the CEPA program through a communica on strategy involving schools, community leaders, district councils and senior government.
3.5.2. Tanzanian Projects and Ac vity Themes:
Adap ng the interna onal LF SSAP objec ves to Tanzania, the Tz LF SSAP sets out to achieve the expected outputs by the following project ac vi es. The outcomes of which are measurable by the corresponding Objec vely Veri able Indicators (OVI) set against each of the goals of the interna onal objec ves:
3.5.2.1. Objec ve 1: Ensure That All Key Breeding “And Feeding Sites” Are Maintained In Good Ecological Condi on:
Proposed Project Themes:a. Designate key feeding/breeding sites as protected areas.
OVI: either, as Ramsar sites, Birdlife IBAs, WMA or World Heritage Sites.b. Iden fy baseline condi ons of habitat suitable for Lesser Flamingo breeding/feeding to ensure that key sites
are maintained in favourable ecological status.OVI: either as SOER or monitoring of LF SSAP implementa on.
c. Conduct strategic and project level environmental impact and audits of exis ng opera ons and future plans in catchments at all key sites, mi gate as required. OVI: through SEA and EIA.
d. Iden fy management needs of Lesser Flamingo habitat and implement necessary management ac ons to maintain all key sites in good ecological condi on. OVI: through EAP, and local government DDP, or community through VDP, LUP and WMA or PA management through GMP.
e. Develop and implement integrated management (IMP) plans for the key sites and their catchment, based on LF SSAP. OVI: is mainstream Tz LF SSAP in catchments/coastal zone IMP and local VDP, DDP and PA GMP.
f. Maintain, or restore where necessary, favourable catchment, hydrological condi ons and water quality for the species, and adapta on to climate change. OVI: Local communi es develop alterna ve livelihood prac ces to reduce catchment pressures and direct disturbance through micro-projects or WFI, like improved irriga on effi ciency, overgrazing, deforesta on, agro-chemicals, sewage, agricultural encroachment, community-based eco-tourism projects, etc.
g. Raise awareness about the conserva on needs of the species at na onal and local level. OVI: Communica on Strategy, CEPA Program and distribute Crimson Wing in Swahili.
3.5.2.2. Objec ve 2: Ensure that Breeding Colonies are not Disturbed:
Proposed Project Themes:a. Prevent disturbance (especially low ying aircra ) through research, legisla on, planning, zoning, village
and district by laws and through enforcement of these rules as appropriate.OVI: District by laws and designated no- y zone.
3.5.2.3. Objec ve 3: Reduce the Eff ects of Poisoning and Diseases on LF Popula ons.
Proposed Project Themes:a. Establish a joint, integrated amingo health surveillance program for regular monitoring to assess the causes
and eff ects of mass die-off s on LF in E. Africa. OVI: Regional Network and M&E health.

Tanzania Na onal Single Species Ac on Plan 2010-2020 for the Conserva on of the Lesser Flamingo (Phoeniconaias minor) 19
b. Raise awareness amongst community members, decision-makers, industry and other stakeholders about the risk of pollu on to LF.OVI: CEPA material on pollutants.
c. Ensure that pollu on guidelines/legisla on at key sites re ect the sensi vity of the species.OVI: Pollu on guidelines.
d. Ensure that pollu on guidelines/legisla on are developed and enforced, especially with reference to agro-chemicals, industrial chemicals and heavy metals.OVI: District by laws enforced.
3.5.2.4. Objec ve 4: Ensure that Harves ng and Trade in Live Specimens has no Nega ve Eff ect on The Regional Lesser Flamingo Popula ons.
Proposed Project Themes:a. Maintain the exis ng ban on LF specimen, body parts, eggs and other trade, and do not permit an increase
in the Tanzania live trade quota. OVI: Trade regula on and licensing.
b. Regulate and enforce strict licensing mechanisms at na onal level. Licensing process to be based on analysis of eff ect of proposed trade on regional popula ons, in combina on with other factors.OVI: M&E trade losses, build capacity amongst licensed LF trappers/traders and research to improve the effi ciency of survival and reduce stress on local popula ons.
3.5.2.5. Objec ve 5: Ensure Collisions with Man-Made Structures are Minimised.
Proposed Project Themes:a. Avoid crossing important LF yways when rou ng new power lines, telephone masts, telephone lines,
light masts, lights, wind turbines and guide wires, new hotel developments (eg. on Empakai rim where the amingos have certain direct routes out over lowest rim sec ons, a er long ight up to the rim).
OVI: Issue EIA Guidelines, and undertake Project level EIA and audit of exis ng and proposed opera ons.b. Map yways for use in zoning, and disseminate the informa on to developers, decision makers and local
public.OVI: Flyway Maps and SEA for sensi ve areas integrate into law (eg through EMA) and zoned.
c. Place streamers on exis ng structures in yways to minimise collisions.OVI: Streamers make structures visible.
3.5.2.6. Objec ve 6: Ensure Human Disturbance at Non-Breeding Sites is Minimised.
Aligned with Objec ve 1, other Proposed Project Themes include:a. Prevent human catchment damage and direct disturbance through legisla on, planning, zoning and
through enforcement of these rules. OVI: District by laws, zone plans, DDP, VDP.
b. Establish “code of conduct” to minimize disturbance and sensi ze community, visitors and tour operators to reduce disturbance.OVI: Code conduct disseminated, awareness raised community engaged in par cipatory management of lakes.
3.5.2.7. Objec ve 7: Fill Knowledge Gaps
Proposed Project research themes are:
Objec ve 7.1. Fill Popula on Numbers and Distribu on Knowledge Gaps.a. Determine popula on sizes and trends by developing a monitoring strategy and protocols (numbers,
distribu on, key sites), conduc ng regular coordinated aerial popula on surveys at non-breeding sites, at least tri-annually, monitoring breeding popula ons and breeding success annually at all primary breeding sites, and iden fying poten ally unknown breeding and non-breeding sites.OVI: Annual and monthly census.
b. Determine popula on delinea on and movements by conduc ng satellite tracking and ringing studies

Tanzania Na onal Single Species Ac on Plan 2010-2020 for the Conserva on of the Lesser Flamingo (Phoeniconaias minor) 20
to determine movements of individuals between lakes, interchange and possible gene ow between popula ons, site usage, and rela ons with food availability and quality.OVI: Tracking monitoring and satellite history documented.
c. Establish a health surveillance strategy and conduct an integrated amingo health surveillance programme to assess the causes and eff ect of mass die-off s on Lesser Flamingo popula ons.OVI: Health M&E.
d. Establish database on trade mortality, in capture areas and during holding or transporta on.OVI: Trade Database.
Objec ve 7.2. Fill Demographic Knowledge Gaps.
a. Systema cally collect data on breeding success and recruitment, including factors in uencing uctua ons in breeding popula ons, frequency of breeding by individuals, age of rst breeding, reasons for breeding failure, the role of prac ce nest building, survival rates, popula on structure, plumage development, moult strategy ( ming and loca on), rela onship between nup al display and start of breeding.OVI: Breeding M&E and the triggers.
Objec ve 7.3. Fill Habitat Requirement and Behaviour Knowledge Gaps.
a. Systema cally collect data on breeding behaviour and habitat requirements, including the role of rainfall in determining breeding success.OVI: Hydro-chemistry and breeding study.
b. Systema cally collect data on feeding behaviour and habitat requirements, including daily food requirements, food quality at key sites, carrying capacity of key sites, diff erences in freshwater and food requirements.OVI: Fledging and adult feeding study.
c. Understanding catchment processes, ecosystems services, hydro-chemistry and primary produc vity links.OVI: Catchment and trans-boundary hydro-logical study.
Objec ve 7.4. Fill Disease, and Poison Threat Knowledge Gaps.
a. Systema cally collect data on the role of diseases and poisons in popula on regula on, including the eff ects of infec ous and non-infec ous diseases.OVI: Toxicology study.
b. Model long-term eff ects of climate change and diseases.OVI: Climate change study.
c. Evaluate the rela ve importance of diff erent threats.OVI: Success, weakness, opportunity and threats study.
Objec ve 7.5. Fill Gene cs Knowledge Gaps.
a. Systema cally collect data on the gene c relatedness within regional popula ons and gene c exchange between regional popula ons in order to detect gene c bo lenecks which might be dangerous for this species.OVI: Gene c research.
Objec ve 7.6. Fill Lesser Flamingo Value Knowledge Gaps.
a. Understand the cultural importance of LF.OVI: Socio-economic Study.
b. Calculate the economic value of LF (Social, Economic, Environmental, and Cultural) to na onal and local community.OVI: Tourism values es mated and Natron economic assessment study.
Objec ve 7.7. Fill Opera onal Knowledge Gaps.
a. Assemble a LF bibliography (See Annex 5).

Tanzania Na onal Single Species Ac on Plan 2010-2020 for the Conserva on of the Lesser Flamingo (Phoeniconaias minor) 21
OVI: Bibliography.b. Assemble a database and make opera onal through DeNRM Basket Fund.
OVI: LF Trust Fund lis ng funding sources and informa on linked to DeNRM Basket Fund).
3.5.2.8. Objec ve 8. General Ins tu onal and Administra on Arrangements for Implementa on of the LF SSAP, in Place.
a. Establish and make opera onal a Na onal and Mul -ins tu onal Eastern Africa Regional Coordina on Body for the Implementa on of the LF SSAP (Annex 1).OVI: A Na onal Coordina on Body for the LF SSAP (the AEWA SC under NWWG) and a EA Regional LF Network.
b. Establish and make opera onal key site offi ces and research base.OVI: Lake Natron Ramsar Site Offi ce, Makat Research Centre established, staff ed, opera onal and doing research.
4.0. Ac on Plan for Tanzania Lesser Flamingo The detailed ac on plan is a ached as Table 15. This can be tailored to MTEF or GMP format for mainstreaming in local GMP and DDP ac on planning processes.
Project Overall priority
Agency responsible
Cost- $$ Time Scale Expected Outputs
Indicators Comple on date?
Risks and opportunity
Remarks
5.0. Monitoring And Evalua on (M&E) Plan
The M&E plan for this Lesser Flamingo Ac on Plan will be done at projects, objec ves and aim levels with the na onal coordina ng offi ce (the NWWG AEWA SC) and the lead agencies, with assistance from other stakeholders. The Wildlife Department (WD) shall be the lead agency and the Wetlands Unit (WU) shall be the Ac on Plan implementa on Secretariat, and TAWIRI, as the Chair of the NWWG AEWA SC, suppor ng the NWWG and guiding research, with par cipa on from all NAWESCO stakeholders.
The projects table with speci c and measurable indicators will be used for M&E (Table 16) and, evalua ons shall be done annually, repor ng to NWWG and NAWESCO, and to Ramsar and AEWA as per conven on obliga ons.
Table 16: M&E of Lesser Flamingo SSAP.
Project Agency responsible
Cost- $$ Expenditure
vs budget
Time ScaleAchievement vs me plan
Expected OutputsAchieved
as per me plan
IndicatorsOVI that
have been achieved vs
plan
Comment on
Progress
Risks and opportunity
Remarks and
lessons learnt,
follow-up ac on
6.0. Resource Mobiliza on And Implementa on Strategy
The resource mobiliza on and implementa on strategy for this LF Ac on Plan should be broad based to address the regional challenges aff ec ng the en re Lesser Flamingo popula on in East Africa. The NWWG AEWA Sub-commi ee shall be the na onal planning and coordina on commi ee comprising experts and representa ves

Tanzania Na onal Single Species Ac on Plan 2010-2020 for the Conserva on of the Lesser Flamingo (Phoeniconaias minor) 22
from key sectors. They will spearhead and lead the implementa on process, advising the main NWWG, and guiding the IMP of Natron, as the next stage of events.
This specialised sub-commi ee will operate under the auspices of WU/WD, which, as the Ramsar Secretariat, is the overall responsible for oversight of the implementa on of the LF SSAP. One of the key mandates of the coordina on commi ee (ie NWWG AEWA SC) will be to develop a resource mobiliza on strategy, establish the LF Trust Fund and to help raise nancial and technical resources locally and interna onally. Speci c ins tu ons to be approached for support will include relevant government ministries, NGO, civil society groups, members of the private sector, interna onal organiza on partners, bilateral and mul lateral development partners and the relevant environmental agencies and university colleges. A speci c resource mobiliza on strategy will be developed and used to raise resources locally and interna onally.
Capacity building through training, educa on, awareness and advocacy programmes will be con nuous for winning poli cal and public support for the programme. Lesser Flamingo range states in East Africa will be equally sensi zed and mobilized to par cipate and contribute to the implementa on through the EA LF SSAP Regional Network.

Tanzania Na onal Single Species Ac on Plan 2010-2020 for the Conserva on of the Lesser Flamingo (Phoeniconaias minor) 23
ANNEXES
Tanzania Na onal Single Species Ac on Plan 2010-2020 for the Conserva on of the
Lesser Flamingo (Phoeniconaias minor)
Annex 1: Regional Network: Implementa on of the Single Species Ac on Plan for the Conserva on
of the Lesser Flamingo and its Shared East African Regional Ecosystem for the
Improvement of Local Livelihoods.
Annex 2: List of Poten al Threats to Lesser Flamingo in Tanzania.
Annex 3: Global Threats To Lesser Flamingo Using Problem Tree Analysis.
Annex 4: Applied Research Ac on Plan for the Survival of the Lesser Flamingo in Lake Natron”
Annex 5: Lesser Flamingo Bibliography and Reference List.

Tanzania Na onal Single Species Ac on Plan 2010-2020 for the Conserva on of the Lesser Flamingo (Phoeniconaias minor) 24
Annex 1:
“Regional Network”
Implementa on of the Single Species Ac on Plan for the Conserva on of the Lesser Flamingo and its Shared East African Regional Ecosystem for the Improvement of Local Livelihoods: 2010-2015.
“The original was submi ed to RAMSAR Secretariat at COP 10, 2008in regional ini a ve format, but was not funded and has been modi ed to serve as a framework for future development of regional coopera on to manage a shared stock”.
Aim of the regional ini a ve
1. Implementa on of the Ramsar Approach
1.1 Describe brie y how your ini a ve is promo ng the objec ves of the Conven on and how it is implemen ng the Ramsar Strategic Plan through coopera on in your region:
This ini a ve centers around Lake Natron as the single most, globally important, breeding site for 60-70% of the world’s popula on of Lesser Flamingo. It adopts a trans-boundary, regional and shared wetland ecosystem approach to the management and wise use of the species, its yways, habitats, breeding grounds and economic bene ts. The aim is to establish a Regional Network to manage the interconnec vity of the popula on, to ensure sustainability of its shared ecosystem services and trans-boundary economic signi cance both to the local livelihoods and to the regional eco-tourism trade.
In so doing, the ini a ve meets several of the COP9 opera ve objec ves, notably:
• OO1.2: Regional monitoring of wise use of wetland resources and species; • OO2.1/2: Alignment of trans-boundary policies and ini a ves; • OO3.1/2: Dissemina on of regional best prac ces; • OO3.3: Establishes regional signi cance of resource to na onal economies and local livelihoods; • OO3.4: Integra on of territorial management from regional level to grassroots village planning;• OO6.1: Ac ve involvement of informed local communi es to bene t from related eco-tourism;• OO7.1: Ac ve involvement of private sector and local community as economic partnerships;• OO8.1: Establishment of tax-based economies of user pays systems, for future self- nancing;• OO9.1: Development of a regional CEPA on wise use of the Lesser Flamingo and its shared habitats;• OO10.1/2: In the process, iden fy poten al new sites that need lis ng as wetlands of importance;• OO11.1/2: Ins ll local ac on and implementa on, to maintain and monitor site ecological characters;• OO12.1/2: Promote coopera on in shared yway and basin monitoring and management;• OO13.1: Establish an interna onal and regional network of coopera ng partners and vested par es.• OO14.1: Share informa on on management and economic values of a shared species.• OO15.2: Ensure environmental safeguards in ecotourism and other investments in the species habitats.• OO16.1: Pool resources, research and projects in collabora ng in a shared resource management.• OO18.1: Promote coopera on between par es who share this common resource.• OO19.1: Regional and interna onal networking, lobby for global support to manage a shared resource.
Substan ve elements of the regional ini a ve
2. Complete Regional Adherence And Bo om-Up Approach
2.1 Describe Brie y If Your Ini a ve Is Based On A Bo om-Up Approach:
During the recent global interest surge, spurred by a possible mining threat to Lake Natron’s key breeding popula on, interna onal, regional, na onal and local pressures were rallied. Regional consulta ons, by the Birdlife network, right down to the grass-roots level, received support to lobby for the protec on of the Lesser Flamingo, and Lake Natron. This ini a ve builds on this momentum. It is about maximizing livelihood bene ts

Tanzania Na onal Single Species Ac on Plan 2010-2020 for the Conserva on of the Lesser Flamingo (Phoeniconaias minor) 25
to communi es who live and share the same ecosystem services as the Lesser Flamingo. “If it pays it stays!” If communi es see bene ts, they will protect the resource. The focus is to ins ll wise use through Community Based Natural Resource Management (CBNRM) in people who live with Flamingos, who’s livelihoods are intertwined, who survive by sharing the same cri cal ecosystems services and to raise bene t sharing to these communi es through eco-tourism and related ventures.
2.2 List The Countries In The Region That Your Ini a ve Covers:
The ini a ve will cover most of the “primary range states” who share the same East African Lesser Flamingo sub-popula on, yway, feeding and breeding grounds and habitat, all interconnected by Lake Natron as the only common breeding area. Partners are therefore linked to the ecological survival and breeding success of the species, and collec vely, share its economic importance to local livelihoods and na onal tourism economies. Notably, the Network is rst and foremost those immediate 4 states that share the East African Lesser Flamingo popula on:
• Tanzania, Kenya, Ethiopia and Uganda.
Informa on linkages will however be maintained with other Lesser Flamingo key sites, notably:
• Botswana, Namibia, Guinea, Mauritania, Senegal, India, Zambia and South Africa.
2.3 Specify Those Countries In Your Region That Do Not Par cipate In The Ini a ve (If Any):
The network is based on the 4 key East African countries who share the same Lesser Flamingo popula on, primarily linked to the Lake Natron breeding popula on. Proposed is to maintain informa on linkages with other African countries that have a Lesser Flamingo popula on, but which may not be dependent on Lake Natron.
3. Ac ve Involvement Of All Relevant Stakeholders
3.1 List The Par cipants In Your Ini a ve And Their Affi lia on:
The interna onal support that mobilized the global “Think Pink Campaign”, are key partners, notably: the Ramsar Secretariat, IUCN, AEWA, UNEP, Birdlife Interna onal, RSBP, CMS, WWF, Flamingo SSC, Wetlands Interna onal (WI), Disneynature (DN), etc.. The above, together with the Tanzanian, Ugandan, Ethiopian and Kenyan counterparts (ie. Tanzania = MNRT/WD and NWWG; Uganda = the Na onal Wetlands Program; and Kenya = the Wetlands Program, Kenya Wildlife Services and Na onal Environmental Management Agency) took part in a February 2008 Ramsar Appraisal Mission of the threats to Lake Natron, and they gave birth to the idea of this collec ve, East African ini a ve.
Through Ramsar and Birdlife Interna onal regional networks, contrac ng par es in Botswana, Namibia, Ethiopia, Guinea, Mauritania, Senegal and South Africa were sensi zed to the threat.
In addi on, Birdlife Interna onal has mobilized support from some NGOs in 24 affi liated countries. Likewise, local and regional NGO and private sector support, as partners, were rallied through the networks of the 50 NGOs affi liated to the Lake Natron Consulta ve Group (Kenya), and those of the Tanzania Bird Atlas Project (TBAP), WCST and TNRF.The Donor Working Group on Environment (DPG-E) Tanzania (represen ng Danida, NORAD, Finnida, Sida, EU, USAID, Belgium Coopera on (BTC), UNDP/UNEP, FAO, World Bank, etc) had collec vely indicated they are willing to support Tanzania in undertaking the Lake Natron mining EIA. In addi on, Danida currently supports a Sustainable Wetlands Management Program (SWMP) in Tanzania, involving the WD and includes support to Lake Natron, its IMP, WMA and districts. This support will run un l 2013. AWF has also started a WMA project for Natron under USAID funding, and Birdlife Interna onal likewise is suppor ng the IMP through a Jensen Founda on fund. Leicester University and affi liates currently run a “virtual school”, conduc ng expedi ons to study Natron, and raise funds for further research. Through the DPG-E Tanzania, donors could be used to network interest in donor agencies in partner countries.

Tanzania Na onal Single Species Ac on Plan 2010-2020 for the Conserva on of the Lesser Flamingo (Phoeniconaias minor) 26
3.2 Indicate If Only Ramsar Administra ve Authori es At Na onal Level Or Also Other Relevant Stakeholders (Including Other Ministries, Intergovernmental Bodies, Ngos, Academia And Economic Actors) Are Ac vely Involved:
The network will work through state actors, mainly the Ramsar Contrac ng Par es, notably, the Wildlife Authori es in the partner countries. Equally, the network will link with Local Government Authori es as grass-root implementa on will be through decentralized, administra ve processes (= DeNRM). The on-the ground ac vi es with communi es will also involve local NGOs working in the area (eg. For Natron: IPI, UCRT, SCF, WCS, FCF, OXFAM, CORDS, Ujama, AWF, TNRF, WCST, Birdlife, etc) and local private sector tour operators (eg. For Natron: WWG, TGT, Ngaresero Camp, Ngarosero lodge, etc), investors and other user groups (eg irriga on projects by OXFAM, etc), and donors (eg Danida, Jensen Founda on, USIAD, etc).
4. Development Of Collabora on Based On Commonly Agreed Terms
4.1 Describe Brie y How Your Regional Network Or Centre Is Opera ng (A ach The Terms Of Reference (Or Other Agreements) Elaborated To Guide Its Ac vi es As Separate Documents Where They Exist):
The concept of the East Africa Regional Lesser Flamingo Network is only recently introduced, and with support from Ramsar, intends to build up wider capacity and support, for this ini a ve. Dra TORs for the Network, are a ached. The concept is one of regional coopera on, informa on sharing, synchronizing research, sharing eff orts to a ain a be er understand and establishing a joint management ins tu on of a shared, migrant economic resource.
Through a Lesser Flamingo webpage, and e-mail group, informa on sharing will take place, swapping best prac ces, lessons learnt and scien c knowledge. North to South scien c support will be coordinated and projects pooled for a consolidated implementa on of the IUCN/AEWA Lesser Flamingo Single Species Ac on Plan (SSAP). Collec vely, the Network will link local and country fora into a regional network. The Network will primarily be an e-mail group, for wider informa on sharing. The Network, may join forces, when needed to provide support for a joint funding proposal (eg from Ramsar), otherwise, in its own right, each country will fund and manage its own events, always in liaison with others.
5. Involvement Of Other Regional Partners
5.1 List Relevant Intergovernmental Or Interna onal Organiza ons Opera ng In Your Region:As men oned above, the following have been involved: Ramsar Secretariat, IUCN, AEWA, Birdlife Interna onal, RSBP, CMS, WWF, Flamingo SSC, Wetlands Interna onal, UNEP, TRAFFIC, WCS, etc.
5.2 List Those With Which You Have Established Common Ac vi es:
All of the above.5.3 List Your Ac vi es In Common:• A global concern to save the Lake Natron Lesser Flamingo from mining (and other) threats.• A common agreement to ensure local communi es and Lesser Flamingo live in harmony and sustainably
through ‘wise use” of the key lake’s ecosystem services.• Common agreement to implement the IUCN/AEWA/CMS Single Species Ac on Plan (SSAP).• An interest to prove the “long term (ie million years of tourism)” economic worth of the Lesser Flamingo
outweighs any “short term (ie. 100 years of mining)” consump ve resource use”.• A common research interest to be er understand the biology of the Lake Natron and EAC Lesser Flamingo,
its habitats and its gene c rela onship and survival linkages to other African popula ons.
6. Scien c and technical backing
6.1 List The Scien c And Technical Partners That Provide A Solid Backing To Your Ini a ve:• Interna onal: Ramsar Mission, IUCN, AEWA, Birdlife Interna onal, RSBP, CMS, WWF, Flamingo SSC, UNEP,
WCS and Wetlands Interna onal.

Tanzania Na onal Single Species Ac on Plan 2010-2020 for the Conserva on of the Lesser Flamingo (Phoeniconaias minor) 27
• Research partners: Max Plank Ins tute, Wildlife Conserva on Society (WCS), Leicester University, etc. • Local Research Ins tu ons: TAWIRI, USDM, IRA, SUA, etc.• Local: Tanzania DPG-E, Danida, Sand County Founda on, WCST, TNRF, Tanzania Bird Atlas Project, IPI, CORDS,
Ujama, etc.
7. Targets Of The Ini a ve And Their Links With Ramsar
7.1 List Your Ini a ve’s Strategic And Opera onal Targets For The Period 2009-2011:a. By 2010 to have established a global and regional electronic network and web page for Lesser Flamingo.b. By 2010 to start implementa on of the Lesser Flamingo SSAP as mainstreamed into the District Development
Plans around key shared habitats in partner countries (especially Lake Natron).c. By 2011 to have es mated the regional worth of the Lesser Flamingo to local livelihoods and eco-tourism.d. By 2013, through regional satellite telemetry and gene c DNA, carry out an analysis of the migra on
pa erns and inter-dependence, of the Lesser Flamingo. Establish the global; importance of Lake Natron to the survival of the East Africa regional and Southern Africa popula ons.
e. By 2014, through research on the feeding and breeding biology, establish the rela onship of the species survival to the plankton biology and related water chemistry and hydrology (especially of select key sites, like Lake Natron). Develop a management model that factors in the threats of climate change and wise use of shared ecosystem services.
7.2 Specify The Rela ons Of These Targets To The Objec ves Of The Dra Ramsar Strategic Plan (A ach Your Work Plan For 2009-2011, Or For 2009, Where It Exists):
These targets aim to support and implement the SSAP of the Lesser Flamingo, but more speci cally, are focused on jus fying its conserva on by establishing its importance and that of catchment management to local livelihoods and regional tourism economies, today and in the future. In this regard it supports the 2009-2014 Ramsar Strategic Plan by networking, to look at the inventory of collec ve value and alterna ve economic developments, and to halt any further poten al degrada on of shared ecosystems services. It is based on a shared management approach to the ecosystem of the East African Lesser Flamingo. It looks at values of the Lesser Flamingo and its wetlands services to people living with them and to eco-tourism and other livelihood uses, to network, to share, to synchronize wise use best prac ces and to harmonize ac ons at regional, na onal, local, community level and private sector.
The millennium ecosystem assessments will be applied as a tool to monitor wise use guidelines and water management, accommoda ng for the threats of climate change and of growing popula on pressures changing land use priori es, to accommodate poverty. Regional ins tu onal capacity will be strengthened and through the East African Shared Waterbody Protocols, unify policy and regula ons across regional boundaries to combine forces in a more united eff ort based on a EAC Regional Integrated Management Plan for the Lesser Flamingo.
Dra proposed Work Plan and Budget is available.
8. Raising Awareness Of Ramsar Objec ves
8.1 Describe Brie y Your Ac vi es In The Fields Of Communica on, Educa on, And Par cipatory Processes With Relevant Stakeholders:
The network as such, will become a means of informa on sharing through its webpage and e-group. In addi on, as the key focus is to measure the livelihood and economic worth, local communi es and investors will par cipate. Overall, the aim, once the tourism values are known, once the knowledge on breeding biology improves, is to package these into awareness and training materials and CEPA tools for use both at community and training ins tu on level, as tools for decentralized planning and decision making.
8.2 Describe Brie y The Increased Support For Ramsar Objec ves Resul ng From These Ac vi es (This Informa on May Be Used By Ramsar’s CEPA Oversight Panel, According To Standing Commi ee Decision 35-14):

Tanzania Na onal Single Species Ac on Plan 2010-2020 for the Conserva on of the Lesser Flamingo (Phoeniconaias minor) 28
The ini a ve will strive to show that through regional mobiliza on for a shared resource like the Lesser Flamingo, it is not enough to protect one site of importance, but also the need to cooperate to manage other, interlinked ecosystems, internally and trans-boundary. In addi on, the regional cost-bene t analysis will show that threats to the species in one site, could have far reaching economic and conserva on consequences, in another. And, if the resource can bene t livelihoods, wise use principles and value added tourism, can ensure the emergence of a “tax-based economy” to contribute to local poverty reduc on.
Financial and other support for the regional ini a ve
9. Who Provides Poli cal And Financial Support?
9.1 List All Your Sources And The Amounts Of Financial Support For The Triennium 2009-2011. Specify The Amounts Which Are Already Con rmed:
• Danida: USD 475 000 for 2008-2013 for Lake Natron Ramsar Site Offi ce and implement IMP (con rmed).• GEF: 2*USD 40 000 for each district local ac on (to be applied for).• Ngaresero Tour Operators: USD 40 000/year concession fee to local development (Lake Natron) (u/way).• Ngorongoro District: USD 60 000/year in gate fees sharing for local development (Lake Natron) (u/way).• Longido District: USD ##/year in gate fees sharing for local development (Lake Natron) (u/way).• Friedkin Conserva on Fund: USD 2 000/village * 24 for local development (Lake Natron)(underway).• Sand County Founda on: USD # 000 for land use planning East Bank Lake Natron (underway).• Oxfam: USD # 000 for sustainable irriga on in Pinyini River, Lake Natron Catchment (underway).• Birdlife/RSBP: USD # 000 support to Lake Natron Consulta ve Group/WSCT (underway). • Birdlife/Jensen: EU 300 000 support to Lake Natron IMP implementa on (underway)• Global Flamingo Movement Forum: World Flamingo Tracking Project (under prepara on).• Private Investor: USD 1.5-1.8 million in eco-tourism around Lake Natron (under considera on). • UNEP (Kenya): Na onal Lesser Flamingo Conserva on Ac on Plan (under prepara on).• Wildfowl and Wetlands Trust: Surveillance, migra on, climate change, cultural threats and economic values
(under prepara on).• SWM-AEWA/CMS: Lesser Flamingo SSAP (completed).• Max Plank Ins tute: Ringing study (under prepara on).• IUCN: Integrated resource assessment study, Lake Natron (in prepara on). • AWF: SCALE project to support Longido WMA (funded).• WCS: Support to PhD studies at Natron (under prepara on).• Leicester University (and affi liates): Bi-annual expedi ons to Lake Natron (underway).• Leicester University (and affi liates): Research program for Lake natron hydro-logy (under prepara on).• Leicester University (and affi liates): 2 PhD studies E Africa soda lakes (underway).
9.2 List Your Sources And Amounts Of Financial Support For The Year 2009/10. Specify The Amounts Which Are Already Con rmed:
• Danida: USD 200 000 for Lake Natron Ramsar Site Offi ce and start the IMP.• Ngaresero Tour Operators: USD 40 000 concession fee for local development (Lake Natron).• Ngorongoro District: USD 60 000/year in gate fees sharing for local development (Lake Natron).• Friedkin Conserva on Fund: USD 2 000/village for local development (Lake Natron).• Sand County Founda on: USD # 000 for land use planning East Bank, Lake Natron.• Oxfam: USD # 000 for sustainable irriga on in Lake Natron Catchment.• Birdlife/RSBP: USD # 000 support to Lake Natron Consulta ve Group/WSCT.
9.3 List concisely, according to main budget lines, your expenditures planned for 2009/10:
See separate Work Plan and Budget.
10. Financial Planning
10.1 Summarize Your Remaining Funding Needs For 2009/10 That Are Not Yet Covered By Con rmed

Tanzania Na onal Single Species Ac on Plan 2010-2020 for the Conserva on of the Lesser Flamingo (Phoeniconaias minor) 29
Dona ons, According To The Main Budget Lines Used Above:
According to budget es mates, the Regional Ini a ve will have a shor all of USD 200 000 in 2009/10.
10.2 Provide Informa on About Your Fundraising Plan To Cover Such Outstanding Needs:
The network of partners, is currently coordina ng the prepara on of the following fund applica ons:
• GEF: 2*USD 40 000 for local ac on (to be applied for).• Birdlife: Natron Consulta ve Group (Kenya) plan to undertake an economic analysis.
11. Request For Ramsar Core Budget Support
11.1 If You Request A Financial Contribu on From The Ramsar Core Budget, Specify The Amount For 2009, And For The Triennium 2009-2011:
The Regional Ini a ve would need core support for the Secretariat’s Coordina on Offi ce, its opera ons, webpage hos ng, technical support (ie bird counts, ringing opera ons, DNA study, etc) and annual workshops amoun ng to USD 200 000 in 2009, and USD 350 000 from 2009-11.
Governance of the regional ini a ve
12. Governance Mechanisms In Place
12.1 Describe The Governance And Advisory Mechanisms And Structures (E.G., Commi ees) In Place Or To Be Established To Provide Guidance And Insight To Your Ini a ve (A ach Terms Of References, Rules Of Procedures, Or Opera onal Guidelines, Where Such Exist):
In the rst instance, the MNRT (Tanzania) as lead partner, together with lead countries Kenya, Ethiopia and Uganda will cons tute an East Africa Regional Lesser Flamingo Network Commi ee. Each partner will have a designated focal point for internal communica on, liaison and coordina on (In Tanzania, this will be the AEWA Thema c Group of the NWWG). Through established networks, the Commi ee will widen the circle to other countries that share the common global resource and SSAP (Botswana, Namibia, India, Guinea, Mauritania, Senegal and South Africa) and interna onal partners (Ramsar, Birdlife Interna onal, IUCN, SSC, CMS and AEWA). Tanzania in the rst instance will Chair the Network, and provide technical and secretarial support from Danida support and Technical Assistance to the Wetlands Unit, in the Wildlife Division. Proposed is to rotate this every 3 years. See Terms of Reference a ached.
13. Coordina on With The Ramsar Secretariat
13.1 Specify The Established Or An cipated Opera onal Arrangements Between The Governance Structures Of Your Ini a ve And The Ramsar Secretariat:
The East Africa Lesser Flamingo Network focal points in partner countries, will as part of their repor ng obliga ons keep the Ramsar Secretariat and Regional Chairman informed of individual country progress against the SSAP. Tanzania, as the rst coordinator of the network will consolidate this informa on and through the SSC, report on regional progress.
13.2 List The Full Name, Telephone And E-Mail Contact Of The Main Focal Point Of Your Ini a ve:
Full name: PS, MNRT or Director, Wildlife Division, Tanzania, A en on: Wetlands CoordinatorTelephone: 255-222111063 or 255-754261501.E-mail: [email protected]

Tanzania Na onal Single Species Ac on Plan 2010-2020 for the Conserva on of the Lesser Flamingo (Phoeniconaias minor) 30
14. Dra Terms of Reference for a Regional Lesser Flamingo Network
Title: Network for the Implementa on of the SSAP for the Conserva on of the Lesser Flamingo.
Key Partners: 1. Tanzania (lead partner)2. Kenya 3. Uganda4. Ethiopia
Informa on Sharing Network:
Partner Countries: Botswana, Namibia, India, Guinea, India, Mauritania, Senegal and South Africa.Interna onal Representa ves: Ramsar, Birdlife Interna onal, IUCN, SSC, CMS and AEWA.
Objec ves:
Coopera on between East African regional countries with key sites, to synchronize eff orts to implement the Lesser Flamingo SSAP, to develop local livelihoods through eco-tourism.
Terms of Reference:
The Regional Network shall be cataly c to:a. Establish unity, through an East Africa Regional Forum of country networks that share a common interest in
the conserva on of the Lesser Flamingo and who are dedicated to implement the SSAP.b. Each member shall ensure that the Interna onal Lesser Flamingo SSAP is incorporated into na onal and
local government development plans for key sites.c. Shall maintain a local e-mail group and Lesser Flamingo Webpage, to maintain liaison, communica on,
informa on sharing and synchroniza on of conserva on eff orts.d. Shall exchange informa on, lessons learnt, best prac ces, research experience and any other useful
communica ons.e. Shall coordinate and cooperate in research, in par cular in a regional yway and shared resource assessment
of the gene c linkages of the popula on to key breeding sites.f. Shall cooperate to establish the net economic worth of the Lesser Flamingo to tourism and livelihoods,
develop and implement a Regional East Africa Lesser Flamingo Integrated Management Plans at key sites to maximize on the global tourism poten al, ins lling an equitable bene t sharing with communi es that live with Flamingos.
g. Shall, wherever possible, ins ll CBNRM through decentralized local government channels so that communi es living with Lesser Flamingos are assisted and bene t.
Procedures and Opera onal Guidelines:
a. The East Africa Network shall ini ally be hosted by Tanzania, but every 3 years, the lead partner may change based on a common vote.
b. Each member country shall nominate a Network Focal Point, responsible to its country members.c. Each member state shall operate in its own right, be autonomous in raising and accoun ng for funds for
na onal projects. However, regional coopera on is expected for regional fund raising, where each partner will have one vote say in the regional funding, and accountability.
d. The Country Focal Point shall endeavour once a year to come together, to examine progress, review the common work plan and agree on key regional ac vi es for the next period.
15. Regional EAC LF SSAP Plan and Budget 2009-11:
(See a ached budget)

Tanzania Na onal Single Species Ac on Plan 2010-2020 for the Conserva on of the Lesser Flamingo (Phoeniconaias minor) 31
Annex 2:
List of Poten al Threats to Lesser Flamingo in Tanzania(An abstract from the Interna onal SSAP, modi ed to Tanzania)
1.0 Disturbance of Habitats
1.1. Habitat Loss and/or Degrada on Importance: Cri cal
The Lesser Flamingo is highly specialized. Its diet is limited to microscopic cyanobacteria and benthic diatoms that occur only in saline/alkaline lakes. Because it is adapted to respond to changes in environmental condi ons by moving among sites regularly, it is dependent on a network of such sites, which for the East Africa popula on is spread over 4 countries. Due to their i nerant nature Lesser Flamingo conserva on needs to be based on a process that takes into account the en re sub-regional popula on. Trans-boundary and catchment-based and shared ecosystems services conserva on strategies are equally important given the ecological linkages between the lakes and their watersheds. Ac vi es in the catchments disrupt the ecological integrity of the lakes and their suitability as amingo habitats. Most uctua ons in the amingo numbers are caused or catalyzed by ecological and catchment processes and the eff ects of clima c and hydrological trends in the region. These changes have been aggravated by unsustainable land use, economic and development prac ces within the watersheds aff ec ng water cycles and compromising ecosystem services.
1.2. Eff ects of Altered Hydrology Importance: Cri cal
The Lesser Flamingo is sensi ve to changes in water levels and quality. Cyanobacteria, its primary food, require a certain range of salinity to reproduce in suffi cient quan es to feed large numbers of Lesser Flamingos. Changes in the abundance of cyanobacteria can have a substan al eff ect on the Lesser Flamingo popula on at a site. Rainfall and water levels are also cri cal to successful breeding. If the level is too high, the birds are unable to build their nests. If it is too low, terrestrial predators are able to reach and destroy the nests. If the water level drops prematurely a er the eggs are laid, but before the chicks are ambulatory, terrestrial predators are able to reach the colony and destroy the breeding a empt by feeding on the eggs and chicks. This may be relevant to the Ngarosero, Pinini and Ewaso-Nyiro (In Kenya) Rivers, important sources of water for Lake Natron. Ac vi es that alter the ow of these river would aff ect the hydrology of Lake Natron, hence aff ec ng the breeding cycle of Lesser Flamingos. Changes in water and salinity levels can occur either from natural or man-made causes. Natural causes include ooding due to heavy rainfall and evapora on due to prolonged drought. Man-made causes include increased ooding, sedimenta on and climate change. These occur due to burning, deforesta on, over-grazing or an
increase in arable farming on steep slopes all leading to erosion and increased run-off in the catchment. Reduced in ows and water levels also occur due to drainage of land for agriculture, infrastructure, crea on of dams and reservoirs, canalisa on of rivers, diversion of rivers, abstrac on from feeder streams and rivers for irriga on, drinking water, reforesta on, industry, hydro-power genera on or mining (eg soda brine extrac on).
1.3. Wetland Pollu on Importance: Medium
Pollu on is considered a probable cataly c agent to amingo mortality within the region (notably Kenya). Pollu on is mainly from agricultural, industrial and domes c pollutants in the form of fer lizers, heavy metals, pes cides and high nutrient loads that lead to the forma on of toxic algal blooms. Due to the nature of alkaline lakes (shallow and rela vely small), they are quickly in uenced by the anthropogenic processes within the catchment basins. Drying up can concentrate these toxins that accumulate in the lakes.
In Kenya, Lake Nakuru has several agricultural farms and industries (for agricultural produce, tanneries, oil depots, etc), a proli c producer of solid, industrial and domes c effl uents that nally end in Lake Nakuru. Likewise, Lake Elementeita (the diatomite-mining factory, and mber treatment plant and small scale agriculture and

Tanzania Na onal Single Species Ac on Plan 2010-2020 for the Conserva on of the Lesser Flamingo (Phoeniconaias minor) 32
se lements) also has poten al sources of pollu on. In Lake Bogoria (agricultural ac vi es are contribu ng a lot of agro-chemicals) there are increasing contamina on risks of pollu on. Lake Manyara reports deaths of 15 - 43 000 in August 2004 (Kihwele, 2009). These deaths could be due to local causes, or, given the i nerant nature of the bird, arising from poisoning or stress elsewhere (eg Kenya lakes).
Deaths suspected from pollu on of amingo lakes (in the region) has therefore increased with increase in human popula ons in the catchments. Heavy metals origina ng from local industries and excess nutrients from agricultural and domes c effl uents from the surrounding farmlands have found their way into the lakes. This has also resulted in lake eutrophica on leading to frequent algal blooms and possibili es of Lesser Flamingo mortality and sub-lethal stress arising from intoxica on.
The principal actors on the sources of pollu on are excessive agricultural development in catchment, unplanned urban and industrial developments and ineff ec ve compliance with EIAs and Environmental Audit procedures. The management of both liquid and solid waste (ie sewage) in these areas is equally wan ng and research to iden fy and develop environmental management strategies that will help mi gate eff ects caused by industrial and storm water pollu on, is necessary. 1.4. Extrac on Of Salt And Soda Ash Importance: Cri cal
Lake Natron is one of the saline lakes where salt has been tradi onally harvested for small scale, mainly domes c purposes as livestock salt lick. This has been considered to play a low signi cance or threat to Lesser Flamingos as the species has lived with this for centuries. However, large scale, commercial harves ng as proposed for Lake Natron, learning from Lake Magadi (in Kenya) where this has been going on for several decades, has aff ected the hydrology of the lake, and although s ll heavily u lized by Lesser Flamingos, breeding has believed to have stopped (ie. Breeding at Magadi has been recorded only once in the past century), allegedly due to the disturbances. Mining is considered an important threat to the Lesser Flamingo breeding habitat of Lake Natron in as much as it will aff ect the water-balance.
1.5. Disturbance Of Non-Breeding Popula ons By Human Ac vi es Importance: low
Disturbance at those sites where sources of fresh water are limited prevents the birds from ge ng to fresh water for drinking, bathing and early feeding on the organic muds in the mud- ats. This could have serious implica ons for the birds on a local basis in the short term.
1.6. Disturbance by Human Se lements Importance: local
Human se lements including tourism developments and hotels, near amingo sites could poten ally stress breeding and non-breeding birds. In Lake Elementeita, con nuous land subdivisions and increased se lements have resulted in a por on of the lake being abandoned by the Lesser Flamingos. Low ying aircra and hot air balloons in Lakes Elementeita and Nakuru could also be a source of disturbance. Photographers approaching nests have lead to subsequent abandonment. Recent y-over photography over Lake Natron, was reported to lead to a mass migra on of birds leaving the lake (Andersen, pers comm). With an increase in the frequency of these ac vi es it is expected that it will cause some impact to the popula ons.
2.0 Poisoning Importance: High
Direct and indirect poisoning of Lesser Flamingos through the introduc on of heavy metals, agrochemicals, domes c waste and industrial chemicals into the areas where they feed, or through cyanobacterial toxins may be the cause of reported large scale illness and death. Large-scale die-off s, each involving tens of thousands of Lesser Flamingos have been a ributed to inges on of heavy metals, pes cides and cyanobacterial toxins, on feeding lakes in Kenya (Bogoria and Naivasha) and Tanzania (Manyara).
In Lake Bogoria, the inges on of toxic cyanobacteria (Synechococcus bigranulatus, Spirulina subsalsa, Phormidium terebriformis, Oscillatoria willei) from the hot spring-mats are thought to have contributed

Tanzania Na onal Single Species Ac on Plan 2010-2020 for the Conserva on of the Lesser Flamingo (Phoeniconaias minor) 33
to the mass mortali es. This was supported by high concentra ons of the cyanobacterial hepatoxins (microcys ns) and neurotoxins (anatoxin-a) in dead amingo stomach contents and fecal pellets. Neurological signs of cyanotoxin poisoning of the birds have also been observed. This could result from accidental feeding on the mats that breakaway from the hot springs. Lesser Flamingos mortali es also revealed traces of heavy metals including zinc, copper, lead, mercury and cadmium. The cause of death could have been heavy metals ac ng alone or in synergy with other stress factors such as the cyano-toxins, heavy metals, pes cides or opportunis c diseases, and could be compounded by stress a er a long ight between lakes.
3.0 Infec ous Diseases Importance: High
Infec ous diseases may have played a role in the die-off s that have occurred in Kenya in the past decade (1993, 1995, 2000, 2002, 2006) and more recently in Tanzania (2004), and seem likely to threaten the amingo popula ons of East Africa (Manyibe et al. 2007; Kilewo and Mlengeya 2004; Lugomela et al. 2006). Diseases such as avian u, avian TB, avian cholera, botulism, salmonella and pseudomonas have been singled out as having contributed to the deaths in the mass die-off s recorded during the past 30 years. Records of deaths in Kenya (since 1970) include: mycobacteriosis (tuberculosis), avian cholera (pasteurellosis) and parasi .sesaesid c
4.0 Preda on Importance: Local
Baboons, African Fish Eagles, Steppe Eagles, Marabou Storks, vultures, feral dogs, jackals and hyenas do predate on sick adult and juvenile amingos, and eggs. Preda on can be a serious problem at breeding sites, par cularly when the water level has receded allowing access by terrestrial predators. Marabous are believed to wreck havoc at Lake Natron (Aberhard, per obs).
5.0 Compe on Importance: Local
The main species that would compete with amingos for food is the algae-ea ng sh and crustaceans Artemia brine shrimp. The later is common where salt extrac on is taking place where it is introduced into the solar evapora on ponds of salt factories, to eat the algae. Many gaps however s ll exist concerning the level of compe on with other avian species for space and breeding sites. The Lesser Flamingos tends to prefer isolated, ooded breeding sites, which do not seem suitable for other species, except Greater Flamingo, but no inter-
species compe on has been reported. In Natron, the sh of the Alcolapia group thrive in the springs and lagoons, could also compete for plankton as food.

Tanz
ania
Na
ona
l Sin
gle
Spec
ies A
c o
n Pl
an 2
010-
2020
for t
he C
onse
rva
on
of th
e Le
sser
Fla
min
go (P
hoen
icon
aias
min
or)
34
Anne
x 3:
Glo
bal T
hrea
ts T
o Le
sser
Fla
min
go U
sing
Pro
blem
Tre
e An
alys
is(A
bstr
acte
d Fr
om K
enya
, SSA
P as
a b
asis
to h
arm
onize
SSA
P of
a sh
ared
pop
ula
on)

Tanzania Na onal Single Species Ac on Plan 2010-2020 for the Conserva on of the Lesser Flamingo (Phoeniconaias minor) 35
Annex 4:
Applied Research Ac on Plan for The Survival of the Lesser Flamingo in Lake Natron.
The end piece from “The Crimson Wing”, a recent Disneynature feature lm about the Lake Natron Flamingo, raised the ques on:
“For 20 million years, the Lesser Flamingo have lived and migrated amongst the lakes of Africa.Many of these lakes, including Natron, are under serious threat from pollu on and development.
How many more seasons of life and colour do the Flamingos have?And, who will no ce if they are gone forever?”
PreambleIn response to the above, Disneynature (DN), the Ramsar Secretariat, the African-Eurasian Waterbird Agreement (AEWA), in collabora on with the Government of Tanzania, agreed at Ramsar COP 10, in November 2008, to work as partners to establish a Lake Natron Trust Fund. A call was made for global ac on for the sustainable management of Lake Natron and the wise use of its ecosystem services for the survival of its people and the Lesser Flamingo (LF). Although the Trust was not funded, this proposal outlines the priority applied research framework that will provide valuable informa on to guide decision and policy makers on the future management of Natrons’ shared ecosystems services that both sustain bio-diversity, livelihoods and economic investments.
1. Background
Over 75% of the global popula on of Lesser Flamingo depend on Lake Natron for their survival. Natron is signi cantly the largest, and therefore the singularly most important of only ve known natural lesser amingo breeding sites in the world. It is the only breeding ground for the es mated 2.5 million birds that are shared by 4 countries in East Africa (ie. Tanzania, Kenya, Uganda and Ethiopia). During the making of the Disneynature feature lm, “The Crimson Wing,” observa ons were made that suggest Lake Natron is not only a unique Lesser Flamingo breeding ground but, hitherto unknown, is also a vital nursery and feeding area for young, pre- rst ight amingos.
Disneynature observe, of Lake Natron:
“More is known about the moon than about this remote and wild lake and its fabulous pink birds”.
Lake Natron is “a last fron er” for LF research. It is impera ve that research is undertaken to allow the crea on and implementa on of wise, sustainable land use plans that bene t not only Natron and the amingos, but their custodians, the local people. Consider: a. There is no LF ins tu onal memory available to the local managers, the community and district authori es.
Almost nothing is known about the Lesser Flamingo’s interdependence on Lake Natron. The last – and only – study concerning the breeding of Lesser Flamingos in East Africa is nearly 50 years old.
b. Almost nothing is known about the lake’s complex hydrologic and geologic systems. The last study by BGS was in 1960. With the excep on of recent volcanological research, no signi cant studies have been undertaken about Natron’s unique and dynamic hydro-chemical environment, and associated ora and fauna.
c. Almost nothing is known about how many people depend on the lake, it’s ecosystem func ons and the amingo, both economically and culturally. There are no signi cant socio-economic studies of local people
and their dependence on the lake and its associated resources and ecosystem services. There is limited informa on available regarding the heritage and economics of amingo tourism in the four East African

Tanzania Na onal Single Species Ac on Plan 2010-2020 for the Conserva on of the Lesser Flamingo (Phoeniconaias minor) 36
countries that host this bird.d. There is no ins tu onalized land use plan for the lake, its catchment, its wildlife or its people – all of which
are under increasing and serious threat from development, environmental degrada on and climate change. The lake and all its dependents are part of a larger catchment ecosystem which currently faces threats (from globaliza on) such as climate change, hydro-electric dams, mining, large scale water extrac on (eg irriga on), pollu on, and un-restricted tourism developments. And locally from human livelihood needs which lead to deforesta on for fuelwood, unregulated bushmeat hun ng and over-grazing. Kenya’s Lake Nakuru was in similar danger twenty years ago.
e. Lake Natron is one of our last, great wilderness areas. Local people live here in general sympathy with the environment, but the area is a desert and has a fragile water balance.
2. Factors Threatening Lake Natron and the Flamingo.
Threats to lake and the amingo also include threats to the lake’s hydro-chemistry and its structure, as well as its catchment area:
2.1. External threats:
The threats to the Lesser Flamingo include those beyond the control of its resident popula on, and are therefore the responsibility of government and global environment watchdogs.
The principle current external threat to Natron is the $300 million development proposal by TATA Chemicals and the Tanzania Na onal Development Coopera on (NDC) to extract 0.5-1 million tons/year of soda from the lake for the purpose of sa sfying the global market for glass clari ca on. TATA already operate such a factory at Lake Magadi, which lies 30 Km north of Natron and which is generally accepted to have an unlimited soda supply, so it is unclear why establish a new venture, un l the exis ng one has been exhausted?
a. The global a en on created by the Environmental Impact and Social Assessment (EISA) of the proposed Soda Mine appears to be more focused on the factory environs and its immediate social, physical and environmental impact. However, the likely and more cri cal threat to Lake Natron is the possible and profound changes to the lake chemistry caused by long term changes in the overall soda-salt concentra on and hydro-logical balance. The Flamingos depend en rely on the trona for nes ng material and building sites. Should this hard surface be depleted, damaged or ooded by mining (equivalent to an ice melt) no nes ng at Natron could occur.
b. The TATA-NDC proposal calls for the removal of brine from below the trona. This may cause buckling, cracking and collapse of the trona surface due to changes in physical (hydrosta c) pressures (Like ice on a pond). Any such disrup on to the rela vely at surfaces preferred by the nes ng birds will doubtless aff ect their desire and ability to nest. Such a threat is especially serious in the north of the lake (the proposed mine site) where amingos form elongate (or “re culate”) colonies along the edges of the trona plates.
c. The water needed for soda mining will compete with the amingo’s need for freshwater (to feed, drink and bathe) as well as human, livestock and wildlife needs, and would upset the lakes fragile water-balance.
d. Water abstrac on will also reduce the extent of the defensive moat that surrounds nes ng sites, and have an adverse eff ect on the annual cycle of soda island forma on (ie salt accre on and dissolve), and could lead to early drying and open the way for terrestrial predators to access nes ng sites.
e. The return of mined waste liquids (a er soda salt extrac on) to the soda plate surface, has a challenge of “where to put it”. If returned to the surface, it could lead to ooding of nes ng and feeding grounds, or dissolve the hard pack trona. If returned under the plates, this waste liquid would lead to hydro-sta c changes, buckling the plates, aff ec ng the amingos desire and ability to nest. In the longer term, this soda de cient material could contribute to a change in lagoon water salinity, not only aff ec ng the soda cycle, but also aff ec ng the unique micro-fauna that the adult amingos (and very possibly, juveniles) and all other residents of the marsh (including endemic sh) depend on. Further, the wastes in the returned water, would mean in me, the lake’s delicate chemical balance could be permanently altered and the silt load would intersperse and cover the soda… crea ng mud ats treacherous to edglings during migra on from nes ng grounds to shore.
f. The soda ash project includes plans for a road/rail link from the lake, east through a signi cant stretch of wilderness (Lake Natron GCA) to Arusha, nally concluding in the port town of Tanga (where it ignites

Tanzania Na onal Single Species Ac on Plan 2010-2020 for the Conserva on of the Lesser Flamingo (Phoeniconaias minor) 37
another large-scale development of a reasonably pris ne coastal area.). Currently, Lake Natron and areas directly south and east are protected as Game Controlled Areas (GCA). The tourist operators using these “blocks” for photography and hun ng invest signi cantly in an -poaching ac vi es and local community (eg USD 2000/village/year). Should the soda factory and its invasive road and rail link go ahead, there is a great likelihood the disturbance will scare wildlife away, leading to the operators abandoning the blocks, leaving no protec on for wildlife and precious catchment systems.
g. A Natron-Arusha road-rail link will bring increased human se lement not only to the factory site but all along the route. This infrastructure system and associated human immigra on will eff ec vely bisect a north-south wildlife migra on corridor between Kenya and Tanzania and increase pressure on the resources of a crucial part of the lake’s catchment area.
h. Human waste created by the factory and road-rail se lement may increase the numbers of Marabou storks (and hyenas/baboons, etc) resident to Natron, leading to addi onal problems for the amingos with increased preda on and disturbance of chicks.
i. Increasing human se lement in the en re Lake Natron catchment (from the soda mine, tourism and local expansion) will augment incipient threats. Degrada on from ca le, sheep and goats overgrazing, loss of forest cover due to fuelwood, charcoal, curio and mber extrac on, declining river ows due to excessive water abstrac on for domes c, industrial and irriga on (Tanzania and Kenya), and pollutants from wastes from se lement, livestock treatment and sewage, and shing will increase.
j. Global warming can be expected to change the fragile hydrological dynamics of the lake, with as yet unknown eff ects, but if the 2009 drought is an example of things to come, then this will be devasta ng.
2.2. Local threats:
Threats to the Lesser Flamingo from local popula on livelihood ac ons in the catchment, and therefore in need of “wise use” technologies for suitable alterna ves, include:
a. Catchment irriga on in rivers draining into Lake Natron will interfere with the hydrological balance – reducing the protec ve moat, and poten ally reducing nutrients brought into the lakes primary produc on zone, from run-off . Proposed large irriga on schemes in Tanzania (OXFAM) and Kenya could compound this problem – as will those currently opera ng in Kenya and Tanzania, unless sustainably managed and minimal environmental ows are assessed and maintained.
b. Current plans for the GCAs to become Wildlife Management Areas (WMA), will allow the people living around the lake to more collec vely and directly nancially bene t from wildlife tourism and the amingo heritage on their lands, while also requiring their increased responsibility for it. With li le capacity and experience, and should the current tourist operators abandon the GCA, these people will inherit the problems associated with the soda ash development and the protec on of the wildlife, currently aff orded by the operators. Though they may have signi cant pride and enthusiasm for their heritage, the local residents are woefully unprepared for the free-for-all that will likely follow in the development’s wake.
c. Lake Natron’s catchment is made up of very thin, very fragile and friable volcanic ash soils. Any damage to these soils by human livelihood ac vi es would also aff ect the hydrological cycle. The catchment environment is sensi ve to erosion from poor agricultural prac ces, deforesta on for mber, curio carvings, fuelwood and charcoal, as well as damage to vegeta on cover caused by uncontrolled bush res, or as a result of overgrazing due to excessive livestock. Damage will increase run-off rates, and thereby reduce percola on and therefore adversely aff ect water quan ty that recharges the many springs and rivers. Trouble then ows downstream as increased erosion rates lead to greater silta on and possible damage to the mud ats
and change water clarity in Natron. All of this will adversely aff ect the produc vity of the amingo feeding grounds.
d. Lake Natron is a closed environment. Anything that washes into the basin will stay there permanently. Given the low dilu on levels classical of soda lake (ie Natron is only 10% liquid), sewage wastes and other chemicals used in the catchment (for example waste dumps, oil spills, dips, pes cides, agricultural fer lizers and drenches for livestock) could accumulate and lead to eutrophica on or poisoning the lake, changing or killing its unique micro-algae popula ons, poisoning the amingos. This is the well-documented current situa on in Kenya’s Lake Nakuru. It is important therefore to manage sustainably human se lement, road infrastructure, responsible development of future tourist facili es, agriculture, irriga on and livestock prac ces in the catchment area to ensure they do not pollute or poison the environment.
e. Lack of knowledge about the lake and the amingos means that no meaningful management and

Tanzania Na onal Single Species Ac on Plan 2010-2020 for the Conserva on of the Lesser Flamingo (Phoeniconaias minor) 38
conserva on plans can be created, at this me. While a “precau onary approach” should be taken in the face of such a glaring inadequacy, proponents of invasive developments have in fact used this dearth of informa on as an argument in favour of their projects: “there are no facts to show such developments would be destruc ve”. However, this proposal calls for applied research to ll in the gaps, before developments take place to ensure that the environment, livelihoods and the amingos are not compromised.
f. Without proper land use plans the people of the lake cannot bene t from increased tourism, an expected consequences of the “Crimson Wing” lm. Therefore, they will have li le reason to protect the lake or the amingos. Needed is to understand the current economic importance of the ecosystem services shared
with the amingo to the local, EAC and regional community, and to mobilize these vested interests to invest in the future sustainability and security of local livelihoods and their income.
3. The Global Importance of Lake Natron
Lake Natron is a wetland of interna onal importance because:
a. It is key to the survival of over 75% of the global popula on of Lesser Flamingo (LF). b. It is the only breeding ground for the es mated 2.5 million East African LF popula on. c. It is one of only ve known natural breeding sites of the Lesser Flamingo in the world. d. It is an important site for breeding Avocets (a migrant bird) which also nest on the soda plates.e. It is home to a unique species group of sh, the Alcolapia, which are found only at Natron, and which
observa ons made by “The Crimson Wing” team suggest might form a unique, undocumented specia on diversity, analogous to Darwin’s nches, (over and above the four species which are currently recognized).
f. It is also a wintering home to over 100,000 migrant waterbirds, including Li le S nts, Ruff s, Curlew Sandpipers and other palearc c waders all of which are species to which the Agreement on the Conserva on of African-Eurasian Migratory Waterbirds (AEWA) applies.
g. In Tanzania, its catchment provides a livelihood for 15-20,000 people, mostly Masaai and their associated livestock, whose local culture is s ll rela vely intact, and who are, generally naive, and vulnerable to exploita on.
h. In Kenya, the catchment services provide a livelihood for as many, if not more people, who bene t from irriga on use of the catchment waters.
i. It is a reasonably intact wilderness area where humans and wildlife currently co-exist with minimal con ict and an important hun ng block for 2 concessions.
j. It is the only source of amingos that sustains the EAC and Ethiopian popula on and its extended, regional tourism economy.
k. The catchment is a buff er for fellow Masaai living in Kenya, who, during the 2009 drought, migrated across in signi cant numbers with their livestock to take refuge by grazing and watering their animals in the less densely populated plains surrounding Natron.
Tanzania and Natron’s local people therefore need support from the global community to create a proper management plan and to invest in its sustainable implementa on to ensure ecosystem services are not compromised for present and future genera ons of humans and bio-diversity.
4. Proposed Research Framework
The need for more science to sustainably manage Lake Natron ecosystems services and its biodiversity is acknowledged by the inputs from the IUCN SSC Interna onal SSAP (2006) on the Lesser Flamingo and both the Kenyan and Tanzania na onal SSAPs. These provide a priori zed, solid template for mul -year, me-sequenced studies that address:
4.1. General knowledge gaps a. Do the Lesser Flamingo use Lake Natron equally all year-around, or do they use it primarily for breeding, and
then go elsewhere when not breeding?b. How o en do they use the fresh water in ows for feeding, drinking, bathing and feather care?
4.2. Breeding knowledge gaps

Tanzania Na onal Single Species Ac on Plan 2010-2020 for the Conserva on of the Lesser Flamingo (Phoeniconaias minor) 39
a. How many pairs breed on the lake each year? What is the success rate?b. Where exactly on the lake do they breed and on what speci c substrates? And why?c. When during the year do they breed, and what are the triggers ini a ng this process? d. What are the threats during breeding?e. What is the ming of courtship, nest building, egg laying, hatching, edging, and rst emigra on from the
lake?f. How many young are hatched each year?g. What are the prime causes of mortality in young, and how many survive to edge each year?h. How are answers to the above ques ons related to variances in environmental condi ons, primarily the
amount of rainfall and the degree of surface ooding as well as water chemistry and plankton dynamics?i. How is hatching and breeding success aff ected by various types of disturbance and ooding?
4.3. Feeding Knowledge Gaps a. How many individuals of each age classes (chicks, immature and adults) feed in the open waters and mud ats
of the lake?b. Where on the lake do the adults, immature and young feed, and in what habitats? (Soda islands, foreshore
waters, mud ats, etc.)?c. What is the adult, immature and young diurnal feeding pa ern? Are these loca on speci c? And how are
these pa erns and loca ons aff ected by environmental condi ons? d. When do the chicks rst feed? And what % of the crop milk is supplemented by self-feeding on solid food,
such as organic mud or plankton?e. What is the importance of cyanobacteria, diatoms and aufuchs (organic mud) in each feeding zone?f. Are there seasonal and spa al varia ons in the above and why?g. What is the source of nutrients driving the primary produc vity of the Lake? How much is endogenous and
how much exogenous?h. Do the breeding birds feed primarily on Lake Natron, or do they y to other feeding loca ons, such as Lake
Empakai, or Manyara?i. For how long do the edglings stay and feed at Lake Natron before rst emigra on? Is this signi cant?
5. Importance of Observa ons Made During the Filming of “The Crimson Wing”
Already, speci c observa ons made by the lmmakers par ally answer some of the above ques ons – although, being anecdotal, they require rigorous scien c veri ca on before applica on. As the only people to have ever spent signi cant me not only on the soda salt ats (several months), but also amidst the lake environment (more than two years), the lmmakers believe that the following observa ons must be given priority for applied research:
5.1. Breeding Success and Lake Water Levels:
The breeding on Natron appears to be more exible than hitherto believed. Breeding events can occur throughout the year and appear not to be restricted to the narrow me period where universal, synchronized breeding is framed by the onset of the rains. In addi on the forma on of colonies is o en prolonged (as men oned by Brown and Root) so that diff erent areas within each individual colony (and around the lake) may be composed of birds at very diff erent stages of the nes ng cycle.
Perhaps the most cri cal factor to breeding is the moisture content of the soda, a factor determined by rising or receding water levels, and rainfall. This moisture content plays an important part in site selec on and therefore, successful nest construc on, as well as ming (seasonality) of breeding. It would appear that Greater Flamingos are the pioneer nes ng birds, as small groups of these larger birds are o en found ini a ng a colony, while Lesser Flamingos follow later, in lling areas between the Greater Flamingo nests, and expanding the colony outwards. Incuba on a empts prior to the end of the rains can be threatened by nests becoming dissolved if excessive rains (or winds) induce ooding. Receding water (post rain) not only provides suitable soda surfaces for nest building, but may also expose new organically rich muds on the far shore mud ats, or (if the water goes lower) exposed mud ats on the island shores nearer the nes ng areas, off ering opportuni es for supplemental

Tanzania Na onal Single Species Ac on Plan 2010-2020 for the Conserva on of the Lesser Flamingo (Phoeniconaias minor) 40
feeding by chicks. Lake waters in lagoons, may provide a moat of security around nes ng grounds, isola ng nursery areas from man and ground based predator disturbances. However, rain fed puddles or high water levels near nests, can induce mud or soda crystalliza on as anklets on the chick legs, feet and/or as soda accre on from the parents legs, covering and smothering incuba ng eggs and signi cantly reducing hatching rates.
5.2. Breeding Success and The Chick Stage:
While it is well known that amingo young are obliged to derive the bulk of their nutri on from their parents as “crop milk,” the lmmakers observed that young birds appear to derive an increasing percentage of food from self feeding in Lake Natron itself, both as they age to edgings and as immature birds before they leave the lake for the rst me. This behaviour has apparently been overlooked by researchers, and observers believed these ac ons to be “a need to drink freshwater!”. Brown and Root’s study was a generalized overview. Other studies have been more focused on the survival, feeding behavior and needs of the adults, however, Harper (Pers comm) concurs with this idea.
The lmmakers observed that young amingos have their own unique supplemental feeding pa erns, which, due to under-developed den on, are dis nctly diff erent from the lter feeding behavior of adults. A hitherto un-described feature of Lake Natron would appear to be its unique ecosystem quali es and primary produc on levels which allows for feeding opportuni es not only for adults, but also, and very importantly, for chicks and immature birds. Thus, in addi on to the “one-stop-shop” of provision of an environment for successful nes ng, incuba on and nursery care of the young, Natron appears to off er edglings and juveniles an addi onal food source in the mud ats and foreshore.
New light thus can be thrown on what has previously been described as “a daily migra on to freshwater for chicks to bath and drink”. It appears that, addi onally, the mass crèche migra ons witnessed of chicks are actually ac vely towards feeding areas. Feeding on and inges ng organic elements in the mud substrate (perhaps auwfuchs = organic rich muds) by paddling and displacing the mud underfoot, and apparently swallowing lique ed organic mud, was perhaps, earlier mistaken for “drinking”. This may well be an important supplement to parental milk and could be supported by observa ons by Brown and Root of Magadi. Here, the edging period was recorded as extended to 90 days, 20 days longer than the normal 70 days on Natron. This suggests that as the young could not source food from Lake Magadi, the adult birds had to source food from other lakes (ie Natron and Empakai), therefore, the addi onal 30% of me needed to edge, represents the propor on of me saved on Natron by self-feeding. In addi on, as the young edglings remain at Natron for a signi cant me
period before they are ready to fully emigrate away from the catchment, during which me the lter feeding apparatus and the body propor ons of each bird becomes fully developed for ight and lter feeding.
Chicks and edglings appear to exhibit diff erent body propor ons to adults, especially in tarsus length, and in uences their ight capacity. This could be a feature categorized by diff erent bone density and structure. The required high levels of calcium needed for bone growth may be limited in “crop milk” and might be sa s ed by supplemental feeding on calcium rich, organic muds, loaded with diatoms and minerals.
Thus it appears Lake Natron plays a signi cant, but as yet unquan ed role in the ini al feeding and early development of the Lesser Flamingo, and the interface between parental-and self-provisioning needs to be be er understood and studied as it has great signi cance of a achment to the water balance of the Lake.
5.3. Aerial Predators:
At Natron this threat exists most signi cantly in the form of Marabou Storks, but also, possibly (in the winter months) migrant Aquila Eagles. Preda on of Flamingo colonies has been es mated to contribute 5 % of mortali es (Brown and Root), yet this gure is likely to be an underes mate Aberhard (Pers Obs).
Direct preda on by Marabous can cause signi cant losses of eggs and chicks in and around the nes ng areas. In addi on, and perhaps much more seriously, such direct preda on also causes huge disturbance within the aff ected amingo colony, which can, o en lead to abandonment of nests, or egg damage caused by panic amongst incuba ng or brooding parents. Such disturbance can cause the dislodgement of newly hatched chicks

Tanzania Na onal Single Species Ac on Plan 2010-2020 for the Conserva on of the Lesser Flamingo (Phoeniconaias minor) 41
from their nest mounds, which can lead to deaths from exposure, development of anklets and trampling on the salt at oor. Starva on of chicks is an important source of a ri on, and can be the result of a separa on of the chick from its parents. Although amingos have an uncanny imprinted individual call recogni on, it is not impossible for a parent bird to lose its chick in the vast areas of the colony during periods when thousands of birds are stampeded within the colony. Indeed creche forma on may have a signi cant value to the parent birds in that they can locate a chick within an easily visible congrega on, perhaps nding this impossible to do so in a situa on where chicks sca er and become distributed evenly (randomly) over many square kilometers of soda at, and cannot hear nor dis nguish a parent’s call sign.
6. Objec ves of the ResearchDetails of these research proposals are elaborated in a Logical Framework Analysis and in depth methodology and budget are available separately. The main thrust of these studies is to understand the in uence of water balance on water levels and water chemistry on amingo breeding, and include the consequences of poten al catchment pressures on ecosystems func ons and services:
6.1. Studies to Understand the Breeding Biology of the Lesser Flamingo:
Objec ve: To link poten al changes in chemistry and water level on the breeding, and survival of the Lesser Flamingo.
Expected Outputs:
a. Historical analysis of the behavior pa erns of Lesser Flamingos nes ng and crèche movements on Lake Natron from available historical and current satellite imagery and clima c data (where available).
b. Satellite tracking of selected amingo adults to determine the courtship, breeding migra ons and importance of external feeding grounds to amingo breeding at Natron, and their key feeding lakes (eg Empakai).
c. An analysis of the rela onship between water levels and successful nes ng and incuba on, though the remote camera monitoring of colonies occurring during the study period.
6.2. Studies to Understand the Early Feeding Biology of the Lesser Flamingo.
Objec ve: To Link the Ecology of Lake Natron to the Feeding and Survival of Lesser Flamingo from Chick to Immature Stage.
Expected Outputs:
a. Satellite tracking and mass ringing and colour coding of diff erent crèches, to understand the circadian feeding cycles and behavior pa erns of the diff erent stages in development of the Lesser Flamingo from juveniles to rst ight from the Lake of the immature stage.
b. A less intrusive analysis of the crop and fecal ma er to assess the importance of parental milk, and of supplemental feeding on cyanobacteria, diatoms and organic mud to the nutri on of the diff erent developmental stages of the Lesser Flamingo young up to the me they leave the Lake.
c. A detailed remote camera study of the feeding behavior of the juvenile birds from crèche to edged juvenile and immature stages, and feeding behaviour on Lake Natron.
d. An analysis of water levels on lake chemistry and associated primary produc vity of cyanobacteria, diatoms and organic muds (auwfuchs) on the islands, in the foreshore waters and mud ats.
e. A laboratory bio-assay of the in uence of soda dilu on on the intensity of primary produc on described above, and the likely impact of turbidity (ie from soil run-off ).
6.3. An Assessment of the Losses due to Preda on and Disturbance.
Objec ves: To determine to what extend predators (like Marabou Storks) and other forms of disturbance are a threat to the nes ng and survival of developing young Lesser Flamingos
Expected Outputs:

Tanzania Na onal Single Species Ac on Plan 2010-2020 for the Conserva on of the Lesser Flamingo (Phoeniconaias minor) 42
a. To establish annual counts and satellite tracking of the Marabou Storks and jackals on Lake Natron.b. To assess the impact of direct preda on by remote camera sensing.c. To assess indirect losses due to disturbance of breeding colonies, including the eff ects of separa on of
chicks from parent birds and crèches (starva on) and anklet forma on, by remote camera.d. To look at less intrusive ways of dealing with the problem, such as transloca on and satellite tracking of the
problem birds.e. To establish a be er understanding of the eff ects of Tourist / Sightseeing over- ights of colonies
6.4. Studies on a Symbio c Balance between Lesser Flamingo and Improved Livelihoods of its Custodians.
Objec ves: To ensure that the local community bene t from the growth in tourism in the area, without compromising the environment for the Lesser Flamingo.
Expected Outputs:
a. A study of the rate of deforesta on (for fuelwood, charcoal, mber or curios) in the catchment, and the likely impacts of run-off and erosion on water levels and water quality (ie turbidity) of the lake. Establish, implement and monitor a sustainable forest catchment management plan.
b. A study of current agricultural prac ces and irriga on schemes (tradi onal and commercial) in the catchment: the use of pes cides; erosion consequences; the level of abstrac on of water; and the eff ect on water ows and chemistry. Undertake an Environmental Flow Assessment to develop an irriga on management plan based on the minimal ows that must be maintained to ensure least impact on the lake and associated ora and fauna, and to introduce sustainable agricultural and irriga on prac ces.
c. A study of current livestock levels and chemical treatments (ie dips and drenches) and the impacts they have on water and grazing lands; of the resultant impact of pollu on, erosion and run-off rates and silta on on the Lake; of the economics of pastoralism and cultural signi cance values. Install rangeland and herd management plans based on carrying capacity that ts the needs of the people and the local environment.
d. A study of current tourism and human se lement in the catchment, looking at water use and wastes (ie liquid, solid, sewage and chemical) to establish local standards and by-laws (for environmental impact assessment) to sustainably manage the use of water and disposal of wastes; and to establish a responsible tourism code of conduct.
e. To study the economic value of amingo tourism and associated values locally, regionally and globally, assessing the direct value to people (by locality) from amingo tourism, amingo branded products, and the like to secure empathy for the protec on of Natron; to show global value. To appeal for support for the Trust Fund for local community developments (ie schools, boreholes, clinics, etc) and associated environmental awareness.
f. Development of a Flamingo Visitor Informa on Centre established at Natron (perhaps Makat side), screening “The Crimson Wing” and other features, a museum from which revenues will go to a shared local community development fund, or to support schools with educa onal programs on nature and conserva on.
g. A study of the economic values of the wilderness in the en re catchment area (and of current illegal uses, for Bushmeat), and look at value added products, a Tourism Development Plan, in order that greater wilderness revenues can be shared through a local development fund. Such a fund should link all associated villages under the umbrella of the two Wildlife Management Areas and support speci c village sustainable development micro-projects in the catchment.
7. Development of a Ramsar Offi ce and a Research Sta on at NatronAs part of the Ramsar Site, the Wildlife Division (with current support from the Danish Government) will place a full- me Ramsar Site Project Manager at Ngaresero with an offi ce, support vehicle and equipment. This offi ce: will coordinate the prepara on and implementa on of the Integrated Management Plan; will include site ac ons into the District and Village Development Plans; and will assist the implementa on of the WMA process.
While the Ramsar Offi ce will look at implementa on of the IMP, there will also be the need for a designated Research Sta on to ful ll the scien c objec ves.
This proposal considers:

Tanzania Na onal Single Species Ac on Plan 2010-2020 for the Conserva on of the Lesser Flamingo (Phoeniconaias minor) 43
a. To sub-contract the research to an interna onal research ins tu on to coordinate, under the supervision and guidance of the Trust (to-date WCS, Leicester University and Illinois University have expressed interest to par cipate, singularly or in combina on).
b. The facility at Makat (used by the lmmakers) will be made available by its owners, Tanzania Game Trackers (TGT) to the program for upgrade as a research sta on, with suitable offi ce, laboratory and accommoda on facili es for the scien c offi cer and two-to-three guest scien sts/students.
c. This will include placement by the interna onal organiza on of a Senior Scien st to lead the research, to be based full- me at the Lake (for up to ve years).
d. TAWIRI and Tanzania Wildlife Division will be involved as government counterparts, and will have the op on of placement of staff seconded to the program to undertake higher degree studies (two PhDs scholarships are proposed; one in breeding, the other in feeding), linked to local and overseas universi es.
e. To ensure local exposure, SUA University in Morogoro (or UDSM or both) will be linked to the research, to supervise the two PhDs and to organize student ou ngs to gain experience in alkaline lakes, bird capture, ringing, satellite tracking, remote sensing, GIS, sample collec on, and general ornithological techniques.
f. The Sta on will need a vehicle and muffl ed motorcycles or quad bikes for the research teams.g. The current Disneynature equipment, namely the hovercra , could be donated to the Trust, or procured. h. The addi onal exis ng equipment at the Makat site could similarly be donated to the Trust, or procured.i. Provision must be made for the site offi ce with furniture, laptop computers, printers and any other
administra ve equipment. j. Likewise, provision must be made for the site laboratory, with sampling devises, analysis kits and sample
preserva on (for future analysis at home base). k. Provision must be made for remote cameras, security stands, mers, extended ba eries, and other remote
monitoring equipment, including, for example, weather sta ons (if Disneynature decides to invest in future informa ve documentaries then this equipment could come from a separate budget for produc on).
l. As security, local Maasai would be hired through the community as security guards to watch the equipment, mostly the remote cameras.
m. A detailed budget for the sta on, staff , equipment and opera ons is a ached (Annex 2).
8. Proposed Research ProgramThis sec on highlights key research which must be rst and foremost be conducted on the Lake Natron environment and its catchment to understand the unique affi lia on of the amingo with the Lake and its people, to be er ins tute a sustainable management plan.
8.1. Breeding Behaviour LF:
Studies to Understand and Be er Manage the Breeding Behaviour of the Lesser Flamingo, Rela ve to Climate and Hydrological Condi ons of Lake Natron.
Null Hypothesis:
Water levels and salinity play a key role in courtship, nes ng, incuba on and crèche success (the recruitment rate) of Lesser Flamingos at Natron
Objec ves:
To Link the Ecology of Lake Natron and the Importance of its soda plate ats, to the Breeding Biology and Breeding Success of Lesser Flamingo.
Expected Outputs:
a. Historical study of the nest building vs lake levels, climate, etc.b. Real me study of courtship, nest building and egg incuba on.c. Study of adult migra on, diurnal, breeding and feeding of young.
Methodology:

Tanzania Na onal Single Species Ac on Plan 2010-2020 for the Conserva on of the Lesser Flamingo (Phoeniconaias minor) 44
a. Historical analysis of 20 years of satellite imagery of nes ng pa erns from available satellite data (if resolu on allows) to discern nes ng polygons.
b. From historical, available satellite imagery, relate breeding behaviour to clima c variables and water levelc. Establishment of a clima c recording sta on at Lake Natron to record throughout the period, clima c
variables.d. Real me satellite imagery analysis of minimum 2 years of nes ng pa erns, ande. Coupled with aerial photographic studies of diurnal pa erns and seasonal varia ons in nes ng, andf. Coupled with ground truthing to count nests and failed eggs.g. By remote camera imagery set up at nes ng sites, collect me sequenced s lls images of behavior, nest
building, incuba on, rst feeding etch. Satellite tracking of 40 breeding adult amingos, to understand circadian nes ng, rst feeding cycles and the
rela ve importance of Lake Natron vs other lakes to the provisioning of developing young amingos.i. Analysis of the rela onship between water levels, water chemistry, etc and successful nes ng and incuba on.
8.2. Feeding Behaviour LF:
Studies to Understand and Manage the Feeding Behaviour of Lesser Flamingo Chicks, Pre- edging and Immature Birds, in Lake Natron, and the In uence of Water Levels and Water Chemistry on Food Types.
Null Hypothesis:
The developmental stages of the Lesser Flamingo are dependent on Lake Natron as a supplemental feeding ground.
Objec ve: To link poten al changes in chemistry and water level on the feeding and survival of the Lesser Flamingo, from chick to immature stage, for sustainable management to improve survival rates.
Expected Outputs:
a. Understanding of historical feeding pa erns on Lake Natron vs climate vs water level.b. Linking clima c changes and water levels to chick and immature feeding behavior.c. Understanding of diff erent stages of Flamingo development (chick, immature and adult) feeding pa erns
and diurnal movements.d. Understanding the produc vity of the lake in terms of cyanobacteria, diatoms and organic muds and the
rela onship of this and importance to the stages in the life cycle of the Flamingo.
Methodology:
a. Historical analysis of 20 years of satellite imagery of feeding and crèche and adult distribu on pa erns from available satellite data (if resolu on allows) to discern pa erns in visible polygons (ie zoning the lake into nes ng and feeding grounds).
b. Satellite tracking of 40 chicks and 20 immature birds, to understand the circadian feeding cycles and behavior pa erns of the diff erent stages in development of the Lesser Flamingo from chick to immature stage.
c. From the above remote camera imagery on nes ng sites, an analysis of the importance of parental milk, and study on feeding s mulus through the early stages.
d. Through remote camera imagery set-up on feeding grounds and mud ats, obtain photographic s lls of diurnal and seasonal feeding pa erns.
e. Through mass colour ringing of crèches, monitor details of the feeding migra on and drinking behavior of the juvenile birds from crèche to immature stages on Lake Natron.
f. Couple this with hilltop remote camera imagery of photographic s lls to determine diurnal and seasonal pa erns of movements from crèche to feeding ground and back.
g. Take regular samples of water and mud at quality, near shore and far shore of the “moat”, and analyse for salinity, chemistry, and food organisms (cyanobacteria and diatoms and organic mud = Aufwuchs).
h. Looking at seasonal changes in each food type, in calori c, nutrient and chlorophyll content. i. Abstract (during ringing) humanely collected fecal and gut samples from a size range of birds to ascertain

Tanzania Na onal Single Species Ac on Plan 2010-2020 for the Conserva on of the Lesser Flamingo (Phoeniconaias minor) 45
their % content of parents milk, lter feeding of cyanobacteria, diatoms and organic mud.j. Assess the contribu on of each to the nutri on of the diff erent life cycle stages of the Lesser Flamingo
young up to the me they leave the Lake.k. An analysis of the rela onship between water levels and feeding pa erns.l. An analysis of water levels on lake chemistry and associated primary produc vity of cyanobacteria, diatoms
and organic muds.m. A laboratory bio-assay of the in uence of diff erent soda dilu on levels on the primary produc on described
above.
8.3. Preda on and LF Biology:
An Assessment of the Management of Lesser Flamingo Losses due to Preda on and Disturbance.
Null Hypothesis:
Losses due to direct preda on and indirectly due to disturbance, can lead to 58% mortality.
Objec ves:
To determine to what extent predators like Marabou Storks (and other predators and forms of disturbance) are a threat to the survival of juvenile birds.
Expected Outputs:
a. Es mated percentage losses due to direct preda on by Marabous through emote camera sensing.b. Es mated percentage indirect losses due to disturbance and other environmental factors (separa on and
starva on) anklets, and salt accre on.c. Es mated percentage losses due to other forms of preda on (Aquila eagles and Jackals)d. Establish a humane mechanism of reducing the Marabou problem by satellite tagging and selected distance
displacement from the Lake.e. Establish a greater understanding of the possible eff ects of Tourist over- ights on Flamingo colonies
Methodology:
a. Ring individual Marabou Storks on Lake Natron to establish size of popula on using the Lake Catchment.b. Through satellite tracking of at least 10 Marabou Storks, determine their diurnal and seasonal movements
on Lake Natron (and elsewhere) in rela on to the Flamingo breeding cycle.c. From the above s lls photography of nests, es mate the damage done by marabous by direct inges on and
indirectly by abandonment, and exposured. Collec on and analysis of abandoned eggs in Marabou aff ected colonies to assess hatch failure and impact
on poten al hatching success.e. Analysis of distribu on of dead chicks in and around colonies with post mortem analysis of corpses to
indicate likely cause of death.f. To look at less intrusive ways of dealing with the Marabou problem, such as transloca on of the 10 satellite
tagged problem birds, to determine if they return.
8.4. Ecosystem Services and LF Biology:
Studies on the Symbio c Balance between Lesser Flamingo and its Sustainable Management for Improved Livelihoods of its Custodians.
Null Hypothesis:
The Lesser Flamingo has a cultural heritage and economic signi cance to the lives of people in the area (and East Africa Region).

Tanzania Na onal Single Species Ac on Plan 2010-2020 for the Conserva on of the Lesser Flamingo (Phoeniconaias minor) 46
Objec ves: To ensure that the local community bene t from their heritage, and the growth in tourism in the area, without compromising the environment for the Lesser Flamingo.
Expected Outputs:a. Sustainable catchment forest management included in local development plans.b. Sustainable catchment agriculture and irriga on management included in local development plans.c. Sustainable catchment livestock management included in local development plans.d. Sustainable se lement and tourism management included in local development plans, and a responsible
tourism code of conduct established.e. Sustainable catchment wildlife management included in local development plans.f. Economic value of amingo management included in local development plans.g. A Flamingo Tourism Informa on centre established, catering to both tourists and local Tanzanians, including
school children, giving informa on about the area, its vulcanology including a module on the Flamingo (the Ge y Founda on’s Olduvai Gorge Visitor Center is a splendid example). Schools supported in educa onal programs on nature and conserva on, including funded school trips to the Visitor Educa on Center.
h. Communi es engage in conserva on through two WMAs.i. The above development plans implemented through Village micro-projects supported in sustainable
development.
Methodology:a. To list the ecosystem services of Lake Natron and ecological links to Lesser Flamingo. b. A study of the rate of deforesta on in the catchment, and its reasons for fuelwood, charcoal, mber or
curios and impacts on run-off and erosion and aff ects it has on water levels and water quality (ie turbidity) of the lake, and establish, implement and monitor a sustainable forest management plan.
c. A study of current agricultural prac ces and irriga on schemes (tradi onal and commercial) in the catchment, the use of pes cides, erosion consequences, the level of abstrac on of water, and the eff ect on water ows and chemistry. Undertaking an Environmental Flow Assessment to develop an irriga on management plan based on the minimal ows that must be maintained to ensure least impact on the lake, and to introduce sustainable agriculture prac ces.
d. A study of current livestock levels and chemical treatments (ie dips and drenches) and the impacts they have on water and grazing lands. Of the resultant impact of pollu on, erosion and run-off rates and silta on on the Lake. To look at the economics of pastoralism and cultural signi cance values, to ins ll rangeland and herd management plans based on carrying capacity, and that ts the needs of the people.
e. A study of current tourism and human se lement in the catchment, looking at water use and wastes (ie liquid, solid, sewage and chemical) to establish local standards and by laws to sustainably manage the use of water and disposal of wastes. To establish a responsible tourism code of conduct, tourism zoning or plan for the area, a guide to eco-friendly tourism investments, developments and sets standards for tours, and small aircra y-overs, and a training of local guides.
f. To study the economic value of amingo tourism and associated values locally, regionally and globally, assessing the direct value to people (by locality) from amingo tourism, amingo branded products, and the like to secure empathy for the protec on of Natron, to show global value, and appeal for support for a Trust Fund for local community developments of schools, boreholes, clinics, and associated environmental awareness.
g. At Makat, and a smaller unit at the Ramsar offi ce (Ngaresero), a “Flamingo Tourism Informa on Centre(s)/Visitor Educa on Center” shall be established, to show a museum of the Flamingo and the volcanic geology of its environment, coupled with exhibits, photographic and cinema c. “The Crimson Wing” (and any possible subsequent lms) might be screened here and revenues may go to a shared local community development fund.
h. Forming of two Wildlife Management Areas from what are currently two Game Control Areas (Lake Natron North and South), currently managed as hun ng blocks. To rally 30 villages, including 14 from the Lake Natron catchment to form conserva on organiza ons to manage wildlife on their village lands, as per agreed bylaws, and for added value from tourism (photographic and hun ng), contribu ng to local needs.
i. Schools in the area would bene t from supported in educa onal programs on nature and conserva on. This can include publishing brochures and lea ets for awareness raising, screening of “The Crimson Wing”, and installa on of DSTv special educa onal TV and satellite packages in schools for educa onal purposes.

Tanzania Na onal Single Species Ac on Plan 2010-2020 for the Conserva on of the Lesser Flamingo (Phoeniconaias minor) 47
j. As part of the IMP, district and village ac on for sustainable development will be called for through Wetland Friendly Investments. This can include Village micro-projects in sustainable development of pastoralism, tradi onal irriga on, sustainable sheries, use of mber and non- mber products in the catchment, and the pressures on wildlife from poaching for food or income.
9. Budget
A separate detailed budget is available.
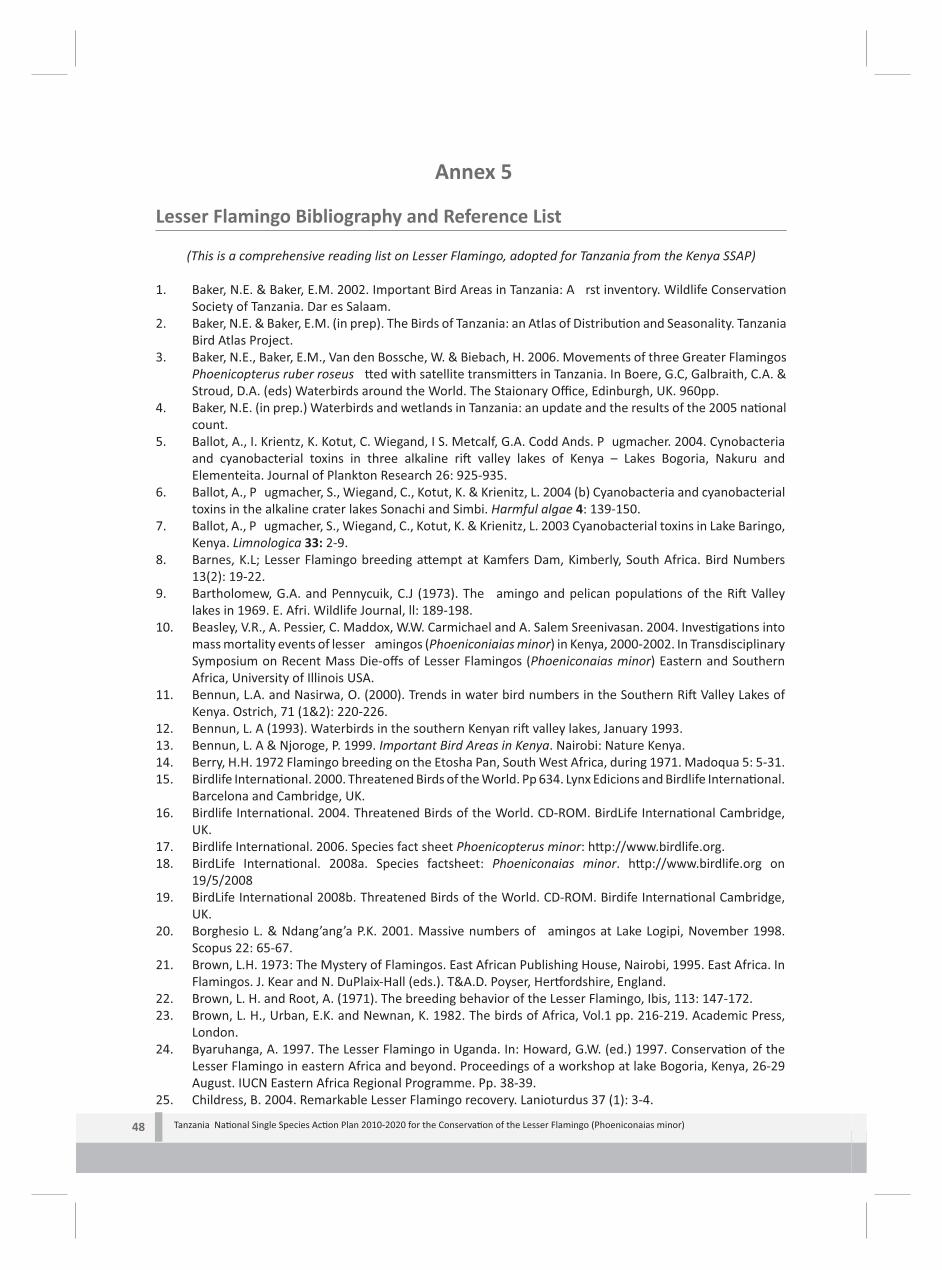
Tanzania Na onal Single Species Ac on Plan 2010-2020 for the Conserva on of the Lesser Flamingo (Phoeniconaias minor) 48
Annex 5
Lesser Flamingo Bibliography and Reference List
(This is a comprehensive reading list on Lesser Flamingo, adopted for Tanzania from the Kenya SSAP)
1. Baker, N.E. & Baker, E.M. 2002. Important Bird Areas in Tanzania: A rst inventory. Wildlife Conserva on Society of Tanzania. Dar es Salaam.
2. Baker, N.E. & Baker, E.M. (in prep). The Birds of Tanzania: an Atlas of Distribu on and Seasonality. Tanzania Bird Atlas Project.
3. Baker, N.E., Baker, E.M., Van den Bossche, W. & Biebach, H. 2006. Movements of three Greater Flamingos Phoenicopterus ruber roseus ed with satellite transmi ers in Tanzania. In Boere, G.C, Galbraith, C.A. & Stroud, D.A. (eds) Waterbirds around the World. The Staionary Offi ce, Edinburgh, UK. 960pp.
4. Baker, N.E. (in prep.) Waterbirds and wetlands in Tanzania: an update and the results of the 2005 na onal count.
5. Ballot, A., I. Krientz, K. Kotut, C. Wiegand, I S. Metcalf, G.A. Codd Ands. P ugmacher. 2004. Cynobacteria and cyanobacterial toxins in three alkaline ri valley lakes of Kenya – Lakes Bogoria, Nakuru and Elementeita. Journal of Plankton Research 26: 925-935.
6. Ballot, A., P ugmacher, S., Wiegand, C., Kotut, K. & Krienitz, L. 2004 (b) Cyanobacteria and cyanobacterial toxins in the alkaline crater lakes Sonachi and Simbi. Harmful algae 4: 139-150.
7. Ballot, A., P ugmacher, S., Wiegand, C., Kotut, K. & Krienitz, L. 2003 Cyanobacterial toxins in Lake Baringo, Kenya. Limnologica 33: 2-9.
8. Barnes, K.L; Lesser Flamingo breeding a empt at Kamfers Dam, Kimberly, South Africa. Bird Numbers 13(2): 19-22.
9. Bartholomew, G.A. and Pennycuik, C.J (1973). The amingo and pelican popula ons of the Ri Valley lakes in 1969. E. Afri. Wildlife Journal, ll: 189-198.
10. Beasley, V.R., A. Pessier, C. Maddox, W.W. Carmichael and A. Salem Sreenivasan. 2004. Inves ga ons into mass mortality events of lesser amingos (Phoeniconiaias minor) in Kenya, 2000-2002. In Transdisciplinary Symposium on Recent Mass Die-off s of Lesser Flamingos (Phoeniconaias minor) Eastern and Southern Africa, University of Illinois USA.
11. Bennun, L.A. and Nasirwa, O. (2000). Trends in water bird numbers in the Southern Ri Valley Lakes of Kenya. Ostrich, 71 (1&2): 220-226.
12. Bennun, L. A (1993). Waterbirds in the southern Kenyan ri valley lakes, January 1993.13. Bennun, L. A & Njoroge, P. 1999. Important Bird Areas in Kenya. Nairobi: Nature Kenya. 14. Berry, H.H. 1972 Flamingo breeding on the Etosha Pan, South West Africa, during 1971. Madoqua 5: 5-31. 15. Birdlife Interna onal. 2000. Threatened Birds of the World. Pp 634. Lynx Edicions and Birdlife Interna onal.
Barcelona and Cambridge, UK.16. Birdlife Interna onal. 2004. Threatened Birds of the World. CD-ROM. BirdLife Interna onal Cambridge,
UK. 17. Birdlife Interna onal. 2006. Species fact sheet Phoenicopterus minor: h p://www.birdlife.org. 18. BirdLife Interna onal. 2008a. Species factsheet: Phoeniconaias minor. h p://www.birdlife.org on
19/5/200819. BirdLife Interna onal 2008b. Threatened Birds of the World. CD-ROM. Birdife Interna onal Cambridge,
UK.20. Borghesio L. & Ndang’ang’a P.K. 2001. Massive numbers of amingos at Lake Logipi, November 1998.
Scopus 22: 65-67.21. Brown, L.H. 1973: The Mystery of Flamingos. East African Publishing House, Nairobi, 1995. East Africa. In
Flamingos. J. Kear and N. DuPlaix-Hall (eds.). T&A.D. Poyser, Her ordshire, England.22. Brown, L. H. and Root, A. (1971). The breeding behavior of the Lesser Flamingo, Ibis, 113: 147-172.23. Brown, L. H., Urban, E.K. and Newnan, K. 1982. The birds of Africa, Vol.1 pp. 216-219. Academic Press,
London.24. Byaruhanga, A. 1997. The Lesser Flamingo in Uganda. In: Howard, G.W. (ed.) 1997. Conserva on of the
Lesser Flamingo in eastern Africa and beyond. Proceedings of a workshop at lake Bogoria, Kenya, 26-29 August. IUCN Eastern Africa Regional Programme. Pp. 38-39.
25. Childress, B. 2004. Remarkable Lesser Flamingo recovery. Lanioturdus 37 (1): 3-4.

Tanzania Na onal Single Species Ac on Plan 2010-2020 for the Conserva on of the Lesser Flamingo (Phoeniconaias minor) 49
26. Childress, B. 2005 Flamingo popula on es mates for Africa and southern Asia. In: Childress, B., Bechet, A., Arengo, F. & Jarret, N. (Eds.) Flamingo 13, Bulle n of the IUCN-SSC/Wetlands Interna onal Flamingo Specialist Group. Wildfowl & Wetlands Trust, Slimbridge. UK.
27. Childress, B., Nagy, S. and Hughes, B. (Compilers) 2007. Interna onal Single Species Ac on Plan for the Conserva on of the Lesser Flamingo (Phoenicopterus minor). AEWA Technical Series, Bonn Germany.
28. Childress, B., D. Harper, B. Hughes, W. Van Den Bossche, P. Berthold and U. Querner, 2004. Satellite tracking Lesser Flamingo movements in the Ri Valleys, East Africa: Pilot study report. Ostrich 75(1&2): 57 – 65
29. Childress, B., Béchet, A., Arengo, F. & Jarre , N. (eds) 2005. Flamingo, Bulle n of the IUCN-SSC/Wetlands Interna onal Flamingo Specialist Group, No 13, December, 2005. Wildfowl & Wetlands Trust, Slimbridge, UK
30. Childress, R.B., Harper, D.M., Hughes, B. & Ferris, C. 2005. Sex determina on in the Lesser Flamingo (Phoenicopterus minor) using morphological measurements. Ostrich 76: 148-153.
31. Childress, B., Hughes, B., Harper, D., Van den Bossche, W., Berthold, P. & Querner, U. 2007. East African yway and key site network of the Lesser Flamingo (Phoenicopterus minor) documented through satellite
tracking. Proceedings of Pan African Ornithological Congress XI, Djerba, Tunisia, 20-25 November 2004. Ostrich 78 (2): 463-468.
32. Codd, G.A., A. Ballot, K. Kotut, L. Krientz, J.S. Metcalf, L.F. Morrison, S. P ugmacher and C. Wiegand. 2004. Cyanotoxins as Contributors to Flamingo Mass Mortali es. In Transdisciplinary Syomposium. On Recent Mass Die-off s of Lesser Flamingos (Phoeniconians Minor) In Eastern and Southern African, University of Illinois, USA.
33. Codd, G.A., Metcalf, J.S., Morrison, L.F., Krienitz, L., Ballot, A., Krause, E., Kotut, K., Putz, S., Wiegand, C. & P ugmacher, S. 2003a Cyanobacterial toxins in the mass mortali es of amingos at Kenyan lakes. Phycologist. Abstracts of the annual winter mee ng, Galway, 2-5 January 2003.
34. Codd, G.A., Metcalf, J.S., Morrison, L.F., Krienitz, L., Ballot, A., Wiegand, C. & P ugmacher, S., Kotut, K. 2003b Suscep bility of amingos to cyanobacterial toxins via feeding. Vet. Rec. 152: 722-723.
35. Conven on on Conserva on of Biological Diversity (CBD), 199236. Conven on on Conserva on of Migratory Species of Wild Animals (CMS), 199237. Conven on on Conserva on of Wetlands (Ramsar), 1971.38. Cooper, J. E. 2004. The pathology of the Phoenix: Quo Vadis?. In Transdisciplinary Symposium on recent
mass Die-off s of Lesser Flamingos (Phoeniconians minor) in eastern and southern Africa, University of Illinois, USA.
39. Dawson R. M. (1997). The toxicology of microcys ns, Toxicon, 36 (7): 053-962.40. de Naurois, R. (1965). Une colonie reproductrice du pe t Flamant rose, Phoeniconaias minor (Geoff roy)
dans l’A out es Sahel (Sud-Ouest mauritanien). Alauda 33: 166-176.)41. Delany, S. and Sco , D. (2006) Water bird Popula ons Es mates 4th Edi on. Wetlands Interna onal. 42. Del Hoyo, J. 1992. Flamingos. In Handbook of the Birds of the World, Vol 1. J Del Hoyo, A. Elliot and J.
Sargatal (eds.). Lynx Edi ons, Barcelona. Pp. 508-526.43. Disneynature (2008) “Global Ac on for the Sustainable Management of Lake Natron Ecosystem Services
for the Conserva on of the Lesser Flamingo”. WD/Disneynature, publica on.44. Disneynature (2009) Crimson Wing. A feature lm.45. Dodman, T and Diagana, C.H. 2003. African Waterbirds Censusus 1999, 2000, & 2001. Wetlands
Interna onal Global Series No. 16, Wageningen, The Netherlands. 46. Dow, C.S. & Swoboda, U.K. 2000 Cyanotoxins. In Whi on, B.A. & Po s, M. (eds.), The Ecology of the
Cyanobacteria pp 613-632. Kluwer, Dortrecht.47. Edebe, J.A; 2005. An Environmental System Analysis of Lake Elementeita, Kenya, with preference to Water
Quality.48. Fain, M.G. & Houde, P. 2004. Parallel radia ons in the primary clades of birds. Evolu on 58: 2558–2573.49. Finlay, B.J. et al (1987). Ciliated protozoa and other micro-organisms from two soda lakes (Lake Nakuru
and Lake Simbi, Kenya). Arch. Pro stenkd., 133: 81-91.50. Flamingo (2006). First con rmed breeding record of the Lesser Flamingo in Ethiopia. Flamingo16, p 29.51. Furness, R. W. & Greenwood, J. J. D. (eds.) (1993). Birds as Monitors of Environmental Change. Chapman
and Hall, London. 52. Geoff roy, E.L 1798; Societe Philomanthique de Paris, Bulle n 1 (2). 53. Gilroy, D.J., Kauff man, K.W., Hall, R.A., Huang, X. & Chu, F.S. 2000 Assessing poten al health risks from
microcys n toxins in blue green algae dietary supplements. Environ. Health Persp. 108: 435-439.

Tanzania Na onal Single Species Ac on Plan 2010-2020 for the Conserva on of the Lesser Flamingo (Phoeniconaias minor) 50
54. Githaiga, J.M. 1997. U liza on pa erns and inter-lake movements of the Lesser Flamingo and their conserva on in Saline Lakes of Kenya. In In: Conserva on of the Lesser Flamingo in Eastern Africa and beyond. G. Howard (eds.), Nairobi, Kenya: IUCN Lake Bogoria. Pp. 11-21.
55. Githaiga, J. M (2003). Ecological Factors Determining u liza on Pa erns and inter-lake movements of the Lesser Flamingos in Kenyan alkaline lakes. Ph.D Thesis, University of Nairobi.
56. Government of Kenya -Central Bureau of Sta s cs, 2001. 1999 Popula on and Housing Census. Ministry of Finance and Planning-Kenya.
57. Government of Kenya – Central Bureau of Sta s cs- Nakuru District, Welfare Monitoring Survey , 1992, 1994, 1997.
58. Kenya Forestry Master Plan. 1994.Development Programmes. Ministry of Environment and Natural Resources. Government of Kenya
59. Greichus, Y.A., Greichus, A. Amman, B.D. and Hopcra J. (1978). Insec cides polychlorinated biphenyls and metals in African lake ecosystems. III. Lake Nakuru, Kenya. Bull. Environ. Contamin. Toxicol. 19: 454.
60. Grizmeck, M and Grizmeck, B. (1960). Flamingo censuses in East Africa using aerial photography J. Wild. Man., 24: 215- 217.
61. Guynup, S. 2002. Mysterious Kenya Kenya amingo die-off s ed to toxins, study says. h p://news.na onalgeographic.com/news/2002/11/1107-021108-TV amingo.html.Last accessed 28 March 2004.
62. Harper, D. M., Philips, G., Cilvers, A., Kitaka, N. and Mavu , K.M. (1993). Eutrophica on prognosis for lake Naivasha, Kenya. Verh. Internat. Verein. Limnol. 15: 861-865.
63. Harper, D.M., R. B Childress, M.M. Harper, R, R. Boar, P. Hickley, S. C. Mills, N. O eno Escute-Gasulla. 2003. Aqua c biodiversity and saline lakes: Lake Bogoria Na onal Reserve, Ke: Hydrobiologia 500: 259-276.
64. Haven, K. E, Phillips, C.J., and Chichra, F. M. (1998). Light availability as a possible regulator of Cyanobacteria species in a shallow tropical lake. Freshwater biology, 39 (3): 547-556.
65. Hecky, R.E. and Kilham, P. (1973). Diatoms in alkaline saline lakes: Ecology and geo-chemical implica ons. Limnol. Oceanogr, 18: 53-57.
66. Hopcra , J. (1973). Conserva on problems at Lake Nakuru. Pp 49-52. In Kear, J and Duplaix Hall (Eds) Interna onal amingo symposium, Slimbridge, England. T & A Poyser, Berhanstead.
67. Howard, G 1994. East African amingo surveyed. IUCN Wetlands programmes Newle er, 10:5.997. 68. Howard, G. 1997. Biology of the Lesser Flamingo. In In: Conserva on of the Lesser Flamingo in Eastern
Africa and beyond. G. Howard (eds.), Nairobi Kenya: IUCN Lake Bogoria. Pp. 4-10.69. Integrated Structure Management Plan- (MCN)70. Irvine, K., 2002. Salt Lake survivors. Flamingos of the Makgadikgadi. Africa Birds& Birding 7(4): 24-30.71. Irvine, K., 2004. Breeding of Greater and Lesser Flamingos at Sua Pan, Botswana, 1998-2001. Ostrich
75(4): 236-242.72. IUCN 2006. 2006 IUCN Red List of Threatened Species: www.iucnredlist.org.73. IUCN-(the World Conserva on union) Flamingo Specialist Group-Bulle n No. 13, December 2005.74. Iwasa, M., Yamamoto, M., Tanaka, Y., Kaito, M., Adachi, Y. 2002 Spirulina associated hepatoxicity. Am. J.
Gastroenterol. 97: 3212-3213.75. Kairu, J.K (1996). Heavy metal residues in birds of Lake Nakuru, Kenya. African Journal of Ecology. 34: 397-
400. 76. Kaliner, G. and J. E. Cooper. 1973. Dual infec on of an African sh eagle with acid-fast bacilli and an
Aspergillus sp. Journal of wildlife Diseases 9: 51 – 55. 77. Karstad, L. and E. Boughton. 1975 Tuberculosis in Lesser Flamingo in Kenya. Journal of Wildlife Diseases
11: 32-26. 78. Karstad, L., Grootenhuis J. and Hopcra J.. 2004. Diseases of the Lesser Flamingo (Phoeniconaias minor)
of Lake Nakuru, Kenya 1973.in proceedings of the Transdisciplinary symposium in recent mass die-off s of Lesser amingos in Eastern and South Africa, Urbana. IL.
79. Katondo, J. M. and Mwasaga B. C., 1997. Status of Lesser amingos on Tanzania. In: Conserva on of the Lesser Flamingo in Eastern Africa and beyond. G. Howard (Eds), Nairobi, Kenya: IUCN Lake Bogoria. Pp.25-37.
80. Kenya Wildlife Service: Biodiversity Indicators for Na onal Use- (KWS/UNEP-WRMC) Project, 2005.81. Kenya Wildlife Service: Research and Ecological Monitoring Reports, 2000, - 2005.82. Kenya Wildlife Service: Lake Nakuru Na onal Park- Tourism Reports, 2003-2005).83. Kear, J. & Duplaix-Hall, N. 1975. Flamingos. T. & A.D. Poyser. England.84. Kock, N.D., Kock, R.A., Wambua, J., Kamau, G.J. and Mohan, K. (1999). Mycobacterium avium-related
epizoo c in free ranging lesser amingos in Kenya. J. Wildl. Disseases. 35: 297-300.

Tanzania Na onal Single Species Ac on Plan 2010-2020 for the Conserva on of the Lesser Flamingo (Phoeniconaias minor) 51
85. Koeman, J .H, Pennings, J.H., de Goeij, J.J.M., Tijioe, P.S. Olindo, P.M. and Hopcra , J. (1972). A preliminary survey of the possible contamina on of Lake Nakuru in Kenya with some metals and chlorinated hydrocarbon pes cides. J. App. Ecol. 9: 411-416.
86. Kilham, P. (1971) Biochemistry of African lakes and rivers. PhD Thesis, Duke University. 87. Kilhewe, E. (2009) Seasonal Varia ons In The Abundance Of Lesser Flamingos In Rela on To Some
Limnological Parameters In Lake Manyara Na onal Park, Tanzania, MSc Thesis, UDSM, Tanzania.88. Kock, N. D., R. A. Kock, J. Wambua, G. J. Kamau and K. Mohan.1999. Mycobacterium avium-related
epizoo c in free-ranging lesser amingos in Kenya. Journal of Wildlife Diseases 35 : 297-300. 89. Koeman, J. H., J. H. Pennings, J. J. De Goeij, P. S. Tijoe, P. M. Olindo and Hopcra . 1972. A preliminary survey
of the possible contamina on of Lake Nakuru in Kenya with some metals and chlorinated hydrocarbon pes cides. Journal of Applied Ecology 9: 411-416.
90. Kotut, K., Krienitz, L. and Ballot, A. 2006 Toxic cyanobacteria and their toxins in standing waters of Kenya: implica on on water resource use. J. Water Health 4: 233-245.
91. Koyo, A.O (2000). Con ict Management Strategies for Eff ec ve Wetlands Conserva on- A case study of Lake Nakuru Wetlands-Kenya- MSc Thesis, University of Wales
92. Krienitz, L., A. Ballot, K. Kotut, C. Wiegand, S. Putz, J. S. Metcalf, G. A. Codd and S. P ugmacher. 2003. Contribu on of hot spring cyanobacteria to the mysterious deaths of Lesser Flamingos at Lake Bagoria, Kenya. FEMS Microbiology Ecology 43: 141-148.
93. Krienitz, L., Ballot, A., Casper, P., Kotut, K., Wiegand, C., & P ugmacher, S. 2005 Cyanobacteria in hot springs of East Africa and their poten al toxicity. Alg. Studies 117: 297-306.
94. Krienitz, L., K. Kotut, Wiegand, C., and P ugmacher. S., 2005. Cyanobacteria and Cyanobacterial toxins in the alkaline crater lakes Sonachi and Simbi, Kenya. Harmful Algae 4: 139-150.
95. Lake Bogoria (Ramsar Conven on) - RIS, 2005).96. Lake Elementeita (Ramsar Conven on)- RIS, 200597. Lake Nakuru (Ramsar Conven on) RIS, 2005 98. Lake Nakuru Ecosystem Management Plan, 2002-2012. 99. Lake Nakuru Na onal Park- Tourism Department Report, 2005100. Lewis A. and Pomeroy D. 1989. A bird Atlas of Kenya. A.A. Balkema.Ro erdam. Netherlands.101. Linger, J.L., Zalkind, D. Brown, L.H. and Hopcra , J. (1981). Organochlorine residues in Kenya’s ri valley
lakes. J. App. Ecol. 18: 157-171. 102. Lugomela, C., Pratap, H. B. & Mgaya, Y.D. 2006 Cyanobacteria blooms- A possible cause of mass mortality
of Lesser Flamingos in Lake Manyara and Lake Big Momela, Tanzania. Harmful Algae 5: 534-541103. Linger, J. L., Zalkind, D., Brown, L. H. and Hopcra , J. (1981). Organochlorine residues in Kenyan Ri valley
lakes. J. Appl. Ecol. 18:157 – 171.104. Linnaeus, C. 1758. Systema Naturae, Ed. X105. Matsunaga, H., Harada, K.I., Sennma, M., Ito, Y., Yasuda, N., Ushida, S. & Kimura, Y. 1999 Possible cause
of unnatural mass death of wild birds in a pond in Nishinomiya, Japan: sudden appearance of toxic cyanobacteria. Nat. Toxins 7: 81-84.
106. Mavu , K. M (1983). Studies on the community structure, popula on dynamics and produc on of the limne c zooplankton of tropical lake, Lake Naivasha, Kenya. Ph.D Thesis, University of Nairobi.
107. McCulloch, G., A. Aebischer and K. Irvine. 2003. Satellite tracking of amingos in southern Africa: the importance of small wetlands for management and conserva on. Oryx 37: 480-483.
108. McCulloch, G.P. (in press). Flamingo research and conserva on at Sua Pan, Botswana. 12th Pan-African Ornithological Congress. Goudini Spa. Western Cape September 2008.
109. Mayr, G. 2004. Morphological evidence for sister group rela onship between amingo (Aves Phoenicopteridae) and grebes (Podicipedidae). Zoological Journal of the birds of the world based on DNA-DNA hybridiza on studies, Auk 105: 409-424.
110. McCall, C.J.H. (1957). Geology of the Nakuru-Thomson Falls-Lake Hannington Area. Geological Survey of Kenya, Report No. 78, Government Printer, Nairobi. pp 122.
111. Melack, J. M. (1976). Limnology and dynamics of phytoplankton in Equatorial African lakes. Ph.D. Thesis, Duke University
112. Melack, J. M. (1979). Temporal variability of phytoplankton in tropical lakes. Oecologia (Berlin). 44:1-7.113. Melack, J.M. (1981) Photosynthe c ac vity of phytoplankton in tropical African soda lakes. Hydrobiologia,
81 71-85.114. Meriluoto, J. (1997). Chromatography of microcys ns. Analy ca Chimica Acta. 352: 277-298.115. Metcalf, J. S., L. F. Morrison, L. Kreintz, A Ballot, E. Krause, K. Kotut, S. Putz, C. Weigand, S. P ugmacher

Tanzania Na onal Single Species Ac on Plan 2010-2020 for the Conserva on of the Lesser Flamingo (Phoeniconaias minor) 52
and G. A. Codd. 2004. Associa on of the cyanotoxins anatoxin-a and microcys ns with feathers of Lesser Flamingo from Kenya Lakes. In Sixth Interna onal Conference on Toxic Cyanobacteria: June 21-27, 2004, Bergen, Norway, pp. 21-22.
116. Metcalf, J.S., Morrison, L.F., Krienitz, L., Ballot, A., Krause, E., Kotut, K., Pütz, S., Wiegand, C., P ugmacher, S. & Codd, G.A., 2006. Analysis of the cyanotoxins anatoxin-a and microcys ns in Lesser Flamingo feathers. Toxicology and Environmental Chemistry 88: 159-167
117. Metcalf J.S., Morrison L.F., Krientz, L., BalloT, A., P ugmacher, S., Wiegand, C. and Kotut, K. (2003). Suscep bility of amingos to cyanobacterial toxins via feeding Veterinary Record 152: 722-3.
118. Milbrink, G (1977). On the limnology of two alkaline lakes (Nakuru and Naivasha) in the East African Ri Valley system in Kenya.
119. Mlingwa,Charles. & Baker, Neil. 2006. Lesser Flamingo Phoenicopterus minor counts in Tanzania soda lakes: implica ons for conserva on. In Boere,G.C., Galbraith, C.A. & Stroud, D.A. (eds). 2006. Waterbirds around the world. The Sta onary Offi ce, Edinburgh, UK 960 pp.
120. Motelin, G. K., R. Thampy and D. Koros. 2000. An ecotoxicological study of the poten al roles of metals, pes cides and algal toxins on the 1993/5 Lesser Flamingo mass die-off s in Lake Bogoria and Nakuru, Kenya; and the heath status of the same species of birds in the Ri Valley lakes during the 1990’s. In proceedings of the East African Environmental Forum, Nairobi, May 2000. Nairobi: East African Environmental Network: 11-12.
121. Mundkur, T. 1997. The Lesser Flamingo – a summary of its current distribu on and conserva on in Asia. In In: Conserva on of the Lesser Flamingo in East Africa and Beyond, G. Howard (eds) IUCN, Lake.Bogoria, Nairobi, Kenya. Pp. 62-72.
122. Municipal Council of Nakuru (MCN)- Nakuru Structural Strategic Plan 123. Musila, S, Wambugu, M. and Wami , W. (2007) Monitoring of Waterbirds in Kenya, July 2006 and January
2007. Research Reports of the Centre for Biodiversity, Na onal Museums of Kenya: Ornithology, 71124. Mwaura, F. (1992). Some aspects of hydrochemistry, lake level and vegeta on dynamics in the Lake
Elementeita basin, Kenya. M.Sc. Thesis, University of Nairobi.125. Mwaura, F., Koyo, A.O. & Zech, B. 2004 Cyanobacterial blooms and the presence of cyanotoxins in small
high al tude tropical headwater reservoirs in Kenya. J. Water Health 2: 49-57126. Naidu K. A., Sarada, R., Manoji, G., Khan, M. Y., Swany, M. M., Viswanatham, S., Murthy, K. N., Ravishanker,
G. A. and Srivanas, L. (1999). Toxicity assessment of phycocyanin-A blue colorant from blue green bacteria Spirulina platensis. Food Biotechnology 13(1):51-66.
127. Nasirwa, O. 1994. Kenya Wetlands Working Group. Kenya Birds 3:53-54, 128. Nasirwa, O. 1997. Status of Lesser Flamingos in Kenya. In In: conserva on of the Lesser Flamingo in
Eastern African and beyond,. G. Howard (eds.). IUCN Lake Bogoria, Nairobi, Kenya. Pp. 22-24. 129. Na onal Museums of Kenya – Centre for Biodiversity – Ornithology Research Reports, 13:1-16.130. Na onal Museums of Kenya - Biannual Waterbird Count reports, (1995-2007).131. Nelson. M., Thampy, R. J, Motellin, G. K., Raina, J. A., Disante, C. J and Lion L. W. (1998). Model for
trace metal exposure in lter feeding amingos at an alkaline ri valley lake, Kenya. Env. Tox. and Chem. 17(11):2302-2309.
132. Nelson, Y.M., Thampy, R.J, Motellin, G.K., Raini, J.A., et al (1998) Model for trace metal exposure in lter feeding amingos at an alkaline ri valley lake in Kenya. Env. Tox. and Chem., 17 (11): 2302-2309.
133. Niel Baker-Tanzania Bird Atlas Project-2004134. Nkako, .M. K., Lambreechts, C., Gachaja M., Woodley B. Maasai Mara Forest Status Report, 2005. 135. Norton, T 2003. Phoenicopteriformes (Flamingos). In Zoo and Wild Animal Medicine, 5th Edi on. M.E.
Fowler and R.E. Miller (eds.). Saunders, St. Louis.136. Ogilvie, M. & Ogilvie, C. 1989. Flamingos. Alan Su on, Gloucester, UK. 137. Ogutu, J., Bagine, R., and Kanga., E. (2007). Herbivore popula on dynamics in Lake Nakuru Na onal Park138. Onodera, H., Oshima, Y., Henriksen, P. and Yasumoto, T. (1997). Con rma on of anatoxin-a(S), in the
cyanobacterium Anabaena lemmermainii as the cause of bird kills in Danish lakes. Toxicon, 35(11): 1645-1648.
139. Oyugi, J. 1994 Lesser Flamingo hit by mystery disease. Kenya Birds 2(2): 5-6.140. Parada, J. L., de Caire, G. Z., de Mule M. C. Z. and de Cano M. M. S. (1997). Lac c acid bacteria growth
promoters from Spirulina platensis. Int. J. of Food Microbiol. 45(3): 225-228.141. Pennycuick, C.J. and Bartholomew, G. A. (1973). Energy budget of the lesser amingo (Phoeniconaias
minor). Eat Afri. Wildl. J., 11 (199- 207.142. Pessier, A., G. K. Motelin and T. Manyibe. 2004. Retrospec ve Histologic Studies of Lesser Flamingos.

Tanzania Na onal Single Species Ac on Plan 2010-2020 for the Conserva on of the Lesser Flamingo (Phoeniconaias minor) 53
In Proceeding of the Transdisciplinary Symposium on Recent Mass Die-off s of Lesser Flamingos (Phoeniconaias minor) in Eastern and Southern Africa, Urbana, IL.
143. Ramsar Conven on on Wetlands on Wetlands conserva on, 1971144. Rapala, J. and Sivonen, K. (1998). The assessment of environmental condi ons that favor hepatotoxic
and neurotoxic Anabaena spp strains cultured under light limita on at diff erent temperatures. Microbial Ecology. 36 (2): 181-191.
145. Ridley, M. W., Moss, B. C. and Lord Percy, R. C. (1955). The food of amingos in Kenya colony. J. East Afr. Nat. Hist. Soc. 22(5): 147-158.
146. Richardson, J.L. and Richardson, A. E. (1972) History of an African Ri Valley lake and its clima c implica ons. Eco. Monogr. 42: 499-534.
147. Ridley, M. W., et al (1955). The food of amingos in Kenya colony. J. East Afr. Natural Hist. Soc., 22 (5): 147-58.
148. Rose, P .M and D.A. Sco .1997. Waterfowl popula on es mates (second edi on) Wetlands Interna onal publica on no. 44, Wageningen.
149. Shivoga, W. A., Mucai, M., Kibichi, S., Odanga, J., Miller, S. N., Baldyga, T.J., Enanga, E.M., and Maina C,G., 2007. In uences of land use/cover on water quality in the upper and middle reaches of River Njoro, Kenya.
150. Sileo, L., Grootenhuise, J.G., Tuite, G.H. and Hopcra , H.D. (1979). Microbacteriosis in the lesser amingos of Lake Nakuru, Kenya. J. Wildl. Diseases. 15: 387-390.
151. Simmons, R.E 1996. Popula on declines, viable breeding areas and management op on for amingos in southern Africa. Conserva on biology 10: 504-514.
152. Simmons, R.E. (1997). The lesser amingo in Southern Africa. A summary. In, Conserva on of the lesser amingos in Eastern Africa and beyond. Proceedings of a workshop on Flamingos at Lake Bogoria, IUCN.
153. Simmons, R. 2000. Declines and movements of Lesser Flamingos in Africa. In: Baldassarre, GA., Arengo, F. & Bildstein (Eds.) Conserva on biology of amingos. Waterbirds 23 (Special Publica on 1): 40-46.
154. Simmons, R.E. & Versfeld, W. (in press). Southern African amingos are alreay feeling the eff ects of global climate change. 12th Pan-African Ornithological Congress. Goudini Spa, Western Cape, September 2008.
155. Sombroek, W. G; Baun, H.M.H and Pouw, B.J.A. v.d; 1982. Explanatory soil map and agro-climate zone map of Kenya, 1980 scale 1: 1,000,000. Ministry of Agriculture- Na onal Agriculture Laboratories- Kenya Soil Survey, Nairobi, 56p + maps pp.
156. Someren, G. R. C (1984). Museum Avifauna news, 31-32.157. Talling J. F. (1992). Environmental regula on in African shallow lakes and wetlands. Rev. Hydrobiol. Trop.,
25 (2) 67-144.158. Tiercellin, J. J., Vincens, A., Barton, C. E., Carbone, L. P., Casanova, J., Delibrias, G., Gasse, F., Grosalidier, E.,
Herbin, J. P., Huc, A, Y., Jardine, S., Le Faurnier, J., Melieres, F., Owen, R. B., Page, P., Palacios, C., Paquet, H., Penniguel, J. P., Pey Puquet, J. P., Raynaud, J. F., Renault, R. W., Reneville, P., Richert, J. P., Riff , R., Robert, P., Seyve, C., Vandenbroucke, M. and Vidal G. (1987). The Baringo-Bogoria Half Graben: 30 000 years of hydrological and sedimentary history. Soc. Nat. Elf Aquntane, Pau 291pp.
159. Thornton J. A. (1986). Nutrients in African lakes ecosystems. Do we know all? J. Limnol. Soc. Sth. Afr., 12 (1/12): 6-21.
160. Tuite, C.H. (1978). The lesser amingo (Phoeniconaias minor): Aspects of its ecology and behavior in the eastern Ri Valley and northern Tanzania. Ph.D Thesis, University of Bristol.
161. Tuite, C.H Popula on distribu on and biomass density of the Lesser Flamingo in Eastern Ri Valleys 1974-76. Journal of Applied Ecology 16:765-775.
162. Tuite, C.H 2000. The distribu on and density of Lesser Flamingos in East Africa in Rela on to food availability and produc vity. Waterbirds 23 (Special Publica on 1): 52-63.
163. Tuite, E.H. (1979). Popula on size, distribu on and biomass density of the lesser amingo in Eastern Ri Valley. J. App. Ecol.,: 16: 765-775.
164. Tuite, C.H. (1981). Standing crop densi es and distribu on of Spirulina and benthic diatoms in East African alkaline lakes. Freshwater Biology, 11: 345-360.
165. Tuite, C.H. 1974. Flamingo Ecology: 1974 Annual Research Report Baharini Wildlife Sanctuary. Pp. 23. 1979. Popula on distribu on and biomass density of the Lesser Flamingo in Eastern Ri Valleys 1974-76. Journal of Applied Ecology 16:765-775.
166. Underhill, L. G., A. J. Tree, H.D. Oschadleus and V. Parker. 1999. Review of ring recoveries of Waterbirds in southern Africa, Avian Demography Unit, University of Cape Town.
167. UNEP. 2007. Literature Review on Lesser Flamingo Mortality in the Kenyan Ri Valley Lakes. Unpublished
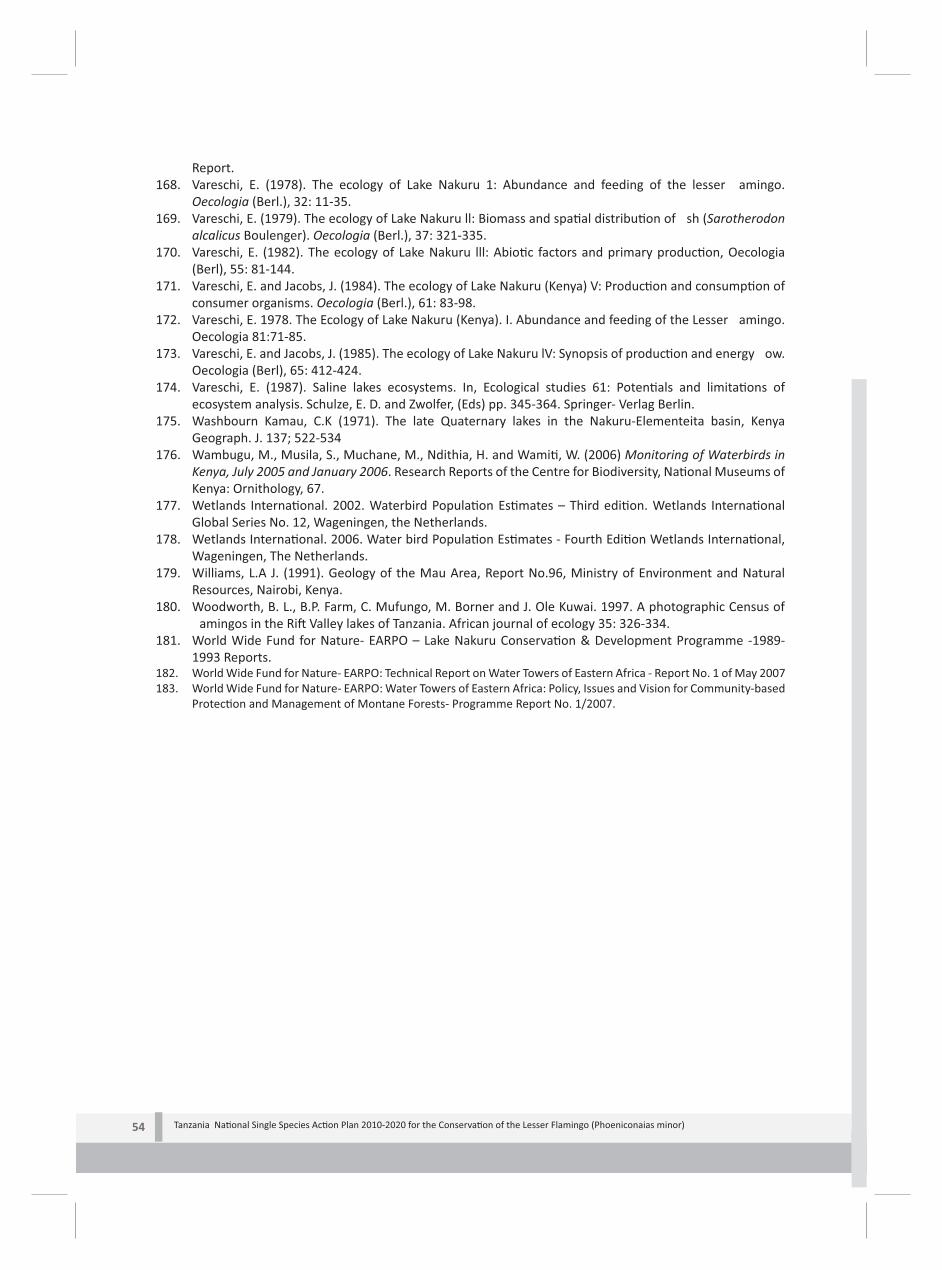
Tanzania Na onal Single Species Ac on Plan 2010-2020 for the Conserva on of the Lesser Flamingo (Phoeniconaias minor) 54
Report.168. Vareschi, E. (1978). The ecology of Lake Nakuru 1: Abundance and feeding of the lesser amingo.
Oecologia (Berl.), 32: 11-35.169. Vareschi, E. (1979). The ecology of Lake Nakuru ll: Biomass and spa al distribu on of sh (Sarotherodon
alcalicus Boulenger). Oecologia (Berl.), 37: 321-335.170. Vareschi, E. (1982). The ecology of Lake Nakuru lll: Abio c factors and primary produc on, Oecologia
(Berl), 55: 81-144.171. Vareschi, E. and Jacobs, J. (1984). The ecology of Lake Nakuru (Kenya) V: Produc on and consump on of
consumer organisms. Oecologia (Berl.), 61: 83-98.172. Vareschi, E. 1978. The Ecology of Lake Nakuru (Kenya). I. Abundance and feeding of the Lesser amingo.
Oecologia 81:71-85.173. Vareschi, E. and Jacobs, J. (1985). The ecology of Lake Nakuru lV: Synopsis of produc on and energy ow.
Oecologia (Berl), 65: 412-424.174. Vareschi, E. (1987). Saline lakes ecosystems. In, Ecological studies 61: Poten als and limita ons of
ecosystem analysis. Schulze, E. D. and Zwolfer, (Eds) pp. 345-364. Springer- Verlag Berlin.175. Washbourn Kamau, C.K (1971). The late Quaternary lakes in the Nakuru-Elementeita basin, Kenya
Geograph. J. 137; 522-534176. Wambugu, M., Musila, S., Muchane, M., Ndithia, H. and Wami , W. (2006) Monitoring of Waterbirds in
Kenya, July 2005 and January 2006. Research Reports of the Centre for Biodiversity, Na onal Museums of Kenya: Ornithology, 67.
177. Wetlands Interna onal. 2002. Waterbird Popula on Es mates – Third edi on. Wetlands Interna onal Global Series No. 12, Wageningen, the Netherlands.
178. Wetlands Interna onal. 2006. Water bird Popula on Es mates - Fourth Edi on Wetlands Interna onal, Wageningen, The Netherlands.
179. Williams, L.A J. (1991). Geology of the Mau Area, Report No.96, Ministry of Environment and Natural Resources, Nairobi, Kenya.
180. Woodworth, B. L., B.P. Farm, C. Mufungo, M. Borner and J. Ole Kuwai. 1997. A photographic Census of amingos in the Ri Valley lakes of Tanzania. African journal of ecology 35: 326-334.
181. World Wide Fund for Nature- EARPO – Lake Nakuru Conserva on & Development Programme -1989-1993 Reports.
182. World Wide Fund for Nature- EARPO: Technical Report on Water Towers of Eastern Africa - Report No. 1 of May 2007183. World Wide Fund for Nature- EARPO: Water Towers of Eastern Africa: Policy, Issues and Vision for Community-based
Protec on and Management of Montane Forests- Programme Report No. 1/2007.
Tanzania Na onal Single Species Ac on Plan 2010-2020 for the Conserva on of the Lesser Flamingo (Phoeniconaias minor) 55
Tanzania Na onal Single Species Ac on Plan 2010-2020 for the Conserva on of the Lesser Flamingo (Phoeniconaias minor)
Figure 1: Map of the Key Lesser Flamingo Alkaline Soda Lakes in the East Africa Ri Valley.
Figure 2: Distribu on of Lesser Flamingo in Tanzania and Sites which meet Ramsar Criteria.
Figure 3: Trends in Lesser Flamingo Numbers in Kenya: 1992-2007.
Figure 4: Migratory Movements of Individual Lesser Flamingo Marked at Bogoria and Satellite Tracked.
Figure 5: Seasonal Trends in Lesser Flamingo Numbers in Lake Manyara, Tanzania.
Figure 6: Threats to Survival During Lesser Flamingo Life Cycle in Eastern Africa.
FIGURES

Tanzania Na onal Single Species Ac on Plan 2010-2020 for the Conserva on of the Lesser Flamingo (Phoeniconaias minor) 56
Figure 1:Map of the Key Lesser Flamingo Alkaline Soda Lakes in the East Africa Ri Valley
Fig 1. the study range showing loca ons of lakes which were censused
Figure 2: Distribu on of Lesser Flamingo In Tanzania and Sites which meet Ramsar Criteria
(Source: Tanzania Bird Atlas, 2009)

Tanzania Na onal Single Species Ac on Plan 2010-2020 for the Conserva on of the Lesser Flamingo (Phoeniconaias minor) 57
Figure 3: Trend in Lesser Flamingo Numbers in Kenya (1992 to 2007).
(Source: Waterbird Census Reports, es mated using counts in the months of January).

Tanzania Na onal Single Species Ac on Plan 2010-2020 for the Conserva on of the Lesser Flamingo (Phoeniconaias minor) 58
Figure 4:
Migratory Movements of Individual Lesser Flamingos, Marked at L. Bogoria and Satellite Tracked for 9 Months (October 2002 and July 2003).
(Source: Childress et al, 2004)
SAFARI IMARA
BAHATI SAFARI: During the nine-month study, Safari made 16 inter-lake ights, visited ve diff erent lakes, spending a mean 16 days at each stop and travelling 1,866 km.
BAHATI: During nine months, Baha made 12 inter-lake ights, visited six diff erent lakes and wetlands, spent an
average 20.9 days at each stop, and travelled a total of 1,917 km.
IMARA: During the rst 101 days, Imara travelled 4,792km, moving among nine diff erent lakes 44 mes. Spent an average at each lake of only 2.3 days. Following this ini al period of frene c ac vity, Imara seemed to se le and spend much longer periods each stop. During the remaining 171 days, travelled 1,307km moving among six diff erent sites 15 mes, spending an average 11.4 days. Overall, he visited 11 diff erent lakes and wetlands, many several mes, extending from Lake Baringo in Kenya and Lake Eyasi in Tanzania (a distance of 500km). In total, the inter-lake ights covered 6 099 km.

Tanzania Na onal Single Species Ac on Plan 2010-2020 for the Conserva on of the Lesser Flamingo (Phoeniconaias minor) 59
Figure 5:
Seasonal Trends in Lesser Flamingo Numbers in Lake Manyara, Tanzania(Source: Kihwele, 2009)

Tanzania Na onal Single Species Ac on Plan 2010-2020 for the Conserva on of the Lesser Flamingo (Phoeniconaias minor) 60
Figure 6:
Threats to Survival During Lesser Flamingo Life Cycle in E. Africa/Natron(Disneynature, 2008)
SELF
-PRO
VISI
ONIN
G
EAC LAKE PRODUCTIVITY
(EXCLUDING NATRON)
ADULT POPULATION 2.5M
Total annual adult mortality
=100,000 given a 25yr
generation length
ADULT
MORTALITY
MATURITY
IMMATURE
STATES
ANNUAL
FLEDGLINGS
210,000
Total annual mortality of
developmental stages
= 80 percent eggs laid
ANNUAL
DEVELOPMENTAL
STAGE MORTALITY
400,000
NATRON PRIMARY
PRODUCTIVITY
NATRON WATER-LEVEL
AND SALINITY NATRON
PREDATION
AND
DISTURBANCE
Natron Factors:
Natural Climatic
Human Influenced:Global WormingPollutionAbstractionIrrigationOvergrazingIndustrial Development
Imminent Plans:Soda Mining affectingLake water Levels andsalinity
East African
Community Factors:
Natural Climatic
Human Influenced:Global WormingPollutionAbstractionIrrigationOvergrazingIndustrial Development
ANNUAL
HATCHLINGS
425,000
ANNUAL EGGS
500,000
PARENTAL PROVISIONING
EAC FACTORS
(EXCLUDING NATRON)
DEVELOPMENT
DISPERSAL
PARE
NTA
L PR
OVIS
ION
ING
COURTSHIP
NEST BUILDING
INCUBATION
LESSER FLAMINGO SURVIVAL IN EAST AFRICA- A DELICATE EQUILIBRIUMFigure based on assumptions of Root & Brown 1971 with modifications

Tanzania Na onal Single Species Ac on Plan 2010-2020 for the Conserva on of the Lesser Flamingo (Phoeniconaias minor) 61
TABLES
Tanzania Na onal Single Species Ac on Plan 2010-2020 for the Conserva on of theLesser Flamingo (Phoeniconaias minor)
Table 1: Non-breeding Lesser Flamingo Regional Sub-Popula on Es mates (2003 to 2007).Table 2: Numbers of Lesser Flamingos in Ri valley Lakes (1969 to 1976).
sE tnuoC etisopmoC :3 elbaT mates of Lesser Flamingo in Major Sites in Tanzania (1960’s to-date).
Table 4: Popula on Es mates of Lesser Flamingo in Major Sites in Kenya (1950s to date).Table 5: Lesser Flamingo Breeding Observa ons, Global (1954 to 1989).Table 6: Breeding Observa ons of Lesser Flamingo at Lake Natron (1991).Table 7: Threat Importance Ranking for Lesser Flamingo in Tanzania Water Bodies. Table 8: Interna onal Conven ons/Agreements of Relevance to Lesser Flamingo, Ra ed by
Tanzania.Table 9: Na onal Laws and Policies Aff ec ng the Conserva on of Lesser Flamingo in Tanzania.Table 10: Stakeholder Impacts (posi ve or nega ve) on Lesser Flamingo and their Habitats in
Tanzania. Table 11: Exis ng Projects Relevant to Lesser Flamingo Conserva on.Table 12: Risks and Opportuni es for the Conserva on of Lesser Flamingo in Tanzania.Table 13: Logical Framework of Kenya’s Vision, Aim and Objec ves for Lesser Flamingo SSAP.Table 14: Proposed Framework for Lake Natron Integrated Management Plan.Table 15: Logical Framework of Tanzania’s Medium-Term SSAP for Lesser Flamingo: 2010-2015. Table 16: Proposed Monitoring and Evalua on Table for Lesser Flamingo SSAP.

Tanzania Na onal Single Species Ac on Plan 2010-2020 for the Conserva on of the Lesser Flamingo (Phoeniconaias minor) 62
Table 1: A Composite of Counts of Non-breeding Lesser Flamingo
From Regional Sub-popula on Es mates (2003-2007)
(Source: Modi ed from AEWA/CMS, 2005 SSAP Lesser Flamingo)
Sub-popula on By Region
Lowest NumberCount
Highest NumberCount
1. East Africa Region:
000,42 072,3aipoihtE
005,254,1 026,97 ayneK
512,336 033,945 * ainaznaT
097,26 54adnagU
Total E. Africa Popula 505,271,2562,238no
9.979.59%
2. West Africa Region:
0003152111aeniuG
0002061uassiB-aeniuG
0084061ainatiruaM
063451lageneS
Total W. Africa Popula 0614206411no
9.03.1%
:noigeR acirfA htuoS .3
01402anawstoB
599550745aibimaN
055555971acirfA htuoS
Total S. Africa Popula 5591115827no
1.48.0%
4. India Region:
06311454071aidnI
Total India Popula 06311454071no
1.510.2%
089 917 2550 868:latoT labolG
*Tanzania es mates are higher and recent data is presented in Table 3.

Tanzania Na onal Single Species Ac on Plan 2010-2020 for the Conserva on of the Lesser Flamingo (Phoeniconaias minor) 63
Table 2a. Numbers of flamingoes on Rift Valley Lakes 1974-76 with comparative
Figures for march 1969
Table 2b. Total numbers of lesser flamingoes in Kenya and northern Tanzania Rift Valley

Tanzania Na onal Single Species Ac on Plan 2010-2020 for the Conserva on of the Lesser Flamingo (Phoeniconaias minor) 64
Table 3:Composite Counts Showing Extreme Es mates of Lesser Flamingo in Major Sites in
Tanzania: (1960- to-date)
cetorPetiS on status Highest Number
Count
Lowest Number
CountLake Natron (154 000 ha)
Both a Ramsar site and IBA. IMP under prepara on. On way to become a WMA, under 2 districts. Is the only breeding site of the E Africa sub-popula on.
1 080 000(Wa s 1991)
5 000(AEWA
Jan 2010)
Lake Manyara(413 000 ha)
This lake, 1/3 is unprotected, 2/3 is within Manyara NP, and a Biosphere Reserve. Considered a poten al Ramsar site and is an IBA.
1 900 000(1995)
0(AEWA
Nov 2009)
Lake Eyasi (116 000 ha)
Unprotected. Its north-western shoreline borders the Ngorongoro Conserva on Area (NCA). It is being considered as a Ramsar site and is an IBA.
700 000 Unknown
Lake Magadi (Makat)(2000 ha)
Fully protected within the NCA. It is a designated IBA.
1 200 000 0Lake Empakai(1500 ha)
As above. A seasonally vital feeding area for Lake Natron breeding. Key feeding site end of the dry season when water in other lakes are at their lowest.
Momella Lakes (1000 ha) Protected inside Arusha NP. 50% of NE shoreline of Big Momella is unprotected. It is a designated IBA.
220 000 2 000
Lake Ndutu (Lagarja)(1000 ha)
Is protected in Serenge NP and NCA. It is a designated IBA.
150 000 0
Lake Burungi (4000 ha) Falls outside Tarangiri NP. Within Burunge WMA. It is a designated IBA. Freshwater.
34 000 0
Singida Lakes (1100 ha) Unprotected. It is a designated IBA. Includes Kindai and Singidani lakes.
55 000 0
Lake Engaruka (400 ha) Unprotected. It is a designated IBA. 3 400 0
Lake Kitangiri Unprotected. It is a designated IBA. 357 000 Unknown
Bahi Swamps Unprotected. Quali es, but not yet a designated IBA.
20 000 0
Lake Balangida Lelu (13 000 ha)
Unprotected. It is a designated IBA. 23 100 2 000
Lake Rukwa (600 000 ha)
Largely unprotected. A por on is in Rukwa-Lukwa Game Reserve. It is a designated IBA.
1000’s 0(PM Obs
2010)Lake Lukuuga Unprotected. Young birds have been noted. 290 0
Saadani Salt Works (1000 ha)
Unprotected. Man-made wetlands. 2 500 0
Lake Tlawi (5 ha)
Unprotected. Birds migrate in season. 5 -10 000 0
Lake Baba (1000 ha)
Unprotected. Within Baba township. Freshwater. LF seen in dry season.
100’s 0
00001.detcetorpnU)ah 001( otusaB ekaL*Lakes with over 20 000 birds are considered key, priority sites.
**Sampling methods vary and this can give rise to the varia ons in ranges above.(Source: Modi ed by workshop, from Baker and Baker, 2002 and Mlingwa and Baker, 2006)

Tanzania Na onal Single Species Ac on Plan 2010-2020 for the Conserva on of the Lesser Flamingo (Phoeniconaias minor) 65
Table 4:Composite Count Showing Extreme Es mates of Lesser Flamingo in Major
Sites in Kenya (1950s’ to date)
Site Protec on status Max number Min number
Lake Nakuru This lake is protected within the Lake Nakuru Na onal Park. It is designated both as a Ramsar site and IBA.
1 893 500 1 135
Lake Sonachi This small lake is unprotected, but enclosed within privately owned land. It is within Lake Naivasha Ramsar site and IBA boundaries.
2 750 20
Lake Bogoria This lake is protected within Lake Bogoria Na onal Reserve. It is designated both as a Ramsar site and IBA. A empted breeding has been recorded in 1979/80.
1 350 695 14,645
Lake Elementeita This lake is unprotected with a large area of its shore adjacent to privately owned land and the rest to community land. It is a designated Ramsar site.
588 375 710
Lake Logipi Unprotected. Breeding of 1 million pairs was recorded in 1978.
500 000 - 2 000 000
?
Lake Oloidien It is unprotected with a small part of shoreline adjacent to public land, while the rest to private land. Enclosed within Lake Naivasha Ramsar site and IBA boundaries.
350 535 5
Lake Magadi Is unprotected and privately owned. It is a designated IBA. Known to have breed here in 1962, over 1 million pairs, and 1978.
40 000 – 2 000 000
2 120
1568 6.detcetorpnU ialoS ekaL
Lake Turkana Largely unprotected, with a small area inside the Sibiloi Na onal park. It is a designated IBA. Reported to have breed here once in 1957, 30-40 000 pairs.
5 000 - 80 000
5 000
Sabaki River mouth
Unprotected. It is a designated IBA. 2 600 15
*The signi cance of this is that these are the same ock shared with Tanzania, as they cover an extended range.
Source: Na onal Museums of Kenya, Ornithology Sec on: Waterbird Census reports and Kenya LF SSAP (2008).

Tanzania Na onal Single Species Ac on Plan 2010-2020 for the Conserva on of the Lesser Flamingo (Phoeniconaias minor) 66
Table 5: Lesser Flamingo Breeding Observa ons, Global: 1954-89.
(Source: Kobb, 2000)Year Month Region Site Pairs Breeding Source Comment1954 6-8 Tanzania Natron 100,000-150,000 B 19551955 2 Zambia Mweru/Wan pa 630 H Dick Brown Probably destroyed by rising water
1791 R&B0nortaNainaznaT55911956 3 Tanzania Natron 30,000-40,000 B&R 19711957 6 Kenya Turkana 30,000 B&R 1971 Unclear if successful1957 10-12 Tanzania Natron 570,000 B&R 1971
detnuoc ton ,seinoloc egral yreV1791 R&B?nortaNainaznaT21-01 85911959 2 Tanzania Natron 26,000-32,000 B&R 1971 Successful?1959 11-12 Tanzania Natron 15,000 B&R 1971 +/- 200,000 drop eggs on mud at1960 11-12 Tanzania Natron 300,000 B&R 1971 Con nued to Jan 1961
niar yvaeh ,gnideerb oN1791 R&B0nortaNainaznaT16911962 7-10 Kenya Magadi 1,100,000 B&R 1971 First breeding at Magadi in Century
level retaw hgih ,gnideerb oN1791 R&B0nortaNainaznaT3-2691gniyal on tub edam stseN1791 R&B0idagaMayneK3691
ooT1791 R&B0nortaNainaznaT4691 ooded tub gnideerb oN1791 R&B0idagaMayneK4691 ying young seen
1965 7 Mauritania A out 800-900 Nauroius 1969 elacs llams no gnideerB1791 R&BsNnortaNainaznaT11-01 5691elacs llams no gnideerB1791 R&BsNnortaNainaznaT11-01 6691elacs llams no gnideerB1791 R&BsNnortaNainaznaT11-01 7691
1971 5-8 Namibia Etosha 54000 Berry 19721973 12 India Kutch 1,000-2,500 1974 2-4 Namibia Etosha 6800 Kahl 1975
ecalp sekat gnideerBrenruT .D?nortaNainaznaT77911978 6 Botswana Sua Pan =
Makgadikgadi787 R & J 1979 Unknown outcome
1978 Kenya Logopi 1,000,000 D. Turner1978 Kenya Magadi +1,000 D. Turner
ArenruT .D?airogoBayneK9791 empts unsuccessfulerefretni sniar yvaeHrenruT .D0airogoBayneK0891
tnuoc on tub sseccus egraLrenruT .DsNnortaNainaznaT6-4 4891gnideerb oNrenruT .D0nortaNainaznaT9891
Summary of Breeding Observa ons:Total Observa ons Observa ons % of Total
Total Observa ons 31Unsuccessful Breeding 8 26%Successful Breeding 23 74%
Successful Breeding Observa ons % of successes
Pairs Observed % of Birds
Natron (Tanzania) 13 56.5% 1,073,000 32.8%Magadi (Kenya) 2 8.7% 1,101,000 33.7%Etosha (Namibia) 2 8.7% 60,800 1.9%Turkana (Kenya) 1 4.3% 30,000 0.9%Sua Pan (Botswana) 1 4.3% 787 <0.01%Mweru Wan pa (Zambia) 1 4.3% 630 <0.01%Logopi (Kenya) 1 4.3% 1,000,000 30.6%
%10.0< 052,1 %3.41)aidnI( hctuKA out (Mauritania) 1 4.3% 850 <0.01%
713,862,3 32 latoT

Tanz
ania
Na
ona
l Sin
gle
Spec
ies A
c o
n Pl
an 2
010-
2020
for t
he C
onse
rva
on
of th
e Le
sser
Fla
min
go (P
hoen
icon
aias
min
or)
67
Tabl
e 6:
Bree
ding
Obs
erva
on
of L
esse
r Fla
min
go a
t Lak
e N
atro
n: 1
991
(Sou
rce:
Wat
son’
s 199
1 de
taile
d da
ta in
Kob
b 19
99) (
loca
on
by %
s)La
goon
Nam
eAd
ults
%Ch
icks
%N
ests
%Ab
ando
ned
Nes
ts%
Isol
ated
N
ests
%U
nocc
upie
d N
ests
%N
ests
in
Strin
gs%
Nes
ts in
Pr
ep in
St
rings
%
Lose
de
375
0.0%
0.0%
0.0%
0.0%
0.0%
0.0%
0.0%
0.0%
Nor
thw
est
400.
0%0.
0%0.
0%-
0.0%
0.0%
0.0%
0.0%
0.0%
N. H
umbu
5,11
50.
5%0.
0%0.
0%66
1,85
010
0.0%
0.0%
0.0%
0.0%
0.0%
Peni
nj10
,184
0.9%
4,33
02.
5%0.
0%0.
0%38
08.
2%0.
0%0.
0%0.
0%S.
Hum
bu4,
523
0.4%
0.0%
0.0%
0.0%
0.0%
0.0%
0.0%
0.0%
Wes
t12
,363
1.1%
0.0%
0.0%
0.0%
711.
5%0.
0%0.
0%0.
0%So
uthe
rn86
8,42
180
.4%
140,
163
81.8
%25
2,34
810
0.0%
0.0%
3,84
182
.7%
48,2
5296
.6%
108,
543
100.
0%49
,500
100.
0%U
n-na
med
0.0%
0.0%
0.0%
0.0%
0.0%
0.0%
0.0%
0.0%
Un-
nam
ed0.
0%0.
0%0.
0%0.
0%0.
0%0.
0%0.
0%0.
0%U
n-na
med
0.0%
0.0%
0.0%
0.0%
0.0%
0.0%
0.0%
0.0%
Un-
nam
ed0.
0%0.
0%0.
0%0.
0%0.
0%0.
0%0.
0%0.
0%Ge
lai
5,52
90.
5%0.
0%0.
0%0.
0%0.
0%0.
0%0.
0%0.
0%Ea
st10
,655
1.0%
218
0.1%
0.0%
0.0%
0.0%
0.0%
0.0%
0.0%
Unn
amed
0.0%
0.0%
0.0%
0.0%
0.0%
0.0%
0.0%
0.0%
Nor
th E
ast
3,28
80.
3%0.
0%0.
0%0.
0%0.
0%0.
0%0.
0%0.
0%U
n-na
med
0.0%
0.0%
0.0%
0.0%
0.0%
0.0%
0.0%
0.0%
Muk
oyo
53,5
655.
0%26
,629
15.5
%0.
0%0.
0%35
07.
5%0.
0%0.
0%0.
0%U
n-na
med
0.0%
0.0%
0.0%
0.0%
0.0%
0.0%
0.0%
0.0%
Un-
nam
ed1,
816
0.2%
0.0%
0.0%
0.0%
0.0%
0.0%
0.0%
0.0%
Un-
nam
ed0.
0%0.
0%0.
0%0.
0%0.
0%0.
0%0.
0%0.
0%E.
Ngi
ro10
4,76
59.
7%0.
0%0.
0%0.
0%0.
0%1,
680
3.4%
0.0%
0.0%
Unn
amed
0.0%
0.0%
0.0%
0.0%
0.0%
0.0%
0.0%
0.0%
Tota
ls DK
1,08
0,63
910
0.0%
171,
340
100.
0%25
2,34
810
0.0%
661,
850
100.
0%4,
642
100.
0%49
,932
100.
0%10
8,54
310
0.0%
49,5
0010
0.0%
Tota
ls W
1,08
0,57
917
1,34
025
2,34
866
1,85
04,
631
49,9
3210
8,54
349
,500
Tota
ls DK
= o
ur to
tals,
tota
ls by
W =
thos
e by
the
orig
inal
aut
hor (
Wat
son)

Tanzania Na onal Single Species Ac on Plan 2010-2020 for the Conserva on of the Lesser Flamingo (Phoeniconaias minor) 68
Table 7:Problem Tree, Threat Importance Ranking For
Lesser Flamingo in Tanzanian Key Water Bodies (Based on AEWA Matrix).
Specieslevel
import-ance
Primarythreat Sub-threat Sub-threat Sub-threat Sub-threat Sub-threat
Buru
ngi
Bala
ngid
a La
lu
Bahi
Empa
kai
Eyas
i
Ndu
tu/L
agar
ja
Nat
ron
Mom
ella
Man
yara
Mag
adi (
NCA
)Ru
kwa
Lake
Sing
ida
Lake
Tanz
ania
Gen
)
1Habitat loss and/or Degrada on
Altered hydro-logy and/or water quality
Reduced water ow
Inappropriate catchment management
Water management
Drainage for agricultural land 44
Drainage for roads, buildings & infrastructure
4
Reservoir crea onDams in catchment ?kCanaliza on of rivers ?kDiversion of rivers ?kAbstrac on for human use 3?Abstrac on for irriga on 3 3 3 3 3 3
Reduced runoff Reforesta on
Increased ooding and
sedimenta on
Deforesta on & bush res 5 3 3 5 3 3 3 3 5 ? 4
Over-grazing 3 2 4 2 2 4 3 3 3Arable farming on steep slopes 3 4 4 3 4 4
Increased drought
Climate change 3 3 3 4 3 3 2 3 2 3 3 3
Wetland Pollu on
Fer lizer & Pes cides ? 4 3 4 4 2 4 ? 4Industrial chemicals 5
Sewage ? ? 4 4
Heavy metals
Oil
Extrac on Salt / minerals ? 1? 5 3? 1?Oil & gas
Expansion of macrophytes Fer lizers 5 5 4 5?Con ict with other conserva onRoads, buildings, other infrastructure
3 3
Invasive plants (eg. Typha) 5

Tanzania Na onal Single Species Ac on Plan 2010-2020 for the Conserva on of the Lesser Flamingo (Phoeniconaias minor) 69
Specieslevel
import-ance
Primarythreat Sub-threat Sub-threat Sub-threat Sub-threat Sub-threat
Buru
ngi
Bala
ngid
a La
lu
Bahi
Empa
kai
Eyas
i
Ndu
tu/L
agar
ja
Nat
ron
Mom
ella
Man
yara
Mag
adi (
NCA
)Ru
kwa
Lake
Sing
ida
Lake
Tanz
ania
Gen
)
Specieslevel
import-ance
Primarythreat Sub-threat Sub-threat Sub-threat Sub-threat Sub-threat
Buru
ngi
Bala
ngid
a La
lu
Bahi
Empa
kai
Eyas
i
Ndu
tu/L
agar
ja
Nat
ron
Mom
ella
Man
yara
Mag
adi (
NCA
)Ru
kwa
Lake
Sing
ida
Lake
Tanz
ania
(Gen
)
2 Disrup on of Nes ng Colonies
Human Fishermen
Salt workerNearby se lementsMilitary exercisesHun ng other species
PastoralistsLow- ying aircra
Tourists 5Film crews 5
Photographers ?Predators Terrestrial 4
Avian 3 42 Toxicological
DiseasesHeavy metals
Agro-chemicals 4 5 3 3 4 1 3Domes c waste 4 5 5 5 5 4 5 5Industry chemicals
BotulismCyanobacterial toxins
Fer lizer eutrophica on
Climate Change 5 5 5 4 ? ? 5
2 Infec ous Diseases
Avian in uenza
Avian cholera ?Avian tuberculosis
Salmonella
Pseudomonas
5 Harves ng Illegal hun ng Subsistence
Wild bird trade Zoo/Tourism 5 5 5 5 5 5 5 5 5 5Egg harves ng Human Food
5 Human Disturbance at Non-Breeding Sites
Boa ng 5Fishing 5 5 5 5 4 4Hun ng other sps 4Tourists 5 4Planes/ Helicopters 4Birdwatchers 4Photographers 4Military exercises
5 Preda on Baboons 5 5 5 5Birds of prey 5 3 5 5 5 Marabou Storks 4 2 ? 4 4 Hyenas/Jackals 5 5 5 5 5Feral dogs ?
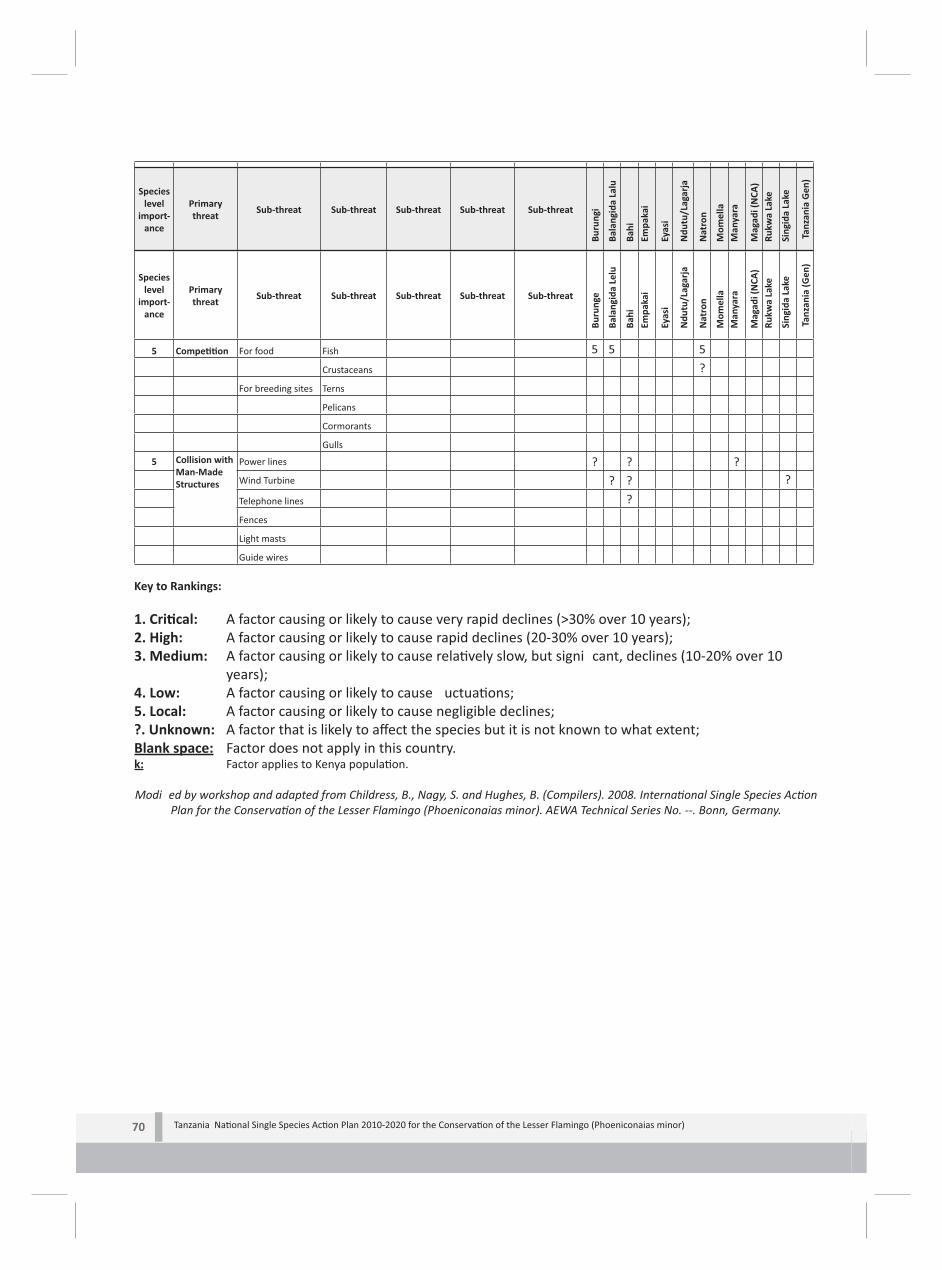
Tanzania Na onal Single Species Ac on Plan 2010-2020 for the Conserva on of the Lesser Flamingo (Phoeniconaias minor) 70
Specieslevel
import-ance
Primarythreat Sub-threat Sub-threat Sub-threat Sub-threat Sub-threat
Buru
ngi
Bala
ngid
a La
lu
Bahi
Empa
kai
Eyas
i
Ndu
tu/L
agar
ja
Nat
ron
Mom
ella
Man
yara
Mag
adi (
NCA
)Ru
kwa
Lake
Sing
ida
Lake
Tanz
ania
Gen
)
Specieslevel
import-ance
Primarythreat Sub-threat Sub-threat Sub-threat Sub-threat Sub-threat
Buru
nge
Bala
ngid
a Le
lu
Bahi
Empa
kai
Eyas
i
Ndu
tu/L
agar
ja
Nat
ron
Mom
ella
Man
yara
Mag
adi (
NCA
)Ru
kwa
Lake
Sing
ida
Lake
Tanz
ania
(Gen
)
5 Compe on For food Fish 5 5 5Crustaceans ?
For breeding sites Terns
Pelicans
Cormorants
Gulls
5 Collision with Man-Made Structures
Power lines ? ? ?Wind Turbine ? ? ?
Telephone lines ?Fences
Light masts
Guide wires
:sgniknaR ot yeK
1. Cri cal: A factor causing or likely to cause very rapid declines (>30% over 10 years);2. High: A factor causing or likely to cause rapid declines (20-30% over 10 years);3. Medium: A factor causing or likely to cause rela vely slow, but signi cant, declines (10-20% over 10
years);4. Low: A factor causing or likely to cause uctua ons;5. Local: A factor causing or likely to cause negligible declines;?. Unknown: A factor that is likely to aff ect the species but it is not known to what extent;Blank space: Factor does not apply in this country.k: Factor applies to Kenya popula on.
Modi ed by workshop and adapted from Childress, B., Nagy, S. and Hughes, B. (Compilers). 2008. Interna onal Single Species Ac on Plan for the Conserva on of the Lesser Flamingo (Phoeniconaias minor). AEWA Technical Series No. --. Bonn, Germany.

Tanzania Na onal Single Species Ac on Plan 2010-2020 for the Conserva on of the Lesser Flamingo (Phoeniconaias minor) 71
Table 8: Examples of Major Interna onal Conven ons and Agreements
of Relevance to the Lesser Flamingo, and Ra ed by TanzaniaConven on/ Agreement
Lis ng of Lesser Flamingo, its sites
or habitat
Obliga ons (with Relevance to Lesser Flamingo)
Focal point/ Responsible ins tu on
Conven on on the conserva on of Migratory Species of Wild Animals (CMS)(Bonn Conven on)
Appendix II For migratory species that have an unfavourable conserva on status or would bene t signi cantly from interna onal co-opera on. The Conven on encourages the Range States to global or regional sign agreements for the conserva on and management of individual species or, more o en, of a group of species listed on Appendix II.
WD
African-Eurasian Migratory Waterbird Agreement (AEWA)
Annex II of this agreement, and Columns A and B of the AEWA 2006-2008 Ac on Plan. Several IBAs are LF sites.
(a) To conserve, & where feasible and appropriate, restore those habitats of the species which are of importance, removing the species from danger of ex nc on; (b) To prevent, remove, compensate for, or minimize, as appropriate, the adverse eff ects of ac vi es or obstacles that seriously impede or prevent the migra on of the species; and (c) To prevent, reduce or control factors that are endangering or are likely to further endanger the species, including strictly controlling the introduc on of, or controlling or elimina ng, already introduced exo c species.
WD
Conven on on Interna onal Trade in Endangered Species of Wild Flora and Fauna (CITES)
Appendix II (Tanzania is permi ed to trade)
Trade in Lesser Flamingo specimens requires the prior gran ng and presenta on of an export permit. Tanzania has CITES quota of 1600 LF/year. An export permit is only granted when the following condi ons are met: (a) A Scien c Authority of the State of export has advised that such export will not be detrimental to the survival of that species; (b) The Management Authority of the State of export is sa s ed that the specimen was not obtained in contraven on of the laws of that State, and (c) A Management Authority of the State of export is sa s ed that any living specimen will be so prepared and shipped as to minimize the risk of injury, damage to health or cruel treatment.
WD
Ramsar Conven on on Wetlands
Only 1 site listed as RAMSAR site for the protec on of Lesser Flamingo:Natron.
Conven on provides the framework for the conserva on and wise use of wetlands and their resources of global importance through local, regional and na onal ac ons and interna onal coopera on. A Contrac ng Party, is required to designate at least one wetland within its territory for inclusion in a List of Wetlands of Interna onal Importance maintained by the Ramsar bureau.
WD
Algiers Conven on General agreement that seeks to preserve habitats.
A contrac ng party is obliged to ensure conserva on, ra onal use and development of soil, water, oral and faunal resources. The objec ves of this conven on are provided for, though not fully, by the Forestry and the Wildlife Acts.
WD

Tanzania Na onal Single Species Ac on Plan 2010-2020 for the Conserva on of the Lesser Flamingo (Phoeniconaias minor) 72
Conven on/ Agreement
Lis ng of Lesser Flamingo, its sites
or habitat
Obliga ons (with Relevance to Lesser Flamingo)
Focal point/ Responsible ins tu on
Conven on on Biological Diversity (CBD)
This is a broad conven on that include all sites and habitats of the Lesser Flamingo
A contrac ng party has the responsibility to conserve biological diversity. To use biological resources sustainably. Required is contrac ng par es an cipate, prevent and address causes of reduc on or loss of biological diversity. It notes that the fundamental requirement for conserva on of biological diversity is in situ conserva on of ecosystems and natural habitats and the maintenance and recovery of viable popula ons of species in their natural surroundings.
WD
The World Heritage Conven on
Serenge Na onal Park and Ngorongoro Conserva on are key to Lesser Flamingo
This conven on focuses on the conserva on of areas that are of outstanding global cultural or natural value. Several of the Ri Valley lakes (Magadi, Empakai and Ndutu) are currently listed as part of World Heritage sites on account of their natural and cultural a ributes.
WD
UNESCO’s Man and Biosphere Programme
Manyara NP This UNESCO programme, encourages biosphere reserves, ini ated with the aim of developing ra onal use and conserva on of resources. Biosphere reserves are areas of terrestrial and coastal ecosystems, which are interna onally recognized within the framework of UNESCO’s programme.
WD

Tanzania Na onal Single Species Ac on Plan 2010-2020 for the Conserva on of the Lesser Flamingo (Phoeniconaias minor) 73
Table 9: Examples Of Na onal Laws And Policies Aff ec ng Conserva on Of Lesser Flamingo In Tanzania.
ytilibisnopseRecnaveleRyciloP ro waLEnvironmental Management Act (EMA) 2004.
EMA makes provision for declara on of any sensi ve area of wetland to be a protected reserve. This can be usefully applied in the protec on of LF habitats, supported by new Wildlife Act. EMA provides for a mandatory State of the Environment Report (SOER) for wetlands and an EIA for new projects. Calls for regular environmental audit of exis ng projects. The Act has provisions to ensure that planned and ongoing development projects will not have adverse eff ects on biodiversity and environment quality. Restricts permanent structures within 60 m of wetlands. Requires wetlands are included in Environmental Ac on Plans (EAP), part of the District Development Plans (DDP).
NEMC, VPO, WD
Public Health Act, Provides regula ons for proper waste disposal and waste management, to maintain healthy environment. Applicable to amingo habitats threatened by pollu on.
Ministry of Health; Local Authori es
The Wildlife (Conserva on and Management) Act, (2009)
The new Act provides for the crea on of conserva on areas (eg wetlands reserves, wetland areas and WMAs) for the preserva on of key habitats and their biodiversity. Lesser Flamingos and their habitats can bene t from such conserva on measures provided by the Act (eg Natron is under process towards a WMA).
WD
The Water Act (2004). The Act provides for the conserva on, control, appor onment and sustainable use of water resources. Provisions of the Act can be applied for the protec on of fragile water resources and related environments that include Lesser Flamingo habitats.
Ministry of Water, Water Authori es
The Agriculture Act This Act provides for sustainable agricultural prac ces, pollu on control, and conserva on of soil and water resources. By encouraging the protec on of fragile land including riverine habitats and water catchment through applica on of sustainable agricultural prac ces, silt loading into amingo habitats from erosive ac vi es can be reduced.
Ministry of Agriculture
Irriga on Policy (2008) Encourages expansion of irriga on as a means to overcome poverty reduc on and for food security. However, this could lead to compe on for water in LF catchments.
Ministry of Agriculture.
The Forest Act, 2006 The Act provides for the par cipatory management, protec on, conserva on, control and regula on of planta on and indigenous forests. Provisions against soil erosion and introduc on of alien species can contribute to protec on of Lesser Flamingo habitats (eg deforesta on in Natron catchment).
Ministry Natural Resources and Tourism.
The Village Land Act, 1999
The Act provides for the development of land use plans for villages taking into considera on the protec on and conserva on of cri cal natural resources within a drainage area such as the Lesser Flamingo habitats.
Ministry of Land,

Tanzania Na onal Single Species Ac on Plan 2010-2020 for the Conserva on of the Lesser Flamingo (Phoeniconaias minor) 74
ytilibisnopseRecnaveleRyciloP ro waLThe Local Government Act (1994)
The Act empowers local authori es to establish and maintain conserva on areas, make by laws, take measures necessary for proper district and urban development planning. The aim is sustainable natural resource use in their areas of jurisdic on. Councils can invoke this Act to conserve cri cal habitats like those of the Lesser Flamingos.
Local Authori es
The East African Community Treaty (1999)
Ar cles 111-116 provide for the coopera on in the conserva on and management of natural resources, trans-boundary pollu on control and the coordinated conserva on and sustainable u liza on of wildlife and other tourist sites in the region though harmoniza on of policies. These provisions can allow for formula on region wide conserva on strategies of the of the migratory Lesser Flamingos
Ministry of East African Coopera on
Physical Planning Act Local authority has powers in planning and gran ng approvals for development applica ons, to undertake EIAs and enforcement of planning laws. Local authori es manage the village based and some na onal reserves (eg forests, WMAs, etc), maintain land planned for open spaces, parks, urban forests, and green belts in accordance with the approved physical development plan. An EIA must be submi ed for any development applica on which may impact on the environment.
Local Authori es
Dar Declara on on Food Security (2004)
Advocates for coopera on in SADC region for food produc on, all the while paying considera on to natural resource management. Can be used to coordinate developments between Kenya and Tanzania on lake Natron.
Ministry of Agriculture

Tanzania Na onal Single Species Ac on Plan 2010-2020 for the Conserva on of the Lesser Flamingo (Phoeniconaias minor) 75
Table 10: Stakeholders And Their Impacts (May Be Posi ve Or Nega ve)
On Lesser Flamingo And Their Key Habitats In TanzaniaStakeholder group Region/site Ac vi es Impact
(-ve)Impact (+ve)
a. Private Sector/CommunitySoda mining companies Lake Natron Soda ash extrac on and water abstrac on
changes hydro-chemistry. Factory disturbance.*****
Hotels and Lodges Countrywide Sewage, waste discharge & water abstrac on, tourist disturbance of breeding sites.
*
Hydro-electric Schemes Catchment & Kenya
Damming catchment water for HEP genera on can change river ows aff ec ng water cycle and feeding and breeding condi ons
*****
Farmers and pastoralists communi es
Countrywide and WMAs
Water abstrac on, overgrazing or encroachment or catchment irriga on or burning, or expansion of catchment farm land, leading to land degrada on, waste/pes cide discharge, river drying and/or ash ooding and river silta on.
****
Large Scale Irriga on Catchment and Kenya
Overuse of water in catchments for large scale irriga on can reduce environmental ows and aff ect seasonal water cycles in feeding and breeding key sites.
*****
Saw millers, mber processors and charcoal makers.
Key Catchments Deforesta on, altered river or hot spring ow regime and increased silta on. Loss in forest changes local rainfall pa erns.
****
Urban se lement and related infrastructure development
Key Catchments Noise & air pollu on, water abstrac on and diversion, waste discharge & increased run-off leading to silta on, power structure aff ect yways. Waste dumps a ract marabous.
**
Water and sewerage service providers- towns
Countrywide Water abstrac on and diversion, waste discharge leading to water pollu on.
***
Saadani Salt Works Saadani NP Created man-made environment for LF. Nes ng of Greater Flamingo observed.
***
Industries and factories Key catchments Water abstrac on & chemical pollu on. **Tour and hun ng operators
Key catchments or GCAs
Habitat modi ca on, stress, noise, aircra over- ight disturbance, encroachment, but also through local an -poaching and CBNRM protect key sites (eg Natron).
* **
b. Ins tu ons:UNEP, IUCN, World Bank & Development Partners
Countrywide Biodiversity conserva on and sustainable development eff orts.
**
Wildlife Protected Areas and Na onal Parks
Ngorongoro Conserva on Area, Serenge NP, Manyara NP, Arusha NP.
Provide protec on to habitats for biodiversity conserva on, including LF.
**
AEWA NGOs: BirdLife, RSPB & Wetland Interna onal
Countrywide Monitoring biodiversity status and associated environmental changes, an -lobby to site exploita on. Establish and monitor IBAs and seek resources to protect and manage key sites (eg Natron Project)
****

Tanzania Na onal Single Species Ac on Plan 2010-2020 for the Conserva on of the Lesser Flamingo (Phoeniconaias minor) 76
Stakeholder group Region/site Ac vi es Impact (-ve)
Impact (+ve)
Universi es: SUA, UDSM, ARDHI, etc.
Countrywide Basic and applied research: conserva on, land-use prac ces, capacity building, sources of informa on. Mortality studies. Linked with Leicester University study on Natron.
***
Polytechnics and other ter ary ins tu ons (eg Mweka)
Local Capacity building and research on zoono c diseases.
**
Regional and LGA Administra on
Country wide Enforcing regula ons on environmental protec on and conserva on, inclusion in DDP and ac ons through CBNRM projects (eg Natron).
***
Ministries of Agriculture & Livestock Dev. and Fisheries
Countrywide Sustainable farming and shing prac ces that do not impinge on lesser amingo, or its catchment. However, can experience con ict over catchment water use for irriga on, pastoralism and shing in key sites.
*** ***
Ministry of Environment and NEMC
Countrywide Environment protec on and conserva on applying EMA to mandate SOER of wetlands, to include wetlands in DDP/EAP, to create wetland reserves and monitoring EIAs on new investments (eg ESIA of soda plant Lake Natron).
*****
Ministry of Water (and Irriga on)
Countrywide Water catchment conserva on, but can come in con ict due to compe ng water use for domes c or irriga on needs in key sites.
**** ****
Ministry of PMO-RALG. Countrywide Natural resources management guiding LGA in Urban and rural land-use planning, and inclusion of CBNRM in DDPs.
****
Ministry of Educa on Countrywide Increasing awareness and informa on dissemina on through schools, and wildlife clubs (eg WCST and MCT).
****
Ministry of NR and Tourism
Countrywide Biodiversity conserva on and ecotourism and custodian of wildlife and wetlands through network of PA (ie GR, GCA, WMA, etc) and through Ramsar conven on, manage key sites (eg Lake Natron).
*****
Ministry of Lands & Se lement
Countrywide Land use planning and management allow for holis c planning by communi es.
****
Local Environmental NGOs (WCST, MCT)
Na onal Biodiversity conserva on and advocacy and CEPA including wildlife clubs (eg Natron) *****
Interna onal Conserva on NGOs (WWF, WCS, FZS, AWF, BirdLife, etc
Countrywide Biodiversity conserva on, improved livelihood, policy formula on and advocacy and research, and CBNRM (eg AWF assis ng WMA in Natron).
*****
Development NGOs (OXFAM, CARE, etc)
Countrywide In interest of assis ng poverty reduc on (like catchment irriga on or pastoralism) can come into con ict with water use aff ec ng downstream LF lakes (eg Natron & OXFAM).
****
Key: *Low; **Medium; ***High; ****Very High

Tanzania Na onal Single Species Ac on Plan 2010-2020 for the Conserva on of the Lesser Flamingo (Phoeniconaias minor) 77
Table 11:Exis ng Projects, Which Are Relevant To Lesser Flamingo Conserva on
There are several on-going conserva on and development projects that are currently being implemented by diverse organiza ons within the watersheds of Lesser Flamingo habitats of Kenya and Tanzania, which could
have direct impact on the species. Examples of such projects are listed below:
a. Environmental ProjectsstcatnoC/elbisnopseRstcejorP gnioG nO
.CS AWEA GWWN dna PABTstnuoc drib dna sABI fo gnippaMAvian In uenza Surveillance amongst the wild birds TBAP, Director of Veterinary Services.
Ministry of Livestock and Fisheries.Sustainable Wetlands Management Program, Lake Natron Component supported by Danida.
Wildlife Division, Wetlands Unit and Arusha RS, Longido and Ngorongoro DC.
sdnalteW ,efiLdriB ,FEG/AWEAtcejorP sdnalteW revO sgniWInterna onal and WCST.
Conserva on Educa sbulC efildliW TCM/TSCW.emmargorP no PFM- Protec on & Restora on of Forests in the catchment supported by Danida, Finnida and World Bank.
DFB-MNRT.
Eff .)FPWT( DW urht ,APANAT ,IRIWATaraynaM ekaL no erutlucirgA fo tce Nomina on of Ri Valley Lakes for World Heritage sites BirdLife and partnersLake Natron Consulta ve Group, lobby against soda plant. BirdLife, WCST and 50 partners.
.NCUI/GSS ,kcnalP xaM)gnidnep( margorP gnikcarT FLMarabou Stork Tracking Program (vv LF) TBAP, WCS, BirdLife/WCST Lake Natron Project (Jensen), Support to local communi es.
BirdLife, RSPB, WCST, WD, DC, IPI.
Soda Lakes Research, study of water cycles including LF and lake Natron.
Leicester University, SUA, USDM, Nairobi University, TAWIRI, WD, etc
.CD odignoL dna FWA.nortaN ekaL AMW ot troppuSStudy on mortality LF in Momella, Manyara, etc UDSM.Training in wetlands management, Lake Natron Mweka College.Studies Lake Manyara to develop WMA and protec on AWF & Manyara NP.
abaB.egnuruB dnuora AMW troppuS DC.Strengthening site support groups (Tanzania/Regional) RSPB/ BirdLife/WCST/IPI.
.TSCW/efiLdriB /BPSR)nortaN( ngiapmaC kniP knihT
b. Planned/Pipeline ProjectsEco-hydrology study of LF in Lake Natron (Disney) Leicester University/RSPBStrengthening knowledge for decision making (Natron) Leicester/RSPB/BirdLife/WCST/SUA, etc.
tsurT allawaM.nortaN ekaL AMW ot troppuS
. Development ProjectsstcatnoC/elbisnopseRtcejorP
Proposed Soda Ash Extrac on plant at Lake Natron, Tanzania by TATA inc. and Na onal Dev. Corpora on state agency (pending EIA).
TATA Chemicals and Tanzania Government
Community Catchment Irriga nortaN ekaL dnuora ,MAFXOno Serenge SDAORNAToreseragN aiv ,daoR Development projects of local authori es Local Government
agirri dna retaW fo yrtsiniMstcejorp ylppus retaW oneS dna sdnaL fo yrtsiniMesu dnaL ni segnahC lement
lasoporP– rewop lamrehtoeG.ADIS/napaJ dna IPIseloherob/retaw depip ot troppuS

Tanzania Na onal Single Species Ac on Plan 2010-2020 for the Conserva on of the Lesser Flamingo (Phoeniconaias minor) 78
Table 12:Opportuni es And Risks For The Conserva on Of Lesser Flamingo In Tanzania.Opportuni sksiRse
• Existence of relevant na onal and interna onal laws (eg Natron as a Ramsar site).
• Favourable conserva on policies.• SOER wetlands is mandatory.• Inclusion of IMP/GMP in the
district/PA development plans for various lakes catchments.
• Increased awareness on the value of conserva on by communi es.
• Existence of research capacity, e.g. in universi es.
• Interna onal support – technical & nancial.
• Protected areas already designated.
• Many agencies undertaking research in amingo habitats.
• Public goodwill and response to Soda Mine EIA.
• Adop on of par cipatory natural resource management strategies e.g. WMAs that enhance community par cipa on.
• LF SSAP developed.• NWWG AEWA SC has adopted
the LF SSAP as key ac vity.
• Lack of harmony, leading to lack of coordina on of policies, laws and mandates by diff erent government agencies/ins tu ons & NGOs crea ng con ict, confusion and overlap (eg Poli cal con ict between mining & conserva on, irriga on competes for water, need for energy leads to catchment damage, etc).
• Nega ve and poor percep ons by the community in the Flamingo habitats in regard to environmental conserva on issues (eg. Overgrazing, irriga on abstrac on, etc).
• Lack of ins tu ons responsible solely for Lesser Flamingo conserva on (eg Not in DDP, no regional forum, etc).
• Apparent un-coordinated eff orts & lack of synergies amongst stakeholders.
• Limited local community par cipa on in Lesser Flamingo conserva on (economic value unclear).
• Trans-boundary issues beyond control of Tanzania (ie Kenya HEP and irriga on and pollutants).
• Trans-boundary issues within the control of Tanzania but currently not a priority (ie massive in ux of Kenyan pastoralists into Natron area).
• Inadequate resources (ie. Flamingo economic value is undervalued and has poor donor support).
• Land use con icts (encroachment, catchment agriculture, etc)• Trans-boundary movements and migratory nature of the Lesser
Flamingos puts them at threat, needs regional coopera on.• Demand for agricultural land as a result of expanding human
popula on, is causing catchment water cycle damage.• Sectoral priori es not in favour of Lesser Flamingo conserva on
(value unknown)(not poverty reduc on related).• Evic on of pastoralists or establishment of new PAs in wetlands
may work against raising awareness to protect the catchment.• At risk from natural disasters (e.g. volcanic erup ons from
Oldonyo Lengai or climate change, like the 2009 drought).• Growing catchment popula on (Kenya and Tanzania) and
poverty demanding more resources and more land and water.

Tanzania Na onal Single Species Ac on Plan 2010-2020 for the Conserva on of the Lesser Flamingo (Phoeniconaias minor) 79
Table 13:Logical Framework Analysis of Kenya Lesser Flamingo SSAP.
(Source: Kenya Lesser Flamingo SSAP, 2008)Vision, Aim & Objec ve Descrip on and Jus ca on Indicators of success
Vision A stable, viable and healthy East African popula on of the LF.
Lesser Flamingo are subjected to periodic mass die-off s, which if not arrested can result in a progressive decline in popula on density
Stable counts, birds in good health and reduced episodes of massive die-off s
Aim To stabilize popula on size and distribu on of the LF o at an average number of no less than 900 000 individuals within the next ve to ten years.
The species popula on size has witnessed a progressive decline in popula on size as a result of a number of factors the most cri cal of which is the degrada on and of its specialized habitat, hence the need to stabilize the popula on size.
Repeated annual and bi-annual coordinated Lesser Flamingo counts show popula on size stabilizing at an average of 900 000 individuals.
Objec vesVision, Aim & Objec ve Descrip on and Jus ca on Indicators of success
1. 0 All key sites maintained in good ecological condi on (****)
Lesser Flamingos have speci c habitat requirements (see Sec on 2) hence all sites need to be carefully maintained to meet these requirements.
Favourable ecological condi ons for Lesser Flamingo survival are met and maintained at all key sites.
2. 0 Disturbance stopped at key non-breeding sites and at sites where birds are known have a empted to breed or to have tradi onally bred (*)
In Kenya there are many non-breeding sites used for feeding and roos ng. At these sites, human disturbance may can aff ect feeding and limit access to freshwater needed for drinking and washing. In areas where breeding occurs or a empts have been reported, breeding failure could have resulted from human disturbance.
Existence and enforcement of regula ons on acceptable distance that people are allowed to approach feeding popula ons and known watering or poten al breeding areas.
3. 0 Impact of poisoning and diseases on LF popula ons reduced (****)
Large-scale die-off s on feeding lakes in Kenya and Tanzania have in the past occurred and a ributed variously to inges on of industrial heavy metals, pes cides and cyanobacterial toxins. In some cases several infec ous diseases have been singled out as having contributed to the deaths.
Bi-annual Waterbird counts and observa onal reports show a signi cant reduc on in the frequency and intensity of mass die-off s in Kenyan Ri Valley lakes.
4. 0 An opera onal na onal and regional network and collabora on program for the conserva on of the LF ini ated and sustained (***)
Currently there are number of ins tu ons and individuals studying diff erent aspects of the Lesser Flamingo ecology and conserva on. However, their ac vi es are uncoordinated with limited exchange of study ndings.
An opera onal na onal and regional networking group with an easily retrievable database of past, ongoing and planned studies on Lesser Flamingos and their habitats in East African region. A regular amingo update report mailed
to stakeholders.5. 0 Knowledge gaps on
aspects of the Ecology of LF such as popula on numbers and distribu on, threats, values and causes of die-off s lled (***)
A lot of informa on on the species is s ll lacking, yet it is needed to be er conserve the species
Research and monitoring reports and scien c publica ons on distribu on, threats, values, causes of die-off s by 2009
Priority: * = Low, ** = medium, *** = high, **** = cri cal

Tanzania Na onal Single Species Ac on Plan 2010-2020 for the Conserva on of the Lesser Flamingo (Phoeniconaias minor) 80
Table 14: Lake Natron Stakeholders Dra Integrated Management Plan (Feb 2008)
(Source: Produced during the Ramsar Advisory Mission, 2008)Sl Ac ons
Aff ec ngEnvironmental and Impact Recommended Feasible Protec on Ac on
No Resources and Values
Social Impact - 0 + and Mi ga on Measures Plan
1 Delay in establishing IMP
a. Unsustainable investments in catchment aff ect the lake and its fragile environment.
3 a. RAM to launch process & give guidelines for IMP.
ST
b. Undertake stakeholder & resource analysis (SOER).
ST
c. Integrate IMP into District Development Plans (EAP).
ST
d. Establish district basket fund for Wetland Friendly Investments (micro-projects).
LT
e. IMP to include IWRMS/catchment management.
LT
f. Assist Kenya to consider Ramsar registra on and IMP.
LT
g. Establish an IDC and Trans-boundary management ins tu on as a Ramsar EAC Regional Ini a ve.
LT
2 Proposed Soda Ash Plant impact
a. Flamingos aff ected by WQ changes, disturbance factors & physical obstruc ons.
3 a. Implement mi ga on measures from EIA through EMP, and introduce SSAP into DDP.
LT
b. Pressure on limited freshwater supply.
3 b. Undertake hydrological survey and develop water plan.
LT
c. Local community derive limited SE bene ts.
2 c. Conduct Cost Bene t Analysis of Business Plan.
LT
d. Labour in-migra on will cause SE problems.
2 d. Implement Social Development & HIV/AIDS Program.
LT
e. Transport services disrupt game corridors.
1 e. Undertake separate EIA and EMP for roads, etc
ST
3 Proposed Mwatambo/Ngarosero road impact
a. Environment consequences to fragile area.
1 a. Undertake EIA and EMP for road ST
4 Economic importance to livelihoods undervalued
a. Livelihood prac ces put pressures on fragile environment.
1 a. Undertake economic analysis & develop Economic Development Plan for area
ST
b. Provide suppor ve extension service LTc. Convert GCA to WMA for community bene t sharing
LT
5 Tourism poten al unrealized
a. Uncoordinated development puts pressure on fragile environment.
2 a. Develop local tourism plan including trans-boundary opportuni es.
ST
b. Irresponsible tourism threatens biodiversity.
2 b. Establish local tourism regula ons on off -road and aircra use.
LT
c. Local communi es not fully bene ng.
1 a. Expand packages to include cultural opportuni es.
LT

Tanzania Na onal Single Species Ac on Plan 2010-2020 for the Conserva on of the Lesser Flamingo (Phoeniconaias minor) 81
6 Absence of a local management ins tu on
a. Uncoordinated developments
2 a. Establish an IDC management ins tu on. LTb. Re-tool and re-train District/Village EMCs LTc. Establish Ramsar Site Offi ce & M&E implementa on.
LT
b. Lack of cross-border coordina on.
2 a. Establish a Trans-boundary management ins tu on.
LT
.
7 Unsustainable resource use
a. Unsustainable agriculture causing erosion.
2 a. Through LUPs & micro-projects ins ll sustainable land use.
LT
b. Unsustainable pastoralism causing overgrazing.
TL2
c. Burning for grazing areas damaging catchment.
TL2
d. Irriga on overuse of water resources.
TL2
8 Limited knowledge of ecosystem
a. Data insuffi cient to sustainably manage area.
2 a. Conduct research on amingo biology. LTb. Study the Gelai FR habitat and water balance.
LT
c. Study game corridors (eg elephants). LTd. Establish eld centre for visi ng scien sts. LT
9 Climate change sensi ve area
a. Climate change aff ects livelihoods
a. Establish CC coping Strategy & implement ac ons.
LT
10 Security risk area
a. Severe poaching for food (eg zebra).
2 a. Ins ll an -poaching campaign. LT
b. Ca le rustling threaten local herds.
TS.aera ni ecilop pu feeB .b2
TS.aera ni ecilop pu feeB .c1.stsiruot ot taerht ytiruceS .c
.

Tanz
ania
Na
ona
l Sin
gle
Spec
ies A
c o
n Pl
an 2
010-
2020
for t
he C
onse
rva
on
of th
e Le
sser
Fla
min
go (P
hoen
icon
aias
min
or)
82Tabl
e 15
:Log
ical
for F
ram
ewor
k fo
r Med
ium
Ter
m T
anza
nia
SSAP
For
Les
ser
Flam
ingo
:
201
0-20
15

Tanz
ania
Na
ona
l Sin
gle
Spec
ies A
c o
n Pl
an 2
010-
2020
for t
he C
onse
rva
on
of th
e Le
sser
Fla
min
go (P
hoen
icon
aias
min
or)
83

Tanz
ania
Na
ona
l Sin
gle
Spec
ies A
c o
n Pl
an 2
010-
2020
for t
he C
onse
rva
on
of th
e Le
sser
Fla
min
go (P
hoen
icon
aias
min
or)
84

Tanzania Na onal Single Species Ac on Plan 2010-2020 for the Conserva on of the Lesser Flamingo (Phoeniconaias minor) 85
Tanzania National Single Species Action Plan for the Conservation of Lesser Flamingo Phoeniconaias minor
Flamingos require soft mud to build their nest mounds. In this image the colonies are situated alongthe east facing edge of the southern lagoon at approximately -2.5431S / 35.9982E. Those on theislands in the deeper water are at risk from flooding if the water level rises. Those on the trona (thecrusty surface of Natron) are at risk from mammalian predators if the surface continues to dry. Cracksin the surface of the trona can just be seen around the drier colonies. Marabou Storks increasinglythreaten these southern lagoon colonies, Fish Eagles are absent from this harsh environment.
Some individual chicks don’t join crèches and are fed by adults, presumably parent birds. Thered legs of this chick indicate that it is at least one week old.
© Neil Baker
© Matthew Aeberhard
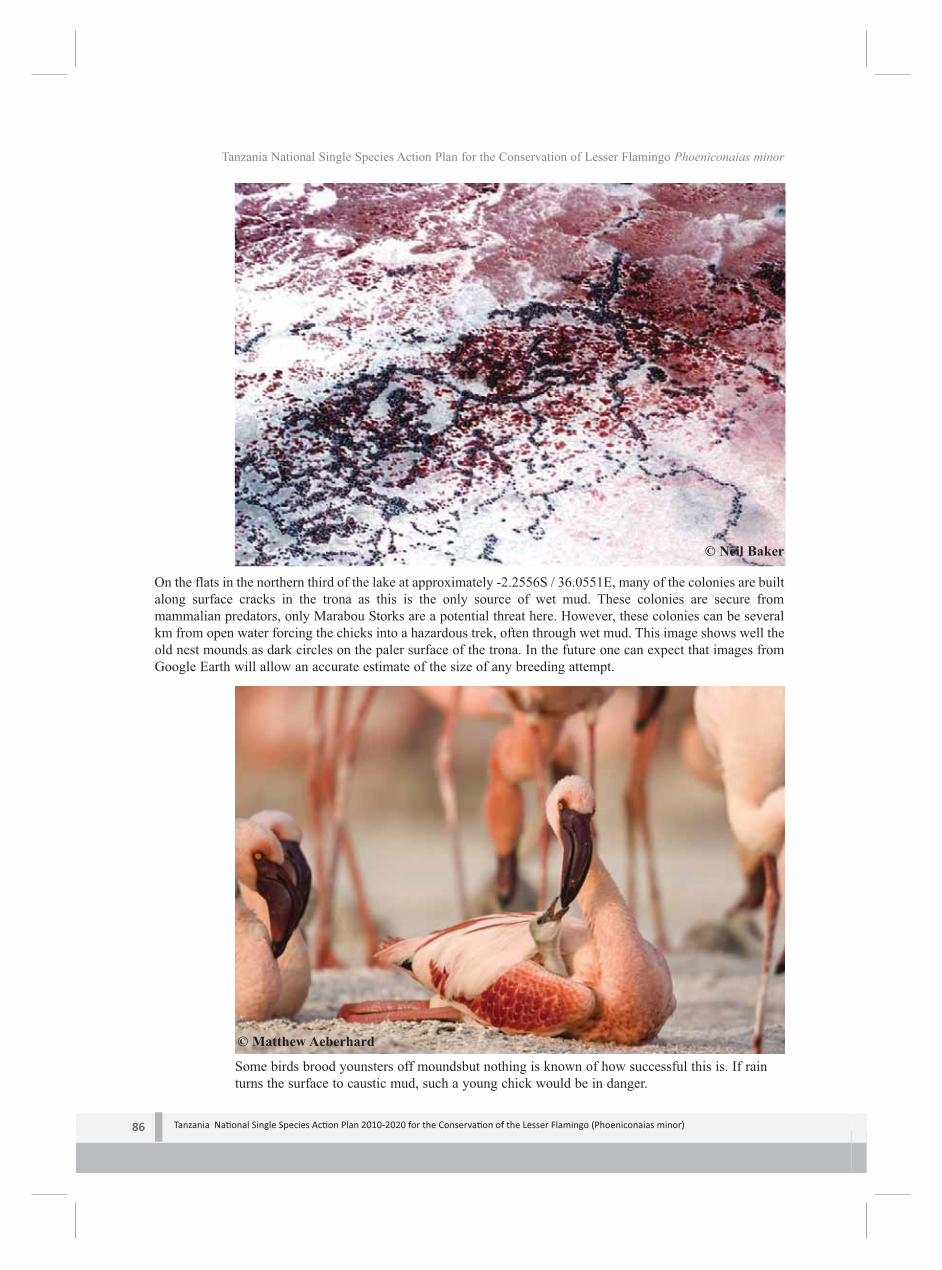
Tanzania Na onal Single Species Ac on Plan 2010-2020 for the Conserva on of the Lesser Flamingo (Phoeniconaias minor) 86
Tanzania National Single Species Action Plan for the Conservation of Lesser Flamingo Phoeniconaias minor
On the flats in the northern third of the lake at approximately -2.2556S / 36.0551E, many of the colonies are builtalong surface cracks in the trona as this is the only source of wet mud. These colonies are secure frommammalian predators, only Marabou Storks are a potential threat here. However, these colonies can be severalkm from open water forcing the chicks into a hazardous trek, often through wet mud. This image shows well theold nest mounds as dark circles on the paler surface of the trona. In the future one can expect that images fromGoogle Earth will allow an accurate estimate of the size of any breeding attempt.
© Neil Baker
Some birds brood younsters off moundsbut nothing is known of how successful this is. If rainturns the surface to caustic mud, such a young chick would be in danger.
© Matthew Aeberhard

Tanzania Na onal Single Species Ac on Plan 2010-2020 for the Conserva on of the Lesser Flamingo (Phoeniconaias minor) 87
Tanzania National Single Species Action Plan for the Conservation of Lesser Flamingo Phoeniconaias minor.
An aerial image of a large crèche, the few adults in attendance can be discerned as larger white spots. Althoughout of focus this image does portray the scale of the larger crèches and the magnitude of the effort required tokeep them moving to safer sites that provide food and less caustic water and mud. These treks can cover severalkm and for the northern breeders this can exceed 10km to relative safety. These crèches cannot be counted andused as evidence of successful breeding, only as an indication of successful hatching. Successful fledging is stillsome months away.
© Neil Baker
© Matthew Aeberhard
Adults and young chicks in a crèche at Lake Natron - the water here is wind blown wash from the southernlagoon onto dry flat. Direct rainfall could put these chicks at risk from caustic mud and the possibility of sodaanklets forming

Tanzania Na onal Single Species Ac on Plan 2010-2020 for the Conserva on of the Lesser Flamingo (Phoeniconaias minor) 88
Tanzania National Single Species Action Plan for the Conservation of Lesser Flamingo Phoeniconaias minor.
Lesser Flamingo and chickon the nest mound. Nestmounds can be twice thisheight. Mounds protect theeggss and chicks fromflooding and ambienttemperatures are lower thanat they are at the surface.
Eggs stay white and do not rapidly stainbrown. They can therefore be distinguishedon high resolution aerial photos and used toestimate breeding effort.
© Matthew Aeberhard
© Matthew Aeberhard