ceo’s review - outotec · pia kåll . strategy . minna aila ... agm 2015 | ceo's review ....
TRANSCRIPT
CEO’s review Annual General Meeting on March 30, 2015
© Outotec – All rights reserved
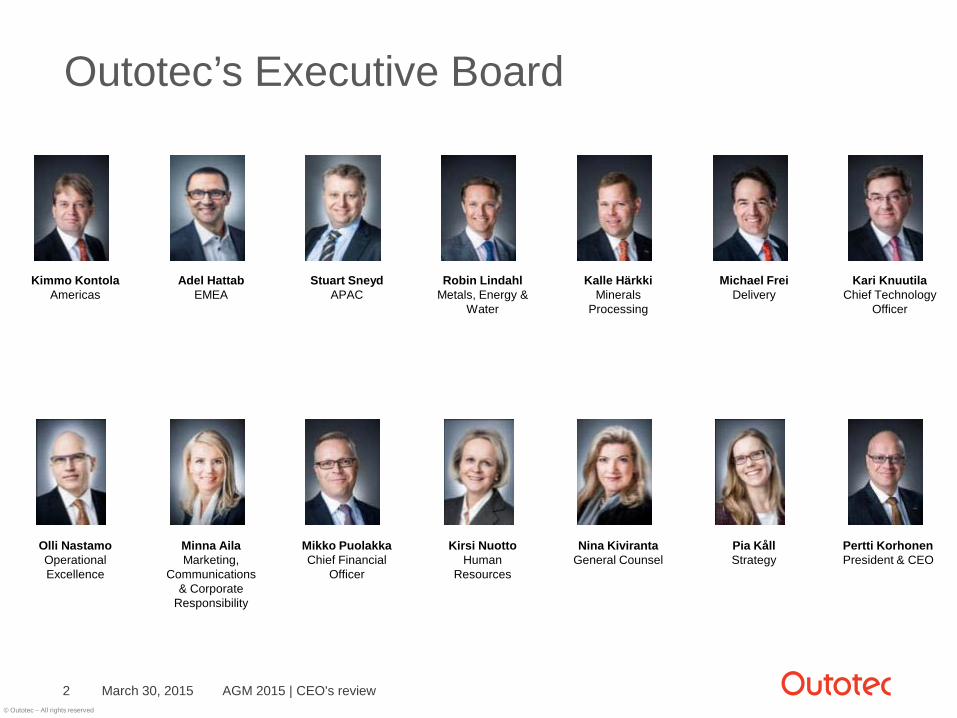
Outotec’s Executive Board
March 30, 2015 AGM 2015 | CEO's review
Kimmo Kontola Americas
Adel Hattab EMEA
Kalle Härkki Minerals
Processing
Robin Lindahl Metals, Energy &
Water
Stuart Sneyd APAC
Kari Knuutila Chief Technology
Officer
Michael Frei Delivery
Pertti Korhonen President & CEO
Mikko Puolakka Chief Financial
Officer
Olli Nastamo Operational Excellence
Kirsi Nuotto Human
Resources
Pia Kåll Strategy
Minna Aila Marketing,
Communications & Corporate
Responsibility
Nina Kiviranta General Counsel
2
© Outotec – All rights reserved
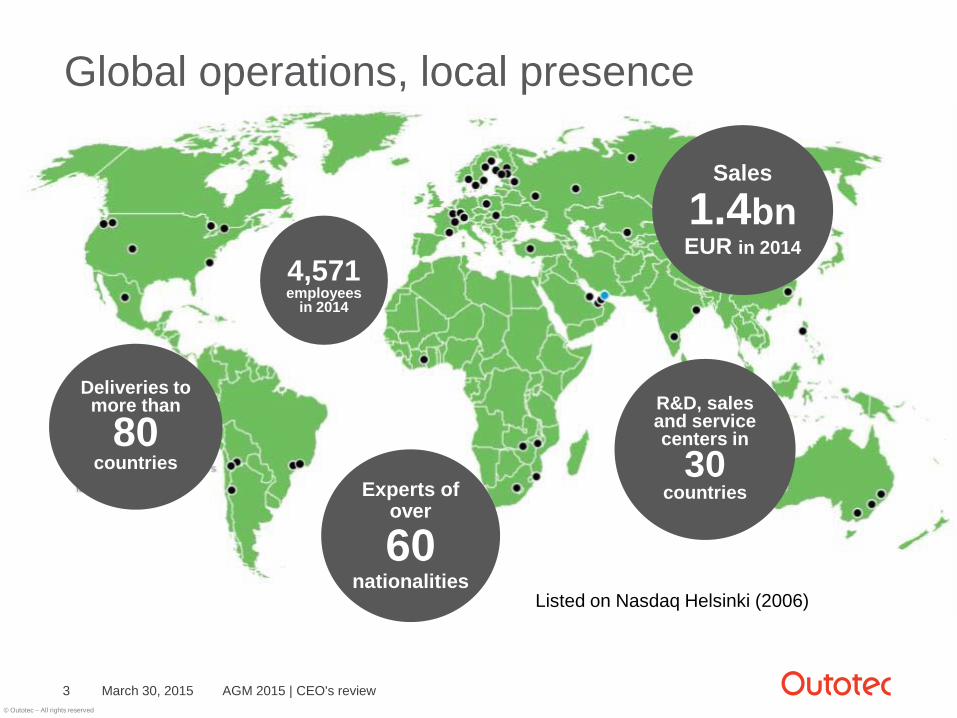
Global operations, local presence
AGM 2015 | CEO's review 3
R&D, sales and service centers in
30 countries
Deliveries to more than
80 countries
Experts of over
60 nationalities
Sales
1.4bn EUR in 2014
4,571 employees
in 2014
March 30, 2015
Listed on Nasdaq Helsinki (2006)
© Outotec – All rights reserved
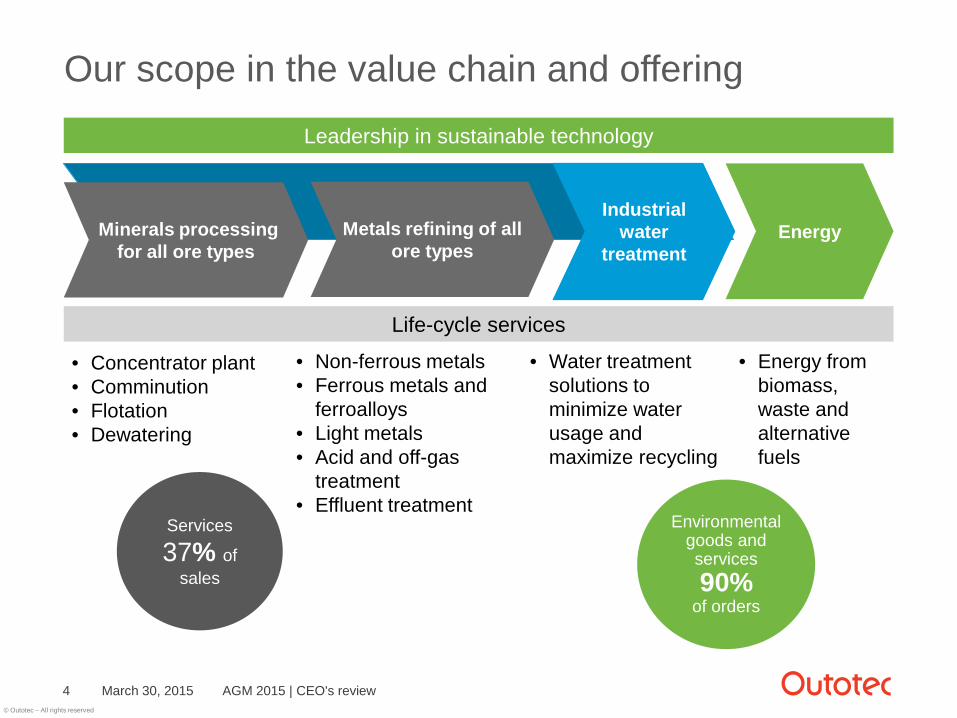
Our scope in the value chain and offering
March 30, 2015 AGM 2015 | CEO's review 4
• Concentrator plant • Comminution • Flotation • Dewatering
• Non-ferrous metals • Ferrous metals and
ferroalloys • Light metals • Acid and off-gas
treatment • Effluent treatment
Industrial water
treatment Metals refining of all
ore types Minerals processing
for all ore types
• Water treatment solutions to minimize water usage and maximize recycling
• Energy from biomass, waste and alternative fuels
Leadership in sustainable technology
Life-cycle services
Services
37% of sales
Environmental goods and services 90%
of orders
Energy
© Outotec – All rights reserved
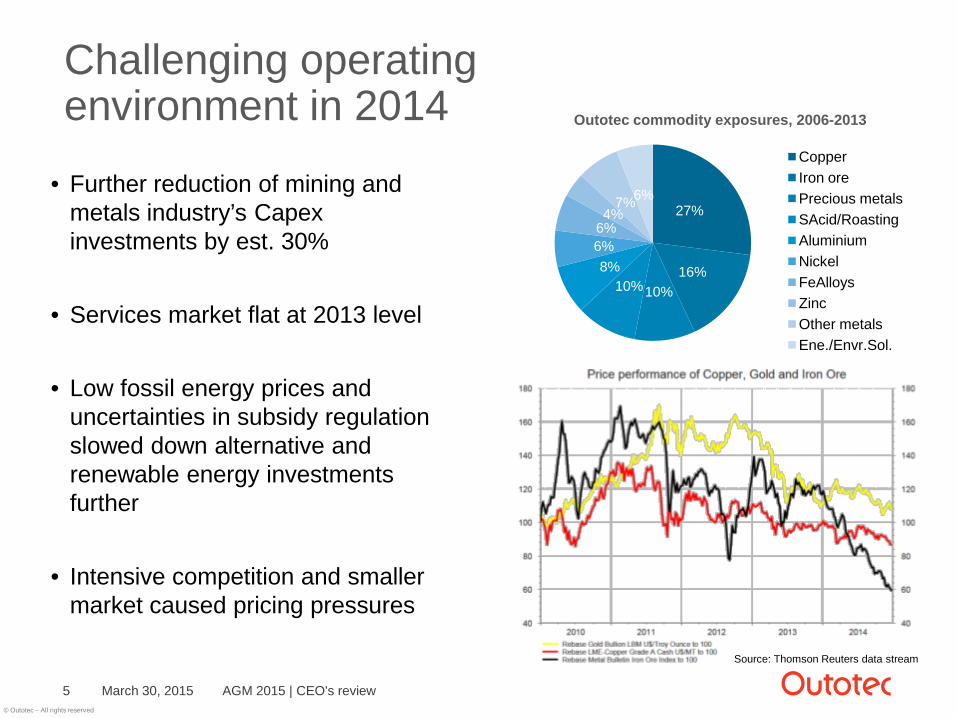
Challenging operating environment in 2014
• Further reduction of mining and metals industry’s Capex investments by est. 30%
• Services market flat at 2013 level
• Low fossil energy prices and uncertainties in subsidy regulation slowed down alternative and renewable energy investments further
• Intensive competition and smaller market caused pricing pressures
March 30, 2015 AGM 2015 | CEO's review 5
Source: Thomson Reuters data stream
27%
16% 10% 10%
8% 6% 6% 4%
7% 6%
Outotec commodity exposures, 2006-2013
Copper Iron ore Precious metals SAcid/Roasting Aluminium Nickel FeAlloys Zinc Other metals Ene./Envr.Sol.
© Outotec – All rights reserved
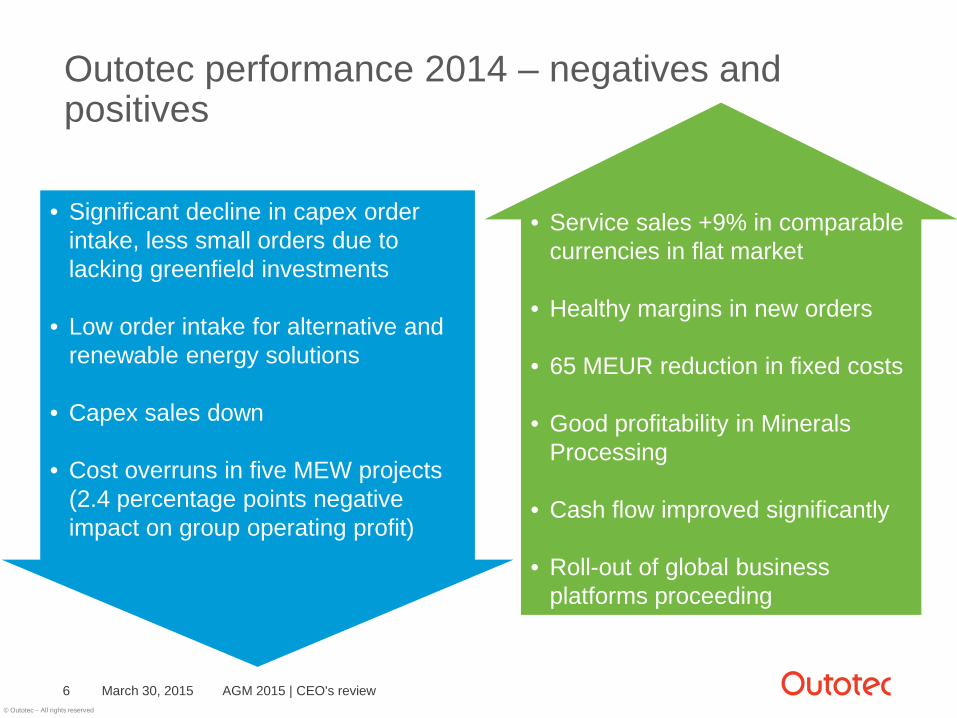
Outotec performance 2014 – negatives and positives
March 30, 2015 AGM 2015 | CEO's review 6
• Significant decline in capex order intake, less small orders due to lacking greenfield investments
• Low order intake for alternative and
renewable energy solutions
• Capex sales down • Cost overruns in five MEW projects
(2.4 percentage points negative impact on group operating profit)
• Service sales +9% in comparable currencies in flat market
• Healthy margins in new orders
• 65 MEUR reduction in fixed costs
• Good profitability in Minerals Processing
• Cash flow improved significantly
• Roll-out of global business platforms proceeding
© Outotec – All rights reserved
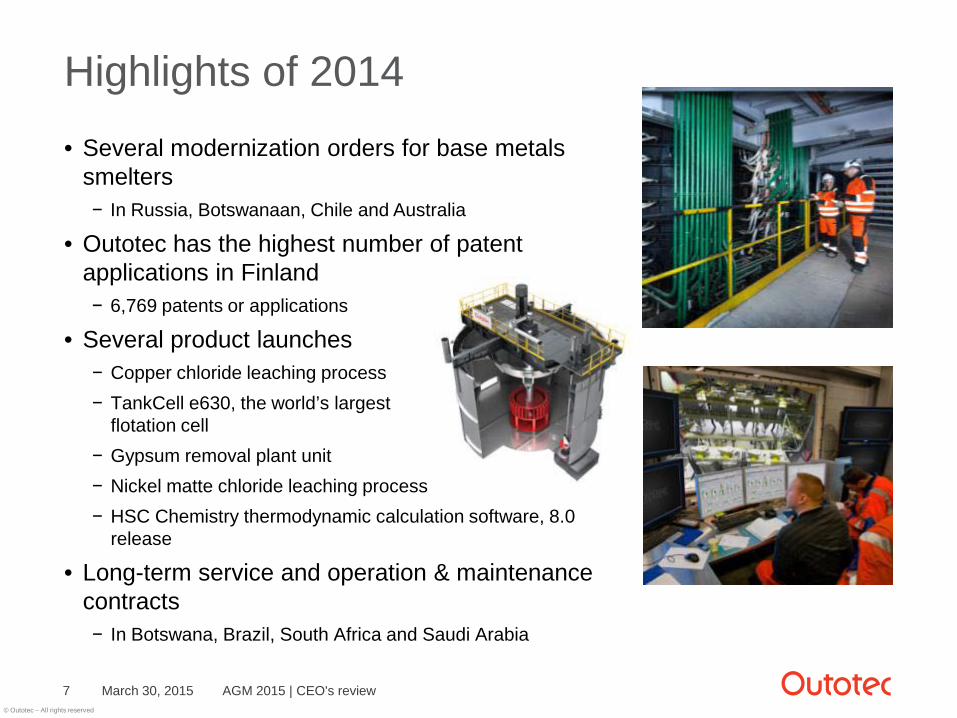
Highlights of 2014 • Several modernization orders for base metals
smelters − In Russia, Botswanaan, Chile and Australia
• Outotec has the highest number of patent applications in Finland − 6,769 patents or applications
• Several product launches − Copper chloride leaching process − TankCell e630, the world’s largest
flotation cell − Gypsum removal plant unit − Nickel matte chloride leaching process − HSC Chemistry thermodynamic calculation software, 8.0
release
• Long-term service and operation & maintenance contracts − In Botswana, Brazil, South Africa and Saudi Arabia
AGM 2015 | CEO's review 7 March 30, 2015
© Outotec – All rights reserved
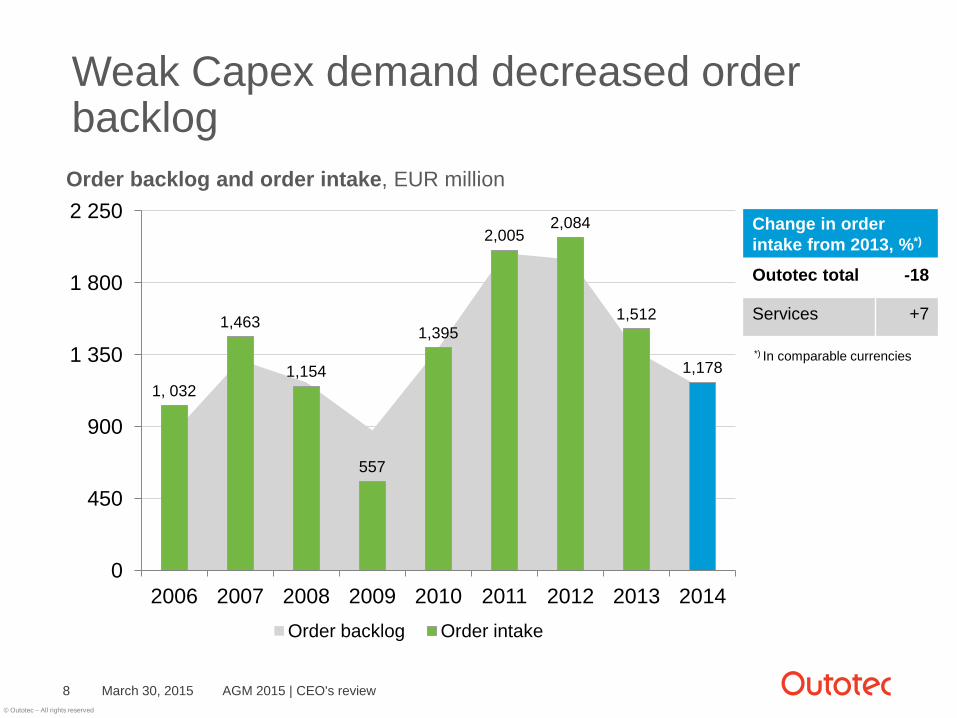
Weak Capex demand decreased order backlog
March 30, 2015 AGM 2015 | CEO's review 8
Order backlog and order intake, EUR million
1, 032
1,463
1,154
557
1,395
2,005 2,084
1,512
1,178
0
450
900
1 350
1 800
2 250
2006 2007 2008 2009 2010 2011 2012 2013 2014 Order backlog Order intake
Change in order intake from 2013, %*)
Outotec total -18
Services +7
*) In comparable currencies
© Outotec – All rights reserved
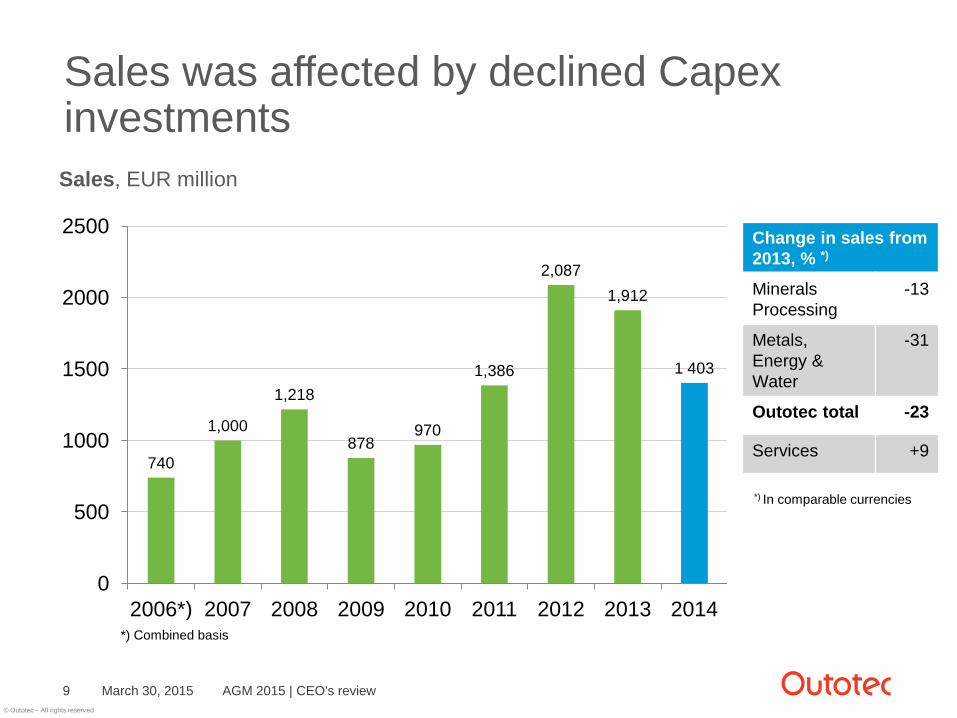
Sales was affected by declined Capex investments
March 30, 2015 AGM 2015 | CEO's review 9
Sales, EUR million
740
1,000
1,218
878 970
1,386
2,087 1,912
1 403
0
500
1000
1500
2000
2500
2006*) 2007 2008 2009 2010 2011 2012 2013 2014 *) Combined basis
Change in sales from 2013, % *)
Minerals Processing
-13
Metals, Energy & Water
-31
Outotec total -23
Services +9
*) In comparable currencies
© Outotec – All rights reserved
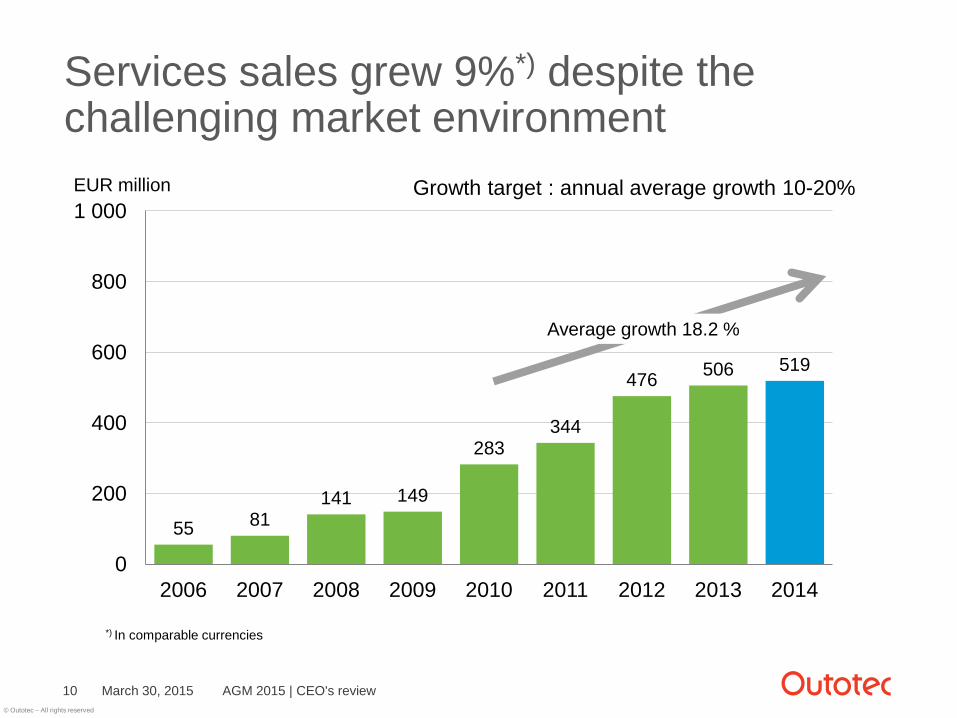
55 81 141 149
283 344
476 506 519
0
200
400
600
800
1 000
2006 2007 2008 2009 2010 2011 2012 2013 2014
Growth target : annual average growth 10-20%
Services sales grew 9%*) despite the challenging market environment
March 30, 2015 AGM 2015 | CEO's review 10
EUR million
Average growth 18.2 %
*) In comparable currencies
© Outotec – All rights reserved
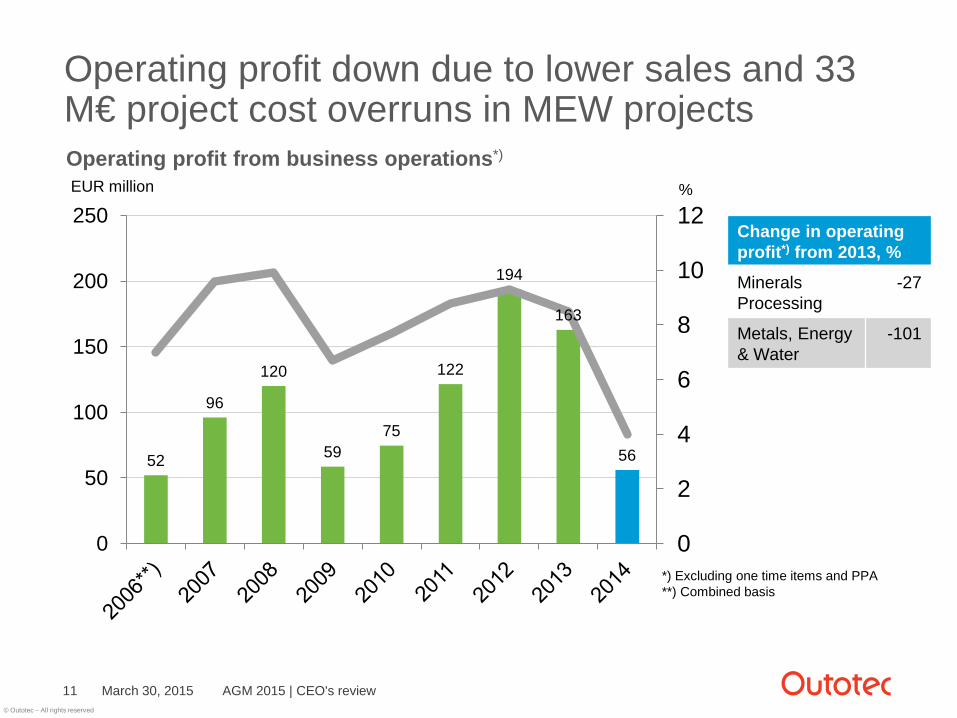
Operating profit down due to lower sales and 33 M€ project cost overruns in MEW projects
March 30, 2015 AGM 2015 | CEO's review 11
52
96
120
59 75
122
194
163
56
0
2
4
6
8
10
12
0
50
100
150
200
250
Operating profit from business operations*)
*) Excluding one time items and PPA **) Combined basis
EUR million %
Change in operating profit*) from 2013, %
Minerals Processing
-27
Metals, Energy & Water
-101
© Outotec – All rights reserved
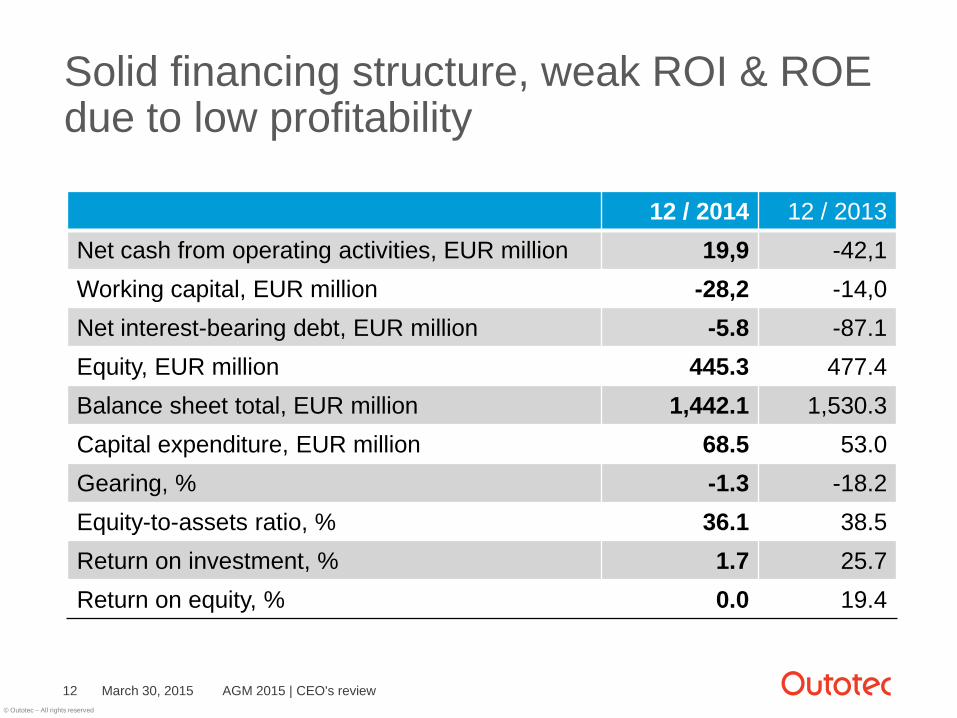
Solid financing structure, weak ROI & ROE due to low profitability
March 30, 2015 AGM 2015 | CEO's review 12
12 / 2014 12 / 2013 Net cash from operating activities, EUR million 19,9 -42,1 Working capital, EUR million -28,2 -14,0 Net interest-bearing debt, EUR million -5.8 -87.1 Equity, EUR million 445.3 477.4 Balance sheet total, EUR million 1,442.1 1,530.3 Capital expenditure, EUR million 68.5 53.0 Gearing, % -1.3 -18.2 Equity-to-assets ratio, % 36.1 38.5 Return on investment, % 1.7 25.7 Return on equity, % 0.0 19.4
© Outotec – All rights reserved
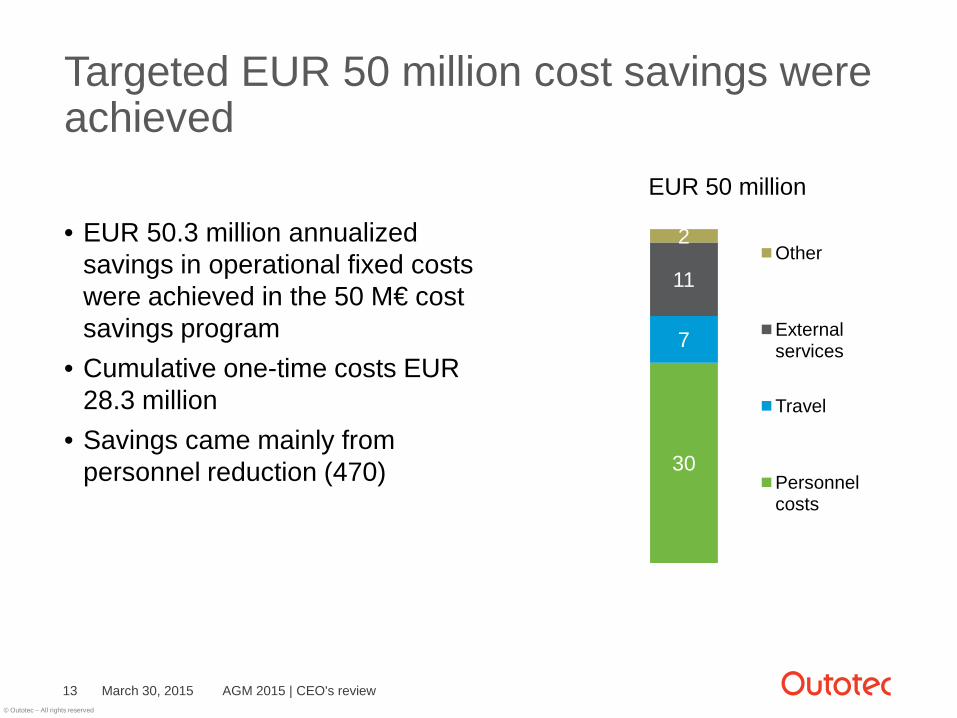
Targeted EUR 50 million cost savings were achieved
• EUR 50.3 million annualized savings in operational fixed costs were achieved in the 50 M€ cost savings program
• Cumulative one-time costs EUR 28.3 million
• Savings came mainly from personnel reduction (470)
March 30, 2015 AGM 2015 | CEO's review 13
30
7
11
2 Other
External services
Travel
Personnel costs
EUR 50 million
© Outotec – All rights reserved
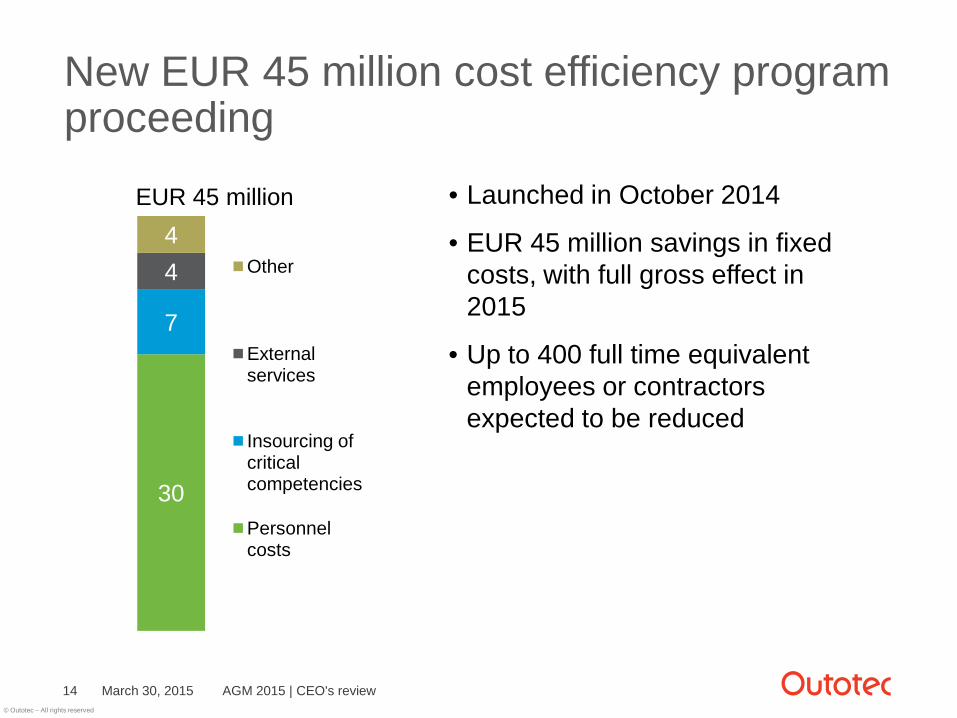
New EUR 45 million cost efficiency program proceeding
• Launched in October 2014
• EUR 45 million savings in fixed costs, with full gross effect in 2015
• Up to 400 full time equivalent employees or contractors expected to be reduced
March 30, 2015 AGM 2015 | CEO's review 14
30
7
4 4
Other
External services
Insourcing of critical competencies
Personnel costs
EUR 45 million
© Outotec – All rights reserved
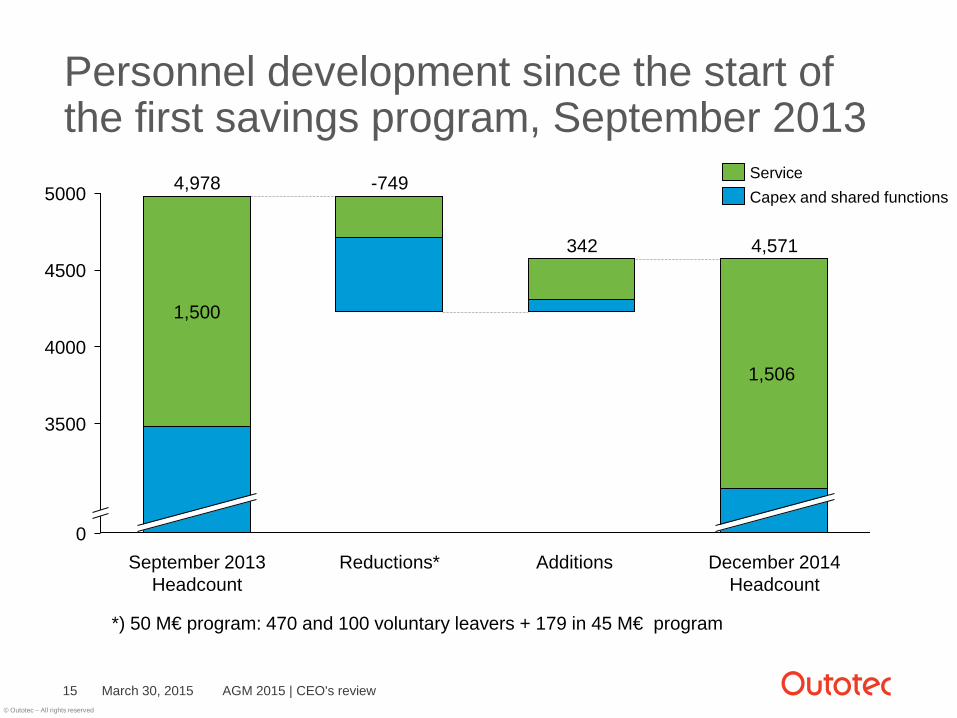
Personnel development since the start of the first savings program, September 2013
March 30, 2015 AGM 2015 | CEO's review 15
*) 50 M€ program: 470 and 100 voluntary leavers + 179 in 45 M€ program
1506
5000
4500
4000
3500
0 December 2014
Headcount Additions**
342
Reductions*
-749
September 2013 Headcount
4,978
1,500
Capex and shared functions Service
4,571
1,506
© Outotec – All rights reserved
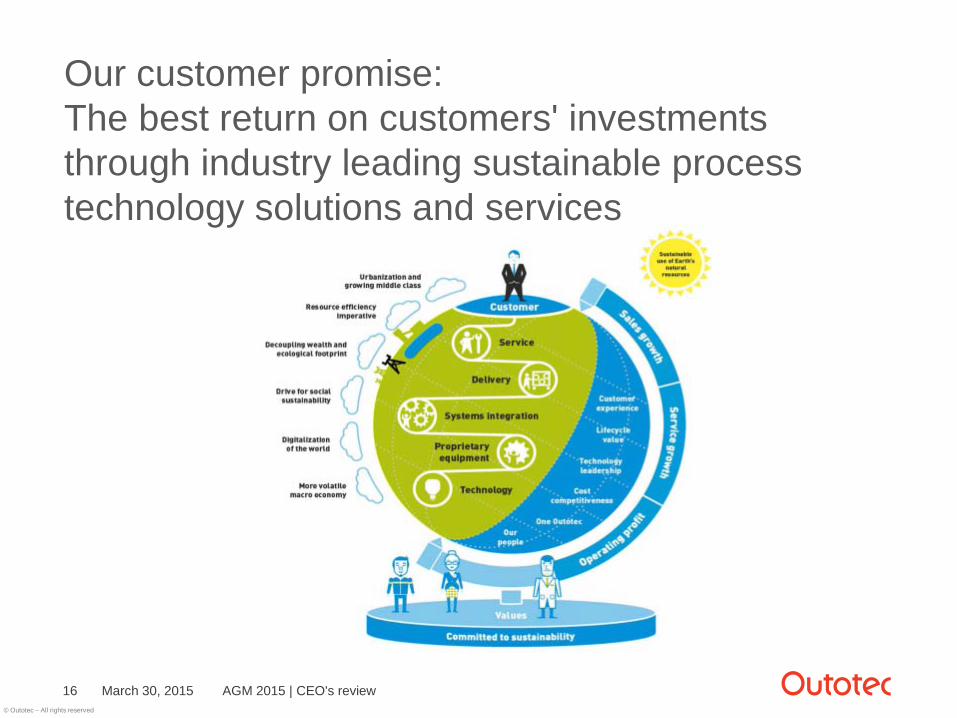
Our customer promise: The best return on customers' investments through industry leading sustainable process technology solutions and services
March 30, 2015 AGM 2015 | CEO's review 16

© Outotec – All rights reserved
The short to mid-term market outlook continues to be challenging
March 30, 2015 AGM 2015 | CEO's review 17
Outotec addressable Capex and Opex spend, EUR bn
Capex includes Outotec’s addressable market for iron ore, copper, gold, alumina, aluminum, nickel, lead and zinc. OPEX includes spares, wears and labor. Sources: Wood Mackenzie, McKinsey, Outotec analysis (Feb 2015)
0
10
20
30
40
50
60
2009 2010 2011 2012 2013 2014 2015 2016 2017 2018 2019 2020
Outotec addressable opex Bull case Bear case Outotec addressable capex
OPEX • The service business is expected to
develop in line with the industry’s production volumes
• Short-term, the customers’ need to reduce operational spending will slow down growth
CAPEX • Metals demand is expected to grow on
average 3-6% per annum in line with global GDP growth driving capex growth
• Capital investments are very cyclical and down by appr. 30% in 2014
© Outotec – All rights reserved
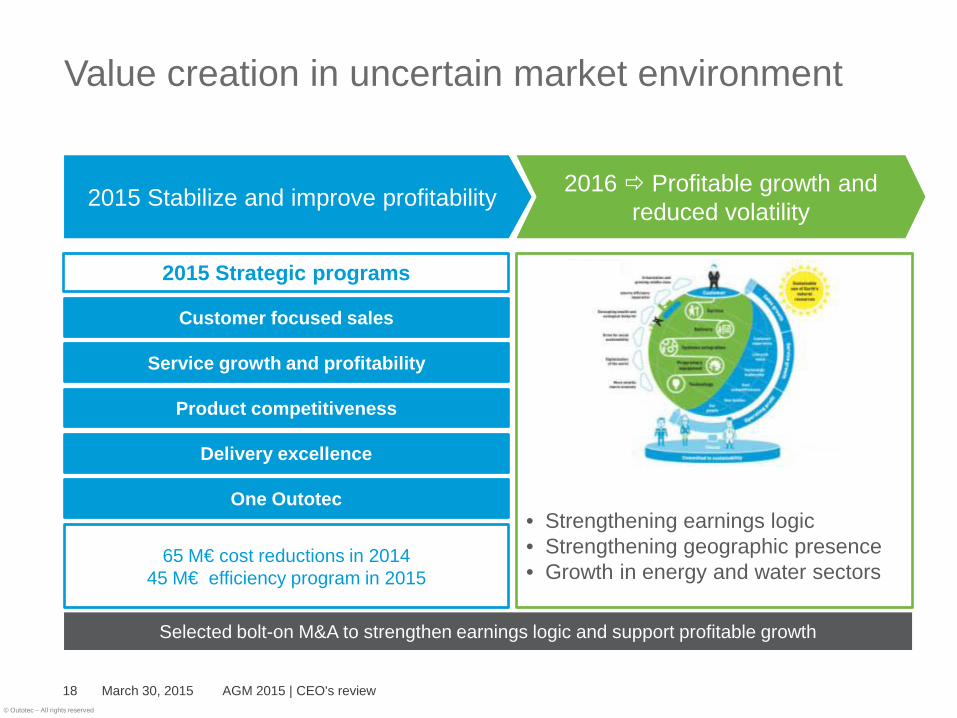
• Strengthening earnings logic • Strengthening geographic presence • Growth in energy and water sectors
Value creation in uncertain market environment
March 30, 2015 AGM 2015 | CEO's review 18
2015 Stabilize and improve profitability 2016 Profitable growth and reduced volatility
Selected bolt-on M&A to strengthen earnings logic and support profitable growth
2015 Strategic programs
Service growth and profitability
Customer focused sales
Product competitiveness
Delivery excellence
One Outotec
65 M€ cost reductions in 2014
45 M€ efficiency program in 2015
© Outotec – All rights reserved
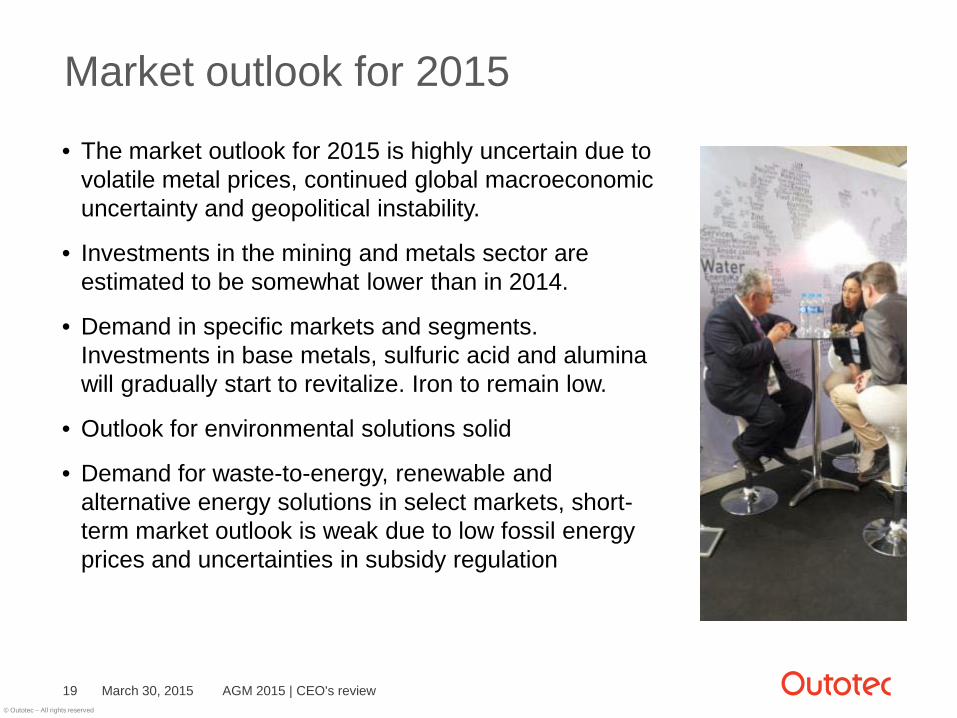
Market outlook for 2015
• The market outlook for 2015 is highly uncertain due to volatile metal prices, continued global macroeconomic uncertainty and geopolitical instability.
• Investments in the mining and metals sector are estimated to be somewhat lower than in 2014.
• Demand in specific markets and segments. Investments in base metals, sulfuric acid and alumina will gradually start to revitalize. Iron to remain low.
• Outlook for environmental solutions solid
• Demand for waste-to-energy, renewable and alternative energy solutions in select markets, short-term market outlook is weak due to low fossil energy prices and uncertainties in subsidy regulation
March 30, 2015 AGM 2015 | CEO's review 19
© Outotec – All rights reserved
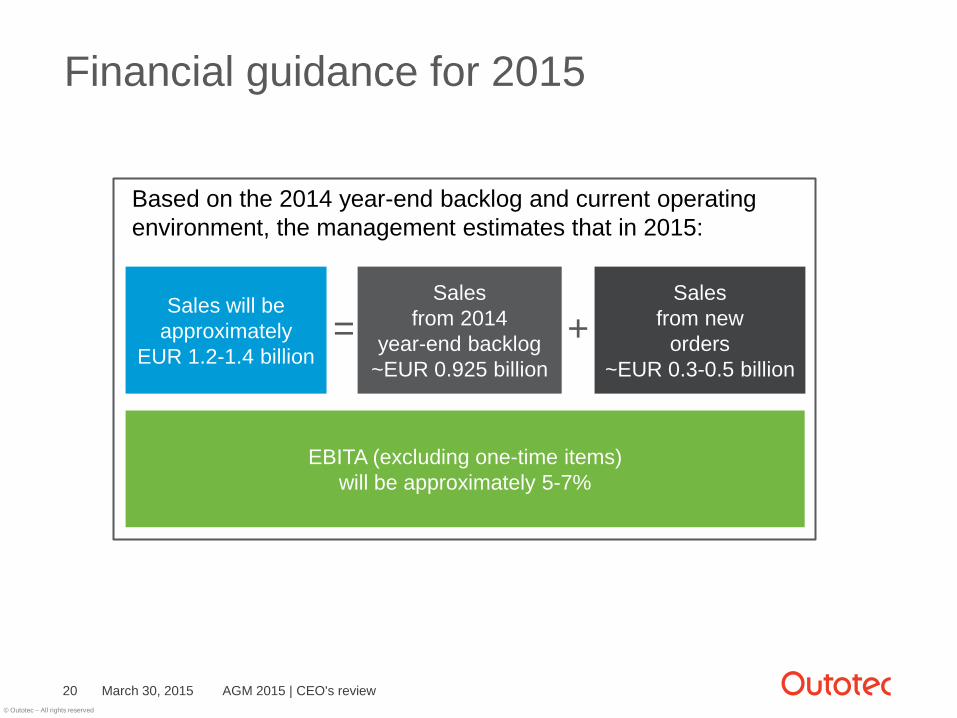
Financial guidance for 2015
Sales from 2014
year-end backlog ~EUR 0.925 billion
Sales from new
orders ~EUR 0.3-0.5 billion
+ = Sales will be
approximately EUR 1.2-1.4 billion
EBITA (excluding one-time items) will be approximately 5-7%
Based on the 2014 year-end backlog and current operating environment, the management estimates that in 2015:
March 30, 2015 20 AGM 2015 | CEO's review

© Outotec – All rights reserved
Dividend proposal
March 30, 2015 AGM 2015 | CEO's review 21
Year represents the dividend payment year
0.09
0.24 0.25
0.18 0.19 0.21
0.30
0.20
0.10
0
20
40
60
80
100
120
140
0,00
0,05
0,10
0,15
0,20
0,25
0,30
0,35
2007 2008 2009 2010 2011 2012 2013 2014 2015*
Payout ratio, % Dividend EUR/share
Dividend / share Payout ratio (%)
Payout ratio 10,500%
Outotec’s dividend policy is average 40% of previous years net income.