centre for new and emerging markets number 30 manuela...
TRANSCRIPT

CENTRE FOR NEW AND EMERGING MARKETS
Discussion Paper Series Number 30
Ownership, Competition and Enterprise Performance
Saul Estrin , London Business School
Manuela Angelucci, University College London
March 2003
Contact details: Anna M Malaczynska Tel: +44 (0)20 7706 6964 Fax: +44 (0)20 7724 8060 www.london.edu/cnem © London Business School, 2003

Non - Technical Summary
In this paper, we use the data from a large enterprise-level survey of Russia to explore the
impact of private ownership and competition on the performance of firms. The transition
process at the enterprise level entailed two major policy initiatives – the creation of a private
sector via privatisation; and the establishment of markets, through price and trade
liberalisation, as the main mechanism for resource allocation. The latter implies an increase
in the competitive pressure faced by incumbent firms. Our aim in this paper is to explore
whether and in what ways enterprise performance was influenced in Russia by privatisation
and by the increase of competition in the marketplace.
The study uses our survey questionnaire of 437 Russian industrial firms in 2000 to develop
measures of ownership, competition and performance. In the transition context, the
traditional focus on state versus private ownership from the western literature has to be
broadened to take account of widespread insider ownership. We are able to compare majority
ownership stakes in 2000 with those at the time of privatisation, in order to follow the
evolution of ownership structure. We find that there have been important changes in
ownership; there has been a major decline in insider and state ownership and an increase in
outsider ownership. Within the group of insider ownership, managers have been increasing
their stake at the expense of workers.
Our measures of competition are perceptual, being the response by senior managers to
questions about the number of significant competitors faced in this marketplace. We define
domestic competition as being high if there are more than five competitors, medium if the
number is between 3 and 5 and low in the case of monopoly and duopoly. The proportions of
firms in the three categories are around 63%, 28% and 10% respectively, which suggests most
Russian firms feel themselves to have a significant degree of competition in their home
market. However, imports are found to be an important source of competition by only 37%
of firms.
Our empirical analysis explores the relationship between ownership, competition and various
measures of enterprise performance. We find clear differences between private and state
owned firms in terms of their restructuring activity, though not between insider and outsider
owned firms. Ownership is not found to influence more traditional measures of economic
performance such as the profitability or productivity however. This is consistent with other
2

surveys of Russian enterprises, and suggests that it is, as yet, still too early to judge the impact
of privatisation in Russia, perhaps because of measurement error or because privatisation took
place before the other relevant capital market institutions were properly developed.
We were also unable to identify any impact of competitive pressures on enterprise behaviour
using financial or economic measures of performance. This is consistent with the results
concerning ownership, highlights issues concerning the quality of Russian quantitative data.
Such data were severely affected at the time the sample was taken by the consequences of the
1998 crash. However, in almost all the measures of managerial activity, including deep
restructuring, defensive restructuring and investment intentions, we identify a positive impact
from the pressures of domestic competition, and sometimes also from import competition.
The findings therefore do emphasise the importance of price and trade liberalisation for the
transition process.
3

ABSTRACT
The literature suggests that competitive forces should be an important element in improving
enterprise performance in transition economies, especially when combined with private
ownership. However, empirical evidence on these issues for Russia has as yet not been
convincing. Our findings are consistent with the literature in being unable to identify clear
differences in performance between insider and outsider owned firms. However, we do find
evidence that competitive pressures influence qualitative indicators of managerial activity,
including deep restructuring and investment intentions.
JEL Classification Numbers: D21, L10, G30
Keywords: corporate governance, competition, firm performance
4
1. Introduction
In this paper, we use the data from our Russia survey to explore the impact of competition on
the performance of firms. The transition process at the enterprise level entailed two major
policy initiatives – the creation of a private sector via privatisation as well as de novo private
enterprise entry and growth; and the establishment through price and trade liberalisation of
markets as the main mechanism for resource allocation (see e.g. World Bank (1996, 2002)).
The latter implies an increase in the competitive pressure faced by incumbent firms and this
may affect enterprise behaviour. Our aim in this paper is to explore whether and in what
ways enterprise performance was influenced in Russia by this increase of competition in the
marketplace, and to identify if other factors acted to consolidate this impact.
There is a growing Western literature, at both a theoretical and empirical level, about the
ways that competition might enhance company performance, (see e.g. Nalebuff and Stiglitz
(1983), Aghion, Harris and Vickers (1997), Nickell (1996), Nickell, Nicolitsas, Dryden
(1997)). The evidence suggests that, at least in the UK, competition has acted to enhance
total factor productivity, though in the context of effective financial markets and shareholder
control. The issue is more complicated in transition countries because, for example,
“restructuring” may be a more important indicator of enterprise performance in the short run
than factor productivity (see Roland (2000), Linz and Krueger (1998)). Moreover, standard
models about the impact of competition assume that the enterprise sector is privately owned
and that budget constraints on firms are hard, including an effective bankruptcy threat. Such
conditions have not often been satisfied in any transition economy until recently (see e.g.
EBRD (2002)) and as the other papers in this issue indicate, certainly did not pertain in Russia
at the time of our survey. Nonetheless, considerable empirical work has been undertaken on
the issue for transition economies (see Djankov and Murrell (2002)), and this suggests that
“product market competition has been a major force behind improvement in enterprise
productivity in transition economies” (Djankov and Murrell (2002)). But clear differences
have emerged concerning how competition affects firms in Central and Eastern Europe and
the CIS; in the latter, import competition is rarely significant but domestic competition is
sometimes found to have a significant effect on company performance. In Central and
Eastern Europe, import competition has been crucial.
Our approach in this paper is more descriptive than in some of the previous studies. Our
survey does not contain information on market structure and its changes. Moreover, the
Russian market is at best only partially integrated, so that one would need to account for
regional as well as sectoral factors in the measurement of competition (see Brown and Earle
5

(2001)), and our dataset, with 11 oblasts and 6 (2 digit) sectors does not contain sufficient
observations for such an approach. However, the data set is rich in information about a
variety of performance measures, and has very interesting perceptual indicators of intensity of
competition from domestic firms and from abroad. Our approach is therefore to explore
empirically the relationship between a variety of performance measures and the “intensity” of
competition, taking account of ownership where possible.
The paper is organised as follows. In the following section we briefly summarise hypotheses
and describe the nature of data with respect to ownership, competition and performance. The
relationship between these variables is presented in the third section, and conclusions drawn
in the fourth.
2. Enterprise Performance and Competition in Transition
It is almost an article of faith for economists that competition is a force for “good”; but this
conclusion derives from welfare economics, and refers primarily to the impact of competition
on the allocation of resources. The effects of competition on the performance of individual
firms are less clear-cut; a Schumpeterian perspective suggests that monopoly power might
enhance innovation and growth, and Chamberlin’s model of monopolistic competition
characterises inefficiency via “excessive” competitive entry. Only quite recently have the
issues for individual enterprise performance begun to be systematically evaluated (see
Holmstrom (1982), Hart (1983), Nalebuff and Stiglitz (1983)). It is widely believed that
competition acts to create a downward pressure on company costs and provides incentives for
efficient organisation, while monopoly is associated with organisational slack and an “easy
life”. Competition is seen as a means to reduce capital-inefficiency within the firm (see
Djankov and Murrell (2002)). Holmstrom (1982), for example, shows that, because of the
greater opportunities for comparison of performance, incentive schemes to motivate
managerial effort will generate sharper incentives, the more players are involved.
Competition makes the monitoring of managerial performance more effective because
unobserved performance or productivity schemes are likely to be correlated across firms
operating in the same industry, and hence managerial effort will rise as the number of firms in
the industry increases.
These arguments seem to have particular force in the transition context. It is arguable that
failure to align owners’ and managers’ incentives and the consequences for company
performance was one of the critical failings of central planning (see Ellman (1989)), and this
6

explains the crucial role of privatisation (handing over monitoring and evaluation of
managerial effort to capital markets) and of price and trade liberalisation (by creating
competitive pressure on firms) during transition (see Blanchard et al (1991)). It is therefore
very important to evaluate whether competition has had the expected effect on managerial
effort, and therefore company performance.
However, the economic and institutional environment of many transition countries is not the
same as that for which the hypotheses discussed above were derived. For example, many
firms remained state-owned (see Bennett, Estrin and Maw (2001)) and it is not clear that
enhanced competition is sufficient to engender improved managerial effort in state-owned
firms. For this reason, Earle and Estrin (1998) explore competition and ownership effects
simultaneously; a method which we repeat in this paper. It is also unclear whether pressures
on managerial incentives from market competition can operate effectively in an environment
of soft budget constraints (see Schaffer (1998)). This implies that, if we fail to isolate any
impact of competition on enterprise performance, one interpretation might be the way
managerial incentives are distorted by the behaviour of the financial system (see Commander,
Dolinskaya and Mumssen (2002)).
3. Measures of Ownership, Competition and Performance
Our study therefore relies on measures of ownership, competition and performance.
Commencing with the former, one would normally seek to distinguish primarily between state
and private ownership (see e.g.Vickers and Yarrow (1988)). There exists an enormous
theoretical and empirical literature (see e.g. Megginson and Netter (2001) for a survey) which
suggests that privately owned firms will perform better, in the sense of total factor
productivity as well as financial measures, than their state-owned counterparts. Djankov and
Murrell (2002) survey the considerable empirical literature on these issues for transition
economies and reach exactly the same conclusion for the economics of Central and Eastern
Europe. However, they remain more circumspect at this stage for Russia and other countries
of the former Soviet Union (see also Estrin and Wright (1999)). An important reason for the
problematic impact of privatisation in much of the CIS has been the very high level of insider
ownership (see Earle and Estrin (1997)). The theory suggests that the privatisation to insiders
may not have the desired effects on managerial effort and enterprise performance (see Earle,
Estrin and Leshchenko (1996)), and Djankov and Murrell (2002) interpret the paucity of
significant results about the positive impact of private ownership on performance in the CIS
as resulting from both the poor quality of the privatisation (widespread insider ownership) and
the relatively weak development of supporting institutions (see EBRD (2000)). An important
7

aspect of our survey is therefore to investigate whether ownership patterns have been
evolving away from insider control towards outsiders in the years since privatisation.
Our survey allows us to explore whether the pattern of ownership was changing in Russia in
the four or five years post privatisation, as was predicted by for example Boycko, Shleifer and
Vishny (1995). We are able to distinguish between all three of the main categories of owner
– insiders (managers plus workers), the state (Federal and Regional Government) and
outsiders (the remainder, including Investment Funds, Banks, other firms and private
individuals). Unfortunately ownership questions were found to be sensitive by our
interviewees, eliciting many more missing values than other questions. Hence, we are not
usually able to break down the ownership categories any further without considerable loss of
information. The only exception is for insiders; in two thirds of firms, it is possible to break
the category down into workers and managers.
Table 1 Ownership by Majority Shareholding Group
At time of
privatisation
On January 1st 2000
Number of
firms
% of firms Number of
firms
% of firms
Insider-owned 279 79.3 217 59.5
Outsider-owned 31 8.8 112 30.7
State-owned 25 7.1 13 3.6
No overall ownership 17 4.8 23 6.3
Total 352 100.0 365 100.0
Source: Author’s calculations
In Table 1, we categorise firms according to groups that own the majority of shares (greater
than 50%). The proportion of firms in each category does not change greatly if we use
alternative indicators of majority shareholder e.g. dominant shareholder (largest single
shareholding group) or a lower majority shareholder threshold (>40%, >35%). The survey
confirms the findings of other studies (see e.g. Estrin and Wright (1999)) that insiders held the
vast majority of shares in privatised firms immediately post-privatisation. Outsiders
controlled a mere 9 % of firms in our survey; a similar proportion to that is identified in other
studies (see e.g. Earle and Estrin, 1997)). However, the small fraction of majority state
shareholding merely reflects our sampling strategy of looking at privatised enterprises (see
8

Appendix to this special issue)1. An important indicator of the evolution of reform is the
changing ownership pattern. If secondary capital markets are effective and liquid, one would
expect to see a significant shift from insider to outsider ownership and this is confirmed by
the data in Table 1. This suggests that, even before the reforms following 1998, outsiders had
been buying shares from insiders to obtain majority control. Insiders had lost majority control
in more than 55 firms, some 15% of the total and 21% of insider firms, while outsiders had
gained majority control in 75 firms, more than double the number that group controlled
originally, mainly from insiders but also from the state dominated category. The period from
around the mid–1990’s until 2000 therefore appears to have been one in which there were
important changes in the underlying pattern of control, in ways that might have favoured
improved corporate governance.
In Table 2, we explore the changing pattern of ownership more thoroughly, using information
about average shareholdings held by each group. The table includes information about the
number of firms upon which the measures are based, which varies depending on the category
of owner, because of missing values. Although there has been a decline in shareholdings by
insiders overall, Table 2 indicates (on a smaller sample) that this masks a large decline in
worker ownership but an increase in share ownership by managers. Managers have increased
their stake by almost 30% since privatisation. The evolution in dominant ownership we saw
in Table 1 is explained by the fact that outsider ownership has doubled since privatisation and
now accounts for about one third of shares, almost as much as workers and considerably more
than managers. Though relying on an even smaller proportion of the sample, we can add the
following about outsiders. About half of the shares in the hands of outsiders are under the
ownership of other Russian firms, with the rest divided between banks and investment
companies, foreign firms, and ‘others’. Outsider ownership is also closely correlated with
concentrated ownership: 38 percent of outsider-owned firms had 2-3 shareholders controlling
50 percent or more of the shares, versus only 7 percent of insider-owned firms. This suggests
that outsiders may have been more effective in addressing corporate governance issues in
firms where they control majority stakes. It could also reflect selection bias by outsiders,
who only invest in firms where they can purchase significant stakes. Outsiders tend to hold
small stakes in firms that remain insider-controlled; the average outsider shareholding in
1 The fact that there are hardly any majority state-owned firms in our sample arises because
Russian sources define a firm to be privatised if any of its shares have been sold, rather than
when a majority have been sold. Retained stated shareholding was actually rather high in
Russia at the time when most firms were privatised (see Bennett, Estrin and Maw (2001)).
9

insider-owned firms is only 11 percent, versus the 24 percent shares owned by insiders in
outsiders-owned firms.
Table 2 Change in Share Ownership by Major Category
At time of
privatisation
On January 1st 2000 Change
Number
of firms
% of
shares
Number
of firms
% of
shares
Number
of firms
% of
shares
Insiders, of which: 351 71.8 364 62.3 339 -9.5
Managers 216 12.7 229 17.7 201 3.8
Workers 216 54.0 229 34.5 201 -19.9
Outsiders 351 16.0 364 32.0 339 16.1
State 351 12.2 364 5.7 339 -6.6
Source: Authors’ calculations
Our measures of competition are perceptual, being the responses by senior managers to
questions about the number of significant competitors faced in “their market place” (regional,
national or global)2. We use two measures of competition – domestic competition and import
competition – because transition theory has stressed the role of trade in increasing competitive
pressures on firms (see e.g. World Bank (1996)). Domestic competition is defined as “high”
if there are more than five competitors in the same market; “medium” if the number of
competing firms is between 3 and 5; and “low” in the case of monopoly and duopoly3. We
find the proportion of firms in the three categories to be 62.7%, 27.5% and 9.7% respectively.
Thus the survey indicates that most Russian firms face a significant degree of competition in
their relevant markets; a finding echoing previous studies (see e.g. Earle and Estrin (1998)
and Brown and Earle (2001)).
2 The bulk of firms in our survey define their market in regional or national Russian terms.
For almost every firm the percentage of sales derived from Krai/oblast or Russian Federal
level exceeds 50%. In the entire sample of 437 firms, only 13 sell primarily abroad. 3 The relevant geographical dimension is employed at all times. If a firm competes on the
“market” only at the krai/oblast level, then only its krai/oblast competitors are counted, etc.
10

The only measure of foreign competition is a categorical variable showing whether or not
firms face significant competition from imports. Imports are found to be a significant source
of competition in the market by only 37% of firms; rather a low proportion given that the
regional composition of our sample includes many of the main conurbations. In Table 3, we
present cross-tabulations of the two measures. It can be seen that a significant proportion of
Russian firms face high domestic and import competition; more than 25% of the total in the
sample. In contrast, only 7% of firms face little competition in their relevant markets, either
from domestic or foreign competitors. Moreover, import competition plays some role in
limiting firms in areas of higher domestic monopoly power – 28% of firms facing medium
domestic competition and 25% of firms facing low domestic competition instead face
significant import competition. Thus, competitive pressures on firms in Russia are perhaps
higher than one might expect, at least in the relatively industrial and open oblasts chosen for
this survey.
Table 3 Distribution of Firms According to Domestic and Foreign Competition
Categories
Import competition Domestic competition
1=yes 0=no 1
high
2
medium
3
low
Total
0 144 (60%) 75 (72%) 28 (75%) 247
1 103 (40%) 31 (28%) 9 (25%) 143
Total 247 106 37 390
Source: Authors’ calculations
The survey allows us to explore the robustness of our competition measures by comparing
firms’ responses on the number of competitors to their estimate of the demand impact of
price change. Respondents are asked what the likely demand impact of a 10 percent price
increase of their major product would be. We find 62.2% of high-competition firms expect a
sales drop greater than 10 percent, and only 38.2% have a price elasticity of demand less than
unity. The equivalent values for low and medium competition enterprises are 35.5 percent
and 64.5 percent respectively. The differences are significant at the 95 % level. This pattern
strengthens our confidence in the categorisation of competitive pressures faced by firms.
11

The Western literature on enterprise performance tends to concentrate on total factor
productivity (see e.g. Nickell (1996)) or financial indicators such as return on equity (see e.g.
Megginson and Netter (2001)). There are great difficulties in using the same indicators in
transition economies, not least because of problems with accounting standards, measurement
of capital and reliability of profit data (see Commander et al (1996) for a discussion in the
Russian context). In this study, we have followed the literature (see e.g. Frydman et al
(1999)) in using a variety of measures including productivity, profitability, investment rates
and restructuring. The latter is of particular importance since it measures managerial
activities to alter the performance of the firm that may or may not in the short term be
associated with financial measures of company performance (see Estrin and Rosevear
(1999)). Restructuring is notoriously difficult to measure, and we addressed the issue in the
design of the survey by asking managers a number of questions about their restructuring
activities, ranging from the introduction of new products and services or quality enhancing
innovation to sale or leasing out real estate and the shedding of excess labour. Managers were
asked to categorise their activities up to 1999: (1) engaged in a specific activity in 1997, 1998
and/or 1999 (answered separately); (2) didn’t engage in the activity 1997-99 because it was
already done; (3) didn’t engage in it because firm never needed to do it; or (4) should have
engaged in it but have not done so. There are a number of ways of combining these data into
summary measures but for this initial exercise we focus on the simplest possible one: whether
the firm chose to engage in restructuring activity at all between 1997 and 1999.
12

Table 4 Deep and Defensive Restructuring Deep
restructuring
Total
number
of firms
% of firms
engaged in
restructuring in
1997-99
Defensive
restructuring
Total
number
of firms
% of firms
engaged in
restructuring in
1997-99
Introduction of new
products and
services
435 54.9 Liquidation of
unprofitable products
426 46.0
Moves to new
markets
423 75.7 Cuts in social
provision
425 52.7
Improved marketing 428 71.7 Shedding excess
labour
431 56.1
Energy-saving
innovation
420 53.6 Sale or leasing-out of
excess equipment
431 45.0
Labour and
material-saving
innovation
425 52.0 Sale or leasing-out of
real estate
428 47.7
Quality-raising
innovation
423 66.7
Source: Authors’ calculations
Table 4 presents the percentages of firms that engaged in various restructuring measures in
1997-99, grouping measures under the headings of “deep restructuring” (e.g., introducing new
products or moving into new markets) and “defensive restructuring” (e.g., labour shedding or
liquidating plant or product lines).
Many observers have found it useful to divide restructuring into activities that are primarily
reactive, and those which suggest that the firm is making the internal changes required to
permit it to function effectively in a market environment (see Estrin, Gelb and Singh (1995),
Roland (2000)). In this paper, we adopt the classification proposed by Carlin et al (2001) and
divide restructuring activities into “deep” and “defensive”. The percentage of firms engaged
at all during the sample period in each of the major restructuring activities in presented in
Table 4. It can be seen the defensive activities are on average rather less common than deep
ones, which might at first seem an encouraging finding. Indeed, it could indicate a sequence
13

in restructuring whereby defensive restructuring measures had already been undertaken and
deeper ones were now underway. However this is not entirely convincing, given the
relatively poor state of Russian industry in this period. The high mean values could also
reflect optimistic evaluations of their own performance by our respondents. In our later work,
we therefore concentrate on the relative ranking of firms in terms of restructuring and on the
time path of restructuring activity.
Following Carlin et al. (2001), we have gone on in later work to condense these measures of
restructuring into composite deep and defensive restructuring indices using the method of
principal components. In both cases, the eigenvector of the first principal component
provides the weights to be applied to the component restructuring indices when constructing
the composite index. The method also allows a check of whether a composite index is
sensible, i.e., whether it is measuring some underlying deep or defensive restructuring
activity. In the case of the deep restructuring composite index, the first principal component
(out of six) explains 38 percent of the variance in the six deep restructuring indices; the next
most important component explains less than half of that. Similarly, the first principal
component for the five defensive restructuring activities explains 36 percent of the variance.
4 The Impact of Ownership and Competition on Performance
In the section, we first explore the interaction between competition, ownership and a number
of important control variables. We then go on to investigate how competition, interacted with
ownership, affects a variety of indicators of enterprise performance.
4.1 Ownership and Performance
Commencing with ownership, the literature suggests that enterprise performance was not
greatly influenced by ownership per se in Russia in the early years of transition (see e.g.
Djankov and Murrell (2002)). In this paper, our focus will be on the interactions between
state ownership and competition and their effects on enterprise performance. As noted
above, one would not necessarily expect the prediction about the enhanced performance
of firm operating in a more competitive product market environment to carry over to
environments where the enterprise in question was state-owned. Moreover, one would
expect state ownership to exacerbate the tendencies to inefficiency and slack engendered
by monopoly power.
14

Because the Russian privatisation process led to such an unusual structure of ownership,
with relatively few outside owners of the type typical in Western economies, the literature
has also addressed the issue of how different forms of majority ownership have affected
company performance. This issue is peripheral to our main theme, because there are no
obvious reasons for expecting fundamental differences in terms of the impact on company
performance between the interactions of competition with insider and outsider ownership.
However, for the sake of completeness, we present some findings on the performance–
ownership question4. Our approach is to compare performance in insider and outsider
owned firms using a large variety of performance measures – value added per worker,
change in productivity, employment growth, investment rates, export shares and the two
composite measures of restructuring. The findings are reported in Table 5. We note that
insider owned firms have slightly higher productivity and export shares, and slightly
smaller (fall in) employment and investment share. They also undertook slightly more
deep restructuring and slightly less defensive restructuring. The fall in productivity
growth is larger in outsider than insider owned firms. However, none of these differences
is statistically significant at even the 90% level. Hence we conclude that our survey
confirms the findings of numerous other studies about Russia: that in 1999 ownership
changes had not yet begun to have a significant effect on company performance (see
Djankov and Murrell (2002)).
Table 5 The Effect of Ownership on Performance, 1997-1999 Value
Added/
worker
Real
Productivity
Growth
Employment
Growth
Investment
Rates (I/K)
Export
Share
Restructuring
Index
Deep Defensive
Total 65.8 -3.7 -7.5 7.4 4.4 61.9 49.0
Insider
Owned
62.7 -1.8 -9.3 6.2 4.8 62.2 49.5
Outsider
Owned
64.9 -3.2 -9.9 7.8 4.3 61.4 55.8
Source: Author’s calculations
4 The ownership structure may to some extent be endogenous, if the ?actors who control the privatization process (e.g. insiders) select ownership on the basis of performances. It is in principle very hard to address this problem using cross-section data. However, our data set contains information about ownership back to the time of privatization, which is likely to be exogenous to current performance. Our findings are not significantly affected if we use initial ownership structure rather than current ownership structure.
15

The relationship between ownership and competition will depend on the sequence and
method of privatisation chosen. One could imagine, for example, that governments
seeking to maximise revenue would sell profitable firms first (see e.g. Gupta, Ham and
Svejnar (2000)) and hence one might be expect a positive correlation between private
ownership and monopoly power. Alternatively, the authorities might seek to retain firms
with significant monopoly power in state hands, in order to develop regulatory
mechanisms or to share in the monopoly profits , while disposing of firms operating in a
more competitive environment. The cross-tabulations between state and private
ownership on the one hand, and the two indicators of competition on the other, are
contained in Table 6. Some groups are small because, as noted above, the sample
contains relatively few majority state-owned firms, but it can be seen that there are almost
no state owned firms in the low competitive category. This is consistent with the view
that the state chose to privatise firms with significant domestic monopoly power, though
import competition does not appear to have entered their calculations.
Table 6 Ownership of Firms and Competition Level
Domestic competition Import competition
1 2 3 high medium low
Total 0 1 Total
No Yes
State owned 8 2 1 11 10 3 13
Private owned 205 92 33 350 207 124 331
Total 215 94 34 343 217 129 346
Source: Authors’ calculations
It is also important to explore the regional and sectoral pattern of competition in our
sample. In fact, the variation in our perceptual measures within region is comparable to
that between regions, and differences are not statistically significant The only region
where high levels of domestic competition are more common are Krasroyansk, and
perhaps slightly in the more isolated centres such as Perm. Unsurprisingly, rather more
16

firms in Moscow and Moscow region have reported import competition than in other
regions (more than 50% as against less than 40% in the sample as a whole). There is also
no significant relationship between the available indicator of the firm’s sector, measured
at the two-digit level, and our measure of domestic competition. Around 10% of firms in
every sector indicate that they have low levels of competition, except for machine tools
and metal working where the proportion is closer to 20%, though the difference is not
statistically significant. Import competition is found to be slightly but significantly
higher in light industry and chemicals.
4.2 The Impact of Competition on Performance
In this section, we explore the relationship between the performance of the firm –
measured by restructuring, productivity, financial performance and investment – and the
two measures of competition. In the regression analysis, we control for firm size,
industry, location and ownership structure.
4.2.1 Competition and Restructuring
As noted above, the questionnaires report information on fifteen possible reforms, asking
whether they have been implemented between 1997 and 1999, and, if not exploring some
possible reasons for it. We now seek to use the richness of the measures more fully.
Therefore, in addition to dividing the activities into deep and defensive restructuring, we
investigate the intensity of restructuring:
- continuous, if the firm has restructured constantly between 1997 and 1999
- one-off, for firms which have undertaken the various reforms once between 1997
and 1999
- missed, if reforms were needed but could not be implemented.
The indices range between zero and one. Hence, a firm that has undertaken all the deep
reforms every year between 1997 and 1999 will have the maximum score of one in its
deep, continuous” index5. The results are reported in Table 7. First, the data confirm
5 The use of more than one measure is advisable because none is devoid of ambiguity.
Continuous restructuring might be seen both as a sign of “virtuous behaviour” and a failure to
succeed at the first time. Exactly the opposite can be said of the one-off index. The third
indicator could be biased because the incentive not to admit the failure to implement
necessary reforms (and to provide wrong information instead) is quite high.
17

that firms engage more in deep than defensive reforms. For the latter, companies have
undertaken less than half of the reforms they were asked about, and less than a quarter of
them continuously. The equivalent values for deep reforms are all significantly higher.
Firms have undertaken 60 percent of them at least once between 1997 and 1999, of
which more than one half have been done continuously.
Table 7 Restructuring Indices and Competition
Domestic competition Foreign competition
High Medium Low Yes no
Deep, continuous .363
(.319)
.382
(.329)
.286
(.309)
.402
(.318)
.341
(.324)
Deep, one off .630
(.285)
.635
(.289)
.564
(.321)
No difference
Deep, missed No difference (overall mean = .160)
Defensive, continuous .244
(.264)
.220
(.251)
.190
(.207)
.247
(.263)
.230
(.256)
Defensive, one off .488
(.306)
.519
(.287)
.460
(.275)
.518
(.308)
.482
(.291)
Defensive, missed .032
(.089)
.040
(.089)
.040
(.092)
No difference
(overall mean = .037)
Note: Standard deviations are in parentheses.
Group-specific mean values are reported only when the differences are significant
Source: Authors’ calculations
Table 7 also provides evidence of a positive association between deep restructuring and
competition, both domestic and foreign. Firms in highly and medium competitive
domestic markets restructure more than those in concentrated environments, both
intermittingly and continuously. The same applies to firms facing import competition.
Turning to defensive reforms, we once again see more restructuring in almost every
category in firms with high rather than low domestic competition and foreign
competition. However, foreign competition does not seem to affect missed restructuring,
whether deep or defensive. Thus the raw data seem to indicate that the predicted
relationship between competition pressure and restructuring does hold in Russia in the
sample period. However, the small size of the mean differences between competition
18

groups suggests the need for further work. Our approach is to use regression analysis,
estimating the following model:
R = f(DC, IC, size, sector, ownership, region) (1)
where R is a measure of restructuring, DC and IC are dummy variables for our measures
of domestic and international competition respectively, firm size is measured by
employment and ownership by a dummy variable for majority state ownership. We
include firm size because we wish to allow for the possibility of economies of scale in
restructuring. Industry dummies control for demand and technical differences between
firms, and regional dummies for local demand and institutional factors.
We run separate regressions for each of the six restructuring variables (deep restructuring,
continuous (C), one-off (OF) and Missed (M) and the same three groups for defensive
restructuring). We also report regressions in which competition is interacted with
ownership to test the complementary effects discussed above. The results are summarised
in Table 8, which reports the sign of the significant coefficients in each of the twelve
regressions6. The regressions confirm the findings of table 7 that competition is
influencing restructuring. Firms in highly concentrated markets engage in less deep
restructuring (both continuous and one-off) than highly competitive ones, and to some
extent in less defensive restructuring as well. Firms facing medium competition miss
more reforms. There are also some private ownership effects. Defensive restructuring is
positively correlated with state ownership and a significant interaction of ownership with
competition is found. Thus the regressions broadly confirm our hypotheses about the
impact of competition on restructuring, and the significant joint role of private ownership.
6 The regressions are available in an Appendix to this paper.
19

Table 8 Competition and Restructuring — Regression Analysis — Significant Coefficients
Deep restructuring Defensive restructuring
C C+I OF OF+I M M+I C C+I OF OF+I M M+I
State +
DC-Med
dom
+ + - - + +
DC-Lo
dom
- - - - - -
IC
Med*state - +
Lo* state
IC* state - + +
Note: C = continuous restructuring
OF = one-off restructuring
M = missed restructuring
I = interactions
Signs are reported if coefficients are significant at the 10 % level or above
Med dom = medium domestic competition dummy
Lo dom = low domestic competition dummy
State = dummy for majority state ownership
Source: Authors’ calculations
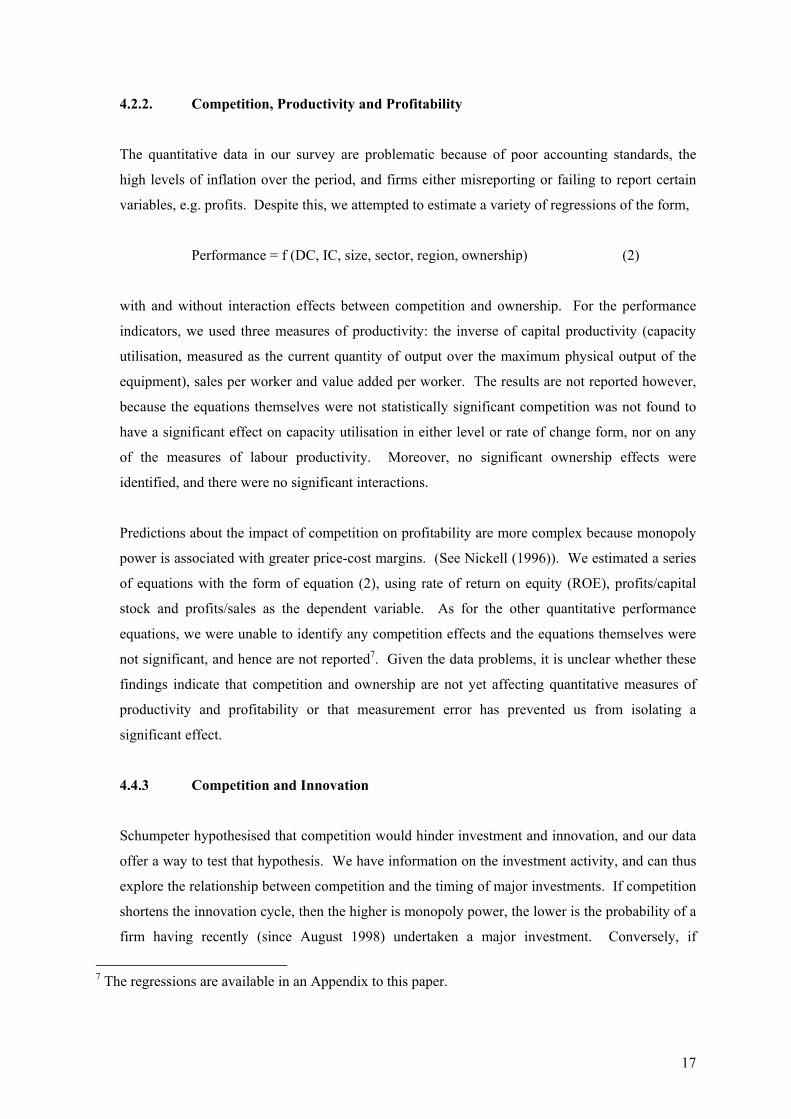
4.2.2. Competition, Productivity and Profitability
The quantitative data in our survey are problematic because of poor accounting standards, the
high levels of inflation over the period, and firms either misreporting or failing to report certain
variables, e.g. profits. Despite this, we attempted to estimate a variety of regressions of the form,
Performance = f (DC, IC, size, sector, region, ownership) (2)
with and without interaction effects between competition and ownership. For the performance
indicators, we used three measures of productivity: the inverse of capital productivity (capacity
utilisation, measured as the current quantity of output over the maximum physical output of the
equipment), sales per worker and value added per worker. The results are not reported however,
because the equations themselves were not statistically significant competition was not found to
have a significant effect on capacity utilisation in either level or rate of change form, nor on any
of the measures of labour productivity. Moreover, no significant ownership effects were
identified, and there were no significant interactions.
Predictions about the impact of competition on profitability are more complex because monopoly
power is associated with greater price-cost margins. (See Nickell (1996)). We estimated a series
of equations with the form of equation (2), using rate of return on equity (ROE), profits/capital
stock and profits/sales as the dependent variable. As for the other quantitative performance
equations, we were unable to identify any competition effects and the equations themselves were
not significant, and hence are not reported7. Given the data problems, it is unclear whether these
findings indicate that competition and ownership are not yet affecting quantitative measures of
productivity and profitability or that measurement error has prevented us from isolating a
significant effect.
4.4.3 Competition and Innovation
Schumpeter hypothesised that competition would hinder investment and innovation, and our data
offer a way to test that hypothesis. We have information on the investment activity, and can thus
explore the relationship between competition and the timing of major investments. If competition
shortens the innovation cycle, then the higher is monopoly power, the lower is the probability of a
firm having recently (since August 1998) undertaken a major investment. Conversely, if
7 The regressions are available in an Appendix to this paper.
17

monopoly power provides a financially more secure environment for investment, and relaxes
financial constraints on the firm, the impact will go the other way.
We regress a binary variable, coded one if such an investment occurred since 1998 against
competition, controlling once again for industry, firm size, region and ownership. The results are
reported in Table 9. In the basic model (without interactions) we find no significant effect from
domestic competition but that foreign competition significantly increases the probability of
investment. As expected, state-ownership reduces investment but the effect is not quite
statistically significant. The results are strengthened once interactions are included. Foreign
competition increases the probability of investment, especially when the firm is privately owned.
Once again, we find that competition enforces rather than hinders company performance in this
important aspect of restructuring.
Table 9 Logistic Regressions of Probability of Undertaking Major Investment in Fixed
Capital Since August 1998
Probability of undertaking
investment
Basic model Interactions
Controls for:
Size
Region Not significant Not significant
Industry
State ownership - (p-value=0.111) Not significant
Domestic competition:
Medium Not significant Not significant
Low Not significant Not significant
Foreign competition:
Yes .549 (p-value=0.065) .745 (p-value=0.022)
Interaction of state ownership and
foreign competition
--- -.042 (p-value=0.097)
Source: Authors’ calculations
18

5 Conclusions
The literature has suggested that competition will be an important element in the transition process,
especially when combined with privatisation so that the former links between the enterprise sector and
the state are weakened (see Blanchard et al (1991), Stiglitz (1999)). However, empirical evidence to
date for Russia and the CIS countries has not strongly supported these hypotheses; ownership effects
have been difficult to identify in previous surveys and the evidence about the import of competition,
especially import competition, has been decidedly mixed (see Djankov and Murrell (2002)).
Our survey, which uses data from Russian enterprises several years after privatisation, allows us to
revisit these issues at a time when firms could have begun to address internally the difficulties raised
in a dramatic fashion by the liberalisation strategy from 1992 and mass privatisation after 1993.
Sufficient time should have elapsed by 1999 for us to be able to begin to discern fundamental
behavioural changes from the statistical noise generated by the shocks to the economic environment
caused by the reforms from 1992-1994. On the other hand, our sample period includes the year of the
economic crash in 1998, which seems likely to distort a number of our variables. In particular,
nominal variables determined largely on the demand scale, like sales or value added, will be
influenced by the decline in domestic demand in 1998/9, and measurement error could be increased
by the higher inflation rates post-1998, especially given the inadequacy of disaggregated price and
cost deflators in Russia.
These phenomena help us to explain some of the main results in this paper. We do identify clear
behavioural differences between majority state owned and private firms, especially with respect to
restructuring activity. However, along with much of the literature, we continue to be unable to
identify clear differences in performance between insider and outsider owned firms. There are a
number of possible interpretations for this. One is that insider ownership is not as damaging in the
short term in Russia as economic theory might suggest, because information asymmetries yield
advantages to incumbent managers; because of selection effects whereby managers and workers were
able to purchase “better” firms; and because in a context of managerial scarcity, the best managers are
concentrated in insider owned firms where they can obtain a higher share of the rewards from
successful company performance. Capital market weaknesses may also make it much harder for
outsiders to impose effective corporate governance. It may also still be too early to judge the impact
of privatisation on performance. There clearly has been a reallocation of shareholding since the
initial privatisations, with a move to outsider stakes and increased concentration of ownership. In the
longer term, this may have profound effects on company performance, but they are not yet visible in
our data set.
19

The thrust of this paper has been about the impact of competition upon enterprise performance. The
findings have been encouraging and emphasise the importance of price and trade liberalisation for the
transition process. We have been unable to identify any impact of competition using financial and
economic measure of performance, but as noted above such data were severely affected at the time the
sample was taken by the consequences of the 1998 crash. However, in almost all measures of
managerial activity, including deep restructuring, defensive restructuring and investment intentions,
we identify a positive impact from domestic competition, and sometimes also from import
competition.
However, the paper confirms the view that transition reforms cannot be undertaken piecemeal because
their impact is complementary. In particular, competition has a more emphatic effect on performance
in majority privately owned firms than in stat owned ones. Privatisation and liberalisation activities,
including trade policies, therefore need to go hand in hand.
20
References
Aghion, Philippe, Christopher Harris and John Vickers. 1997. “Competition and Growth with Step-by-Step Innovation: An Example,” European Economic Review 41, p.771-782.
Bennett, John, Saul Estrin and James Maw. 2001. “Mass Privatisation and Partial State Ownership of Firms in Transition Economics.” CEPR Discussion Paper no.2895, London: CEPR.
Blanchard, Olivier, Rudiger Dornbusch, Paul Krugman, Richard Layard, and Lawrence Summers. 1991. Reform in Eastern Europe, Cambridge, Mass.: MIT Press.
Boycko, Maxim, Andrei Shleifer and Robert Vishny. 1995. Privatizing Russia. Cambridge, Mass.: MIT Press.
Brown, David and John Earle. 2001. “Privatization, Competition and Reform Strategies: Theory and Evidence from Russian Enterprise Panel Data,” CEPR Discussion Paper no.2758, London: CEPR.
Carlin, Wendy, Steven Fries, Mark Schaffer and Paul Seabright. 2001. “Competition and Enterprise Performance in Transition Economies: Evidence from a Cross-Country Survey,” WDI Working Paper no. 376, Michigan: William Davidson Institute.
Commander, Simon, Qimiao Fan and Mark Schaffer, (eds.). 1996. Enterprise Restructuring and Economic Policy in Russia. Washington: World Bank.
Commander, Simon, Irina Dolinskaya and Christian Mumssen. 2002. “Determinants of Barter in Russia: An Empirical Analysis,” Journal of Development Economics, 67 (2), p.275-307.
Djankov, Simeon, and Peter Murrell. 2002. “Enterprise Restructuring: a Quantitative Survey,” Journal of Economic Literature 40 (3), p.739-792.
Frydman, Roman, Cheryl Gray, M. Hessel and Andrzej Rapaczynski. 1999. “When Does Privatization Work? The Impact of Private Ownership on Corporate Performance in the Transition Economies,” Quarterly Journal of Economics 114 (4), p. 1153-1191.
EBRD. 2000. Transition Report 2000: Employment, Skills and Transition, London: EBRD.
EBRD. 2002. Transition Report 2002: Agriculture and Rural Transition, London: EBRD.
21

Earle, John, Saul Estrin and Larisa Leshchenko. 1996. “Ownership Structures, Patterns of Control, and Enterprise Behavior in Russia,” in Commander, S., Q. Fan and M. Schaffer (eds), Enterprise Restructuring and Economic Policy in Russia, Washington: World Bank.
Earle, John and Saul Estrin. 1997. “After Voucher Privatization: The Structure of Corporate Ownership in Russian Manufacturing Industry,” CEPR Discussion Paper no.1736, London: CEPR.
Earle, John and Saul Estrin. 1998. “Privatization, Competition and Budget Constraints: Disciplining Enterprises in Russia,” Working Paper no.128, Stockholm: Stockholm Institute of Transition Economics.
Ellman, Michael. 1989. Socialist Planning. Cambridge: Cambridge University Press.
Estrin, Saul, Alan Gelb and Inderjit Singh (1995), “Shocks and Adjustment by Firms in Transition: A Comparative Study,” Journal of Comparative Economics 21(2), p. 131-153.
Estrin, Saul and Mike Wright. 1999. “Corporate Governance in the Former Soviet Union: An Overview,” Journal of Comparative Economics 27(3), p.398-421.
Estrin, Saul and Adam Rosevear. 1999. “Enterprise Performance and Ownership: The Case of Ukraaine,” European Economic Review, 43(4), p. 1125-1136.
Gupta, Nadini, John Ham and Jan Svejnar. 2000. “Priorities and Sequencing in Privatization:
Theory and Evidence from the Czech Republic,” The William Davidson Institute and the
University of Michigan Business School, mimeo.
Hart, Oliver. 1083. “The Market Mechanism as an Incentive Scheme,” Bell Journal of Economics, 14, p. 366-82.
Holmstrom, Bengt. 1982. “Moral Hazard in Teams,” Bell Journal of Economics, 13, p. 324-40.
Linz, Susan and Gary Krueger. 1998. “Enterprise Restructuring in Russia’’ Transition Economy: Formal and Informal Mechanisms,” Comparative Economic Studies 40(2), p. 5-52.
Megginson, William, and Jeffry Netter. 2001. “From State to Market: A Survey of Empirical Studies on Privatization,” Journal of Economic Literature, 39 (2), p. 321-389.
Nalebuff, Barry and Joseph Stiglitz. 1983. “Prizes and Incentives: Towards a General Theory of Compensation and Competition,” Bell Journal of Economics, 14(1), 21-43.
22

Nickell, Stephen. 1996. “Competition and Corporate Performance,” Journal of Political Economy 104(4), p.724-746.
Nickell, Stephen, Daphne Nicolitsas and Neil Dryden. 1997. “What Makes Firms Perform Well?” European Economic Review 41, p. 783-96.
Roland, Gerard. 2000. Transition and Economics: Politics, Markets and Firms. London: MIT Press.
Schaffer, Mark. 1998. “Do Firms in Transition Economies Have Soft Budget Constraints? A Reconsideration of Concepts and Evidence,” Journal of Comparative Economics 26, p. 62-79.
Stiglitz, Joseph. 1999. “Whither Reform?” 1999 ABCDE Conference. Washington D.C.: World Bank.
Vickers, John and George Yarrow. 1988. Privatization: An Economic Analysis. Cambridge Mass.: MIT Press.
Vickers, John. 1994. Concepts of Competition. Oxford: Clarendon.
World Bank. 1996. World Development Report: From Plan to Market. Washington, DC:
Oxford University Press.
World Bank. 2002. Transition: The First Ten Years. Washington, DC: World Bank.
23

Appendix
Saul Estrin and Manuela Angelucci
24

Table A1 Number of Enterprises: Coverage in terms of Size and Industry*
GOSCOMSTAT/Survey: Number of enterprises by industry&size
Industry code
Total GKS**
Total Survey
Survey/ GKS %
Size group1,
GKS
Size group1,
Surv
Survey/ GKS %
Size group2,
GKS
Size group2,
Surv
Survey/ GKS %
Size group3,
GKS
Size group3,
Surv
Survey/ GKS %
Total Industry 10 25446 10772 2273 2137
Selected industries 20104 437 2.2 8862 147 1.7 1789 139 7.8 1510 139 9.2
Chemicals 13 644 56 8.7 257 9 3.5 68 16 23.5 179 31 17.3 Machinery 14 6445 108 1.7 2694 29 1.1 661 25 3.8 873 54 6.2 Wood 15 2702 66 2.4 1188 37 3.1 252 16 6.3 141 13 9.2 Stone&clay 16 2060 72 3.5 1231 24 1.9 177 29 16.4 50 19 38.0 Light 17 3038 72 2.4 1071 28 2.6 211 33 15.6 130 11 8.5 Food 18 5215 63 1.2 2421 20 0.8 420 20 4.8 137 23 16.8
* Size Group 1: =>100 <=500; Size Group 2: > 500 <=1000; Size Group 3 >1000 <=5000 ** Goskomstat data refers only to medium and large enterprises Source: Authors’ calculations
25

Table A1 Restructuring Indices — Deep Restructuring (1) (2) (3) (4) (5) (6) Moscow reg -0.175 -0.175 -0.084 -0.086 0.033 0.036 (2.31)* (2.30)* (1.23) (1.26) (0.63) (0.67) St Petersburg -0.221 -0.223 -0.099 -0.090 0.048 0.045 (2.66)** (2.66)** (1.31) (1.19) (0.82) (0.76) St Petersburg reg 0.016 0.014 -0.032 -0.025 0.098 0.097 (0.11) (0.09) (0.24) (0.18) (0.95) (0.94) Nizhny novgorod -0.101 -0.102 0.035 0.037 0.004 0.006 (1.37) (1.37) (0.52) (0.54) (0.09) (0.11) Samara -0.114 -0.116 -0.034 -0.031 0.036 0.036 (1.36) (1.36) (0.45) (0.40) (0.61) (0.60) Ekaterinburg -0.182 -0.183 -0.067 -0.067 0.042 0.044 (2.44)* (2.42)* (0.99) (0.98) (0.79) (0.83) Perm -0.309 -0.311 -0.145 -0.139 0.079 0.078 (3.67)** (3.65)** (1.90) (1.81) (1.34) (1.31) Novosibirsk -0.369 -0.370 -0.261 -0.262 0.192 0.198 (4.82)** (4.75)** (3.76)** (3.74)** (3.58)** (3.63)** Volgograd -0.315 -0.315 -0.190 -0.195 0.193 0.197 (3.77)** (3.74)** (2.50)* (2.56)* (3.28)** (3.35)** Chelyabinsk -0.310 -0.309 -0.014 -0.016 -0.091 -0.087 (2.42)* (2.40)* (0.12) (0.14) (1.01) (0.97) Omsk -0.228 -0.229 -0.130 -0.127 0.127 0.127 (2.38)* (2.37)* (1.50) (1.46) (1.88) (1.87) q7==13 -0.196 -0.199 -0.063 -0.050 0.044 0.044 (1.78) (1.75) (0.63) (0.49) (0.57) (0.55) Mach. Buil. & Metal. 0.126 0.126 0.121 0.125 -0.078 -0.081 (2.10)* (2.07)* (2.22)* (2.29)* (1.86) (1.91) Wood & paper 0.069 0.069 -0.034 -0.035 -0.012 -0.009 (0.95) (0.95) (0.52) (0.53) (0.23) (0.18) Stone & clay -0.019 -0.019 -0.044 -0.046 0.023 0.025 (0.28) (0.28) (0.74) (0.76) (0.48) (0.54) Light ind 0.072 0.073 0.055 0.048 -0.090 -0.084 (1.11) (1.12) (0.93) (0.81) (1.97) (1.81) Food ind 0.103 0.104 0.127 0.120 -0.094 -0.089 (1.52) (1.52) (2.06)* (1.96) (1.97) (1.87)
26

Table A1 Restructuring Indices — Deep Restructuring (cont.) 501-1000 0.046 0.045 0.047 0.053 -0.032 -0.036 (1.06) (1.04) (1.21) (1.35) (1.06) (1.19) >1000 0.172 0.171 0.068 0.074 -0.023 -0.027 (3.66)** (3.61)** (1.60) (1.74) (0.69) (0.82) State share -0.001 -0.002 -0.002 0.000 0.001 0.000 (1.03) (0.96) (1.35) (0.03) (0.93) (0.07) Med. Dom. Comp. -0.003 -0.004 -0.030 -0.036 0.055 0.062 (0.07) (0.08) (0.79) (0.90) (1.91) (1.99)* Low Dom. Comp. -0.122 -0.126 -0.095 -0.078 0.023 0.022 (1.98)* (1.86) (1.70) (1.28) (0.52) (0.46) Foreign Comp. 0.013 0.008 0.000 0.026 0.026 0.008 (0.36) (0.21) (0.00) (0.69) (0.98) (0.29) For comp*state sh 0.001 -0.004 0.003 (0.28) (1.74) (1.59) Low Dom comp*state sh 0.001 -0.003 0.000 (0.15) (0.83) (0.17) Med Dom comp*state sh 0.000 0.001 -0.002 (0.04) (0.42) (0.61) Constant 0.433 0.436 0.656 0.643 0.134 0.138 (5.49)** (5.41)** (9.17)** (8.86)** (2.42)* (2.45)* Observations 316 316 316 316 316 316 R-squared 0.23 0.23 0.20 0.21 0.17 0.17 Absolute value of t-statistics in parentheses * significant at 5% level; ** significant at 1% level > .>
27

Table A2 Restructuring Indices — Defensive Restructuring (1) (2) (3) (4) (5) (6)
Moscow reg -0.064 -0.063 0.005 0.004 0.017 0.018 (0.95) (0.93) (0.07) (0.05) (0.71) (0.74) St Petersburg 0.083 0.077 0.118 0.109 0.007 0.009 (1.12) (1.03) (1.43) (1.33) (0.27) (0.33) St Petersburg reg 0.043 0.036 0.047 0.041 0.069 0.071 (0.33) (0.28) (0.33) (0.29) (1.49) (1.51) Nizhny novgorod -0.160 -0.163 -0.112 -0.116 0.038 0.040 (2.44)* (2.46)* (1.53) (1.58) (1.63) (1.68) Samara -0.018 -0.021 0.048 0.042 -0.005 -0.004 (0.24) (0.28) (0.57) (0.51) (0.20) (0.14) Ekaterinburg -0.101 -0.102 -0.049 -0.045 0.031 0.031 (1.52) (1.52) (0.67) (0.61) (1.32) (1.28) Perm -0.062 -0.067 0.026 0.017 0.008 0.011 (0.82) (0.89) (0.32) (0.20) (0.30) (0.39) Novosibirsk -0.109 -0.111 0.013 0.010 0.059 0.061 (1.61) (1.60) (0.18) (0.13) (2.43)* (2.48)* Krasnoyarsk -0.076 -0.074 0.091 0.095 0.027 0.027 (1.02) (0.99) (1.11) (1.15) (1.02) (1.01) Volgograd -0.204 -0.203 0.059 0.069 -0.026 -0.028 (1.79) (1.77) (0.47) (0.54) (0.65) (0.69) Chelyabinsk -0.152 -0.154 -0.094 -0.091 0.005 0.005 (1.78) (1.80) (0.99) (0.96) (0.17) (0.15) Omsk -0.038 -0.049 0.173 0.185 0.016 0.014 (0.38) (0.48) (1.59) (1.66) (0.47) (0.38) Mach. Buil. & Metal. 0.060 0.058 0.010 0.015 -0.016 -0.018 (1.12) (1.08) (0.17) (0.25) (0.86) (0.95) Wood & paper -0.001 -0.001 -0.032 -0.022 -0.019 -0.021 (0.02) (0.02) (0.45) (0.31) (0.82) (0.90) Stone & clay -0.072 -0.071 -0.140 -0.138 0.018 0.018 (1.21) (1.20) (2.14)* (2.11)* (0.85) (0.85) Light ind 0.078 0.082 0.013 0.026 -0.018 -0.021 (1.36) (1.41) (0.20) (0.40) (0.90) (1.00) Food ind -0.011 -0.008 -0.089 -0.083 -0.010 -0.011 (0.19) (0.13) (1.33) (1.24) (0.47) (0.51)
28

Table A2 Restructuring Indices — Defensive Restructuring (cont.) 501-1000 0.003 0.000 0.011 0.009 -0.026 -0.026 (0.07) (0.01) (0.27) (0.22) (1.87) (1.87) >1000 0.022 0.018 0.013 0.007 -0.007 -0.006 (0.52) (0.43) (0.27) (0.16) (0.47) (0.43) State share 0.001 0.000 0.000 -0.002 0.001 0.001 (1.17) (0.18) (0.05) (0.88) (1.33) (1.52) Med. Dom. Comp. -0.071 -0.069 0.003 -0.008 0.022 0.027 (1.94) (1.75) (0.08) (0.18) (1.68) (1.88) Low Dom. Comp. -0.098 -0.112 -0.053 -0.047 0.019 0.018 (1.80) (1.87) (0.88) (0.71) (0.99) (0.83) Foreign Comp. -0.030 -0.045 0.042 0.015 -0.007 -0.003 (0.89) (1.25) (1.15) (0.38) (0.63) (0.26) For comp*state sh 0.003 0.004 -0.001 (1.05) (1.58) (0.66) Low Dom comp*state sh 0.002 -0.001 0.000 (0.64) (0.16) (0.17) Med Dom comp*state sh 0.000 0.002 -0.001 (0.09) (0.66) (0.86) Constant 0.333 0.343 0.527 0.535 0.029 0.027 (4.75)** (4.81)** (6.77)** (6.78)** (1.15) (1.06) Observations 316 316 316 316 316 316 R-squared 0.12 0.13 0.10 0.11 0.09 0.09 Absolute value of t-statistics in parentheses > * significant at 5% level; ** significant at 1% level > .
29

Table A3 Probability of Undertaking Investment in Fixed Capital Inv Interactions Moscow reg -0.482 -0.586 (0.80) (0.96) St Petersburg 0.015 -0.041 (0.02) (0.06) St Petersburg reg 0.174 0.106 (0.16) (0.10) Nizhny novgorod 0.038 -0.060 (0.07) (0.11) Samara -0.782 -0.836 (1.13) (1.21) Ekaterinburg 0.563 0.512 (1.01) (0.92) Perm -0.591 -0.748 (0.84) (1.03) Novosibirsk -0.939 -1.117 (1.46) (1.71) Krasnoyarsk -1.007 -1.127 (1.38) (1.54) Volgograd -0.670 -0.748 (0.66) (0.74) Chelyabinsk -0.764 -0.796 (0.95) (0.98) Omsk -0.658 -0.697 (0.70) (0.74) Mach. Buil. & Metal. 0.285 0.339 (0.57) (0.66) Wood & paper 0.531 0.525 (0.86) (0.84) Stone & clay 1.077 1.040 (1.97)* (1.89) Light ind 0.089 0.023 (0.16) (0.04) Food ind 1.434 1.412 (2.65)** (2.59)** 501-1000 0.376 0.447 (1.02) (1.20) >1000 0.877 0.949 (2.24)* (2.39)* State share -0.018 -0.013 (1.60) (0.89) Med. Dom. Comp. 0.078 -0.114 (0.24) (0.32) Low Dom. Comp. -0.236 -0.265 (0.44) (0.45) Foreign Comp. 0.550 0.746 (1.84) (2.30)* For comp*state sh -0.043 (1.66) Low Dom comp*state sh -0.001 (0.02) Med Dom comp*state sh 0.043
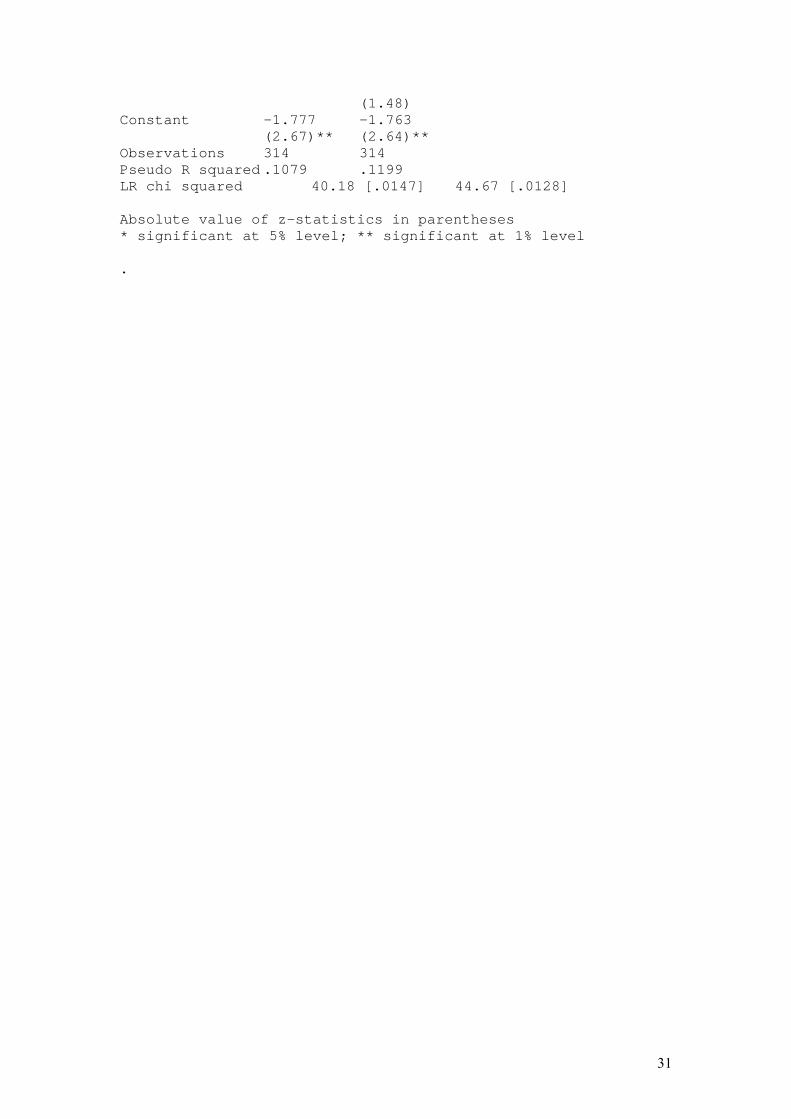
(1.48) Constant -1.777 -1.763 (2.67)** (2.64)** Observations 314 314 Pseudo R squared .1079 .1199 LR chi squared 40.18 [.0147] 44.67 [.0128] Absolute value of z-statistics in parentheses * significant at 5% level; ** significant at 1% level .
31

Table A4 Capital Vintage Kvntg Interactions Moscow reg -15.694 -15.712 (2.33)* (2.32)* St Petersburg -12.786 -13.031 (1.72) (1.74) St Petersburg reg -16.585 -16.784 (1.27) (1.28) Nizhny novgorod -12.159 -12.270 (1.85) (1.84) Samara -11.878 -12.026 (1.59) (1.60) Ekaterinburg -15.470 -15.387 (2.32)* (2.30)* Perm -10.910 -11.174 (1.45) (1.47) Novosibirsk -23.243 -23.322 (3.42)** (3.36)** Krasnoyarsk -12.592 -12.490 (1.69) (1.67) Volgograd -2.107 -1.904 (0.18) (0.17) Chelyabinsk -13.388 -13.376 (1.57) (1.56) Omsk -17.150 -17.072 (1.75) (1.69) Mach. Buil. & Metal. -8.013 -7.944 (1.50) (1.47) Wood & paper 3.443 3.635 (0.54) (0.56) Stone & clay -4.985 -4.940 (0.84) (0.83) Light ind -1.323 -1.015 (0.23) (0.17) Food ind 16.378 16.557 (2.71)** (2.72)** 501-1000 1.598 1.512 (0.42) (0.39) >1000 3.473 3.320 (0.83) (0.79) State share -0.176 -0.222 (1.54) (1.43) Med. Dom. Comp. -1.673 -1.877 (0.46) (0.47) Low Dom. Comp. 1.023 0.966 (0.19) (0.16) Foreign Comp. -0.841 -1.592 (0.25) (0.44) For comp*state sh 0.120 (0.49) Low Dom comp*state sh 0.016 (0.05) Med Dom comp*state sh 0.041
32

(0.13) Constant 37.039 37.340 (5.27)** (5.21)** Observations 316 316 R-squared 0.14 0.14 F statistics 2.06 [.0036] 1.81 [.0106] Absolute value of t-statistics in parentheses * significant at 5% level; ** significant at 1% level .
33

Table A5 Equipment Utilisation — Levels and First Difference
K%age Interactions dK%age
Interactions
Moscow reg. 3.016 2.918 9.024 8.932 (0.47) (0.45) (3.30)** (3.25)** St Petersburg -6.827 -6.122 0.255 0.023 (0.97) (0.86) (0.08) (0.01) St Petersburg reg -5.440 -4.731 -3.174 -3.511 (0.44) (0.38) (0.60) (0.66) Nizhny novgorod -2.645 -2.405 0.410 0.198 (0.42) (0.38) (0.15) (0.07) Samara -9.986 -9.652 -1.194 -1.364 (1.40) (1.35) (0.39) (0.45) Ekaterinburg -9.503 -9.451 -2.397 -2.513 (1.50) (1.49) (0.89) (0.92) Perm -4.870 -4.272 1.623 1.314 (0.68) (0.59) (0.53) (0.42) Novosibirsk -3.408 -3.327 0.452 0.119 (0.53) (0.51) (0.16) (0.04) Krasnoyarsk -19.119 -19.388 -2.350 -2.482 (2.70)** (2.73)** (0.77) (0.81) Volgograd -3.847 -3.964 7.042 6.944 (0.35) (0.36) (1.52) (1.49) Chelyabinsk -10.021 -9.715 3.104 2.953 (1.23) (1.19) (0.90) (0.85) Omsk -26.818 -25.581 -7.919 -8.553 (2.87)** (2.67)** (1.99)* (2.09)* Mach. Buil. & Metal. 2.215 2.482 4.160 4.155 (0.44) (0.49) (1.90) (1.88) Wood & paper 5.772 5.776 0.107 -0.004 (0.95) (0.94) (0.04) (0.00) Stone & clay 2.223 2.162 -0.043 -0.149 (0.40) (0.38) (0.02) (0.06) Light ind 0.793 0.355 1.157 1.102 (0.14) (0.06) (0.49) (0.46) Food ind 10.992 10.543 -0.818 -0.812 (1.91) (1.83) (0.33) (0.33) 501-1000 6.225 6.618 0.895 0.873 (1.70) (1.80) (0.57) (0.55) >1000 -0.014 0.417 -3.138 -3.160 (0.00) (0.10) (1.84) (1.84) State share -0.143 -0.022 -0.077 -0.110 (1.31) (0.15) (1.65) (1.73) Med. Dom. Comp. -4.843 -5.096 1.116 0.828 (1.39) (1.35) (0.75) (0.51) Low Dom. Comp. 2.766 4.311 -0.532 -1.297 (0.53) (0.76) (0.24) (0.53) Foreign Comp. -1.664 0.182 -0.888 -1.083 (0.53) (0.05) (0.66) (0.73) For comp*state sh -0.306 0.021
34

(1.31) (0.21) Low Dom comp*state sh -0.231 0.102 (0.76) (0.78) Med Dom comp*state sh 0.054 0.060 (0.18) (0.46) Constant 57.662 56.541 4.618 5.083 (8.62)** (8.31)** (1.62) (1.74) Observations 316 316 314 314 R-squared 0.10 0.11 0.15 0.16 F statistics 1.42 [.0990] 1.34 [.1313] 2.28 [.0009] 2.03 [.0028] Absolute value of t-statistics in parentheses * significant at 5% level; ** significant at 1% level >
35

Table A6 Production Function
Basic model Interactions
lWva lWva
lemp 0.150 0.156
(2.51)* (2.59)*
lWk_n 0.105 0.104
(1.83) (1.81)
Moscow reg. -0.390 -0.403
(1.94) (1.99)*
St Petersburg -0.400 -0.397
(1.74) (1.72)
St Petersburg reg. -0.711 -0.725
(1.66) (1.68)
Nizhny novgorod -0.478 -0.493
(2.41)* (2.46)*
Samara -0.591 -0.599
(2.61)** (2.63)**
Ekaterinburg -0.447 -0.458
(2.23)* (2.26)*
Perm -0.630 -0.648
(2.72)** (2.76)**
Novosibirsk -0.507 -0.533
(2.46)* (2.55)*
Krasnoyarsk -0.697 -0.714
(3.13)** (3.19)**
Volgograd -0.798 -0.807
(2.34)* (2.36)*
Chelyabinsk -0.383 -0.389
(1.49) (1.51)
Omsk -0.840 -0.866
(2.86)** (2.85)**
Mach. Buil. & Metal. -0.304 -0.293
(1.89) (1.80)
Wood & paper -0.287 -0.293
(1.47) (1.49)
36

Stone & clay -0.146 -0.154
(0.82) (0.86)
Light ind. -0.439 -0.451
(2.54)* (2.59)*
Food ind. 0.469 0.463
(2.53)* (2.49)*
State share -0.001 -0.001
(0.18) (0.14)
Med. Dom. Comp. 0.020 -0.017
(0.18) (0.14)
Low Dom. Comp. -0.041 -0.069
(0.25) (0.38)
Foreign comp. 0.030 0.056
(0.29) (0.50)
For comp*state sh -0.006
(0.76)
Low Dom comp*state sh 0.003
(0.33)
Med Dom comp*state sh 0.008
(0.85)
Constant 3.099 3.081
(6.47)** (6.36)**
Observations 303 303
R-squared 0.22 0.22
F( 23, 279) = 3.38 [.0000] 3.02 [.0000]
Absolute value of t-statistics in parentheses
* significant at 5% level; ** significant at 1% level
37

Table A7 Labour Productivity — Levels and First Difference
Ws_n Interactions dWs_n
Interactions
Moscow reg. -56.130 -56.040 0.076 0.080
(1.96) (1.95) (0.74) (0.78)
St Petersburg -49.017 -49.772 -0.159 -0.157
(1.56) (1.57) (1.42) (1.39)
St Petersburg reg. -60.728 -61.177 -0.179 -0.172
(1.00) (1.00) (0.83) (0.80)
Nizhny novgorod -70.083 -70.324 -0.096 -0.091
(2.51)* (2.49)* (0.97) (0.91)
Samara -62.557 -62.903 -0.233 -0.232
(1.95) (1.95) (2.05)* (2.03)*
Ekaterinburg -64.101 -64.132 -0.225 -0.216
(2.26)* (2.24)* (2.23)* (2.13)*
Perm -106.356 -107.067 -0.244 -0.240
(3.32)** (3.29)** (2.11)* (2.06)*
Novosibirsk -87.955 -87.967 -0.267 -0.261
(3.00)** (2.96)** (2.54)* (2.46)*
Krasnoyarsk -110.857 -110.538 -0.421 -0.413
(3.51)** (3.47)** (3.74)** (3.66)**
Volgograd -75.481 -75.303 -0.067 -0.053
(1.56) (1.55) (0.39) (0.30)
Chelyabinsk -76.338 -76.634 -0.171 -0.163
(2.10)* (2.10)* (1.30) (1.23)
Omsk -68.062 -69.277 -0.223 -0.182
(1.63) (1.60) (1.51) (1.19)
Mach. Buil. & Metal. -58.049 -58.332 0.143 0.150
(2.55)* (2.54)* (1.73) (1.80)
Wood & paper -20.390 -20.380 -0.010 0.005
(0.74) (0.74) (0.10) (0.05)
Stone & clay -26.436 -26.277 -0.111 -0.107
(1.05) (1.03) (1.21) (1.16)
Light ind. -64.141 -63.585 0.062 0.076
(2.60)** (2.55)* (0.70) (0.85)
38

Food ind. 169.324 169.792 0.027 0.033
(6.54)** (6.52)** (0.29) (0.36)
501-1000 12.977 12.565 0.037 0.035
(0.79) (0.76) (0.62) (0.59)
>1000 37.667 37.231 -0.007 -0.016
(2.10)* (2.05)* (0.11) (0.24)
State share -0.119 -0.248 -0.002 -0.002
(0.24) (0.38) (1.20) (1.02)
Med. Dom. Comp -14.971 -14.817 -0.072 -0.067
(0.96) (0.87) (1.28) (1.11)
Low Dom. Comp -34.619 -36.056 -0.076 -0.042
(1.44) (1.39) (0.88) (0.46)
Foreign comp. 5.879 3.802 0.023 0.004
(0.41) (0.24) (0.45) (0.07)
For comp*state sh 0.334 0.004
(0.32) (1.03)
Low Dom comp*state sh 0.232 -0.005
(0.16) (0.98)
Med Dom comp*state sh -0.035 -0.001
(0.03) (0.26)
Constant 223.280 224.444 0.678 0.668
(7.46)** (7.35)** (6.33)** (6.15)**
Observations 310 310 307 307
R-squared 0.39 0.39 0.15 0.15
F statistics 7.83 [.0000] 6.86 [.0000] 2.15
[.0021] 1.97 [.0040]
Absolute value of t-statistics in parentheses
* significant at 5% level; ** significant at 1% level
39

Table A8 Return on Equity — Levels and First Difference
ROE Interactions dROE Interactions
Moscow reg. 0.045 0.038 -0.540 -0.355
(0.75) (0.64) (0.15) (0.10)
St Petersburg -0.054 -0.051 -1.100 -0.980
(0.79) (0.74) (0.27) (0.24)
St Petersburg reg -0.044 -0.052 -0.133 0.165
(0.35) (0.42) (0.02) (0.02)
Nizhny novgorod -0.058 -0.065 1.227 1.472
(0.99) (1.10) (0.35) (0.42)
Samara -0.058 -0.063 -2.524 -2.339
(0.86) (0.93) (0.62) (0.57)
Ekaterinburg -0.105 -0.109 -0.321 -0.179
(1.77) (1.83) (0.09) (0.05)
Perm -0.088 -0.099 0.094 0.426
(1.31) (1.46) (0.02) (0.10)
Novosibirsk -0.101 -0.116 -0.982 -0.598
(1.66) (1.88) (0.27) (0.16)
Krasnoyarsk -0.161 -0.170 6.820 7.009
(2.47)* (2.59)* (1.76) (1.80)
Volgograd -0.024 -0.026 -19.580 -19.456
(0.25) (0.27) (3.33)** (3.29)**
Chelyabinsk -0.109 -0.109 0.823 0.886
(1.43) (1.43) (0.18) (0.19)
Omsk -0.255 -0.259 2.883 3.396
(2.99)** (2.94)** (0.57) (0.65)
Mach. Buil. & Metal. 0.015 0.023 1.038 0.985
(0.31) (0.47) (0.36) (0.34)
Wood & paper 0.058 0.058 0.989 1.109
(1.01) (1.01) (0.29) (0.32)
Stone & clay 0.012 0.007 4.923 5.076
(0.23) (0.13) (1.55) (1.59)
Light ind. 0.045 0.040 0.839 0.952
(0.87) (0.77) (0.27) (0.30)
Food ind. 0.119 0.117 -2.910 -2.865
40

(2.15)* (2.11)* (0.88) (0.86)
501-1000 0.058 0.064 -0.280 -0.343
(1.69) (1.85) (0.14) (0.17)
>1000 0.046 0.048 -0.318 -0.372
(1.20) (1.28) (0.14) (0.16)
State share 0.0008 0.0003 0.079 0.100
(0.08) (0.03) (1.31) (1.25)
Med. Dom. Comp 0.016 -0.006 2.148 2.646
(0.48) (0.17) (1.11) (1.26)
Low Dom. Comp -0.007 -0.014 -0.801 -0.277
(0.14) (0.26) (0.27) (0.09)
Foreign comp. 0.026 0.036 -0.140 -0.121
(0.87) (1.11) (0.08) (0.06)
For comp*state sh -0.002 0.019
(1.05) (0.15)
Low Dom comp*state sh 0.001 -0.076
(0.17) (0.41)
Med Dom comp*state sh 0.005 -0.107
(1.63) (0.63)
Constant 0.130 0.136 -1.179 -1.593
(1.98)* (2.04)* (0.30) (0.40)
Observations 291 291 287 287
R-squared 0.12 0.13 0.11 0.11
F statistics 1.61 [.0406] 1.55 [.0467] 1.38
[.1197] 1.23 [.2111]
Absolute value of t-statistics in parentheses
* significant at 5% level; ** significant at 1% level
41

Table A9 Profit/Sales Ratio — Levels and First Difference
P/S Interactions dP/S Interactions
Moscow reg. 0.018 0.017 0.014 0.015
(0.50) (0.47) (0.40) (0.41)
St Petersburg 0.018 0.021 -0.028 -0.026
(0.44) (0.50) (0.71) (0.64)
St Petersburg reg 0.087 0.089 0.025 0.028
(1.12) (1.14) (0.33) (0.37)
Nizhny novgorod -0.003 -0.003 -0.059 -0.057
(0.08) (0.08) (1.67) (1.62)
Samara -0.016 -0.016 0.000 0.001
(0.39) (0.38) (0.00) (0.03)
Ekateringburg -0.024 -0.022 -0.039 -0.035
(0.66) (0.59) (1.10) (0.98)
Perm -0.034 -0.033 -0.008 -0.005
(0.83) (0.79) (0.19) (0.13)
Novosibirsk -0.024 -0.026 -0.030 -0.030
(0.63) (0.68) (0.80) (0.79)
Krasnoyarsk -0.066 -0.067 -0.017 -0.015
(1.63) (1.63) (0.42) (0.39)
Volgograd -0.036 -0.029 -0.013 -0.004
(0.54) (0.44) (0.21) (0.06)
Chelyabinsk -0.008 -0.003 0.019 0.023
(0.16) (0.07) (0.40) (0.50)
Omsk -0.188 -0.170 -0.158 -0.135
(3.50)** (3.08)** (3.02)** (2.51)*
Mach. Buil. & Metal. -0.003 0.002 -0.023 -0.019
(0.10) (0.07) (0.79) (0.63)
Wood & paper -0.016 -0.011 -0.021 -0.015
(0.44) (0.30) (0.60) (0.42)
Stone & clay -0.019 -0.021 -0.023 -0.024
(0.59) (0.64) (0.70) (0.72)
Light ind. -0.025 -0.023 0.002 0.006
(0.79) (0.73) (0.08) (0.21)
Food ind. 0.003 0.002 -0.052 -0.051
42

(0.08) (0.06) (1.57) (1.55)
501-1000 0.051 0.053 0.015 0.016
(2.39)* (2.48)* (0.70) (0.77)
>1000 0.066 0.065 -0.010 -0.012
(2.83)** (2.79)** (0.45) (0.53)
State share -0.0001 0.00003 -0.0003 -0.0001
(0.30) (0.04) (0.57) (0.22)
Med. Dom. Comp 0.017 0.011 -0.005 -0.007
(0.84) (0.50) (0.23) (0.35)
Low Dom. Comp 0.003 0.018 -0.019 0.001
(0.11) (0.55) (0.61) (0.03)
Foreign comp -0.003 -0.001 0.019 0.017
(0.15) (0.02) (1.05) (0.86)
For comp*state sh -0.0003
0.001
(0.24) (0.38)
Low Dom comp*state sh -0.002 -0.003
(1.25) (1.62)
Med Dom comp*state sh 0.001 0.000
(0.67) (0.28)
Constant 0.078 0.073 0.050 0.044
(2.01)* (1.86) (1.33) (1.16)
Observations 306 306 303 303
R-squared 0.14 0.15 0.10 0.11
F statistics 2.01 [.0047] 1.86[.0079] 1.30
[.1643] 1.27 [.1728]
Absolute value of t-statistics in parentheses
* significant at 5% level; ** significant at 1% level
43

Table A10 Profit/Capital Ratio — Levels and First Difference
P/K Interactions dP/K Interactions
Moscow reg. 0.110 0.102 0.681 0.910
(0.83) (0.77) (0.11) (0.15)
St Petersburg -0.029 -0.014 1.583 2.029
(0.19) (0.09) (0.22) (0.28)
St Petersburg reg -0.063 -0.067 3.379 3.957
(0.23) (0.24) (0.26) (0.30)
Nizhny novgorod -0.046 -0.050 0.898 1.347
(0.35) (0.38) (0.15) (0.22)
Samara -0.189 -0.190 -4.111 -3.752
(1.28) (1.29) (0.60) (0.54)
Ekaterinburg -0.037 -0.042 -5.198 -4.966
(0.28) (0.32) (0.85) (0.81)
Perm -0.042 -0.044 -14.108 -13.406
(0.28) (0.29) (1.99)* (1.87)
Novosibirsk -0.105 -0.120 0.585 1.124
(0.78) (0.88) (0.09) (0.18)
Krasnoyarsk -0.233 -0.245 3.604 3.789
(1.60) (1.68) (0.53) (0.56)
Volgograd -0.130 -0.134 -2.393 -2.065
(0.55) (0.57) (0.22) (0.19)
Chelyabinsk -0.081 -0.080 -0.482 -0.123
(0.49) (0.48) (0.06) (0.02)
Omsk -0.305 -0.299 -3.119 -1.704
(1.59) (1.51) (0.35) (0.19)
Mach. Buil. & Metal. -0.115 -0.103 -1.386 -1.374
(1.09) (0.97) (0.28) (0.27)
Wood & paper 0.033 0.033 -18.992 -18.758
(0.26) (0.26) (3.16)** (3.09)**
Stone & clay -0.180 -0.187 -1.519 -1.427
(1.54) (1.59) (0.27) (0.26)
Light ind. -0.151 -0.164 -2.568 -2.537
(1.32) (1.42) (0.48) (0.47)
44
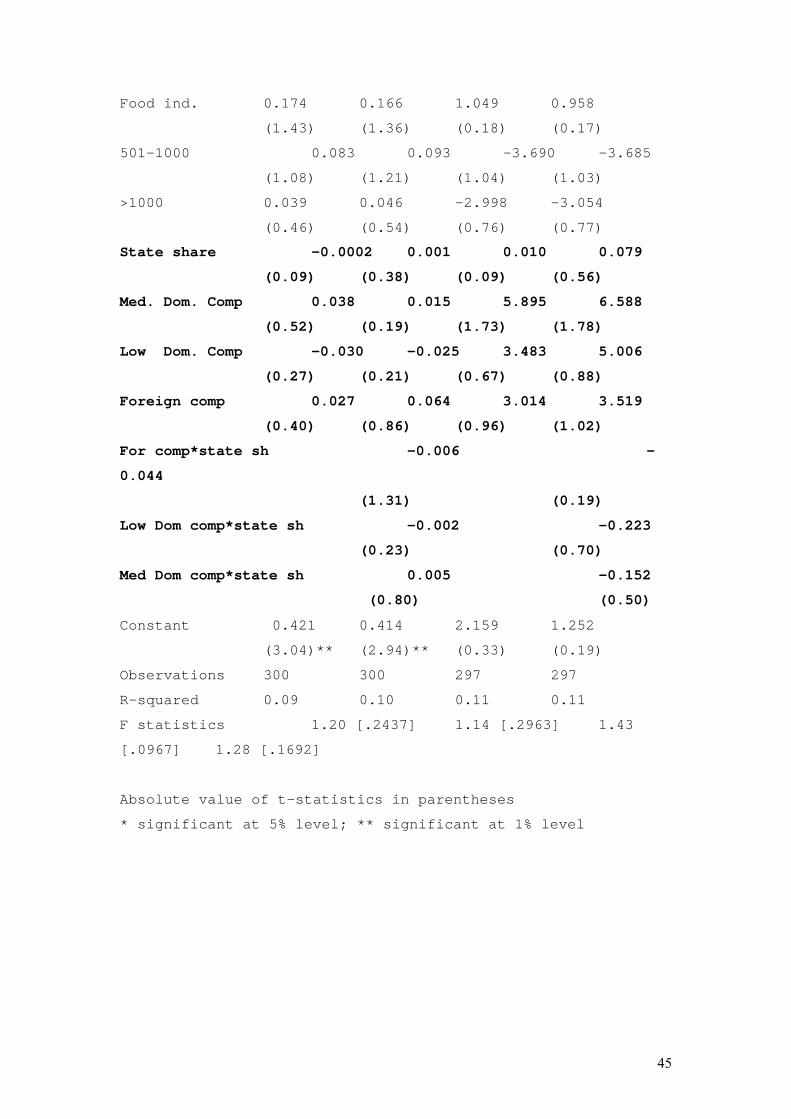
Food ind. 0.174 0.166 1.049 0.958
(1.43) (1.36) (0.18) (0.17)
501-1000 0.083 0.093 -3.690 -3.685
(1.08) (1.21) (1.04) (1.03)
>1000 0.039 0.046 -2.998 -3.054
(0.46) (0.54) (0.76) (0.77)
State share -0.0002 0.001 0.010 0.079
(0.09) (0.38) (0.09) (0.56)
Med. Dom. Comp 0.038 0.015 5.895 6.588
(0.52) (0.19) (1.73) (1.78)
Low Dom. Comp -0.030 -0.025 3.483 5.006
(0.27) (0.21) (0.67) (0.88)
Foreign comp 0.027 0.064 3.014 3.519
(0.40) (0.86) (0.96) (1.02)
For comp*state sh -0.006 -
0.044
(1.31) (0.19)
Low Dom comp*state sh -0.002 -0.223
(0.23) (0.70)
Med Dom comp*state sh 0.005 -0.152
(0.80) (0.50)
Constant 0.421 0.414 2.159 1.252
(3.04)** (2.94)** (0.33) (0.19)
Observations 300 300 297 297
R-squared 0.09 0.10 0.11 0.11
F statistics 1.20 [.2437] 1.14 [.2963] 1.43
[.0967] 1.28 [.1692]
Absolute value of t-statistics in parentheses
* significant at 5% level; ** significant at 1% level
45