central regions land capacity analysis · central regions land capacity analysis ... 2026...
TRANSCRIPT

Central Regions Land Capacity Analysis
February 2016
Shire of Ravensthorpe
Central Regions Land Capacity Analysis
Department of Planning
Shire of Ravensthorpe
February 2016
2
Disclaimer
This document has been published by the Department of Planning. Any representation, statement, opinion or advice expressed or implied in this publication is made in good faith and on the basis that the Government, its employees and agents are not liable for any damage or loss whatsoever which may occur as a result of action taken or not taken, as the case may be, in respect of any representation, statement, opinion or advice referred to herein. Professional advice should be obtained before applying the information contained in this document to particular circumstances.
© State of Western Australia
Published by theDepartment of PlanningGordon Stephenson House140 William StreetPerth WA 6000
Locked Bag 2506Perth WA 6001
Published February 2016website: www.planning.wa.gov.auemail: [email protected]
tel: 08 6551 9000fax: 08 6551 9001National Relay Service: 13 36 77infoline: 1800 626 477
The Department of Planning owns all photography in this document unless otherwise stated.
This document is available in alternative formats on application to Communication Services.

Central Regions Land Capacity Analysis
Department of Planning
Shire of Ravensthorpe
February 2016
3
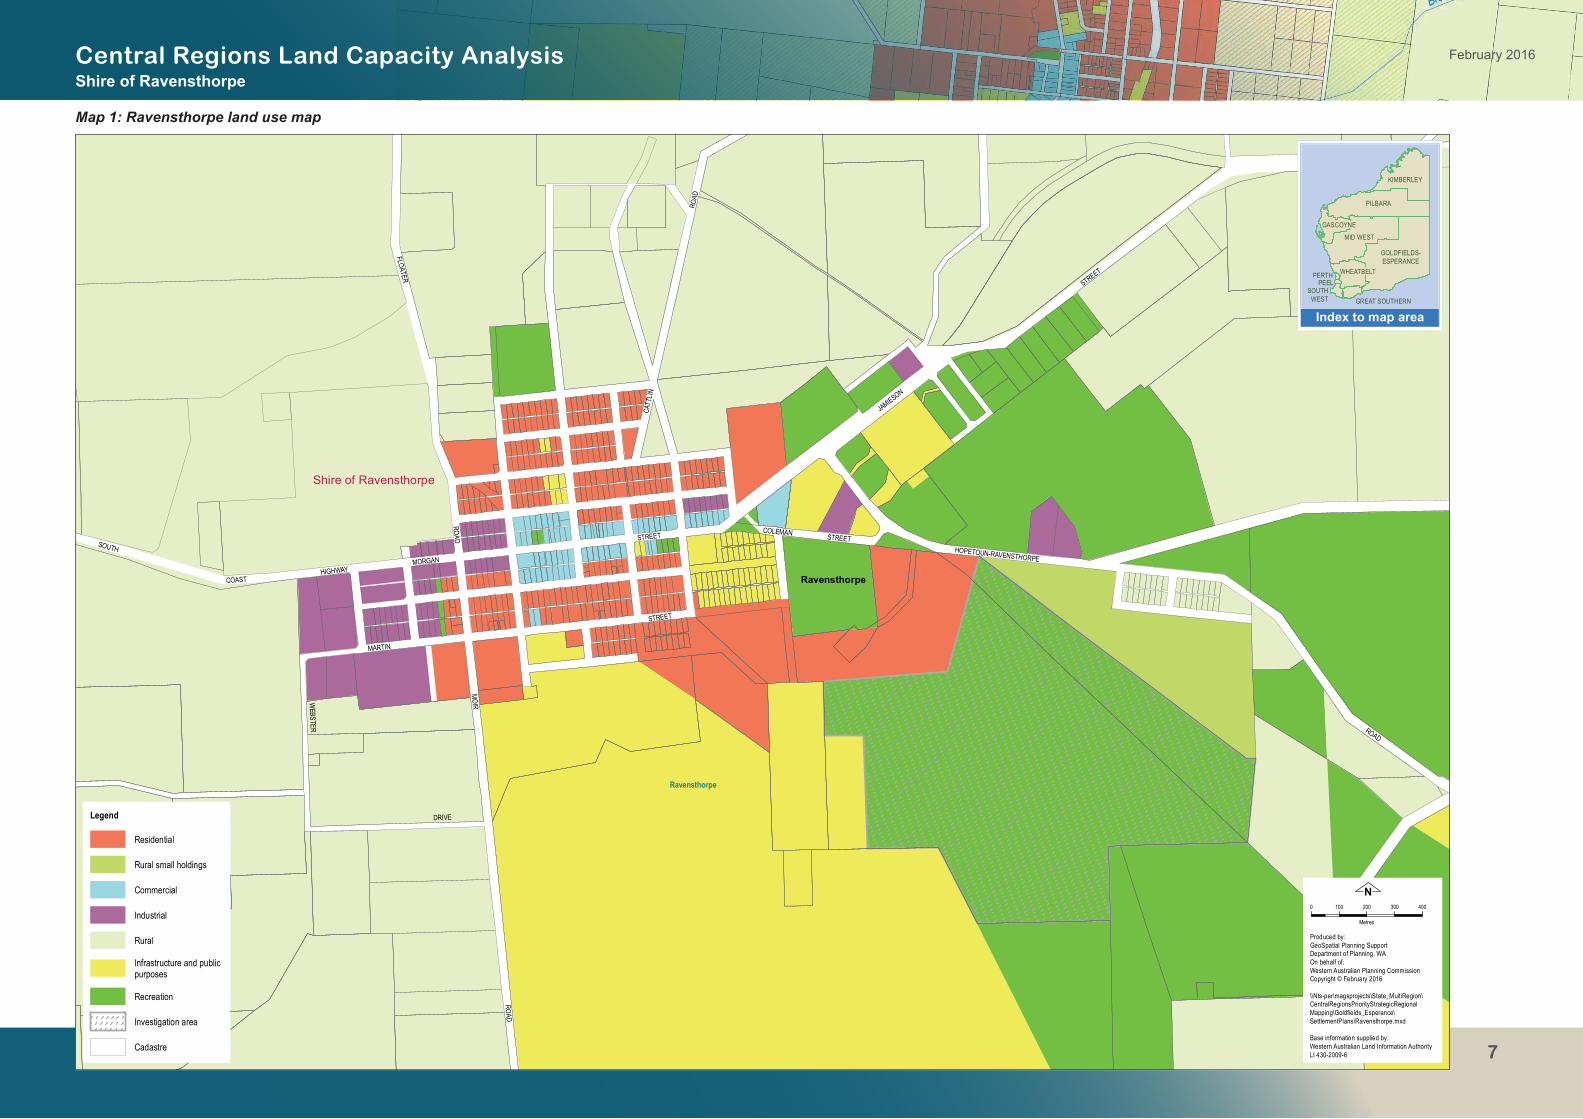
2. Settlement land-use mappingThe Department of Planning (DoP) has prepared mapping that captures the spatial extents of current and future land use in applicable settlements. Within the Shire of Ravensthorpe, this includes:
• Ravensthorpe (Map 1);
• Hopetoun (Map 2); and
• Munglinup (Map 3).
Further context on how this mapping has been developed is provided below.
2.1 Current and future land use
For the purpose of this study, the mapping categorises current and future land uses into broad land-use types. It effectively rationalises and consolidates existing zones and reserves in local planning schemes with intended future land uses identified in a number of strategic documents, including local planning strategies and structure plans.
The areas identified on the maps are based on the general consideration of:
• current zonings and reservations within applicable local planning schemes; and
• other strategic planning documents including local planning strategies, structure plans, layout plans and/or growth plans where relevant.
With respect to this, the extent of current land uses generally reflect that of applicable existing zones and reserves in current local planning schemes; and future land uses generally reflect where land has been identified in other documents for a different (typically more intensive) land use than that identified in the current scheme.
1. IntroductionThe Central Regions Land Capacity Analysis provides a broad overview of the existing and future land capacity of settlements in the Mid West, Gascoyne and Goldfields-Esperance regions with respect to forecast population growth. In particular, it examines land identified for residential, commercial and industrial development.
The purpose of this document is to present the land-use mapping and associated analysis as it relates to the applicable settlements in the Shire of Ravensthorpe local government area.
Notably, the analysis suggests there is sufficient land capable of substantial further development (based on the current extents of zoned residential land and land identified for future residential purposes) to cater for the population growth anticipated in the Western Australia Tomorrow 2026 population forecasts for the Shire of Ravensthorpe.
The information presented in this document may provide a basis for a range of regional and local strategic planning including:
• to assist regional planning and provide direction for strategic infrastructure coordination;
• to inform the preparation and/or review of local planning strategies, schemes and structure plans; and
• for more detailed land supply analysis, including further investigation into the infrastructure requirements to service potential development of the future land supply.
Given the dynamic nature of planning and development, it is intended that this paper will be amended periodically to reflect future updates to local planning instruments as relevant.
Notwithstanding this, the information contained in this document has been prepared for guidance purposes only.
Central Regions Land Capacity Analysis
Department of Planning
Shire of Ravensthorpe
February 2016
4
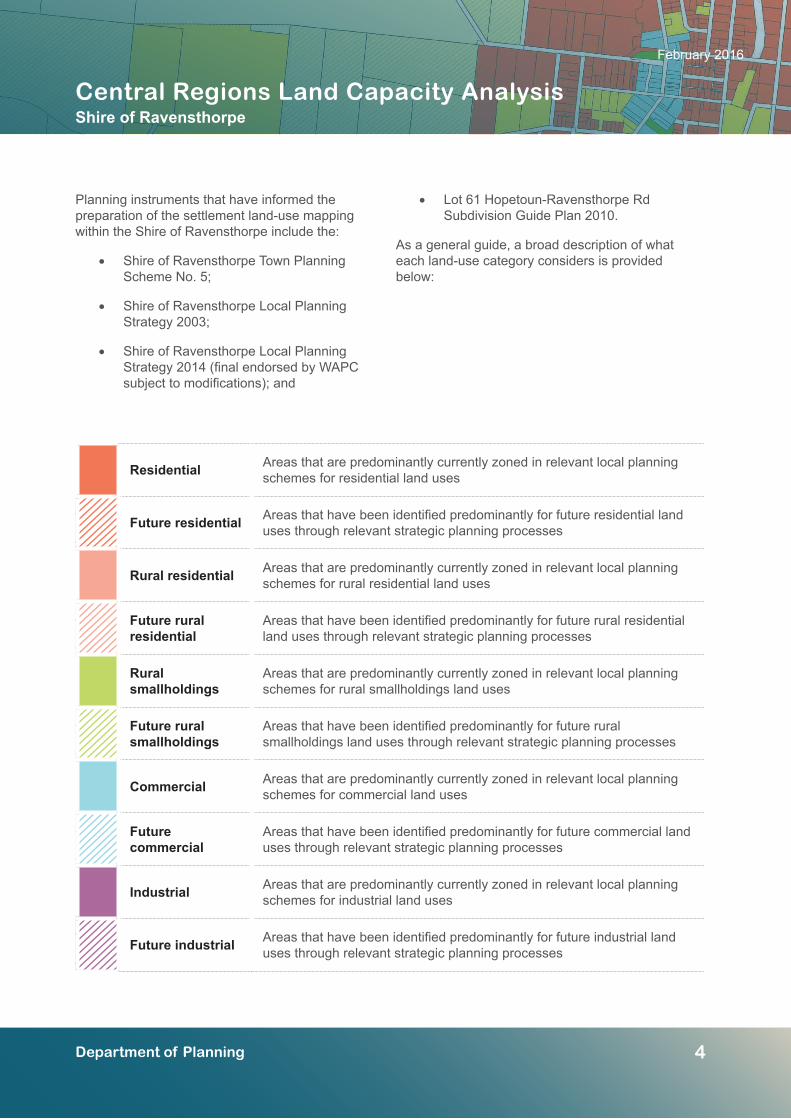
Planning instruments that have informed the preparation of the settlement land-use mapping within the Shire of Ravensthorpe include the:
• Shire of Ravensthorpe Town Planning Scheme No. 5;
• Shire of Ravensthorpe Local Planning Strategy 2003;
• Shire of Ravensthorpe Local Planning Strategy 2014 (final endorsed by WAPC subject to modifications); and
• Lot 61 Hopetoun-Ravensthorpe Rd Subdivision Guide Plan 2010.
As a general guide, a broad description of what each land-use category considers is provided below:
Residential Areas that are predominantly currently zoned in relevant local planning schemes for residential land uses
Future residential Areas that have been identified predominantly for future residential land uses through relevant strategic planning processes
Rural residential Areas that are predominantly currently zoned in relevant local planning schemes for rural residential land uses
Future rural residential
Areas that have been identified predominantly for future rural residential land uses through relevant strategic planning processes
Rural smallholdings
Areas that are predominantly currently zoned in relevant local planning schemes for rural smallholdings land uses
Future rural smallholdings
Areas that have been identified predominantly for future rural smallholdings land uses through relevant strategic planning processes
Commercial Areas that are predominantly currently zoned in relevant local planning schemes for commercial land uses
Future commercial
Areas that have been identified predominantly for future commercial land uses through relevant strategic planning processes
Industrial Areas that are predominantly currently zoned in relevant local planning schemes for industrial land uses
Future industrial Areas that have been identified predominantly for future industrial land uses through relevant strategic planning processes

Central Regions Land Capacity Analysis
Department of Planning
Shire of Ravensthorpe
February 2016
5
Rural Areas that are predominantly currently zoned in relevant local planning schemes for rural land uses
Future rural Areas that have been identified predominantly for future rural land uses through relevant strategic planning processes
Infrastructure and public purposes
Areas that are predominantly currently reserved in relevant local planning schemes for infrastructure and/or public purposes
Future infrastructure and public purposes
Areas that have been identified predominantly for future infrastructure and/or public purposes through relevant strategic planning processes
Recreation Areas that are predominantly currently reserved in relevant local planning schemes for recreation purposes
Future recreation Areas that have been identified predominantly for future recreation purposes through relevant strategic planning processes
Conservation Areas that are predominantly currently reserved in relevant local planning schemes for conservation purposes
Future conservation
Areas that have been identified predominantly for future conservation purposes through relevant strategic planning processes
Special land use
Areas that are currently zoned in relevant local planning schemes for specific purposes that do not align with other broad land-use categories as described, or where their inclusion may unduly distort the results of the associated analysis
Investigation area
Areas that have been identified through relevant strategic planning processes where alternative future land uses may be considered subject to further investigation. This may include areas from plans in preparation or in draft form
Central Regions Land Capacity Analysis
Department of Planning
Shire of Ravensthorpe
February 2016
6
2.2 Development status
To gain a general understanding of the potential capacity of currently zoned and potential future-zoned land within each settlement, a broad assessment has been undertaken of the development status of applicable land identified for residential, commercial, industrial, rural residential and rural smallholdings purposes. Generally, the assessment involved a visual interpretation of aerial photography and cadastral information.
This assessment has been undertaken for those settlements where the applicable land uses occur within the map extents.
Applicable areas within the map extents have been assessed and considered as being ‘developed’ or ‘capable of substantial further development’ as described below.
Developed: ‘developed’ land is broadly considered as land where development exists or where the necessary infrastructure and services to accommodate development exist. Subdivision is generally consistent with its zoning, however existing urban areas that could potentially accommodate increases in density through urban infill are considered to be ‘developed.’
Capable of substantial further development: Land ‘capable of substantial further development’ consists of undeveloped or underdeveloped land on greenfield sites, where subdivision reflective of its zoning is yet to exist. In some instances however, land may have conditional subdivision approval or be part of a broader structure planning process that still needs to be finalised. It is important to note that the development of areas that are currently considered to be capable of substantial further development may be subject to a number of constraints; including scheme amendments, structure planning, infrastructure provision, environmental and heritage issues.
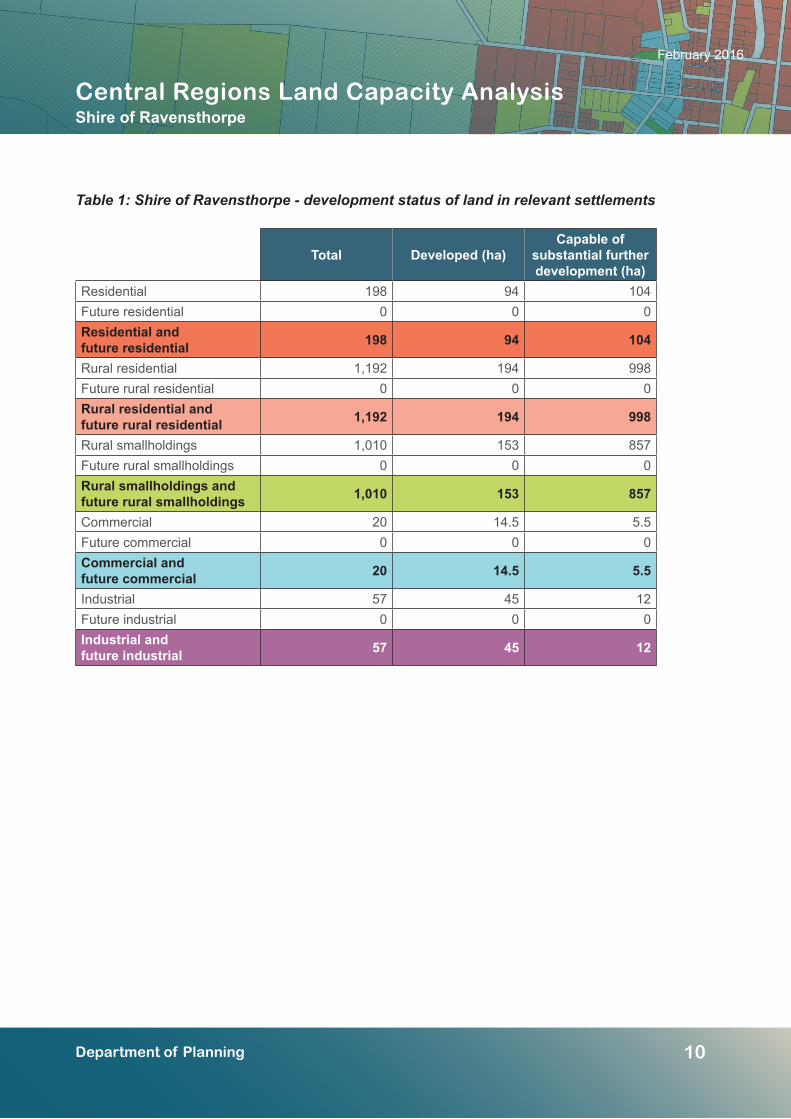
Table 1 summarises the development status of each applicable land-use category for all relevant settlements, representing a set of total figures for the entire local government area. It consolidates all data from Tables 2 to 4, which summarise the development status of each applicable land-use category as it relates to the individual settlements.
7
Central Regions Land Capacity AnalysisShire of Ravensthorpe
February 2016
Map 1: Ravensthorpe land use map
Ravensthorpe
DRIVE
CATT
LIN
STREET
STREET
ROAD
MORGAN
STREET
SOUTH
COLEMAN
FLOATER
WEBSTER
JAMIESON
STREET
MOIR
HIGHWAY
ROAD
HOPETOUN-RAVENSTHORPE
ROAD
ROAD
MARTIN
COAST
Shire of Ravensthorpe
Ravensthorpe
Goldfields - Esperance Region Settlements
Ravensthorpe
Produced by:GeoSpatial Planning SupportDepartment of Planning, WAOn behalf of:Western Australian Planning CommissionCopyright © February 2016
\\Nts-per\magsprojects\State_MultiRegion\CentralRegionsPriorityStrategicRegionalMapping\Goldfields_Esperance\SettlementPlans\Ravensthorpe.mxd
Base information supplied by:Western Australian Land Information AuthorityLI 430-2009-6
N0 100 200 300 400
Metres
Legend
Residential
Rural small holdings
Commercial
Industrial
Rural
Infrastructure and publicpurposes
Recreation
Investigation area
Cadastre
KIMBERLEY
PILBARA
GOLDFIELDS-ESPERANCE
MID WEST
GASCOYNE
WHEATBELT
GREAT SOUTHERNSOUTH
WEST
PERTHPEEL
Index to map area

8
Central Regions Land Capacity AnalysisShire of Ravensthorpe
February 2016
Map 2: Hopetoun land use map
Culham Inlet
Indian
wastewater treatmentplant buffer
JOHN FORREST
Hopetoun
Ocean
DOTTEREL
ROAD
ROAD
ROAD
DUNNS SWAMP
ESPLANADE
ROAD
HAMERSLEY
DRIVE
SOUTHERN OCEAN
SPRINGDALE
ROAD
PHILLIPS RIVER
ROAD
HOPE
TOUN
-RAV
ENST
HORP
E
River
DRIVE
Jerdacuttup
Phi ll ip s
River
R iver
S teere
Dunns SwampJerdacuttup Lakes
Hopetoun
Jerdacuttup
Shire of Ravensthorpe
Goldfields - Esperance Region Settlements
Hopetoun
Produced by:GeoSpatial Research and ModellingDepartment of Planning, WAOn behalf of:Western Australian Planning CommissionCopyright © February 2016
\\Nts-per\magsprojects\Goldfields_Esperance\SettlementPlans\Hopetoun.mxd
Base information supplied by:Western Australian Land Information AuthorityLI 782-2015-1
N0 0.5 1 1.5
Kilometres
Legend
Residential
Rural residential
Rural small holdings
Commercial
Industrial
Rural
Infrastructure and publicpurposes
Recreation
Special land use
Investigation area
Buffers
Wastewater treatmentplant
Cadastre greater than1ha
Lakes
Oceans
Rivers
KIMBERLEY
PILBARA
GOLDFIELDS-ESPERANCE
MID WEST
GASCOYNE
WHEATBELT
GREAT SOUTHERNSOUTH
WEST
PERTHPEEL
Index to map area

9
Central Regions Land Capacity AnalysisShire of Ravensthorpe
February 2016
Map 3: Munglinup land use map
Munglinup
DOYL
E
REYNOLDS
SOUTH
HIGHWAY
ROAD
ROAD
COAST
Shire of Ravensthorpe
Shire of Esperance
Munglinup
East Munglinup
Goldfields - Esperance Region Settlements
Munglinup
Produced by GeoSpatial Research and Modelling,Department of Planning WA, on behalf of theWestern Australian Planning CommissionCopyright © February 2016
\\Nts-per\magsprojects\State_MultiRegion\CentralRegionsPriorityStrategicRegionalMapping\Goldfields_Esperance\SettlementPlans\Munglinup.mxd
Base information supplied byWestern Australian Land Information AuthorityLI 782-2015-1
N0 150 300 450
Metres
Legend
Residential
Commercial
Industrial
Rural
Infrastructure and publicpurposes
Recreation
Investigation area
Cadastre
Lakes
Local governmentboundary
KIMBERLEY
PILBARA
GOLDFIELDS-ESPERANCE
MID WEST
GASCOYNE
WHEATBELT
GREAT SOUTHERNSOUTH
WEST
PERTHPEEL
Index to map area
Central Regions Land Capacity Analysis
Department of Planning
Shire of Ravensthorpe
February 2016
10
Total Developed (ha)Capable of
substantial further development (ha)
Residential 198 94 104Future residential 0 0 0Residential and future residential 198 94 104
Rural residential 1,192 194 998Future rural residential 0 0 0Rural residential andfuture rural residential 1,192 194 998
Rural smallholdings 1,010 153 857Future rural smallholdings 0 0 0Rural smallholdings and future rural smallholdings 1,010 153 857
Commercial 20 14.5 5.5Future commercial 0 0 0Commercial andfuture commercial 20 14.5 5.5
Industrial 57 45 12Future industrial 0 0 0Industrial and future industrial 57 45 12
Table 1: Shire of Ravensthorpe - development status of land in relevant settlements

Central Regions Land Capacity Analysis
Department of Planning
Shire of Ravensthorpe
February 2016
11
Total Developed (ha)Capable of
substantial further development (ha)
Residential 84 26 58Future residential 0 0 0Residential and future residential 84 26 58
Rural residential 0 0 0Future rural residential 0 0 0Rural residential andfuture rural residential 0 0 0
Rural smallholdings 25 25 0Future rural smallholdings 0 0 0Rural smallholdings and future rural smallholdings 25 25 0
Commercial 9 9 0Future commercial 0 0 0Commercial andfuture commercial 9 9 0
Industrial 29 21 8Future industrial 0 0 0Industrial and future industrial 29 21 8
Table 2: Ravensthorpe - development status of land

Central Regions Land Capacity Analysis
Department of Planning
Shire of Ravensthorpe
February 2016
12
Total Developed (ha)Capable of
substantial further development (ha)
Residential 100 65 35Future residential 0 0 0Residential and future residential 100 65 35
Rural residential 1,192 194 998Future rural residential 0 0 0Rural residential andfuture rural residential 1,192 194 998
Rural smallholdings 985 128 857Future rural smallholdings 0 0 0Rural smallholdings and future rural smallholdings 985 128 857
Commercial 8 5 3Future commercial 0 0 0Commercial andfuture commercial 8 5 3
Industrial 9 9 0Future industrial 0 0 0Industrial and future industrial 9 9 0
Table 3: Hopetoun - development status of land

Central Regions Land Capacity Analysis
Department of Planning
Shire of Ravensthorpe
February 2016
13
Total Developed (ha)Capable of
substantial further development (ha)
Residential 14 3 11Future residential 0 0 0Residential and future residential 14 3 11
Rural residential 0 0 0Future rural residential 0 0 0Rural residential andfuture rural residential 0 0 0
Rural smallholdings 0 0 0Future rural smallholdings 0 0 0Rural smallholdings and future rural smallholdings 0 0 0
Commercial 3 0.5 2.5Future commercial 0 0 0Commercial andfuture commercial 3 0.5 2.5
Industrial 19 15 4Future industrial 0 0 0Industrial and future industrial 19 15 4
Table 4: Munglinup - development status of land

Central Regions Land Capacity Analysis
Department of Planning
Shire of Ravensthorpe
February 2016
14
3. Capacity analysisThe assessment of the development status of current and future land uses enables a broad-level capacity analysis of the residential development potential of land within the Shire of Ravensthorpe. The Department of Planning has prepared such an analysis that:
• estimates the potential additional population yield of current and future residential, rural residential and rural smallholdings lands for each relevant settlement; and
• considers possible implications with regard to the local government area’s residential land situation in the context of the Western Australia Tomorrow 2026 population forecasts.
With respect to this, the tables in section 3.1 summarise the estimated additional capacity of each applicable land-use category for relevant settlements within the Shire of Ravensthorpe. Further analysis is presented in section 3.2 that relates this information to the Western Australia Tomorrow 2026 population forecasts.
In interpreting the outputs of the analysis, it is important to note that additional capacity is assumed to be accommodated exclusively in areas that are currently considered as being capable of substantial further development. This means that the estimates generally do not account for possible land capacity increases due to infill and/or redevelopment of existing developed areas, and from this perspective are considered broad in nature and is likely to underestimate the potential overall capacity.
A capacity analysis for commercial and industrial lands necessarily requires assumptions to be made on employment density. There are currently limitations in the available data required in order to make reasonable assumptions in this regard. In particular, relatively small statistical sample sizes – something that is prevalent in regional areas – compromise the reliability of using the available
data for such an application. It is considered that further investigation is required to ascertain representative rates of employment density for commercial and industrial lands in regional areas, and accordingly a capacity analysis of commercial and industrial lands is not included in this paper at this stage.
3.1 Potential capacity of residential, rural residential and rural smallholdings lands
For residential, rural residential and rural smallholdings land uses, potential capacity has been calculated according to scenarios that assume different average development densities that are applicable to each of those land uses. Potential additional lot and population yields have been estimated for each respective current and future land use category as they relate to each relevant settlement in the Shire of Ravensthorpe.
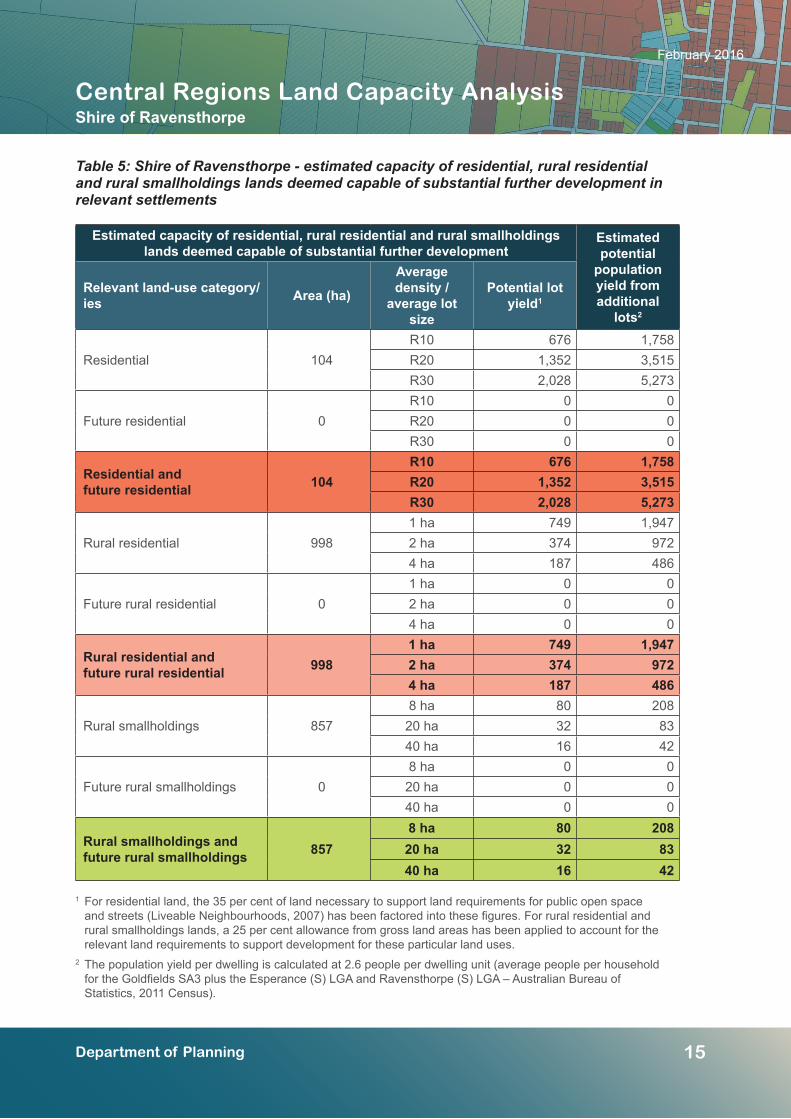
Table 5 presents the total potential additional lot and population yields for all relevant settlements across the local government area.
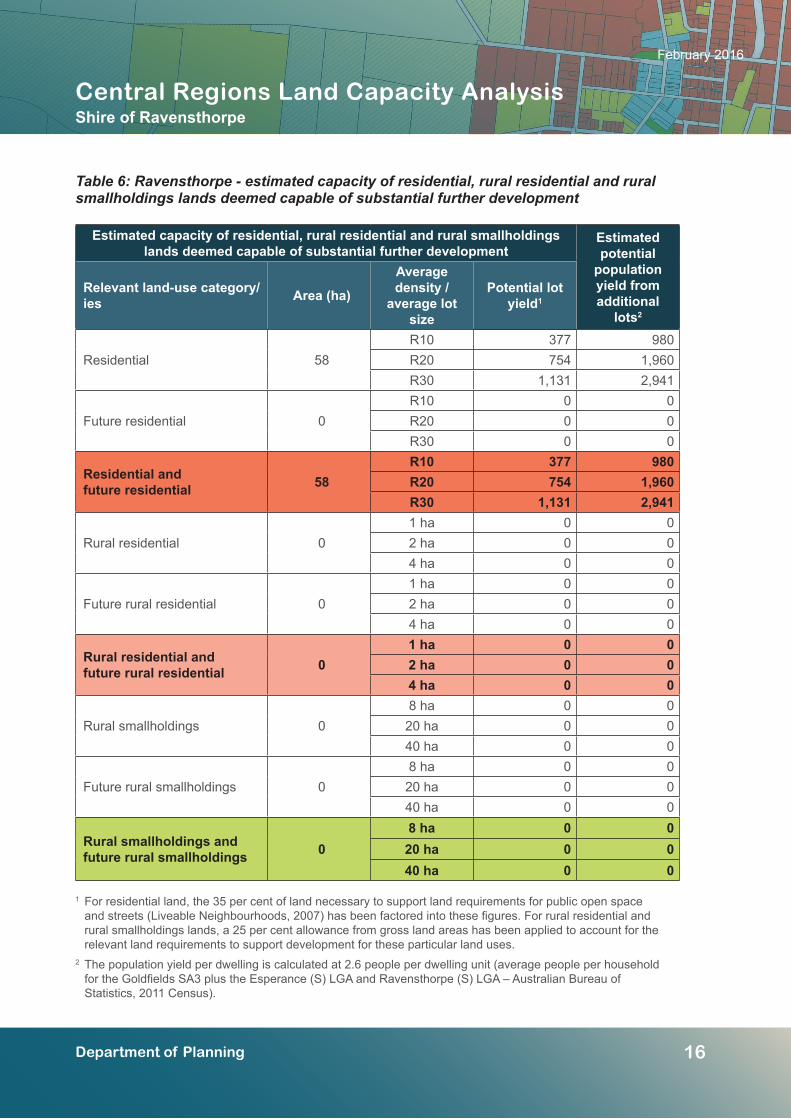
Tables 6 to 8 present the potential additional lot and population yields for individual settlements relevant to this analysis.
(Note: Table 5 consolidates all data from Tables 6 to 8, and essentially represents a set of total figures for the entire local government area.)
Central Regions Land Capacity Analysis
Department of Planning
Shire of Ravensthorpe
February 2016
15
Estimated capacity of residential, rural residential and rural smallholdings lands deemed capable of substantial further development
Estimated potential
population yield from additional
lots2
Relevant land-use category/ies Area (ha)
Average density /
average lot size
Potential lot yield1
Residential 104R10 676 1,758R20 1,352 3,515R30 2,028 5,273
Future residential 0R10 0 0R20 0 0R30 0 0
Residential and future residential 104
R10 676 1,758R20 1,352 3,515R30 2,028 5,273
Rural residential 9981 ha 749 1,9472 ha 374 9724 ha 187 486
Future rural residential 01 ha 0 02 ha 0 04 ha 0 0
Rural residential and future rural residential 998
1 ha 749 1,9472 ha 374 9724 ha 187 486
Rural smallholdings 8578 ha 80 20820 ha 32 8340 ha 16 42
Future rural smallholdings 08 ha 0 020 ha 0 040 ha 0 0
Rural smallholdings and future rural smallholdings 857
8 ha 80 20820 ha 32 8340 ha 16 42
Table 5: Shire of Ravensthorpe - estimated capacity of residential, rural residential and rural smallholdings lands deemed capable of substantial further development in relevant settlements
1
2
For residential land, the 35 per cent of land necessary to support land requirements for public open space and streets (Liveable Neighbourhoods, 2007) has been factored into these figures. For rural residential and rural smallholdings lands, a 25 per cent allowance from gross land areas has been applied to account for the relevant land requirements to support development for these particular land uses.
The population yield per dwelling is calculated at 2.6 people per dwelling unit (average people per household for the Goldfields SA3 plus the Esperance (S) LGA and Ravensthorpe (S) LGA – Australian Bureau of Statistics, 2011 Census).
Central Regions Land Capacity Analysis
Department of Planning
Shire of Ravensthorpe
February 2016
16
Estimated capacity of residential, rural residential and rural smallholdings lands deemed capable of substantial further development
Estimated potential
population yield from additional
lots2
Relevant land-use category/ies Area (ha)
Average density /
average lot size
Potential lot yield1
Residential 58R10 377 980R20 754 1,960R30 1,131 2,941
Future residential 0R10 0 0R20 0 0R30 0 0
Residential and future residential 58
R10 377 980R20 754 1,960R30 1,131 2,941
Rural residential 01 ha 0 02 ha 0 04 ha 0 0
Future rural residential 01 ha 0 02 ha 0 04 ha 0 0
Rural residential and future rural residential 0
1 ha 0 02 ha 0 04 ha 0 0
Rural smallholdings 08 ha 0 020 ha 0 040 ha 0 0
Future rural smallholdings 08 ha 0 020 ha 0 040 ha 0 0
Rural smallholdings and future rural smallholdings 0
8 ha 0 020 ha 0 040 ha 0 0
Table 6: Ravensthorpe - estimated capacity of residential, rural residential and rural smallholdings lands deemed capable of substantial further development
1
2
For residential land, the 35 per cent of land necessary to support land requirements for public open space and streets (Liveable Neighbourhoods, 2007) has been factored into these figures. For rural residential and rural smallholdings lands, a 25 per cent allowance from gross land areas has been applied to account for the relevant land requirements to support development for these particular land uses.
The population yield per dwelling is calculated at 2.6 people per dwelling unit (average people per household for the Goldfields SA3 plus the Esperance (S) LGA and Ravensthorpe (S) LGA – Australian Bureau of Statistics, 2011 Census).

Central Regions Land Capacity Analysis
Department of Planning
Shire of Ravensthorpe
February 2016
17
Estimated capacity of residential, rural residential and rural smallholdings lands deemed capable of substantial further development
Estimated potential
population yield from additional
lots2
Relevant land-use category/ies Area (ha)
Average density /
average lot size
Potential lot yield1
Residential 35R10 228 593R20 455 1,183R30 683 1,776
Future residential 0R10 0 0R20 0 0R30 0 0
Residential and future residential 35
R10 228 593R20 455 1,183R30 683 1,776
Rural residential 9981 ha 749 1,9472 ha 374 9724 ha 187 486
Future rural residential 01 ha 0 02 ha 0 04 ha 0 0
Rural residential and future rural residential 998
1 ha 749 1,9472 ha 374 9724 ha 187 486
Rural smallholdings 8578 ha 80 20820 ha 32 8340 ha 16 42
Future rural smallholdings 08 ha 0 020 ha 0 040 ha 0 0
Rural smallholdings and future rural smallholdings 857
8 ha 80 20820 ha 32 8340 ha 16 42
Table 7: Hopetoun - estimated capacity of residential, rural residential and rural smallholdings lands deemed capable of substantial further development
1
2
For residential land, the 35 per cent of land necessary to support land requirements for public open space and streets (Liveable Neighbourhoods, 2007) has been factored into these figures. For rural residential and rural smallholdings lands, a 25 per cent allowance from gross land areas has been applied to account for the relevant land requirements to support development for these particular land uses.
The population yield per dwelling is calculated at 2.6 people per dwelling unit (average people per household for the Goldfields SA3 plus the Esperance (S) LGA and Ravensthorpe (S) LGA – Australian Bureau of Statistics, 2011 Census).

Central Regions Land Capacity Analysis
Department of Planning
Shire of Ravensthorpe
February 2016
18
Estimated capacity of residential, rural residential and rural smallholdings lands deemed capable of substantial further development
Estimated potential
population yield from additional
lots2
Relevant land-use category/ies Area (ha)
Average density /
average lot size
Potential lot yield1
Residential 11R10 72 187R20 143 372R30 215 559
Future residential 0R10 0 0R20 0 0R30 0 0
Residential and future residential 11
R10 72 187R20 143 372R30 215 559
Rural residential 01 ha 0 02 ha 0 04 ha 0 0
Future rural residential 01 ha 0 02 ha 0 04 ha 0 0
Rural residential and future rural residential 0
1 ha 0 02 ha 0 04 ha 0 0
Rural smallholdings 08 ha 0 020 ha 0 040 ha 0 0
Future rural smallholdings 08 ha 0 020 ha 0 040 ha 0 0
Rural smallholdings and future rural smallholdings 0
8 ha 0 020 ha 0 040 ha 0 0
Table 8: Munglinup - estimated capacity of residential, rural residential and rural smallholdings lands deemed capable of substantial further development
1
2
For residential land, the 35 per cent of land necessary to support land requirements for public open space and streets (Liveable Neighbourhoods, 2007) has been factored into these figures. For rural residential and rural smallholdings lands, a 25 per cent allowance from gross land areas has been applied to account for the relevant land requirements to support development for these particular land uses.
The population yield per dwelling is calculated at 2.6 people per dwelling unit (average people per household for the Goldfields SA3 plus the Esperance (S) LGA and Ravensthorpe (S) LGA – Australian Bureau of Statistics, 2011 Census).
Central Regions Land Capacity Analysis
Department of Planning
Shire of Ravensthorpe
February 2016
19
Scenario1
(average density of residential land / average lot size of rural residential land / average lot size of rural smallholdings land)
Current population2
Estimated potential
population yield from additional
lots3
Estimated total
population4
1. Low density scenario (R10 / 4 ha / 40 ha)
1A 2,310 2,286 4,5961B 2,310 2,286 4,596
2. Medium density scenario (R20 / 2 ha / 20 ha)
2A 2,310 4,570 6,8802B 2,310 4,570 6,880
3. High density scenario (R30 / 1 ha / 8 ha)
3A 2,310 7,428 9,7383B 2,310 7,428 9,738
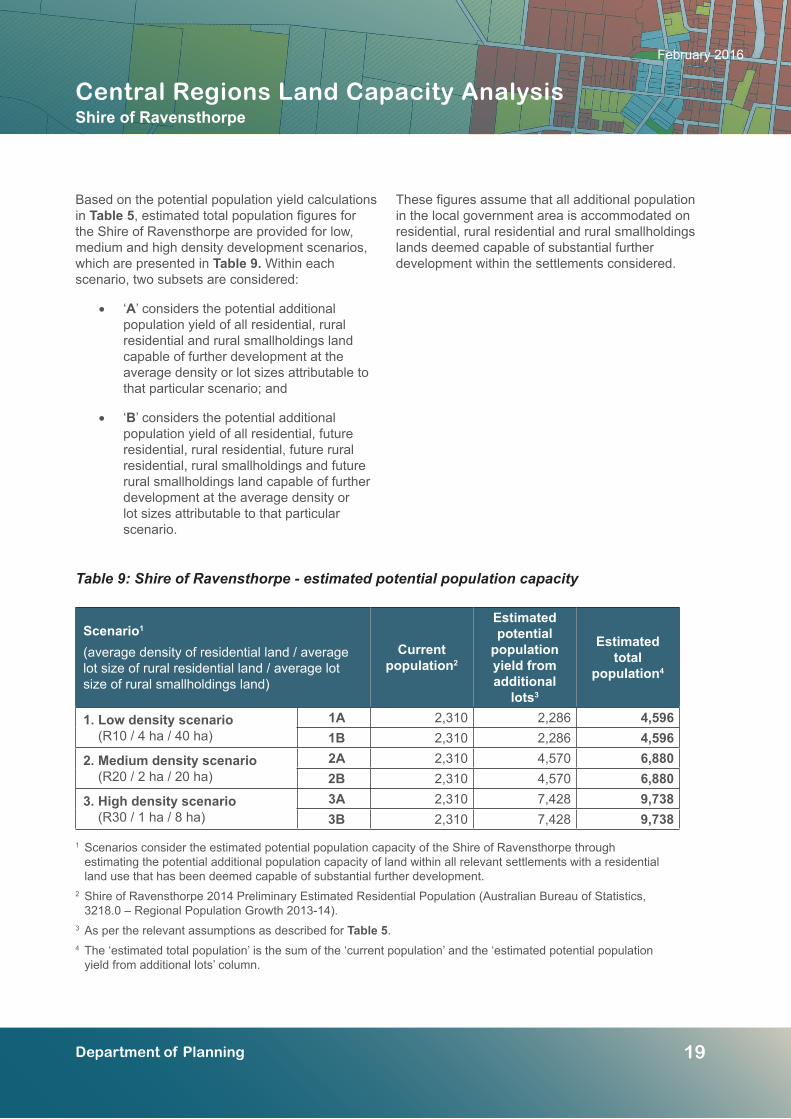
Table 9: Shire of Ravensthorpe - estimated potential population capacity
Scenarios consider the estimated potential population capacity of the Shire of Ravensthorpe through estimating the potential additional population capacity of land within all relevant settlements with a residential land use that has been deemed capable of substantial further development.
Shire of Ravensthorpe 2014 Preliminary Estimated Residential Population (Australian Bureau of Statistics, 3218.0 – Regional Population Growth 2013-14).
As per the relevant assumptions as described for Table 5.
The ‘estimated total population’ is the sum of the ‘current population’ and the ‘estimated potential population yield from additional lots’ column.
1
2
3 4
Based on the potential population yield calculations in Table 5, estimated total population figures for the Shire of Ravensthorpe are provided for low, medium and high density development scenarios, which are presented in Table 9. Within each scenario, two subsets are considered:
• ‘A’ considers the potential additional population yield of all residential, rural residential and rural smallholdings land capable of further development at the average density or lot sizes attributable to that particular scenario; and
• ‘B’ considers the potential additional population yield of all residential, future residential, rural residential, future rural residential, rural smallholdings and future rural smallholdings land capable of further development at the average density or lot sizes attributable to that particular scenario.
These figures assume that all additional population in the local government area is accommodated on residential, rural residential and rural smallholdings lands deemed capable of substantial further development within the settlements considered.

Central Regions Land Capacity Analysis
Department of Planning
Shire of Ravensthorpe
February 2016
20
WA Tomorrow forecast bands
2026 forecast
population
Additional population
Band A 1,960 -350Band B 2,110 -200Band C 2,200 -110Band D 2,300 -10Band E 2,440 130
Table 10: Shire of Ravensthorpe - Western Australia Tomorrow 2026 population forecasts (WAPC, 2015)
3.2 Comparison of potential capacity estimates with the Western Australia Tomorrow 2026 population forecasts
Western Australia Tomorrow (Western Australian Planning Commission, 2015) contains population forecasts produced by the State Demographer and are considered to be the State’s official population forecasts.
Table 10 presents the Western Australia Tomorrow 2026 population forecasts for the Shire of Ravensthorpe. For further information on these forecasts, please refer to http://www.planning.wa.gov.au/publications/6194.asp.
The figures in the ‘additional population’ column are the difference between the 2026 forecast population and the Australian Bureau of Statistics 2014 Preliminary Estimated Residential Population for the Shire of Ravensthorpe (2,310).
Significantly, these forecasts provide a point of comparison for interpreting the potential capacities of residential land as determined through this analysis.
3.2.1 Estimated additional residential land requirements to accommodate population forecasts
Table 11 presents estimates for the amount of residential land that would be required to accommodate the additional population for each of the population forecasts. Estimates are presented according to three different average densities of residential development, being R10, R20 and R30.
These estimates are compared to the total of all current residential and future residential land identified in relevant Shire of Ravensthorpe settlements as being capable of substantial further development. The figures under the ‘surplus’ column indicate the magnitude of the potential surplus of residential land from the extents currently identified once the additional forecast population has been allowed for. A negative figure in this column indicates a shortfall in the identified areas of residential lands with respect to that required to accommodate the additional population from the relevant forecast.
The estimates in Table 11 assume:
• all population growth occurs on residential and future residential land that has been identified as being capable of substantial future development in this analysis. To keep the calculations relatively straightforward, they do not consider additional population being accommodated on rural residential or rural smallholdings lands, nor do they take into account potential increases in population occurring due to infill development. They therefore likely overestimate residential land requirements;
• a 35 per cent allowance from gross land areas for various requirements to support development (e.g. public open space, streets, other infrastructure); and
• the number of people per dwelling remains constant.

Central Regions Land Capacity Analysis
Department of Planning
Shire of Ravensthorpe
February 2016
21
Based on the current extents of zoned residential land and land identified for future residential purposes, this analysis suggests that there is a sufficient amount of land capable of substantial further development to cater for the population growth anticipated in the Western Australia Tomorrow 2026 population forecasts for the Shire of Ravensthorpe.
Please note that this component of the analysis only considers the local government as a whole as opposed to each individual settlement. This is primarily due to the alignment of available data inputs at this geographic scale.
Residential1
WA Tomorrow forecast bands
Additional population
Current and future land capable of substantial further de-velopment
(ha)2
R10 average density R20 average density R30 average density
Est. land required
to accom. additional population
(ha)3
Surplus (ha)4
Est. land required
to accom. additional population
(ha)3
Surplus (ha)4
Est. land required
to accom. additional population
(ha)3
Surplus (ha)4
Band A -350 104 0 104 0 104 0 104
Band B -200 104 0 104 0 104 0 104
Band C -110 104 0 104 0 104 0 104
Band D -10 104 0 104 0 104 0 104
Band E 130 104 8 96 4 100 3 101
Table 11: Shire of Ravensthorpe - estimated additional residential land requirements to accommodate population forecasts
These estimates assume that all population growth occurs on residential and future residential land that has been identified as being capable of substantial future development in this analysis. To keep the calculations relatively straightforward, they do not consider additional population being accommodated on rural residential or rural smallholdings lands, nor do they take into account potential increases in population occurring due to infill development. The estimates are therefore likely to overestimate residential land requirements.
Total area of current and future residential lands capable of substantial further development for entire local government area as per relevant figures from Table 1.
A 35 per cent allowance from gross land areas to support land requirements for public open space and streets (Liveable Neighbourhoods, 2007) and a population yield per dwelling of 2.6 people per dwelling unit (average people per household for the Goldfields SA3 plus the Esperance (S) LGA and Ravensthorpe (S) LGA – Australian Bureau of Statistics, 2011 Census) have been factored into the estimated areas of residential land required to accommodate forecast additional populations.
A positive figure in this column indicates that the additional population under the relevant population forecast should be able to be accommodated within the areas of residential and future residential land currently identified, without additional residential land being required. A negative figure represents the shortfall in the identified areas of residential lands with respect to that required to accommodate the additional population.
1
2
3
4