central pattana plc. - dcs-digital.com rent % of sales 29% • increase rental rate ... (crc) note...
TRANSCRIPT

Central Pattana Plc.P t D l t d I t tProperty Development and Investment
Analyst Briefing22 May 2014
CentralFestival Samui

Disclaimer
The information contained in this presentation is for information purposes only and does not constitute an offer or invitation to sell or the solicitation of an offer or invitation to purchase or subscribe for share in Central Pattana Public Company Limited (“CPN” and shares in CPN, “shares”) in any jurisdiction nor should it or any part of it form the basis of, or be relied upon in any connection with, any contract or commitment whatsoever.
This presentation may include information which is forward-looking in nature. Forward-looking information involve known and unknown risks, uncertainties and other factors which may impact on the actual outcomes, including economic conditions in the markets in which CPN operates and general achievement of CPN business forecasts, which will cause the actual results, performance or achievements of CPN to differ, perhaps materially, from the results, performance or achievements expressed or implied in this presentation.
This presentation has been prepared by the CPN. The information in this presentation has not been independently verified. Norepresentation, warranty, express or implied, is made as to, and no reliance should be placed on, the fairness, accuracy, completeness or correctness of the information and opinions in this presentation. None of the CPN or any of its agents or advisers, or any of their respective affiliates, advisers or representatives, shall have any liability (in negligence or otherwise) for any loss howsoever arising from any use of this presentation or its contents or otherwise arising in connection with this presentation.
This presentation is made, furnished and distributed for information purposes only. No part of this presentation shall be relied upon directly or indirectly for any investment decision-making or for any other purposes.
This presentation and all other information, materials or documents provided in connection therewith, shall not, either in whole or in part, be reproduced, redistributed or made available to any other person, save in strict compliance with all applicable laws.
2Note: All currency figures within this presentation are presented in Thai Baht unless otherwise stated.

Agenda
► 1Q14 Overview
► Operational Performance
► Future Developments
► Financial Performance
► Future Developments
► Appendix
3

1Q14 Overview Grand Opening of CentralFestival Samuion 29 March 2014
Operations
o CentralFestival Samui was launched on 29 March 2014. with a 70% of occupancy rate on the opening date.
on 29 March 2014
o Total net leasable area (NLA) in 1Q14 was 1,177,416 sq.m. with an average occupancy rate of 95% both in Bangkok metropolitan area (BMA) and in provinces.
o 1Q14 same store effective rental rate achieved +4.5% growth YoY. (1)
Financial Highlights
1Q14
o Revenues +8% YoY
Operating profit +4% YoYo Operating profit +4% YoY
o Net profit +3% YoY
o Revenues (on same store basis) -5% YoY (2)
o Net D/E 0.45 time
Note 1: Excludes CentralWorld, CentralPlaza Ubonratchathani, CentralFestival Chiangmai and CentralFestival Hatyai. CentralFestival Samui.Note 2. Excludes CentralPlaza Ubonratchathani, CentralFestival Chiangmai and CentralFestival Hatyai. CentralFestival Samui. Same store revenue growth would have been +5% if excluded discounts given at CTW in 1Q14 together with backdated service income and the raise of service charged from tenants in 1Q13.
4

Operational Performance
5

Property Locations
Shopping Centers (10 BMA, 14 Provinces)
1 (BMA) Pure-managed (CPNRF)
Equity-owned (CPN)Existing Projects (24)
1 (BMA)
18 (9 BMA, 9 Provinces)
4 (Provinces)
1 (Province)centralcenter
g ( )
Under construction
Offices (7)
Hotels (2)
1 (Province) centralcenter
Bangkok Metropolitan Area (BMA)
Residences (2)
Shopping Centers (5 Domestic, 1 Overseas)
New Projects (6)Residences (2)
3 (BMA: Bangyai, East Ville and Salaya)
2 (Provinces: Rayong, and Nakhonratchasima)
1 (Overseas: Malaysia)
Asset Enhancements (2)Groove@CentralWorld (Expansion)
CentralPlaza Bangna (Renovation and remerchandising mix phase by phase)
6Note: As of 31 March 2014.

Leasable Area and Occupancy: Retail
As of 1Q14, CPN owns 24 premium shopping centers with average occupancy rate of 95%.
Occupancy Rate (2)Net Leasable Area(1) (sq m )Land
Freehold Leasehold Retail Department Store Total 1Q14 4Q13 1Q13
CPN in BMA 10 4 6 515,281 63,583 578,864 96% 97% 96%
No. of Projects
Occupancy Rate ( )Net Leasable Area( ) (sq.m.)Retail Properties
Land
CPN in Provinces 14 11 3 544,161 54,391 598,552 94% 97% 97%
Total Retail Properties(3) 24 15 9 1,059,442 117,974 1,177,416 95% 97% 97%
Breakdown by Rental Income Breakdown by NLA Breakdown by no. of Shopping Malls
Provincial42%
BMA55%
Provincial 45% BMA
49%Provincial
51%
BMA 10Provincial
14
7Note 1: Excludes rental agreements < 1 year, such as kiosk, carts, ATMs and coin machines. Note 2: Percentage based on leasable area. Note 3: Excludes areas transferred to CPNRF.

Leasable Area and Occupancy: Non-core Properties
Office, residential property and hotel are considered non-core businesses, complementing shopping center business and adding value to the overall project.
Net Leasable Area (sq m ) Occupancy Rate (2)Net Leasable Area (sq.m.)
orNo. of Units or Room(1) 1Q14 4Q13 1Q13
Offi i BMA(3) 5 55 102 98% 96% 95%
Non-core Properties No. of Projects
Occupancy Rate
Office in BMA(3) 5 55,102 98% 96% 95%
Residential in BMA 2 6,373 sq.m. or 61 units 70% 68% 67%
Hotel in provincial area(4) 2 561 rooms 77% 76% 81%
Revenue Breakdown
p
Office 2%
Retail
F&B 4%
Hotel 4%
Management83%
Management fee 2%
Other income 5%
8Note 1: Excludes storage.Note 2: Percentage based on leasable area.Note 3: Excludes areas transferred to CPNRF and CPNCGNote 4: Outsource the management, Pattaya (302 rooms) managed by Hilton and Udonthani (259 rooms) managed by Centara.
Occupancy rate of Hotel Business was an average of 3 months (January – March).

Rental Contract Type : By Area
• Tenants: food centers, cineplexand international brands such as
(up to 3 years)Monthly basis collection
(up to 3 years)Monthly basis collection
“McDonalds”, “KFC”• Range of percentage: 10% - 30%
of sales• With minimum guarantees
Fixed Rent
% of Sales29%
• Increase rental rate approx 5% p.a.
• Approx. 1/3 of rental contract expired every year
(up to 3 years)
Long-term Lease22%
Fixed Rent49%
expired every year
(up to 30 years)Up-front collection
• Up-front payment – realize throughout lease contract period on straight-line basis p g
Note: In addition to space rental fee, service p ,& utility fees are collected on a monthly basis
9Note: Percentage based on occupied area. Source: Company estimate as of 31 March 2014.

Effective Rental Rate (1)
Overall effective rental rate declined in 2009 – 2011 from new malls in provinces. 1Q14 same store rental grew by 4.5% YoY.
Same Store Rental Rate of Bangkok Malls(2)
1,616 1,665
1 600
1,800 (Bt/sq.m./mth)
1,447 1,499 1,484 1,455
1,519 1,600 (Bt/sq.m./mth) Same Store Rental
1,000
1,200
1,400
1,600
1,274 1,254 1,225 1,248 1,200
1,400
600
800
1,000
1Q13 1Q14
1,268 1,347 1,400
(Bt/sq.m./mth)800
1,000
2008 2009 2010 2011 2012 2013 1Q14 1Q13 1Q14
Same Store Rental Rate of Provincial Malls(2)
1,000
1,200
All Projects Malls excluded:
• CentralPlaza Ubonratchathani
600
800
1Q13 1Q14
• CentralFestival Chiangmai
• CentralFestival Hatyai
• CentralFestival Samui
• CentralWorldQ Q
10Note 1: The figures are effective rental rates for retail tenants (occupied space < 1,000 sq.m.) and net of special rental discounts.Note 2: Excludes CentralPlaza Ubonratchathani, CentralFestival Chiangmai, CentralFestival Hatyai, CentralFestival Samui, and CentralWorld.Source: Company estimate as of 31 March 2014.

Expiration of Long-term Lease Contracts(1)
Long term lease contract will be expired in each of the following years. This area will be converted to a short term contract at market rental rate which could increase the company’s revenues.
The expiration area(2)
and expiration period are shown below :
60%
26%40%
50%
20%
30% Anchor
Retail
3%
12%
2% 2% 2%4%
24%10% 14%
10%
4%0%
2014 2015 2016 2017 2018 2019 2020 ≥ 2021
11(1) Source: Company estimate as of 31 December 2013.(2) Total lease area is 192,118 sq.m. with less than 4% rental income contribution.(3) In 2015, area excludes Big C at Central Center Pattaya. The upside from short-term contract renewal is subject to the renewal of the land lease ofCentral Center Pattaya .

Future Developments
12

Domestic Expansion Net Leasable Area(sq.m.)
New Retail Properties in BMA 3 143,400
Project under construction No. of Projects
New Retail Properties in Provinces 2 88,000Total Retail Properties(3) 5 231,400
BMA PROVINCES
20142015
CentralPlaza Salaya (BMA)NLA: 33,900 sq.m.Opening in 3Q14
CentralPlaza Rayong (East)NLA: 33,000 sq.m.Opening in 2Q15
CentralPlaza Nakhonratchasima(Northeast)CentralWestGate (Bangyai)
2015 2016
(Northeast)NLA: 55,000 sq.m.Opening in 2Q16
( gy )(BMA)NLA: 75,000 sq.m.Opening in 2Q15
CentralFestival East Ville (BMA)
13Source: Company estimate as of 31 March 2014.
NLA: 34,500 sq.m.Opening in 4Q15

New Projects in Thailand (Open in 2014 - 2015)
CentralWestGateCentralPlaza RayongCentralPlaza Salaya
Investment Cost(1) 2,500 Bt. mil 2,400 Bt. mil 6,400 Bt. mil
Net Leasable Area(2) 33 900 sq m 33 000 sq m 75 000 sq mNet Leasable Area( ) 33,900 sq.m. 33,000 sq.m. 75,000 sq.m.
Parking 1,600 cars 1,500 cars 2,000 cars
Joint Developer(3) Central Department Store Robinson Department Store Central Department Store
Land Size(4) 70 i 60 i 100 iLand Size(4) 70 rais 60 rais 100 rais(Freehold & Leasehold) (Freehold) (Leasehold)
Location Nakornpathom Rayong Bangyai, NonthaburiOpening (tentative) Aug-14 2Q15 2Q15p g ( ) g
Note 1: Includes land and construction cost of shopping center and parking building. Excludes those of Central Department Store or Robinson Department Store (CRC)Note 2: Excludes CRC’s area.Note 3: Area will be developed and owned by the joint developer. However the store will serve as a magnet to draw traffic into CPN’s plaza area.Note 4: 1 rai = 1,600 sq.m.
14

New Projects in Thailand (Open in 2015 - 2016)
CentralPlaza NakhonratchasimaCentralFestival East Ville
Investment Cost(1) 3 200 Bt mil 4 000 Bt milInvestment Cost 3,200 Bt. mil 4,000 Bt. mil
Net Leasable Area(2) 34,500 sq.m. 55,000 sq.m.
Parking 1,900 cars 3,000 cars
Joint Developer(3) Central Department Store Central Department StoreJoint Developer( ) Central Department Store Central Department Store
Land Size(4) 51 rais 52 rais(Freehold & Leasehold) (Freehold)
Location Ekkamai- Ramintra NakhonratchasimaOpening (tentative) 4Q15 2Q16
Note 1: Includes land and construction cost of shopping center and parking building. Excludes those of Central Department Store or Robinson Department Store (CRC)Note 2: Excludes CRC’s area.Note 3: Area will be developed and owned by the joint developer. However the store will serve as a magnet to draw traffic into CPN’s plaza area.Note 4: 1 rai = 1,600 sq.m.
15

Overseas Expansion
South East Asia in FocusInvestment Strategies:■ Joint venture with local partners focus on retail properties
Completed JV Agreement
Potential Locations
■ To be a property manager
Thailand
Malaysia
Malaysia
VietnamShah Alam, Selangor
Malaysia
Indonesia
16

New Project in Malaysia
CentralPlaza i-City
Investment Cost ( 1 ) 5,800 Bt. mil Joint venture i-City Properties Sdn Bhd (“ICP”), an I-Berhad wholly-own subsidiaryJoint venture i City Properties Sdn Bhd ( ICP ), an I Berhad wholly own subsidiary
CPN holds 60% stake and ICP holds 40% stakeCPN will lead in the development and management of the shopping mall
Program: Shopping Center 89,700 sq.m. (NLA includes department store)L d Si 11 12 27 5 iLand Size 11.12 acres or 27.5 raisLocation i-City, Shah Alam, Selangor Darul Ehsan, MalaysiaOpening (Tentative) 4Q2016
17Note 1: Includes land and construction cost of shopping center and parking building.

Assets Enhancement
Groove@CentralWorld CentralPlaza Bangna
Groove@CentralWorld CentralPlaza BangnaGroove@CentralWorld CentralPlaza Bangna
Investment Cost 600 Bt. mil 1,400 Bt. milNet Leasable Area 7,500 sq.m. 62,000 sq.m.
( Incremental NLA 4 000 sq m ) ( Incremental NLA 4,000 sq.m.)Type Expansion Renovation and remerchandising
mix phase by phaseOpening (tentative) Dining Zone: Dec-13 Jul-14
Fashion Zone: May-14
18

Future Leasable Area & Occupancy Rate
97% 98% 96% 95% 96% 97% 96% 97% 96% 95%
90%
100%
1 600 000
1,800,000
Retail NLA (sqm)
70%
80%
90%
1 200 000
1,400,000
1,600,000
50%
60%
70%
800 000
1,000,000
1,200,000
40%
50%
600,000
800,000
2007
2008
2009
2010
2011
2012
2013
014F
015F
016F
2 2 2 2 2 2 2 20 20 20
Under study projects Under developing projects Exisitng projects % Occupancy (RHS)
Assets under management 2007 2008 2009 2010 2011 2012 2013 2014F 2015F 2016F No of project 10 11 15 15 18 20 23 25 28 33No.of project 10 11 15 15 18 20 23 25 28 33 Retail space (NLA in sqm) 697,038 761,111 967,430 964,612 1,059,910 1,121,377 1,286,125 1,354,125 1,494,125 1,686,825 Office space (NLA in sqm) 144,791 144,280 163,746 163,991 175,831 169,133 169,152 169,152 169,152 169,152 Hotel (rooms) 255 557 561 561 561 561 561 561 Residential (units) 61 61 61 61 61 61 61 61 61 61
19Source: Company estimate as at 31 December 2013.Retail space: Includes leasable area of CentralPlaza Rama 2, CentralPlaza Rama 3, and CentralPlaza Pinklao which were partially transferred to CPNRF, but still under CPN’s management.Office space: Includes leasable area of The Office @CentralWorld which was transferred to CPNCG, but still under CPN’s management.

Capital Expenditure(Bt.m
Major capital expenditure will be used to develop new projects. Financing plan for future expansion includes: cash flow from operation, bond issuance and/or project finance, and property fund vehicle.
(Bt. mil)
Actual EstimatesCPN' P j t 2013 2014 2015 2016
(Bt.mil)CPN's Projects 2013 2014 2015 2016 Under-construction Projects 9,163 7,962 3,883 1,599 Enhancement Projects 1,818 2,277 1,200 1,200 Potential Projects 764 5,757 10,771 13,666 Total CAPEX 11,745 15,996 15,854 16,466
20Source: Company estimate as of 31 December 2013.

Financial Performance
21

(Bt.mil)
Financial SummaryR i f C t lW ld
17,687
21,234
18 000
20,000
22,000
24,000
6-mth Closure of CentralPlaza Lardprao
• Reopening of CentralWorld• Relaunch of CentralPlaza Udonthani
11,755 11,38812,766
10 000
12,000
14,000
16,000
18,000 6-mth Closure of CentralWorld
5,634
3,1122,442 2,620
5,5907,345
2,1091 710
4,952
1 1252,058
6,189 6,293
1,7102 000
4,000
6,000
8,000
10,000
2,292 1,552 1,871 4,4135,991 1,7101,125 ,
0
2,000
2009 2010 2011 2012 2013 1Q14Total revenues Operating profit Net profit Net profit (Inc. non-recurring)
% YoY Growth 2009 2010 2011 2012 2013 1Q14Total revenues /1 27% (3%) 12% 39% 20% 8% Operating profit 4% (22%) 7% 113% 31% 4% Net profit 6% (32%) 21% 136% 36% 3% Net profit (inc non recurring) (77%) 83% 201% 2% 3%
Same store revenue growth would have been +5% if excluded discounts given at CTWNet profit (inc. non-recurring) (77%) 83% 201% 2% 3%
Same store revenue growth 5% 0% 9% 29% 12% (5%)
Gross Profit Margin (%) /2 43% 39% 39% 47% 50% 52%EBITDA Margin (%) /2 44% 42% 43% 50% 51% 55%
discounts given at CTW in 1Q14 together with backdated service income and the raise of service charged from tenants in 1Q13.
22Note 1: Total revenue includes rental & service, hotel operation, food & beverage, and other incomes.
Excl. interest income, share of profit from investment and reversal of impairment.Note 2: Excl. non-recurring items i.e. reversal of impairment but incl. other income .
EBITDA Margin (%) 44% 42% 43% 50% 51% 55%

Revenue Breakdown
17,687
21,234 20,000
24,000
(Bt.mil)Total revenues /1 +8% YoY or +423 Bt.mil YoY mainly driven from rent and services.Rent and services +8% YoY
• The full-quarter realization of three new
12,765
5 789 5 6348,000
12,000
16,000 The full quarter realization of three new projects launched in 2013 i.e. CentralPlazaUbonratchathani, CentralFestival Chiangmai, and CentralFestival Hatyai
• Same store revenue dropped 5% YoY.
+8% YoY-3% QoQ
5,211 5,789 5,634
0
4,000
,
2011 2012 2013 1Q13 4Q13 1Q14
Hotel +5% YoY• Higher Rev/Par of both hotels, especially at
Hilton Pattaya Hotel together with a slightly higher occupancy
Retail Office F&B Hotel Other income Management fee
FY13 Revenue breakdown
F&B sales +13% YoY• Contributions from the new food courts at the
CentralPlaza Ubonratchathani, CentralFestivalChiangmai and CentralFestival HatyaiChiangmai, and CentralFestival Hatyai.
Retail 83%
Office 2%
F&B 4%
Hotel 4%Hotel 4%
Management fee 2%
Other income 5%
23Excludes non-recurring income.Note 1: Includes revenues from residential projects and water & amusement park, and property management fees from CPNRF & CPNCG.

(Bt il)
Costs Breakdown
7 783
9,434 10,542
10,000
12,000 (Bt.mil)
Total Costs +9% YoY or +231 Bt.mil YoY.
Rent and Services 10% YoY• A rise in costs incurred by three newly opened
malls in 2013 including CentralFestival Samui7,783
4 000
6,000
8,000 malls in 2013 including CentralFestival Samuiwhich has recently opened in March 2014.
Hotel Business +3% YoY• Despite a 5% increase q-o-q in revenue given
that the supplies cost was lowered by 4 MB in
+9% YoY-3% QoQ
2,492 2,821 2,723
0
2,000
4,000
2011 2012 2013 1Q13 4Q13 1Q14
pp y1Q14 over the last quarter
F&B +8% YoY• Change in costs reflected the growth in food
and beverage sales.2011 2012 2013 1Q13 4Q13 1Q14
Retail Office F&B Hotel Others
FY13 Cost breakdown
• Increased costs incurred from new food courts launched in 2013.
Retail
Office2%
F&B6%Retail
89%6%
Hotel3%
24Note: Excludes non-recurring items.

SG&A Expenses Breakdown
2 4102,741
3,446
3,000
3,500
(Bt.mil) SG&A expenses +13% YoY or +92 Bt.mil YoYdue mainly to administrative expenses of three newly opened malls including additional personnel expense to cater for business expansion+13% YoY2,410
959 1,201
1,000
1,500
2,000
2,500 13% YoY
-33% QoQ
807
0
500
2011 2012 2013 1Q13 4Q13 1Q14
Personnel Advertising & promotion Depreciation Others
FY13 SG&A breakdownAdvertising
Personnel46%
g& Promotion
18%
DepreciationDepreciation18%
Others22%
25Note: Excludes non-recurring items.

Debt AnalysisAA- Credit Rating
Upgraded to “AA-” ratings with “Stable” outlook by TRIS Rating in 12 May 2014
All borrowings are denominated in THB
Outstanding Borrowings 19,787 Bt.mil Fixed vs. Floating Interest Rate Mix
Long-term loan24% Sh
All borrowings are denominated in THB.
24% Short-term loan28%
Long-term bond42%
Fixed89%
Floating11%
Financing Cost
Short-term bond6%
874 1,057
8134.7% 4.4% 4.3%
4.4%
4.3% 4.4% 4.3% 4 0%
5%
6%
1,000
1,200
(Bt.mil)
745 688
813
216
4.0%
2%
3%
4%
400
600
800
216 156 179
0%
1%
0
200
2009 2010 2011 2012 2013 1Q13 4Q13 1Q14
26Note: Weighted average interest rate was derived from interest expenses including interest capitalization for projects under development.
Interest expenses Weighted average cost of debt (RHS)

Capital Structure
CPN’s net D/E stood at 0.45 times, against its debt covenant of 1.75 times.
(Times)(Bt.mil)
25 900
36,824 38,564
1.20
1.40
30 000
35,000
40,000
( )
16,669 19,085
25,245 25,568
19,842 19,787 19,008 18,918 20,448
25,900
1.19 0.82 0 60
0.80
1.00
20,000
25,000
30,000
2 541 1 6324,207
1 869 2 279
0.74 0.92
1.19
0.49 0.45
0.20
0.40
0.60
5,000
10,000
15,000
2,541 1,632 945 1,869 2,279
0.000 2009 2010 2011 2012 2013 1Q14
Cash & current investment Interest bearing debts Equity Net D/ECash & current investment Interest bearing debts Equity Net D/E
27

Key Trading Statistics and Dividend
Dividend Key Trading Statistics
Key Metrics THB Key Metrics 2013 2012 2011 2010 2009 2008
Par Value 0.50
Stock Price 47.00
EPS 0 38
Par Value (THB) 0.50 0.50(3) 1.00 1.00 1.00 1.00
Dividend (THB/Share)
0.55 0.475 0.37 0.25 0.58 0.33
Dividend Paid 2 468 2 070 806 545 1 264 719EPS 0.38
P/E (x)(1) 33.52
Market Capitalization (Bt. bn) 211
Dividend Paid(Bt. mil)
2,468 2,070 806 545 1,264 719
Dividend Payout Ratio
39.2% 33%(2) 39% 48% 25%(1) 33%
Dividend policy is paid annually not less than 40% of net profit (unless there is
compelling reason against this).
Note 1: Dividend payout ratio of 25% in 2009 was derived from 40% of normal net profit and 14% of
Market Capitalization (Bt. bn) 211
Authorized Share Capital (mil. shares) 4,488
Note 1: Bloomberg’s consensus as of 31 March 2014.
gain from transferring assets into CPNRF.
Note 2: Dividend payout ratio of 33% in 2012 was derived from 40% of normal net profit and 17% of
gain from transferring assets into CPNCG.
Note 3 Par spilt to THB 0 50 per share effecti e on 7 Ma 2013
g
Note 3: Par spilt to THB 0.50 per share effective on 7 May 2013
28

Appendix
29

Statement of Financial Position
Current assets
Financial position (MB) 1Q14 % Change4Q13
Current assets
Cash and current investments 1,869 2,279 22%
Other current assets 3,630 3,302 (9%)
Total current assets 5 499 5 581 1%Total current assets 5,499 5,581 1%
Non-current assets
Investment properties (2) 53,575 55,017 3%
Leasehold rights 11 457 11 594 1%Leasehold rights 11,457 11,594 1%
Property & equipment (PP&E) 2,353 2,297 (2%)
Other non-current assets 4,655 4,658 0%
T t l N t t 72 040 73 565 2%Total Non current assets 72,040 73,565 2%
Total assets 77,539 79,146 2%
Current liabilities 15,458 15,703 2%
Non-current liabilites 25,257 24,879 (1%)
Total liabilities 40,715 40,582 (0%)
Total equities 36,824 38,564 5%
30Note1: Investment Properties are booked at cost and depreciated with the straight-line basis over the life of the assets. The estimated fair value is 115,803 Bt.mil
(2012 : 89,402 Bt.mil ), stated in the disclosure notes to the main financial statement no. 14 under “Investment Properties”.

Statement of Comprehensive Income1Q13 4Q13 1Q14 % YoY % QoQ
Change Change
Revenue from rent and services 4,424 4,829 4,793 8% (1%)
Retail 4,326 4,726 4,691 8% (1%)
Consolidated earnings (MB)
, , , ( )
Office 93 98 98 6% 0%
Other supportive businesses 5 5 4 (6%) (4%)
Revenue from hotel operation 244 244 255 5% 5%
Revenue from food and beverage 200 247 225 13% (9%) Revenue from food and beverage 200 247 225 13% (9%)
Other income(1) 344 469 361 5% (23%)
Total revenues 5,211 5,789 5,634 8% (3%) Cost of rent and services 2,250 2,552 2,466 10% (3%)
Retail 2,196 2,492 2,416 10% (3%)
Office 50 50 46 (7%) (8%)
Other supportive businesses 4 10 4 (10%) (63%)
Cost of hotel operation 78 81 80 3% (2%) Cost of hotel operation 78 81 80 3% (2%)
Cost of food and beverage 164 187 177 8% (5%)
Total costs 2,492 2,821 2,723 9% (3%)
Operating profit(1) 2,026 1,783 2,109 4% 18%
N t fit 1 656 1 750 1 710 3% (2%)Net profit 1,656 1,750 1,710 3% (2%) Normalized net profit 1,656 1,373 1,710 3% 25%
EPS (Bt) excluding non-recurring items(2) 0.37 0.31 0.38 3% 25%
31(1) Excluding other income from the reversal of allowance for impairment of assets(2) Number of shares used to calculate EPS is 4,488,000,000 shares, which is the number after the par split and the capital increase.

Operational Performance: CPNRF and CPNCG
In 1Q14, CPN Retail Growth Leasehold Property Fund (“CPNRF”) had three shopping centers and two office towers. In Sep12, CPN Commercial Growth Leasehold Property Fund (“CPNCG”) was launched and currently owns one office.
CPNRF d CPNCG d b SCB A t M t F d M Th i tiCPNRF and CPNCG are managed by SCB Asset Management, Fund Manager. Their properties are managed by CPN, Property Manager.
CPNRF P ti R i i Lif L bl A (1) Occupancy Rate (2)CPNRF Properties Remaining Life(years)
Leasable Area(1)
(sq.m.)Occupancy Rate (2)
1Q14 4Q13 1Q131. Rama 2 (Retail) 12 Years 87,691 96% 96% 99%
2. Rama 3 (Retail) 83 Years 37,255 96% 98% 98%
3 Pi kl (R t il) 11 Y 21 730 99% 100% 97%3. Pinklao (Retail) 11 Years 21,730 99% 100% 97%4. Pinklao Tower A & B (Office) 11 Years 33,760 97% 98% 97%
Total 180,436 97% 98% 98%
CPNCG Office Property Remaining Life(years)
Leasable Area(1)
(sq.m.)Occupancy Rate (2)
1Q14 4Q13 1Q13
CentralWorld (Office) 19 Years 80,585 100% 99% 99%
32Note 1: Includes rental agreements < 1 year such as kiosk, carts, ATMs and coin machines and CPN acts as the property manager.Note 2: Percentage based on leasable area.

CPN Retail Growth Leasehold Property FundCPN Retail Growth Leasehold Property Fund1st Quarter 2014 Financial Results22nd May 2014
1

Important Notice
The information contained in this presentation is for information purposes only and does not constitute an ff i it ti t ll th li it ti f ff i it ti t h b ib f it i CPN offer or invitation to sell or the solicitation of an offer or invitation to purchase or subscribe for units in CPN
Retail Growth Leasehold Property Fund (CPNRF and units in CPNRF, “Units”) in any jurisdiction nor should it or any part of it form the basis of, or be relied upon in any connection with, any contract or commitment whatsoever.
This presentation may include information which is forward-looking in nature Forward-looking information This presentation may include information which is forward looking in nature. Forward looking information involve known and unknown risks, uncertainties and other factors which may impact on the actual outcomes, including economic conditions in the markets in which CPNRF operates and general achievement of CPNRF business forecasts, which will cause the actual results, performance or achievements of CPNRF to differ, perhaps materially, from the results, performance or achievements expressed or implied in this presentation.expressed or implied in this presentation.
This presentation has been prepared by the CPNRF Property Manager. The information in this presentation has not been independently verified. No representation, warranty, express or implied, is made as to, and no reliance should be placed on, the fairness, accuracy, completeness or correctness of the information and opinions in this presentation. None of the CPNRF Property Manager or CPNRF Fund Manager or any of i i f i i ffi i i i i i iits agents or advisers, or any of their respective affiliates, advisers or representatives, shall have any liability (in negligence or otherwise) for any loss howsoever arising from any use of this presentation or its contents or otherwise arising in connection with this presentation.
This presentation is made, furnished and distributed for information purposes only. No part of this presentation shall be relied upon directly or indirectly for any investment decision-making or for any other presentation shall be relied upon directly or indirectly for any investment decision-making or for any other purposes.
This presentation and all other information, materials or documents provided in connection therewith, shall not, either in whole or in part, be reproduced, redistributed or made available to any other person, save in strict compliance with all applicable laws.
2

Contents
Page
1. Operations 5
2. Financial Highlights 10
3. Q&A
3

1. Operations1. Operations

Leasable Area and Occupancy
Occupancy rate of CPNRF Portfolio slightly decreased QoQ
Area (sqm) Occupancy Rate/1
Gross Area LeaseableArea
Number of Tenants/2 30 Jun 13 30 Sep 13 31 Dec 13 31 Mar 14
Rama 2 251,182 87,691 312 95.2% 95.3% 95.9% 96.1%
Rama 3 169,740 37,255 250 97.3% 97.0% 97.7% 96.7%
PinKlao (Plaza) 135,018 21,730 115 99.2% 99.1% 100.0% 99.0%
Pinklao Office Tower A&B 50,653 33,760 103 98.5% 97.6% 98.1% 97.5%
Total 606,593 180,436 780 96.7% 96.5% 97.2% 96.8%
Source: CPN Note:/1 Anchor and shop tenants only/2 Number of tenants excluding those with long-term lease with upfront rent, kiosks, carts, ATMs and coin machines as at 31 March 2014
5

New and Renewed Lease Profile
Rental rates for the 3 malls have continued to grow by 5.9%
From 1 January to 31 March 2014/1
Renewal and New Leases/1Increase / (Decrease) in
Rental Rate (p a )/3N f L A ( ) % f T t l/2 Rental Rate (p.a.)/3No. of Leases Area (sqm) % of Total/2
Rama 2 8 1,763 2.0% 6.6%
Rama 3 12 1,853 5.0% 4.9%
Pinklao (Plaza) 7 716 3.3% 4.5%
Pinklao Office Tower A & B 1 262 0.8% 12.2%
Total 28 4 594 2 5% 5 9%
Source: CPN
Total 28 4,594 2.5% 5.9%
Note:/1 Exclude rental agreements < 1 year/2 Percentage of leasable area as at 31 March 2014/3 Exclude rental agreements with revenue sharing clause
6

Lease expiry profile
Well balanced lease expiry profile
53%
50%
60%
23%
33%
17%
27% 27%22%
32%28%
40%
31%
24%26%
% 16%20%
30%
40%
Central Department
14%9% 7%
17%
0%
8%
1%
16%
0%
16%
0%
10%
20%
Apr Dec2014 2015 2016 2017 - 2024
Department Store lease expiring 2025
CDS 2025
Source: CPNNote:
Apr -Dec2014 2015 2016 2017 - 2024Rama II Rama III Pinklao (Plaza) Pinklao Office Tower A & B Total Portfolio
Note:1. Percentage of total occupied area as at 31 March 20142. Exclude rental agreements < 1 year
7

Rental Structure Profile
100%
72%
93%100%
70%80%90%
100%
d A
rea
52% 48%
28%
20%30%40%50%60%
% o
f Occ
upie
d
7%0%
0%10%20%
Rama II Rama III Pinklao (Plaza) Pinklao Office Tower A & B
Fi d R t % f S l R t
Note:
Fixed Rent % of Sales Rent
Note: 1. % of total occupied area excluding those with long-term lease with upfront rent as at 31 March 20142. % of total number of tenants excluding those with long-term lease with upfront rent, kiosks, carts, ATMs and coin machine as at 31 March 2014
8

2 Financial Highlights2. Financial Highlights

Income breakdown : 1Q14
Good performance across the three assets maintains both QoQ and YoY growths for the Fund
Fund's other income5%
Rama 239%
Rama 3
Pinklao33% THB 699mn, +1% QoQ and +7% YoY
Rama 323%
10

Profit & Loss
Net Investment Income slightly increased by 5% QoQ and 8% YoY
Unit : Baht Million 1Q14 4Q13 QoQ 1Q13 YoY
Property level
Total income 698 691 +1% 651 +7%
T t l (38) (56) 32% (40) 4%Total expenses (38) (56) -32% (40) -4%
Property management fees (86) (87) -1% (81) +7%
Net income from property level 574 548 +5% 531 +8%
Fund levelu d e eOther income 1 3 -60% 6 -79%
Fund management fee and etc. (7) (7) +1% (6) +5%
Interest expenses (4) (5) -12% (6) -24%
Net investment income 564 540 +5% 525 +8%
Net realised (loss)/gain on investments 2 (0) - - -100%
Net unrealised (loss) gains from investment 286 484 -41% (369) -
Net increase in net assets 851 1 023 17% 156 +446%Net increase in net assets 851 1,023 -17% 156 +446%
11

Balance Sheet
Unit : Baht Million except indicated Mar-14 Dec-13 QoQ
Investments in properties at fair value 18,830 18,535 +2%
Cash and near cash 996 995 +0%
Other assets 258 250 +3%
Total Assets 20,084 19,780 +2%
A/P and accrued expenses 99 99 -0%
Deposits received from customers 800 802 -0%
Loan from SCB 305 340 -10%
Other liabilities 202 712 -72%
Total Liabilities 1,406 1,953 -28%
C it l i d f ith ld 16 963 15 764 8%Capital received from unitholders 16,963 15,764 8%
Retained earnings 1,715 2,063 -17%
Net Asset Values 18,678 17,827 +5%
NAV per unit (Baht) 11 4144 10 8942 +5%NAV per unit (Baht) 11.4144 10.8942 +5%
12

Distribution Summary
Interim Dividend (16 Dec – 31 Mar 2014)(DPU of Bt 0.3600)
Unit : Baht Million except indicated 1Q14 4Q13 QoQ 1Q13 YoY
Net investment income 564 540 +5% 525 +8%
Actual distribution
via Dividend 589/2 491/1 +20% 483 +22%
Baht per unit 0.3600 0.3000 +20% 0.2949 +22%
via Par Reduction - - - - -
Baht per unit - - - - -p
Total distribution 589 491 +20% 483 +22%
Baht per unit 0.3600 0.3000 +20% 0.2949 +22%
% of Net investment income 104% 91% +13.5% 92% +12.4%
A li d di t ib ti i ld /2 9 2% 7 7% 1 5% 7 6% 1 7%
/1 Dividend paid from operating profit period from 1 Oct 2013 – 15 Dec 2013 /2 Dividend paid from operating profit period from 16 Dec 2013 – 31 Mar 2014/2 Based on unit price of 15.60 Baht as at 19 May 2014 (For the current quarter and next 9 months)
Annualised distribution yield /2 9.2% 7.7% +1.5% 7.6% +1.7%
p y ( q )
13

Shareholder Structure and Dividend
Dividend Policy• 4 times a year
Listed on the SET 23 August 2005 Units Outstanding 2,212.5M Units
DPU
4 times a year• Pay out a minimum of 90% of distributable income
Units Outstanding 2,212.5M UnitsRegistered Fund Size Baht 24,406.2M NAV (Mar 2014) Baht 11.4144
Unitholders Information(as at 21st Nov 2013) 0.8716 0.9201 0.9910 1.0230 1.1289 1.2283/1
Y2008 Y2009 Y2010 Y2011 Y2012 Y2013 1Q14 (Interim Div)
0.3600/2
THAI 88.03%
CPN 27.91%
Institution 20.35%
Individual 39.77%
FOREIGN 11 97%2008 2009 2010 2011 2012 2013/2 1Q14/4
Note: /1 2013 dividend for operating period from 1Jan - 15 Dec 2013/2 Dividend for operating period 16 Dec 2013 – 31 Mar 2014
FOREIGN 11.97%
Institution 11.93%
Individual 0.04%
Annualized Yield/3 11.17% 9.95% 8.26% 7.75% 5.94% 7.82% 8.40%
14
/3 Based on unit price as at the end of each period (For the previous 12 months)/4 Based on unit price as at 31 Mar 2014 (From 1 Jan - 31 Mar 2014)
0.04%

CPNRF Fund Structure
Land Owner Land Owner
Lease of land Lease of land90 2 9 3 Rai90-2-9.3 Rai
(Principle Leasing Contract)90-2-9.3 Rai
(Principle Leasing Contract)
Central PattanaRama 2 Co., Ltd
Central PattanaRama 3 Co., Ltd
Central Pattana Plc. (Central Plaza Pinklao)
Central Pattana Plc.
Lease of land S bl f Lease of Sublease of land
53-2-39.4 Rai20 Years
Lease of buildingand parking
20 years
Lease of land and building30 + 30 + 30
years
Sublease of land
24-02-84 Rai15 Years
Lease of shopping
complex and office building
15 years
Property Manager
15
CPN Retail Growth Leasehold Property Fund (CPNRF)

CPNRF Fund Information
Name CPN Retail Growth Leasehold Property Fund (“CPNRF”)
Property Manager Central Pattana Public Company Limited (“CPN”)Property Manager Central Pattana Public Company Limited ( CPN )
Fund Manager SCB Asset Management Company Limited
Trustee Kasikorn Bank Public Company Limited
Registrar The Siam Commercial Bank Public Company Limited
Assets CentralPlaza Rama 2, CenteralPlaza Ratchada-Rama 3, CentralPlazaPinklao, and CentralPlaza Chiangmai Airport
Type Property Fund Type I (Indefinite Life)
Total Fund Size Baht 24,406.21 MB
Fund Registered Date 11 August 2005Fund Registered Date 11 August 2005
Fund Investing Date
15 August 2005 for CentralPlaza Rama 216 August 2005 for CentralPlaza Ratchada-Rama 3
f ig
4 November 2009 for CentraPlaza Pinklao24 April 2014 for CentralPlaza Chiangmai Airport
Fund Listed Date 23 August 2005
16
Secondary Market The Stock Exchange of Thailand (“SET”)

CPN Commercial Growth Leasehold Property Fund1st Quarter 2014 Financial Results22nd May 2014
1

Important Notice
The information contained in this presentation is for information purposes only and does not constitute an ff i it ti t ll th li it ti f ff i it ti t h b ib f it i CPN offer or invitation to sell or the solicitation of an offer or invitation to purchase or subscribe for units in CPN
Commercial Growth Leasehold Property Fund (CPNCG and units in CPNCG, “Units”) in any jurisdiction nor should it or any part of it form the basis of, or be relied upon in any connection with, any contract or commitment whatsoever.
This presentation may include information which is forward-looking in nature Forward-looking information This presentation may include information which is forward looking in nature. Forward looking information involve known and unknown risks, uncertainties and other factors which may impact on the actual outcomes, including economic conditions in the markets in which CPNCG operates and general achievement of CPNCG business forecasts, which will cause the actual results, performance or achievements of CPNCG to differ, perhaps materially, from the results, performance or achievements expressed or implied in this presentation.expressed or implied in this presentation.
This presentation has been prepared by the CPNCG Property Manager. The information in this presentation has not been independently verified. No representation, warranty, express or implied, is made as to, and no reliance should be placed on, the fairness, accuracy, completeness or correctness of the information and opinions in this presentation. None of the CPNCG Property Manager or CPNCG Fund Manager or any
f i i f i i ffi i i iof its agents or advisers, or any of their respective affiliates, advisers or representatives, shall have any liability (in negligence or otherwise) for any loss howsoever arising from any use of this presentation or its contents or otherwise arising in connection with this presentation.
This presentation is made, furnished and distributed for information purposes only. No part of this presentation shall be relied upon directly or indirectly for any investment decision-making or for any other presentation shall be relied upon directly or indirectly for any investment decision-making or for any other purposes.
This presentation and all other information, materials or documents provided in connection therewith, shall not, either in whole or in part, be reproduced, redistributed or made available to any other person, save in strict compliance with all applicable laws.
2

Contents
Page
1. Operations 5
2. Financial Highlights 9
3. Q&A
3

1. Operations1. Operations

Leasable Area and Occupancy
Occupancy rate of CPNCG as of 31 March 2014 was 99.6%
Area (Sqm) Occupancy Rate
Gross Area Leaseable Area 31 Mar 13 30 Jun 13 30 Sep 13 31 Dec 13 31 Mar 14
The Offices @ CentralWorld 121,189 80,585 98.8% 98.0% 99.2% 98.9% 99.6%
CPNCG 121,189 80,585 98.8% 98.0% 99.2% 98.9% 99.6%
Source: CPN
5

Lease expiry profile
Well balanced lease expiry profile
37%2014
42%
13%
2016
2015
8%
0% 5% 10% 15% 20% 25% 30% 35% 40% 45%
2017
Note:
The Offices @ CentralWorld
Note:1. Percentage of total occupied area as at 31 March 20142. Exclude rental agreements < 1 year
Source: CPN
6

High Quality Tenants
Anchor Tenant % f T t l L bl A /1Anchor Tenant % of Total Leasable Area /1
Nestle (Thailand) 16%Central Pattana 10%AGODA 7%Central Trading 6%Ogilvy 6%Maybank KimEng 6%FINANSIA SYRUS 4%Surv Corp 3%MSD (Thailand) 3%Philip Morris (Thailand) Limited 3%Total Area of Anchor Tenants 61%
Note: /1 Based on leasable area as at 31 March 2014
7

2 Financial Highlights2. Financial Highlights
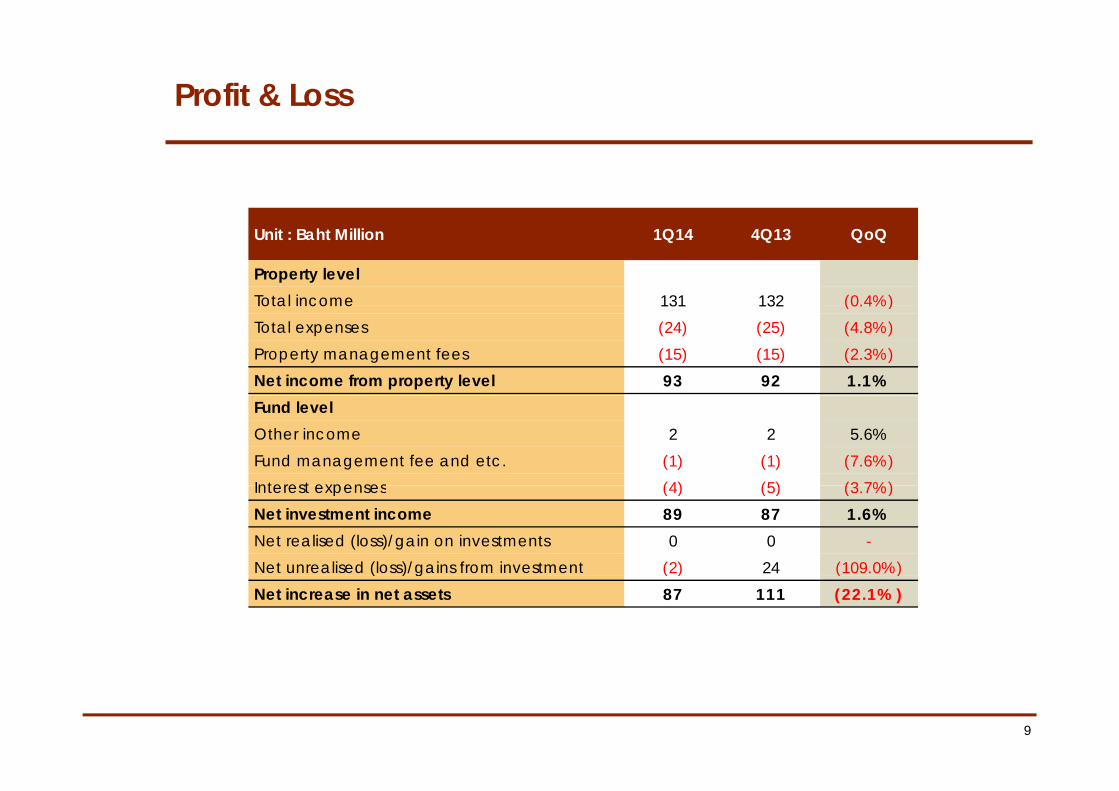
Profit & Loss
Unit : Baht Million 1Q14 4Q13 QoQ
Property levelTotal income 131 132 (0.4%)Total income 131 132 (0.4%)
Total expenses (24) (25) (4.8%)
Property management fees (15) (15) (2.3%)
Net income from property level 93 92 1.1%
Fund levelOther income 2 2 5.6%
Fund management fee and etc. (1) (1) (7.6%)
Interest expenses (4) (5) (3 7%)Interest expenses (4) (5) (3.7%)
Net investment income 89 87 1.6%
Net realised (loss)/gain on investments 0 0 -
Net unrealised (loss)/gains from investment (2) 24 (109.0%)( ) g ( ) ( )
Net increase in net assets 87 111 (22.1%)
9

Balance Sheet
Unit : Baht Million except indicated Mar-14 Dec-13 QoQ
Investments in properties at fair value 5,357 5,319 0.2%
Cash and near cash 62 114 1.0%
Other assets 6 6 15.2%
Total Assets 5,424 5,438 0.7%
A/P and accrued expenses 12 25 18.2%
Deposits received from customers 167 167 0.9%
Loan from SCB 366 370 0.0%
Other liabilities 0 1 (66.8%)
Total Liabilities 545 563 0.7%
C it l i d f ith ld 4 394 4 394 0 0%Capital received from unitholders 4,394 4,394 0.0%
Retained earnings 427 481 8.3%
Net Asset Values 4,822 4,875 0.7%
NAV per unit (Baht) 11 4365 11 4272 1 3%NAV per unit (Baht) 11.4365 11.4272 1.3%
10

Distribution Summary
1Q14 4Q13 QoQUnit : Baht Million except indicated
1Q14 4Q13 QoQ
Net investment income 89 87 1.6%
Actual distribution
via Dividend 84 83 1.0%
Baht per unit 0.1960 0.1941 1.0%
via Par Reduction - - -
ht itBaht per unit - - -
Total distribution 84 83 1.0%
Baht per unit 0.1960 0.1941 1.0%
% f N t i t t i 94 4% 95 0% (0 6%)
Note:
% of Net investment income 94.4% 95.0% (0.6%)
Annualised distribution yield /1 7.7% 7.6% 1.0%
Note:/1 Based on unit price of 10.20 Baht as at 19 May 2014 (For the current quarter and next 9 months)
11

Shareholder Structure
Listed on the SET 21 Sep 2012Units Outstanding 426.64M Units
Dividend Policy• 4 times a yearUnits Outstanding 426.64M Units
Registered Fund Size Baht 4,394.4M NAV (Mar 2014) Baht 11.4365
4 times a year• Pay out a minimum of 90% of distributable income
Unitholders Information(as at 8th May 2014)
THAI 95.66%
CPN 25.00%CPN, 25%
Individual, 46%Institution 25.16%
Individual 45.50%
FOREIGN 4 34%
Institution, 29%
46%
FOREIGN 4.34%
Institution 4.22%
Individual 0.12%
12
0 %

CPNCG Fund Information
Name CPN Commercial Growth Leasehold Property Fund (“CPNRF”)
Property Manager Central Pattana Public Company Limited (“CPN”)
Fund Manager SCB Asset Management Company Limited
Trustee Kasikorn Bank Public Company Limited
Registrar The Siam Commercial Bank Public Company Limited
A t Th Offi @C t l W ldAssets The Offices@Central World
Type Property Fund Type I (Indefinite Life)
Total Fund Size THB 4,394.4 MBTotal Fund Size THB 4,394.4 MB
Fund Registered Date 13 September 2012
Fund Investing Date 14 September 2012
Fund Listed Date 21 September 2012
Secondary Market The Stock Exchange of Thailand (“SET”)
13