centers for disease control and prevention (cdc) … for toxic substances and disease registry...
TRANSCRIPT

1
Centers for Disease Control and Prevention (CDC)
Agency for Toxic Substances and Disease Registry (ATSDR)
Summary Report: June 24-25, 2009
Amyotrophic Lateral Sclerosis and Multiple Sclerosis Surveillance Annual Meeting:
Issues Related to Developing a National Surveillance System and
Registries for Amyotrophic Lateral Sclerosis and Multiple Sclerosis This document has not been revised or edited to conform to agency standards. The findings and conclusions in this report are those of the meeting presenters and attendees and do not necessarily represent the views of the Agency for Toxic Substances and Disease Registry.

Amyotrophic Lateral Sclerosis and Multiple Sclerosis Surveillance Annual Meeting June 24-25, 2009 Summary Report
2
Table of Contents
Page
Purpose
3
Introductions, Welcome, and Overview of the Project and Goals
3
Briefings on ALS Surveillance and Registry Projects
6
Briefings on the MS Surveillance Projects
33
Combined Data Analysis Preliminary Findings
37
Reports: Discussion and Final Recommendations from Breakout Session
42
Recommendations and Next Steps
56
Participant Roster
61
Amyotrophic Lateral Sclerosis and Multiple Sclerosis Surveillance Annual Meeting June 24-25, 2009 Summary Report
3
Amyotrophic Lateral Sclerosis and Multiple Sclerosis Surveillance Annual Meeting:
Issues Related to Developing a National Surveillance System and
Registries for Amyotrophic Lateral Sclerosis and Multiple Sclerosis
The purpose of the Amyotrophic Lateral Sclerosis (ALS) and Multiple Sclerosis (MS) Surveillance Annual Meeting was to discuss results from the pilot surveillance projects as well as the combined data analysis; discuss strategies for developing the surveillance systems and registries within the various medical settings and available administrative records; and make recommendations on the next steps for developing national systems and registries. June 24, 2009
Welcome, Introductions, and Logistics Robert J. Kingon, MPA Consultant / Facilitator Former CDC Employee Mr. Kingon called the meeting to order, thanking those present for their attendance. Following a review of housekeeping issues, he led participants in a round of introductions. Opening Remarks G. David Williamson, PhD Director, Division of Health Studies Agency for Toxic Substances and Disease Registry Dr. Williamson welcomed those present to Atlanta, thanking them for their time and energy. He explained that the panel members were all very carefully chosen due to their expertise and knowledge in certain areas, which is very important to ATSDR and these projects. He congratulated the panelists on all that they had achieved, and said that he was throwing down the gauntlet to tell them there remained a great deal to achieve. He expected that they would be making very positive strides in the future, as they had done throughout the last couple of years. The last time he was able to speak to most of the group in a setting such as this was November 2007, when he distinctly remembered telling everyone that he truly believed that in three to five years they would look back to see that these workshops were setting the stage for something important. He stressed that he was even more committed to that currently, and that they had many reasons to be optimistic.
Purpose
Welcome, Introductions, and Overview of the Project and Goals

Amyotrophic Lateral Sclerosis and Multiple Sclerosis Surveillance Annual Meeting June 24-25, 2009 Summary Report
4
It has been a very interesting trip. He joined ATSDR in 2001 after a decade and a half at CDC. The lure of ATSDR to him was to work with communities—to work with people who have diseases who have been touched by chemical contamination, to gain their trust, and hopefully to make a difference. He was not at ATSDR for very long before they had the opportunity to make a difference. They were receiving many calls from communities asking them to help them as they struggled with clusters of ALS, MS, and other neurological and autoimmune diseases. ATSDR did not have a lot of answers, given that there was limited data on even prevalence and incidence of some of these diseases. ATSDR reached out to its partners in CDC such as the Chronic Disease Center, to determine what efforts they were undertaking in MS, ALS, and other diseases ATSDR was receiving calls about in terms of clusters in communities. They found that there was not an area within CDC that had a home for these diseases. Because people had contacted ATSDR and they believed there were chemical contamination ties to their diseases, the Division of Health Studies within ATSDR recognized this as a great opportunity to fill a void (e.g., data gap, scientific agenda gap, et cetera). With that in mind, ATSDR convened several workshops in 2002 on autoimmune and neurological diseases. Those workshops were very enlightening and reinforced what ATSDR already knew—there was little data available to help them determine the causes of these diseases from an epidemiological standpoint. The primary recommendation resulting from those workshops was that ALS and MS were two diseases that would serve as a good starting point. From an epidemiological standpoint, ATSDR was thinking about what would help them in the long-term to address treatments and cures, and in the medium terms examining the epidemiologic factors that may cause these diseases. In order to garner data, ATSDR decided that projects should be conducted that would allow them to determine good estimates of incidence and prevalence for ALS and MS. They identified funds within CDC that would permit ATSDR to implement incidence and prevalence estimate studies in several states for ALS and MS. In 2006, a larger conference was convened to help ATSDR think about the future. The earlier projects resulted in determining some incidence and prevalence estimates, but they wanted to do more. About the same time, ATSDR was engaged in interesting discussions with the ALS Association (ALSA) which pointed out that ATSDR was well-positioned and was thinking along the same lines as ALSA in order to push the agenda for ALS. ALSA expressed their hope of partnering with ATSDR in order to move the ALS agenda forward together. ALSA was able to get information about ALS into some Congressional language, and was able to garner some funding for ATSDR such that ATSDR could embark on a more ambitious agenda. He thanked Steve Gibson, Vice President of Government Relations and Public Affairs for ALSA, on behalf of everyone who has ALS and to ALSA for being in the forefront in helping ATSDR and the research community push forward in the effort to address ALS. Over the last few years, ATSDR has been able to continue with ALS and MS work on separate tracks. With the funding ALSA and Congress have afforded ATSDR, the agency has embarked on a very ambitious set of projects which he hoped they would all enjoy hearing about during this meeting. He indicated that ATSDR was seeking guidance and input on next steps toward a national registry of ALS patients that will allow them, in real time, to tie into the research community. In order to find treatments and cures for ALS patients, they must tie these patients into research in real time. A national ALS registry will allow them to do that. With that in mind, he requested that participants be thinking about the next steps toward implementing an ALS registry as they heard updates.

Amyotrophic Lateral Sclerosis and Multiple Sclerosis Surveillance Annual Meeting June 24-25, 2009 Summary Report
5
While ATSDR has been able to identify larger sources of funding for research efforts in ALS, they have not yet been able to identify additional sources of funding for MS research efforts. However, ATSDR is currently engaged in discussions with the National MS Society and others to determine ways that CDC / ATSDR can contribute to the MS research agenda by conducting research and / or facilitating it. He thanked Kim Cantor of the National MS Society for all that she and the society had done to support ATSDR’s work in MS. Overview of the Project and Goals Oleg Muravov, MD, PhD Medical Epidemiologist Division of Health Studies Agency for Toxic Substances and Disease Registry With respect to background, there was a lack of reliable incidence and prevalence estimates by geographic area. National estimates rely heavily on non-specific mortality data. For instance, clinical medicine in the United States (US) uses ICD-9 which has specific codes for ALS (335.20) and other motor neuron diseases (335.21-335.29). For mortality ICD-10 is used, which has a non-specific code for all motor neuron diseases, G12.2. Access to medical records is difficult, exceptionally time-consuming, costly, and not always granted. The ATSDR 2006 workshop was probably the most significant, the purpose of which was to evaluate the feasibility of a national surveillance system for selected neurological and autoimmune diseases; identify existing registries and databases; select diseases to begin pilot projects; and develop and test methodology. The goal of the project is to assess the feasibility of developing national registries for ALS and MS by accessing existing datasets and analyzing those data to help create databases of persons with ALS and MS. The methods are to identify and obtain data from national databases; and identify the types of health care delivery systems to participate in pilot projects. The Veterans Administration covers disability for those who develop diseases related to their service. ALS was considered to be service-related if it developed within one year of separation from active duty service. As of November 2008, ALS is considered service connected regardless of when an individual served, theater of service, or how long after discharge ALS was diagnosed. It is important to note that the four databases selected cover approximately 66,000,000 individuals. The ALS pilots include the Mayo Clinic, Emory University, South Carolina Budget and Control Board, and a group of 9 sites under the umbrella of an HMO Research Network—some of which are Kaiser sites and some of which are not. There are two MS sites: New York State MS Consortium Registry and North American Research Consortium on MS Registry. Pilot projects were also to identify individuals in their databases who have been seen by a health care provider for any MND or MS; review pilot project medical records to determine correct diagnosis; determine which ICD-9 and procedure codes are most reliable for identifying ALS and MS cases; develop algorithms to identify true cases of ALS and MS; apply algorithms to national databases to identify ALS and MS patients; and develop a web portal for self-registration in the ALS Registry. It is important to note that all cases of ALS or MS cannot be identified by the national databases because of database eligibility requirements. Regarding the ALS web portal, a secure CDC server will host the National ALS Registry; allows self-enrolment for completeness; includes real-time information; has short surveys on genetic factors, environmental, and other exposures; includes educational information on ALS; and links to other resources helpful to ALS patients, family members, caregivers, and researchers.

Amyotrophic Lateral Sclerosis and Multiple Sclerosis Surveillance Annual Meeting June 24-25, 2009 Summary Report
6
The ALS Registry Act was enacted as Public Law 110-373 on October 8, 2008. The act’s major purposes are to better describe incidence and prevalence; better describe the demographics of ALS patients; and examine risk factors for the disease. Five million dollars in funding was included in CDC’s FY09 budget which was used for additional funding of ALS pilot projects, a web portal, state ALS surveillance, and salaries of ATSDR employees and contractors. Comments / Questions • An inquiry was posed regarding whether behavior was considered as another question that
could be added in terms of extreme exercise, for example.
• Dr. Muravov responded that this could be a part of the package of surveys in the web portal. ALS patients will have access to more information about ALS via the web portal.
• Dr. Benatar suggested that there was perhaps some sort of conflict in the desire to have
information in real-time. Many of the pilot projects are focusing on the utility of existing national data sources to identify cases. By no means will those be real-time. If they are relying on self-report for real-time data, there is no sense regarding how many of the total cases of ALS will actually be captured by self-report.
• Dr. Muravov responded that they could discuss this further later in the meeting. South Carolina ALS Project Julie Royer, MSPH, Principal Investigator South Carolina Budget and Control Board Office of Research Statistics David E. Stickler, MD Department of Neurosciences Medical University of South Carolina Ms. Royer reported that the data sources utilized in the South Carolina pilot project include a mix of all-payer and claims-based healthcare data systems, as well as health department death certificate data, support service data from the ALS Association local chapters, and clinic data:
Briefings on the ALS Surveillance and Registry Projects

Amyotrophic Lateral Sclerosis and Multiple Sclerosis Surveillance Annual Meeting June 24-25, 2009 Summary Report
7
Vital Records
Outpatient Surgeries
State Employee Health Services
Emergency Room Visits
Home Health Care
Medicaid ServicesState Level
SC/NC ALS Association Chapter
Hospitalizations
Outpatient Radiology
Emory Administrative
GA ALS AssociationChapter
Support Services
Claims Systems
All Payer Health Care Databases
CDC/ATSDR
Health Department
Out-of-State ALS Clinic
LEGEND
Emory ALS Clinic
Veterans Benefit Administration
Veterans Administration
Medicare
MedicaidFederal Level
SC ALS Surveillance System
There were 2,090 total cases identified by one of the motor neuron disease ICD-9-CM codes during the 5-year study period (2001-2005). She divided the cohort into two main groups: cases that were coded as having ALS (335.20) at least once during the study period, and cases that were identified by one of the other motor neuron disease (MND) codes (335.2, 335.21, 335.22, 335.23, 335.24, 335.29, or G12.2 if case found by death record) and were never coded as ALS. There were 882 cases with a specific ALS code and 1208 with one of the other MND codes. Age at the time of the first coded encounter and race were similar among the two groups. There was a higher proportion of males in the ALS group compared to the other MND group. The following table reflects the number of encounters and cases identified in each of the South Carolina pilot data sources:
SC ALS/MND COHORT RESULTS 2001-2005
Data SourceVisits
w/ MND Code
Visits w/ ALS
Code (%)
Cases w/ MND Code
Casesw/ ALS
Code (%)Medicare 6196 4298 (69) 1426 649 (46)
Federal Medicaid 1421 1231 (87) 142 76 (54)Veterans Health 876 605 (69) 138 71 (51)Veterans Benefit ---- ---- 44 19 (43)
Inpatient (UB) 791 567 (72) 465 309 (66)Emergency Dept (UB) 238 200 (84) 160 133 (83)Outpatient Surgery &
Imaging (UB) 152 98 (64) 133 81 (61)
Home Health (UB) 13295 10267 (77) 295 228 (77)State Medicaid 1780 1470 (83) 206 107 (52)
State Health Plan 3169 1999 (63) 266 103 (39)Death Records ---- ---- 465 ----
ALS Association ---- ---- 40 39 (98)Emory Clinic ---- ---- 12 12 (100)
There were almost two in-patient admissions for every ALS coded case during the study period, an average of 45 home health visits per case, and the number of encounters in the claims-based system ranged from an average of 7 to 19 encounters per ALS case. The following table shows the annual prevalence ratios for ALS and all MND codes from all of the South Carolina Data sources. Occurrences of the diagnosis code for ALS and MND were unduplicated by study year and patient identifier.

Amyotrophic Lateral Sclerosis and Multiple Sclerosis Surveillance Annual Meeting June 24-25, 2009 Summary Report
8
The following table reflects the number of data sources that identified a case. It was interesting that the cases identified by one of the non-specific ALS codes were more often identified from only a single data source:
Number of Data Sources
Identified a Case
ALS Code 882 Cases
n (%)
Other MND – No ALS 1208 Cases
n (%)
1 303 (34.4) 942 (78.0)
2 190 (21.5) 207 (17.1)
3 146 (16.6) 48 (4.0)
4 128 (14.5) 10 (0.8)
5 65 (7.4) ----
6 36 (4.1) 1 (0.1)
7 12 (1.4) ----
8 2 (0.2) ----
It is very unlikely that future registry investigators will have access to all 14 data systems that Ms. Royer had available to her. The following table reflects the percentage of cases that would have been identified by a lesser combination of data sources. The national data sources plus the uniform billing inpatient and emergency department discharge data would have identified 93% of the total ALS cases:
Year Cases w/ specific
ALS Code
Cases w/ any MND
Code
SC Population (18 or older)
ALS Code Prevalence
Rate Ratio per 100,000
MND Code Prevalence Rate Ratio per 100,000
2001 285 610 3,046,170 9.4 20.0
2002 273 616 3,084,193 8.9 20.0
2003 285 697 3,125,625 9.1 22.3
2004 302 604 3,172,939 9.5 19.0
2005 292 451* 3,227,881 9.0 14.0

Amyotrophic Lateral Sclerosis and Multiple Sclerosis Surveillance Annual Meeting June 24-25, 2009 Summary Report
9
Data Source Combinations
Case Identification
ALS Code 882 Cases
n (%)
Other MND - No ALS Code 1208 Cases
n (%)
Medicare, Federal Medicaid, VHA/VBA 736 (83) 890 (74)
Medicare, Federal Medicaid, VHA/VBA, ALS Association
754 (85) 890 (74)
Medicare, Federal Medicaid, VHA/VBA, UB 823 (93) 972 (80)
UB, State Medicaid, SHP 553 (63) 459 (38)
UB Inpatient and Emergency Dept 369 (42) 174 (14)
Medicare, State Medicaid, SHP 733 (83) 946 (78)
Death Records Only1
---- 465 8)
South Carolina investigators were able to review inpatient and emergency department records for case confirmation and records provided by the Emory ALS Clinic, but the vast majority of records reviewed were hospital medical records. Very few medical records contained enough clinical data to classify cases according to the El Escorial criteria, so a secondary system was developed by Dr. Stickler in an attempt to confirm the cases. A case met the secondary criteria if there was evidence in the medical record that the subject was diagnosed by a neurologist or seen at a ALS clinic; and the subject was prescribed Riluzole, received hospice care for the diagnosis of ALS and this was documented in the medical record, or the discharge death summary, autopsy, or copy of the actual death certificate in the medical record contained the diagnosis of ALS. For this project, investigators also noted whether the patient had a recorded diagnosis of ALS in review of the record. For example, if a record stated that a patient with end-stage ALS had no tone or movement in the extremities, communicated by nodding of the head, and was admitted for dehydration, that record would count as a recorded diagnosis of ALS, but could not be classified using the revised El Escorial criteria or the secondary criteria. There were 588 cases in which a medical record was available for review. ALS was the recorded diagnosis in the review of records in 367 (62%) cases. Of these, 63 (11%) cases met revised El Escorial criteria (6% Definite, 32% Possible, 54% Probable, 8% Probable Lab), and 167 (28%) cases met secondary criteria (neurologist, Riluzole, hospice admission, physician death note). Of the 61 cases where other MND codes were present and records were available, 40 % recorded a diagnosis for ALS in the review of the record, 5% met El Escorial criteria, and 12% met secondary criteria. For cases with no 335.20 code, there were 581 cases with medical records available for review. Of these, 28 (5%) had a recorded diagnosis of ALS, 5 cases met revised El Escorial criteria (3 Possible and 2 Probable), and only 10 cases met secondary criteria. PBP, PP, and PMA were recorded in the medical record as conditions secondary to stroke, Parkinson’s, or muscular dystrophy. PLS was the recorded diagnosis in the review of the records in 31 (38%) out of 81 cases coded as 335.24, and ALS was the recorded diagnosis in 28 (35%) cases.

Amyotrophic Lateral Sclerosis and Multiple Sclerosis Surveillance Annual Meeting June 24-25, 2009 Summary Report
10
Ms. Royer examined several potential algorithms to identify true cases of ALS in administrative data sources, with the findings reflected in the following table:
Algorithm
Total Cases
Number of Cases Reviewed
Number w/ Recorded Diagnosis
Number Met
Criteria
335.20 882 588 367 62% 230 39%
335.20 only 765 527 349 66% 222 42%
335.20 in > 1 source 243 191 129 68% 73 38%
335.20 + G12.2 92 63 55 87% 31 58%
335.20 in > 1 source + G12.2 156 143 140 98% 108 76%
> 1 encounter w/ 335.20 579 410 315 77% 204 50%
335.20 + neurology provider 457 322 232 72% 162 50%
> 1 encounter w/ 335.20
+ neurology provider 391 278 219 79% 150 54%
335.20 + Riluzole prescription 82 54 48 89% 36 67%
Greater than 1 encounter with the 335.20, a prescription for Rilutek®, and the 335.20 in greater than 1 source + G12.2 all yielded high positive predictive values (PPV) with a range from 77% to 98%. In six cases where there was a prescription for Rilutek® and ALS was not recorded as the diagnosis in the review of the record, there were two cases in which ALS was noted in the record and four cases in which progressive muscular condition or weakness was noted. In those instances, the record the investigators were able to review was prior to the coded prescription dates and the first occurrence of the 335.20 code. Once again, they were only able to review primarily inpatient and emergency department medical records. Sometimes the record reviewed was prior to the first code. The following table represents the 335.20 code by individual data sources, with the number who met the criteria including both the El Escorial and secondary classification systems:

Amyotrophic Lateral Sclerosis and Multiple Sclerosis Surveillance Annual Meeting June 24-25, 2009 Summary Report
11
Data Source – 335.20 only Total Cases
Number of Cases
Reviewed
Number w/ Recorded Diagnosis
Number Met
Criteria
UB Inpatient 289 273 253 93% 179 66%
UB Emergency Department – No Inpatient 54 51 46 90% 15 29%
UB – Inpatient, ED, Outpatient, Home Health 405 368 325 88% 211 57%
Medicare 451 322 202 63% 125 39%
Medicaid 88 75 57 76% 36 48%
VHA 57 28 17 61% 12 43%
VBA 19 7 6 86% 4 57%
ALSA 39 16 11 69% 7 44%
Uniform billing data had the highest positive predictive value. The investigators were able to confirm the 335.20 code for more cases in the uniform billing data than any other data source; however, Ms. Royer stressed that these happened to be the predominance of records that they were able to review, which probably explained why the numbers were so high for those two systems. There were 465 death records in which an underlying or co-morbid cause of death was coded as MND (G12.2). In 116 cases, the death record was only data source which identified a case. For 62 cases, medical records were available for review. The investigators examined the inpatient or emergency department records for these within 6 months prior to death. Of these, there were 3 cases in which a diagnosis of ALS was noted in the record and no cases met El Escorial or secondary criteria. In 50 cases (81%), progressive supranuclear palsy or Parkinson’s disease was recorded in the medical record. The investigators examined death records from 2001 to 2006, in which there was a higher percentage of cases linked to the death file for cases with a specific ALS code (n=482; 55%) compared to cases identified by one of the other MND codes (n=281; 26%). Of the cases that were linked to the death record where G12.2 was listed a UCD or CCD, there was a higher percentage of cases with a specific ALS code (n=314; 36%) compared to cases identified by one of the other MND codes (n=36; 3%). Dr. Stickler pointed out that once the data were collected, the South Carolina investigators realized the potential of the data source for analysis. They examined the uniform billing and emergency department data with a goal of assessing positive predictive value and the factors that influence hospitalization. Unique about the dataset is that they could follow the patients over time because of the unique identifier system. They ended up with approximately 369 unduplicated patients with the ALS codes. Looking at predictive value is entirely dependent upon how a case is defined. If looking just at the ICD-9 codes, the positive predictive value is pretty high. With the clinical criteria (e.g., El Escorial and secondary criteria) the predictive value is very low. This illustrates that the uniform billing dataset is very good for identifying

Amyotrophic Lateral Sclerosis and Multiple Sclerosis Surveillance Annual Meeting June 24-25, 2009 Summary Report
12
patients, but not very good for case confirmation. That is related to the content of the hospital records examined. They did not find a lot of good neurologic data in the hospital record data. Once the predictive values were assessed, the investigators were interested in factors that influenced hospitalization:
PERCENTAGE OF INPATIENT ADMISSIONS & EMERGENCYDEPARTMENT VISITS WITH RESPIRATORY, NUTRITION ANDTRAUMA COMPLICATIONS BY TIME
Time 1 = two years prior to first code, Time 2 = including and up to two years after first code, and Time 3 = greater than two years after first code. Respiratory, nutrition and trauma complications were defined by project neurologist based on ICD-9-CM primary diagnosis codes.
As expected, there were increasing inpatient hospitalizations for respiratory problems, nutrition, and trauma. There was a similar trend with respect to emergency department visits, with increasing admission to the emergency department for respiratory and nutrition complications with disease progression and decline in a number of trauma-related conditions, probably secondary to immobility in the later stages of the disease.
Increasing age in years (OR = 1.04, 95% CI = 1.02 - 1.06) and respiratory complications (OR = 1.92, 95% CI = 1.24 - 2.99) were associated with hospice care or in-hospital death. An inpatient encounter with a trauma related code was predictive of discharge to skilled nursing facility or other long-term care facility (OR = 4.16, 95% CI = 1.15 - 15.04); whereas, nutritional complications precluded discharge (OR = 0.44, 95% CI = 0.22 - 0.95). The mean number of ED visits was 1.8 per patient (SD 2.6) with a higher number of visits in non-Caucasian patients (2.4 versus 1.6, p = 0.05).
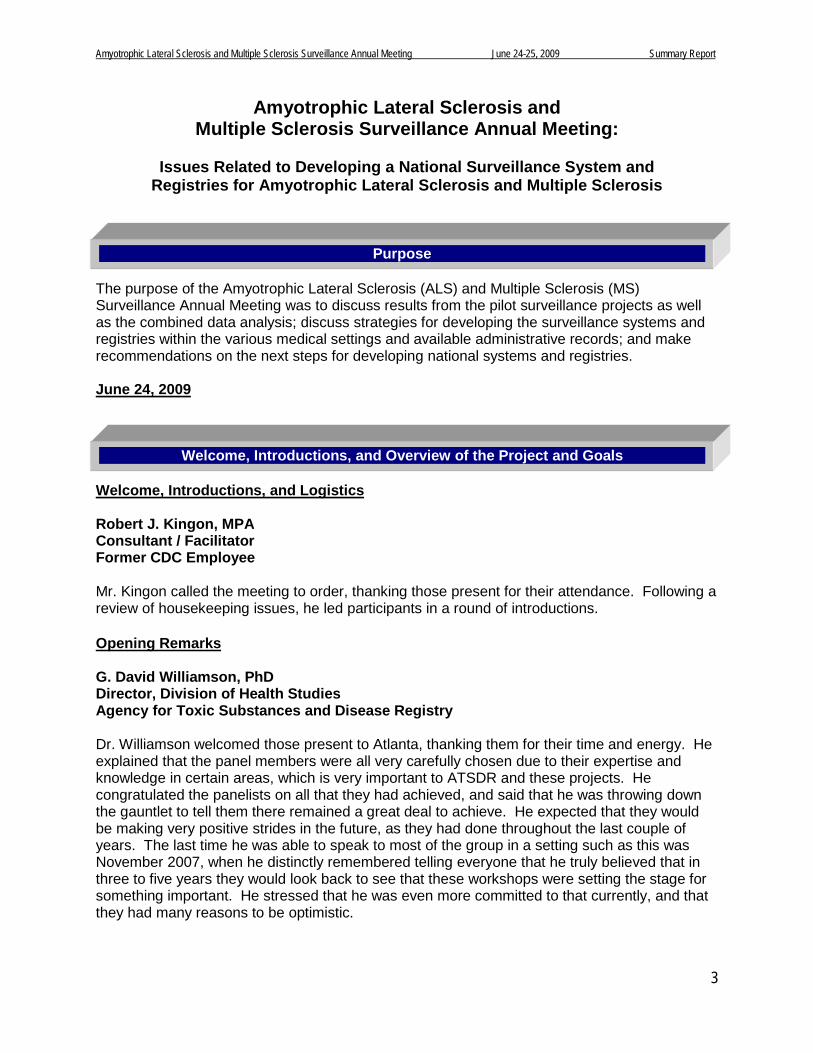
In terms of patient disposition, early on patients returned home for self-care. However, in the later stages of the disease, fewer patients went home with self-care and more went to home health or hospice admission. This was similar for emergency department visits, in which the majority returned home initially for self-care and in later stages experienced a higher frequency of hospital admissions:
Amyotrophic Lateral Sclerosis and Multiple Sclerosis Surveillance Annual Meeting June 24-25, 2009 Summary Report
13
PERCENTAGE OF EMERGENCY DEPARTMENT ANDINPATIENT DISPOSITION STATUS BY TIME PERIOD
Time 1 = two years prior to first code, Time 2 = including and up to two years after first code, and Time 3 = greater than two years after first code.
The diagnostic code for ALS / MND was absent in 293 emergency and 125 inpatient encounters after the presence of the ALS / MND code in an earlier record. Medium and larger size hospitals accounted for a larger number of un-coded emergency department visits and smaller size hospitals for inpatient encounters. In summary, 2,090 unique cases were identified with an MND code from 14 different data sources over the study period (2001-2005), and 882 cases had a specific ALS code (at least one encounter with 335.20 code). Medicare, Medicaid, Veterans Health / Benefit Administration and South Carolina Uniform Billing data identified 93% of the ALS cases. National databases identified 83% of the ALS cases. A total of 1,169 medical records were reviewed. ALS was recorded in reviews of the records 62% of the time when the code 335.20 identified a potential case versus 5% for the other MND codes. PBP, PP, and PMA were recorded in medical records as conditions secondary to stroke, Parkinson’s, and muscular dystrophy. Limited clinical data were available for review, and only 11% of the cases reviewed met the revised El Escorial criteria. Greater than 1 encounter with 335.20 code, Riluzole prescription, and 335.20 + G12.2 codes yielded the highest positive predictive values (range 77 - 98%). A confirmed 335.20 code for more cases was identified in uniform billing data than any other data source (access to inpatient and emergency department data and 28 Emory records). The investigators were unable to obtain clinic records from Charlotte or MCG. There is a possibility of ALS rule out diagnosis mistakenly coded in physician offices and other non-hospital sources. Comments / Questions • Dr. LaRocca requested further information about the uniform billing data.
• Dr. Stickler responded that this is hospital utilization records from the 63 hospitals in the
state that are required by state law to transmit data for analysis.
• Dr. Brooks inquired as to whether the number of cases found exceeded or was below what was expected on the basis of mortality data for the covered population.
• Dr. Stickler responded depending upon how they looked at it, it was an underestimation.
Based on the use of a single source (uniform billing data), it would be an underestimation

Amyotrophic Lateral Sclerosis and Multiple Sclerosis Surveillance Annual Meeting June 24-25, 2009 Summary Report
14
[There are only a couple of studies of prevalence ratios in the 1990s, which were mostly Canadian. It goes up per decade.
• Dr. Brooks requested clarification on the number of false positives (e.g., people who had the
code but did not have the disease). He also inquired as to how this compared to some of the other studies, such as those in Taiwan.
• Dr. Sticker replied that the number of false positives was fairly low with the 5-digit code. The
false positive rate related more to inadequate data than a true false positively. They found less than 2% to 3% that were true miscodes. In terms of how this compared to other studies, the only ones the South Carolina investigators examined were 4-digit code studies. It is hard to compare the 5-digit code studies, because using the 5-digit code eliminates a lot of the other MNDs. Therefore, they do not have any direct comparisons.
Georgia ALS Project Michael Benatar, MD Principal Investigator Emory Department of Neurology There are three salient registry characteristics: 1) it needs to be population-based; 2) it needs to contain as complete as possible an enumeration of all cases of ALS; and 3) it needs to contain as few as possible subjects with alternate diagnoses (e.g., false positives). The current feasibility project in Georgia has addressed only item #3. At some level, it is broadly population-based, but not entirely. Georgia has no ability with this data to address item #2. The goals of the Georgia ALS project are to determine the utility of existing databases for correctly identifying patients with ALS for inclusion in an ALS registry; ascertain the positive predictive value (PPV) of a listing of ALS in existing databases; and identify factors / algorithms that improve PPV. The strategy taken was to identify existing sources of data; and identify potential ALS cases based on ICD codes, self-report, or clinical diagnoses of ALS for the years 2001-2005. No attempt was made to identify cases not captured as ALS in existing data sources, so importantly, the Georgia project is missing those people who were not identified on the basis of these characteristics.
Data sources include: Emory (healthcare administration, ALS clinic, EMG lab), Medicare, Medicaid, VA (administrative, benefits), ALSA (self-reported), MDA (Emory, tried to get Medical College of Georgia unsuccessfully, Roosevelt Warm Springs), community neurologists, and death certificates (ICD-10-based). The Georgia investigators were unsuccessful in acquiring data from the Medical College of Georgia and the Mayo Clinic in Jacksonville, Florida where they thought some Georgia patients with ALS might seek care. Subjects across these multiple data sources were matched, and the relevant data elements requested by CDC were extracted. A single entry was created for each unique subject, including: data sources in which the subject was identified, years in which the subject was identified in each data source, number of encounters within each data source, ICD-9 codes associated with each subject, and provider type. In order to verify the diagnosis of ALS, data were abstracted using a standardized template that was jointly developed by the pilot project scientists in collaboration with ATSDR. A random sample of charts was then selected from Emory, although the Georgia investigators are now

Amyotrophic Lateral Sclerosis and Multiple Sclerosis Surveillance Annual Meeting June 24-25, 2009 Summary Report
15
moving to abstract data from all of the charts at Emory during the relevant time period. A random sample of charts was also abstracted from Emory that overlapped with other data sources, given that they did not have direct access to the records of people exclusively identified in those other sources. They also obtained all of the charts from community neurologists. The gold standard was primarily based on review of abstracted chart data by a neuromuscular neurologist. The diagnosis of ALS was based strictly on available abstracted data that could be pulled out of the chart. The El Escorial research criteria were applied, and the investigators secondarily used a chart diagnosis. If there was insufficient information for the neurologist to confirm a diagnosis, a secondary look was taken to determine whether a diagnosis of ALS was actually mentioned in the chart. That was only used when Dr. Benatar was unable to determine whether a case was, indeed, ALS. The Georgia project identified only true cases of ALS and excluded other motor neuron diseases. Georgia began with 2449 subjects, excluding 1017 without ALS, leaving a total of 1432 subjects. Subject distribution by source is as follows, which offers a sense of the importance of examining multiple datasets:
Subject Distribution by Source# Subjects in Source
Non-exclusive Exclusive
Emory 558 147
Medicare 1011 454
Medicaid 147 48
VA 88 29
ALSA 98 14
Mortality 451 0
Community 102 24
VAB 32 10
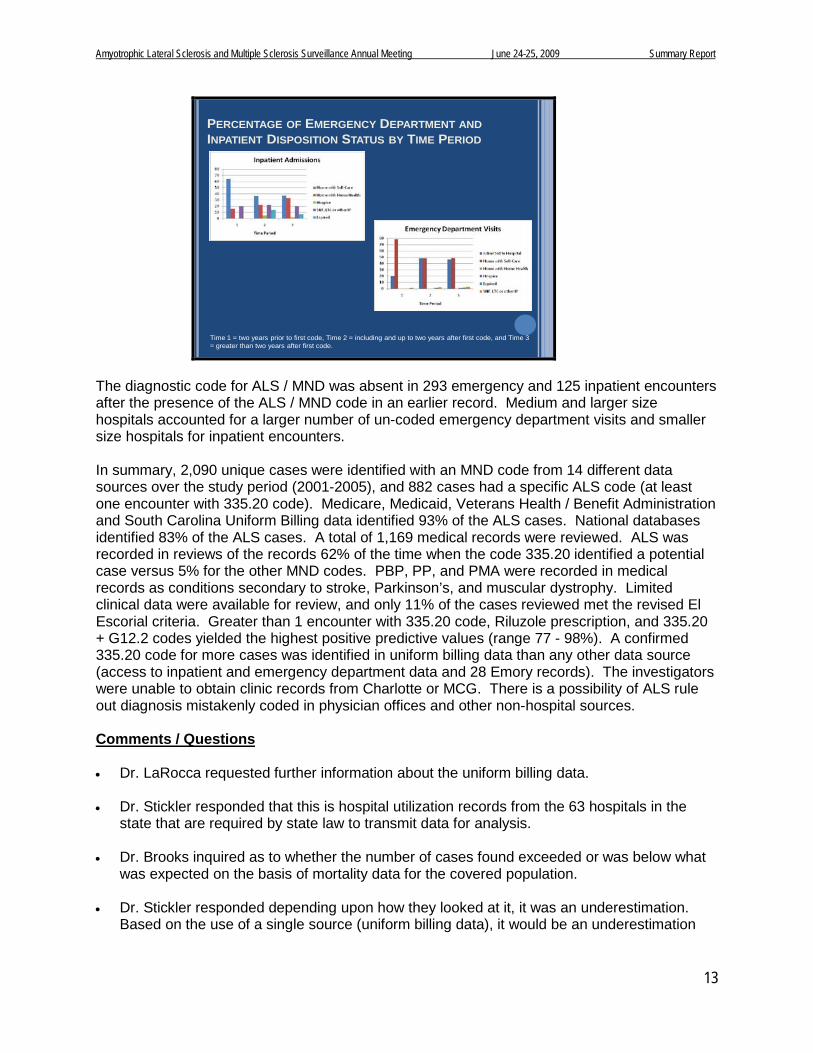
Clearly, Medicare has a lot of cases and a lot of exclusive cases as well. Interestingly, there were no exclusive cases in mortality in the death certificates—these were all captured elsewhere. Of the 1432 subjects, 38 were only found in some combination of three sources (e.g., mortality, community neurologists, and / or VAB). Of the remaining 1394 subjects, 463 charts had been abstracted at the time of this meeting). Of the 450 cases in the Emory database, 150 were unique. Of the 294 in Medicare, only 8 were unique. Of the 38 in Medicaid, none were unique. Of the 24 in VA, 1 was unique. Of the 62 cases in ALSA, only 2 were unique. With respect to positive predictive value assessing a single data source, of Emory’s 450 subjects, 377 had ALS and 73 did not (PPV 84%; 80-87%). These are fairly narrow confidence intervals given the fairly large sample size. Of the 294 Medicare subjects, 258 had ALS and 36 did not (PPV 88%; 83-91%). Of the 38 Medicaid subjects, 35 had ALS and 3 did not (PPV 92%; 79-98%). Of the 24 VA subjects, 23 had ALS and 1 did not (PPV 96% 79-99%). Of the 62 ALSA subjects, 60 had ALS and 2 did not (PPV 97%; 89-99%). In Medicaid, VA, and ALSA the smaller number of subjects results in somewhat broader confidence intervals. Although these look like a very attractive source and they probably are, the sample sizes are relatively small. The impact within the context of multiple data sources is reflected in the following table:
Amyotrophic Lateral Sclerosis and Multiple Sclerosis Surveillance Annual Meeting June 24-25, 2009 Summary Report
16
Emory Medi-care
Medi-caid VA ALSA Total N PPV
x x 209 86%
x x x 43 95%
x x x 21 95%
x x 12 83%
x x x 10 100%
X X 10 100%
x x 8 100%
Positive Predictive ValueMultiple Data Sources
As the sample size falls, the PPV tends to increase. Dr. Benatar suspects that this is more a function of falling sample size versus truly better PPV. The investigators then attempted to apply some predictive rules, which were as follows:
1. Appearance in specific data sources (e.g., was ALSA better than other data sources) 2. Number of data sources in which a subject appeared (e.g., ≥ at least 3 data sources) 3. Appearance in multiple years within the same database 4. Multiple encounters within the same database (regardless of year) 5. Whether a diagnosis made by neurologist 6. Riluzole use, although there was little Riluzole data outside of what could be acquired
from extracting data from VA and Medicaid With respect to the preliminary results, there was a tradeoff between applying more rules and how many cases could be captured, classified, and included with those rules and the PPV. For the population appearing anywhere in any dataset, the crude PPV is 83%. This includes 100% of the population. For ALSA, only 62 cases (13% of the total cases) were captured, the PPV is 97%. There is a spectrum in between: Emory alone is 84%. If several of the predictive rules are applied, 93% can be reached classifying 80% percent of the subjects. If a subject is required to be in at least 3 data sources and / or in ALSA, 97% can be reached. However, then only 94 subjects are being classified. Thus, it appears that using several of the rules together, the investigators can get at most of the population with a reasonably good PPV. However, there is unquestionably a tradeoff. Potential sources of bias in the Georgia project are that “missing” ALS cases were not included; the vast majority of abstracted charts are from patients seen at a tertiary referral center (e.g., Emory); and a limited number of charts were abstracted from non-Emory or non-Medicare sources, which translates to less ability to be confident of the PPV. In summary, multiple data sources are required to increase capture of cases. The overall PPV based on appearance in any data source is approximately 83%. PPV improves to over 90% based on the predictive principles delineated. There is a trade-off between improving PPV and the number of cases captured. With respect to interpretation of preliminary analysis results, Dr. Benatar cautioned everyone to remember that there remained over 100 charts to abstract and additional analyses to be performed. While what he presented offered a good sense of where the Georgia project was headed, he stressed that it was not the final word on the subject.

Amyotrophic Lateral Sclerosis and Multiple Sclerosis Surveillance Annual Meeting June 24-25, 2009 Summary Report
17
He concluded by raising the following points for discussion: How high would PPV need to be in order to obviate the need for chart verification in all
cases?
Chart abstraction should be used only for potential cases of ALS that are not verified using predictive algorithms. If 90% of the cases can be captured with 93% PPV, perhaps charts would only have to be abstracted on the 20% who could not be classified. That would greatly ease the burden of verifying cases.
Chart verification depends on diagnostic quality (e.g., referral center versus non-referral center), which may impact estimates of PPV.
Comments / Questions • Dr. Van Den Eeden requested further information about the 1000 subjects excluded and
how that affected the PPV.
• Dr. Benatar responded that they had not analyzed that at this point. They expect to have this information by September 2009.
• Dr. Stickler inquired as to what percentage of patients were picked up by EMG codes. In
response to something called out in the room off of the microphone, he noted that if there is a question of a diagnosis of ALS, one of the first things that is done is an EMG. He wondered why the discordance.
• Dr. Benatar replied that while he did not know what that was in the Georgia data, he thought
that very often someone might be being evaluated for ALS, sent to the EMG laboratory for ALS, the study is normal, but the diagnostic code is loosely used by the physician as ALS. It was not clear that having the EMG would get them to the answer.
• Dr. Kasarskis commented based on the VA registry experience. Very often there is a
medical records department, while the EMG laboratory might be a standalone component in a different office with a different number. The worksheets may be physically in another location and never find their way into the medical record.
• Dr. Benatar added that this was not a problem for the Georgia project, and they will
eventually be able to answer this question from these data because they did got to the EMG laboratory to pull all of the EMG’s that were available and used those in the chart abstraction process.
• Dr. Stickler commented that there were only one or two EMG reports available in the review
of hospital records and that this important information was not available using this data source.
• Dr. Benatar responded that as opposed to going to the chart diagnosis, the overwhelming
majority would be a ballpark guess of over 95%.
• Dr. Burmester inquired as to whether Georgia did or did not have some cases that were identified only by mortality data.

Amyotrophic Lateral Sclerosis and Multiple Sclerosis Surveillance Annual Meeting June 24-25, 2009 Summary Report
18
• Dr. Benatar responded that they did not. There were 4 in mortality data and one of the
community neurologist’s offices. The 38 were if they were in either mortality, or community neurologist, or exclusively the benefits dataset or some combination of those.
• Mr. Gibson inquired as to what reasons were given for Medical College of Georgia and
Mayo Clinic in Jacksonville not wanting to participate, and whether there were any lessons learned that Dr. Benatar could share.
• Dr. Benatar responded that it was not a question of not wanting to participate. The Mayo
Clinic in Jacksonville went to a lot of trouble to acquire data for the Georgia project. Ultimately it turned out to be a Mayo Foundation policy that they would not share protected health information outside of the foundation. They were willing to share non-identifiable data, but that would not have been beneficial in terms of identifying overlapping cases. The Medical College of Georgia was a long drawn out saga that was not for lack of trying or lack of desire. It was simply multiple bureaucratic / institutional obstacles.
Minnesota ALS Project Eric J. Sorenson, MD, Principal Investigator Mayo Clinic: Rochester, Minnesota Dr. Sorenson reported that Minnesota began with 1497 cases that were sent to the Mayo Clinic from the databases. Of those, roughly 600 were available in the Mayo Clinic record system and another 100 or so records were available from the Minnesota chapter of ALSA. Thus, the Mayo Clinic had access to medical records for approximately 50% of the cases that were provided to them. He began with a much smaller number of cases. He suggested that one of the assets the Mayo Clinic was able to bring to the project was the strength of the Rochester Epidemiology Project in the sense that they have complete ascertainment of essentially all of the cases of ALS within Mayo’s immediate region. Thus, Mayo has the ability to illustrate exactly who is being excluded in the datasets and who is being missed. In the Rochester Epidemiology Project, there were 12 incident cases over the 5-year time period in which data were being abstracted. In the VA database they have, only 1 of the 12 was identified, or as a point estimate that is about 8% of the cases. In the Medicaid database, all of the cases were the same as those identified in the Medicare database, so those two were combined. There were 6 cases identified in that group, or roughly 50% of the cases in Olmstead County during this time period were identified in one of these two datasets. One of the criticisms of the Rochester Epidemiology Project is that its numbers and volumes are low. That is a valid criticism, so Dr. Sorenson extrapolated this data to what might occur in the state as a whole. In the population of Minnesota as a whole, there will be roughly 500 cases of ALS in the entire state based on epidemiology incidence and prevalence data over that time period. In the VA dataset, they were able to identified 16 confirmed cases of ALS (3% of the cases in Minnesota), and in the Medicare dataset they were able to identify 301 cases (60.2% of the cases in Minnesota). These two proportions are not additive because there is a great deal of overlap between them. With regard to the distribution of these cases between the VA and Medicare datasets, 4 cases were unique to the VA dataset, 12 cases were common to both, and 289 cases were unique to Medicare / Medicaid. One of the issues is that this process will not capture all of the cases of ALS, but it is a remarkable start.

Amyotrophic Lateral Sclerosis and Multiple Sclerosis Surveillance Annual Meeting June 24-25, 2009 Summary Report
19
In terms of who is being left out / missed, the VA dataset is overwhelmingly comprised of men so women are being missed. That is not a surprise. In the Medicare dataset, also not a surprise, is that younger people are being missed and that is probably inherent in who is enrolled in the programs. Also interesting is those absent from the dataset had a later date of onset. This probably reflects the nature of the data. It takes a while for younger people to progress to the point where they are disabled and are eligible for Medicare. These data were in the era before the exemption was allowed, so it is actually encouraging that many of these cases that were excluded would now probably be included, so the capture is probably actually higher than the 50% to 60% than Dr. Sorenson estimated. Minnesota identified 301 cases of ALS in the Medicare dataset, but one of the problems with the data within the dataset is that many of the patients do not have ALS. Consideration must be given to how to enrich the dataset in order to exclude the cases that do not have ALS and yet retain all of the cases that do have ALS. Dr. Sorenson lamented that about a year ago he was discouraged because this did not seem possible. However, as time went on he completed a simple algorithm in which all he did was examine those coded with ALS-specific codes of 335.20. In the Medicare dataset, 277 cases of ALS had the 335.20 code (92%). Thus, only 8% of cases were missing if 335.20 is used as a criterion. However, of the cases included in that dataset, 58 cases have a 335.20 code, but they did not have ALS. There is a similar trend with the VA. ALS-specific codes identified 13 cases (81%), but 5 of the cases with an ALS-specific code did not have ALS. This intrigued Dr. Sorenson, so he did a histogram of all of those cases (n=63) looking at the number of times the ALS code appeared in the national VA and Medicare databases. Roughly 34 of the cases appeared one time and 14 cases appeared two times, or for roughly 75% of the cases that were misclassified as ALS the code appeared only once or twice. In a few cases, the code appeared a much higher number of times. It was really the people who appeared 20 times but did not have ALS that interested him the most. In examining those, there were 9 cases in which the code of ALS appeared 5 times or more. Two of them had primary lateral sclerosis, and many clinicians would say that this is just “splitting hairs.” There would likely be no issue if those people were included in the registry. One case had multifocal motor neuropathy, which is also understandable to a degree. It is less clear how two cases of Parkinson’s disease and one case each of cranial neuropathies, multiple sclerosis, atrophic gastritis, and fibromyalgia got in. As good as Dr. Sorenson thinks the Mayo Clinic records system is, it is very possible that they missed these cases. The point is that there are just a handful of misdiagnosed cases, which is encouraging. Dr. Sorenson then examined those cases that appeared three times or more to exclude the handful of people who appeared at the very left end of the histogram. In terms of the total 305 cases of ALS, if an ALS code of three or more times was required in the national database, 245 (80%) cases of ALS would be captured and 60 cases would be missed. However, in doing so about 15 cases would be included of people who did not have ALS. In contrast to the larger database as a whole, the 15 cases represents about 7% of the cases in the data. He then generated an ROC curve to examine the number of times that the ALS diagnostic code appeared in the record. The better the discrimination, the closer to the upper left hand corner one appears. The blue curve is the ALS-specific codes and the red curve is the MND codes. Clearly, at every point along that curve, the ALS-specific codes are closer to that upper left hand corner. That is, the ALS codes specifically provide better discrimination than the MND codes. Moving along that curve, it becomes somewhat of a judgment because a decision must be made about where to place sensitivity and specificity. Sensitivity can be increased, but it always comes at the cost of specificity:

Amyotrophic Lateral Sclerosis and Multiple Sclerosis Surveillance Annual Meeting June 24-25, 2009 Summary Report
20
ROC curves for number of times ALS appears as diagnostic code
0.50.55
0.60.65
0.70.75
0.80.85
0.90.95
1
0 0.2 0.4 0.6 0.8 1
ALS
MND
sens
itivi
ty
1-specificity
In conclusion, Dr. Sorenson summarized that there are ways to enrich the sensitivity and specificity of the databases. Subjects will still be missed who are not enrolled in one of the national programs (e.g., younger subjects). VA data added some additional sensitivity, but only contributed 1.4% not found in Medicare / Medicaid data. Though he began somewhat discouraged, as they examined the data further, he was more encouraged that even with a simple algorithm they could very much enrich the data. More complex means of processing could probably do even better than that. Subjects will still be missed who are not enrolled in national programs, but with changes occurring in the Medicare enrollment policy and other changes that may occur with national healthcare; this may become increasingly less of an issue over time. While the VA data adds some information, it adds only about 1% to 2% of the cases. Overwhelmingly, the Medicare dataset provides the most value. Comments / Questions • With regard to the VA as a data source, Dr. Kasarskis said he thought the landscape had
changed fairly substantially in the last couple of months since ALS was designated as a service-connected disability for all. In his VA, they are seeing a number of veterans who have never set foot in a VA simply due to distance. There is now a financial incentive to present. Many people are registering within the system to receive the service-connected disability plus the benefits. While the portrayal of Minnesota was probably accurate for the years studied, the landscape has probably changed there as well and the potential value may increase.
• Dr. Sorenson concurred; pointing out that the rules of engagement had changed for a number of areas since the outset of this pilot project. It is highly possible that if the data were examined for 2005 to 2009, there would be a shift. While he did not know how many of the cases would be unique to the VA, he agreed that the landscape had shifted in terms of the VA representation.
• Dr. Brooks inquired as to whether the 305 were from all of Minnesota or just in the Mayo
Clinic medical record system. He also wondered how the EMG played out.
• Dr. Sorenson responded that what they received from ATSDR was all of the cases of people who lived in Minnesota. Just under half of those were patients at the Mayo Clinic. While these cases were from throughout the state, they were the densest in the Mayo Clinic’s

Amyotrophic Lateral Sclerosis and Multiple Sclerosis Surveillance Annual Meeting June 24-25, 2009 Summary Report
21
immediate region. Cases in the Minneapolis region would go to the Minneapolis medical center. They were able to obtain many of the association records through their records system. The population density of Minnesota falls into three areas: Duluth, Minneapolis / St. Paul, and Rochester. Where EMG came from was not distinguished. All cases were seen by a neurologist. The code came from the EMG laboratory. There was not a high yield in examining the EMG data.
• Dr. Benatar noted that the inference appeared to be that there seems to be reasonable
sensitivity from the national data sources, but the specificity is actually pretty poor.
• Dr. Sorenson concurred, but stressed that there were ways to improve that with algorithms. He is very optimistic that the data can be improved upon much better than merely taking everybody and globally putting them in the pot.
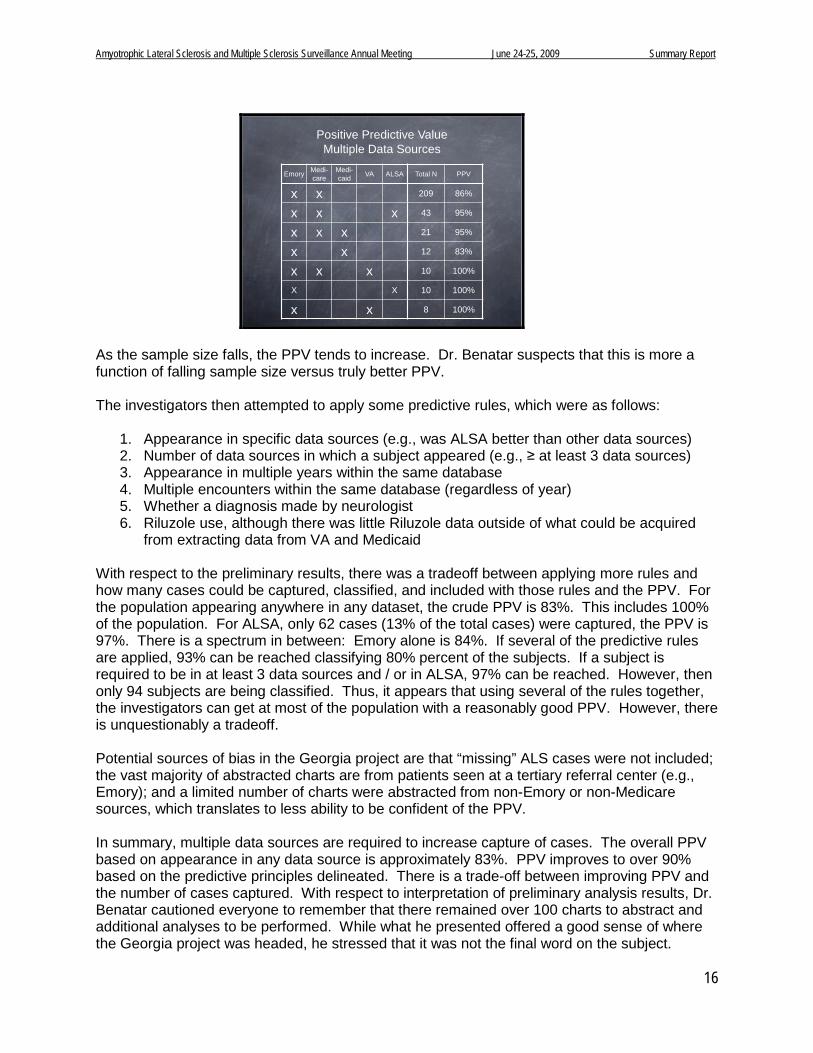
HMO Research Network Mark C. Hornbrook, PhD, Chief Scientist The Center for Health Research Kaiser Permanente Northwest: Portland, Oregon David R. Nerenz, PhD Henry Ford Health System Stephen Van Den Eeden, PhD Kaiser Permanente’s Division of Research Dr. Hornbrook led the presentation from the HMO Research Network. He presented an overview of the methods and results for all 9 sites. Dr. David Nerenz, Henry Ford Health System, summarized the experiences of a unique health system that serves as a tertiary neurology referral center for Southeastern Michigan as well as owning an integrated delivery system. Both fee-for-service cases and prepaid capitation cases were included in the analyses for this study. Dr. Stephen van Den Eeden, Kaiser Permanente’s Division of Research, then summarized a computer-aided regression tree method for deriving an algorithm to sort electronic medical data by ALS / MND status. The HMO network members are shown on the following map, with the 9 systems included in the registry project circled:
Amyotrophic Lateral Sclerosis and Multiple Sclerosis Surveillance Annual Meeting June 24-25, 2009 Summary Report
22
© 2009, KAISER PERMANENTE CENTER FOR HEALTH RESEARCH
ATSDR ALS/MND Registry Project
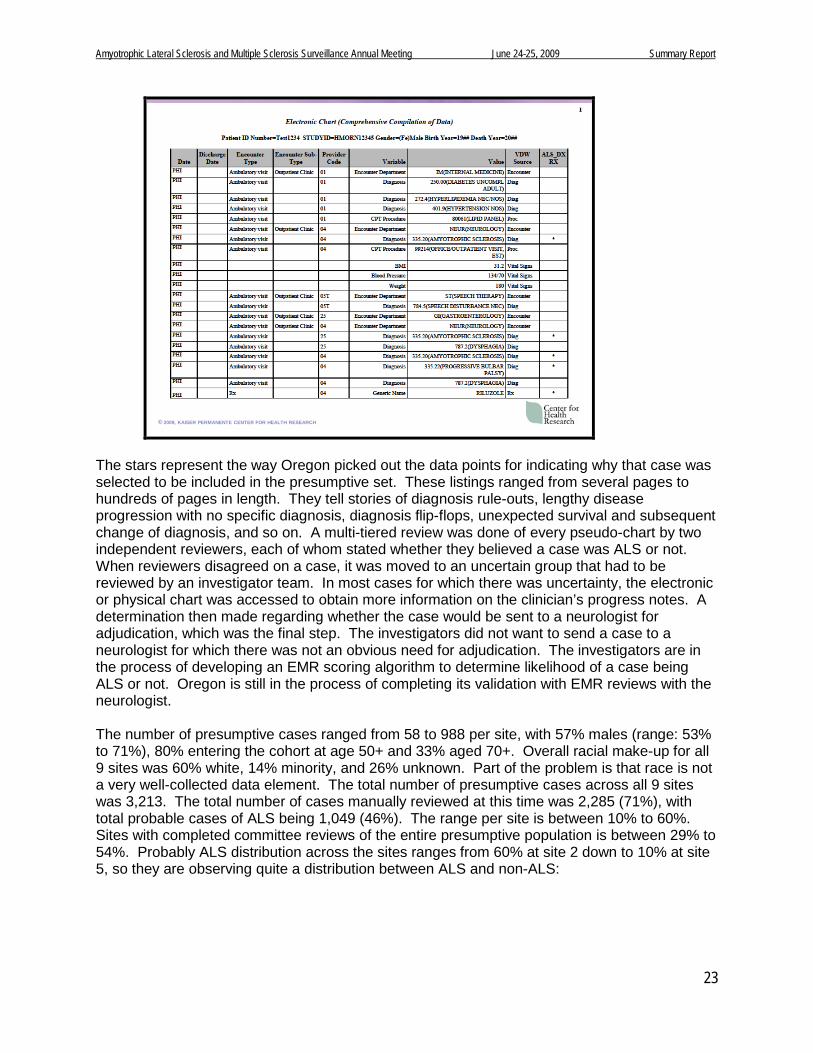
This set of health systems is quite important because they have Medicare risk contracts, meaning that that the risk contract set of data disappears from the Medicare databases. The data are held at CMS, but nobody is analyzing those data that are sent in as pseudo claims. With that in mind, he indicated that he would share some data suggesting that there is a lot of data loss in the Medicare / Medicaid approach without having access to HMO data. There are also HMOs that are the sole providers in their area, such as Marshfield and Geisinger that are located in rural areas in which they provide most of the care in their catchment area. That will change how they relate to the Medicare / Medicaid data, which is another very important point. HMORN members have extensive electronic data warehouses containing eligibility, demographic, clinical, and utilization data. Nine health plans were selected to test the feasibility of using electronic sources to create a national ALS / MND Disease Registry. In terms of methodology, Oregon did a presumptive HMO case population based on any hit on the ICD-9 diagnoses or Riluzole dispense in an effort to find anyone who had ALS or MND during the period January 2001 to December 2005. Subjects had to be > 20 years of age at the time of ALS diagnosis. Since some people were in the database in 2005, some of them were 16 or so in 2001. A chronologic listing was created of all utilization events from claims, encounter, and electronic medical record data for each presumptive case (known as the pseudo-chart or p-chart) in order to profile 100% of the utilization (e.g., emergency department, physician, PT, OT, hospital, neurologist, et cetera). The following is a one-page example of a line listing of every event that appears. Every event has multiple attributes (e.g., provider code, place, diagnosis, procedures):
Amyotrophic Lateral Sclerosis and Multiple Sclerosis Surveillance Annual Meeting June 24-25, 2009 Summary Report
23
© 2009, KAISER PERMANENTE CENTER FOR HEALTH RESEARCH
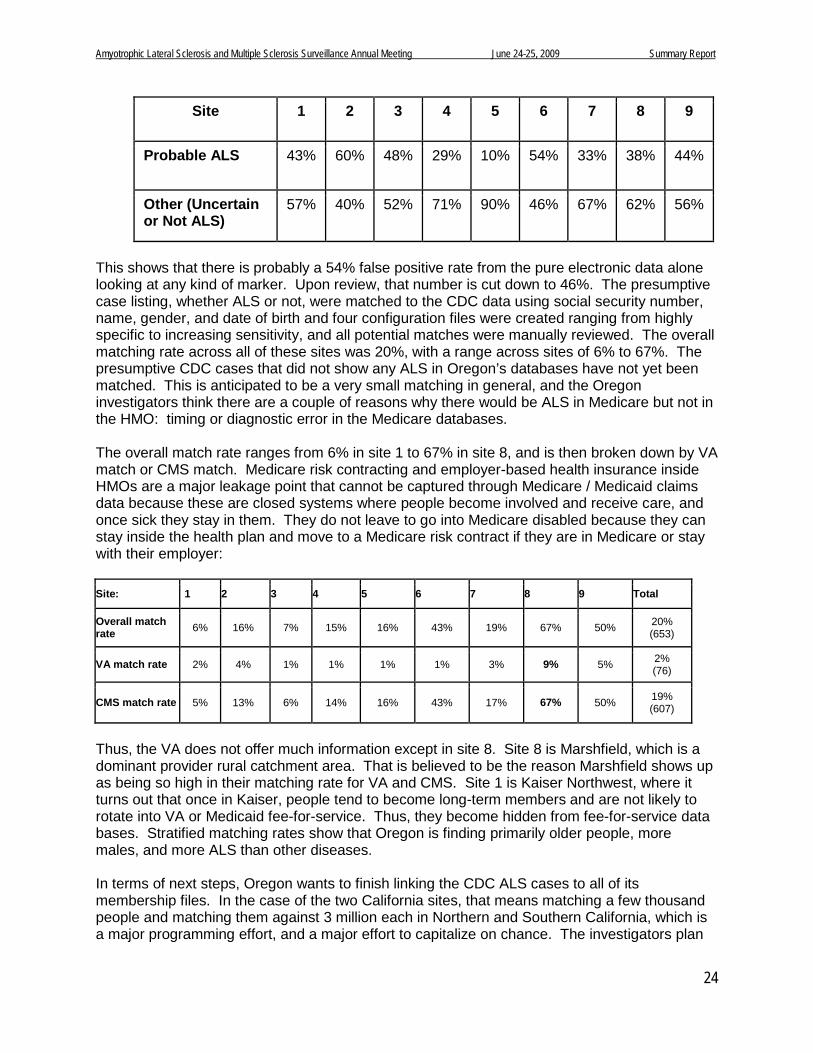
The stars represent the way Oregon picked out the data points for indicating why that case was selected to be included in the presumptive set. These listings ranged from several pages to hundreds of pages in length. They tell stories of diagnosis rule-outs, lengthy disease progression with no specific diagnosis, diagnosis flip-flops, unexpected survival and subsequent change of diagnosis, and so on. A multi-tiered review was done of every pseudo-chart by two independent reviewers, each of whom stated whether they believed a case was ALS or not. When reviewers disagreed on a case, it was moved to an uncertain group that had to be reviewed by an investigator team. In most cases for which there was uncertainty, the electronic or physical chart was accessed to obtain more information on the clinician’s progress notes. A determination then made regarding whether the case would be sent to a neurologist for adjudication, which was the final step. The investigators did not want to send a case to a neurologist for which there was not an obvious need for adjudication. The investigators are in the process of developing an EMR scoring algorithm to determine likelihood of a case being ALS or not. Oregon is still in the process of completing its validation with EMR reviews with the neurologist. The number of presumptive cases ranged from 58 to 988 per site, with 57% males (range: 53% to 71%), 80% entering the cohort at age 50+ and 33% aged 70+. Overall racial make-up for all 9 sites was 60% white, 14% minority, and 26% unknown. Part of the problem is that race is not a very well-collected data element. The total number of presumptive cases across all 9 sites was 3,213. The total number of cases manually reviewed at this time was 2,285 (71%), with total probable cases of ALS being 1,049 (46%). The range per site is between 10% to 60%. Sites with completed committee reviews of the entire presumptive population is between 29% to 54%. Probably ALS distribution across the sites ranges from 60% at site 2 down to 10% at site 5, so they are observing quite a distribution between ALS and non-ALS:
Amyotrophic Lateral Sclerosis and Multiple Sclerosis Surveillance Annual Meeting June 24-25, 2009 Summary Report
24
Site 1 2 3 4 5 6 7 8 9
Probable ALS 43% 60% 48% 29% 10% 54% 33% 38% 44%
Other (Uncertain or Not ALS)
57% 40% 52% 71% 90% 46% 67% 62% 56%
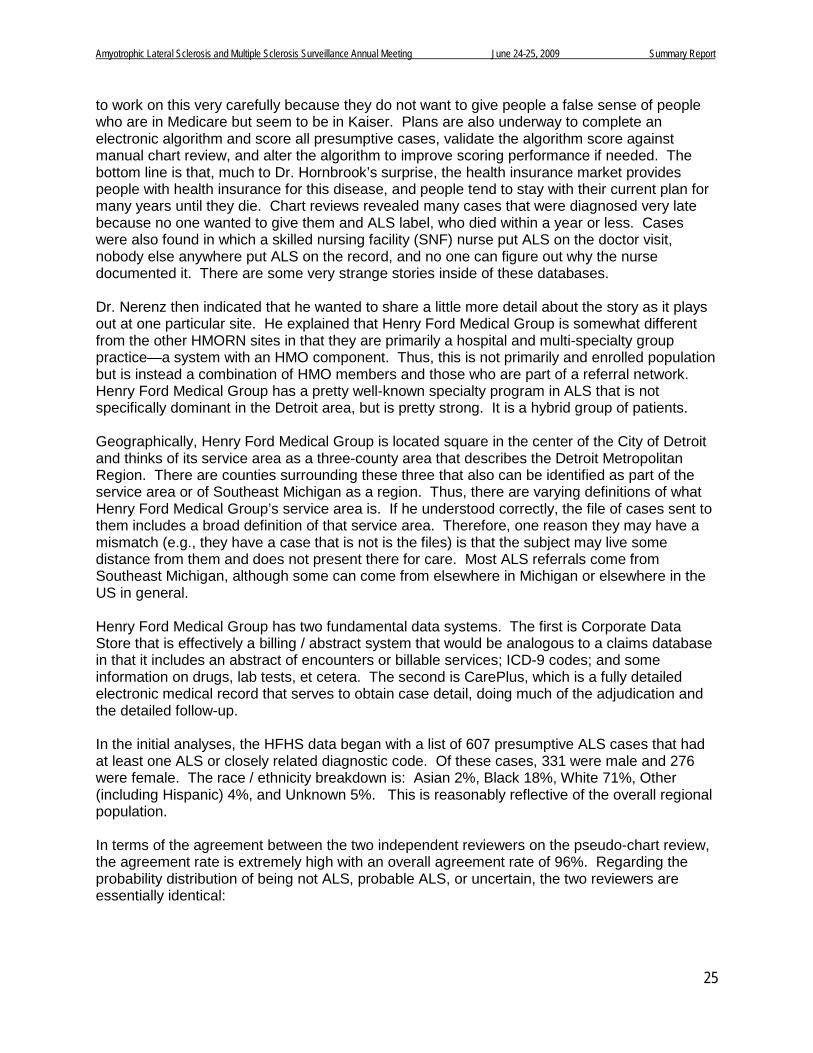
This shows that there is probably a 54% false positive rate from the pure electronic data alone looking at any kind of marker. Upon review, that number is cut down to 46%. The presumptive case listing, whether ALS or not, were matched to the CDC data using social security number, name, gender, and date of birth and four configuration files were created ranging from highly specific to increasing sensitivity, and all potential matches were manually reviewed. The overall matching rate across all of these sites was 20%, with a range across sites of 6% to 67%. The presumptive CDC cases that did not show any ALS in Oregon’s databases have not yet been matched. This is anticipated to be a very small matching in general, and the Oregon investigators think there are a couple of reasons why there would be ALS in Medicare but not in the HMO: timing or diagnostic error in the Medicare databases. The overall match rate ranges from 6% in site 1 to 67% in site 8, and is then broken down by VA match or CMS match. Medicare risk contracting and employer-based health insurance inside HMOs are a major leakage point that cannot be captured through Medicare / Medicaid claims data because these are closed systems where people become involved and receive care, and once sick they stay in them. They do not leave to go into Medicare disabled because they can stay inside the health plan and move to a Medicare risk contract if they are in Medicare or stay with their employer: Site: 1 2 3 4 5 6 7 8 9 Total
Overall match rate 6% 16% 7% 15% 16% 43% 19% 67% 50% 20%
(653)
VA match rate 2% 4% 1% 1% 1% 1% 3% 9% 5% 2% (76)
CMS match rate 5% 13% 6% 14% 16% 43% 17% 67% 50% 19% (607)
Thus, the VA does not offer much information except in site 8. Site 8 is Marshfield, which is a dominant provider rural catchment area. That is believed to be the reason Marshfield shows up as being so high in their matching rate for VA and CMS. Site 1 is Kaiser Northwest, where it turns out that once in Kaiser, people tend to become long-term members and are not likely to rotate into VA or Medicaid fee-for-service. Thus, they become hidden from fee-for-service data bases. Stratified matching rates show that Oregon is finding primarily older people, more males, and more ALS than other diseases. In terms of next steps, Oregon wants to finish linking the CDC ALS cases to all of its membership files. In the case of the two California sites, that means matching a few thousand people and matching them against 3 million each in Northern and Southern California, which is a major programming effort, and a major effort to capitalize on chance. The investigators plan
Amyotrophic Lateral Sclerosis and Multiple Sclerosis Surveillance Annual Meeting June 24-25, 2009 Summary Report
25
to work on this very carefully because they do not want to give people a false sense of people who are in Medicare but seem to be in Kaiser. Plans are also underway to complete an electronic algorithm and score all presumptive cases, validate the algorithm score against manual chart review, and alter the algorithm to improve scoring performance if needed. The bottom line is that, much to Dr. Hornbrook’s surprise, the health insurance market provides people with health insurance for this disease, and people tend to stay with their current plan for many years until they die. Chart reviews revealed many cases that were diagnosed very late because no one wanted to give them and ALS label, who died within a year or less. Cases were also found in which a skilled nursing facility (SNF) nurse put ALS on the doctor visit, nobody else anywhere put ALS on the record, and no one can figure out why the nurse documented it. There are some very strange stories inside of these databases. Dr. Nerenz then indicated that he wanted to share a little more detail about the story as it plays out at one particular site. He explained that Henry Ford Medical Group is somewhat different from the other HMORN sites in that they are primarily a hospital and multi-specialty group practice—a system with an HMO component. Thus, this is not primarily and enrolled population but is instead a combination of HMO members and those who are part of a referral network. Henry Ford Medical Group has a pretty well-known specialty program in ALS that is not specifically dominant in the Detroit area, but is pretty strong. It is a hybrid group of patients. Geographically, Henry Ford Medical Group is located square in the center of the City of Detroit and thinks of its service area as a three-county area that describes the Detroit Metropolitan Region. There are counties surrounding these three that also can be identified as part of the service area or of Southeast Michigan as a region. Thus, there are varying definitions of what Henry Ford Medical Group’s service area is. If he understood correctly, the file of cases sent to them includes a broad definition of that service area. Therefore, one reason they may have a mismatch (e.g., they have a case that is not is the files) is that the subject may live some distance from them and does not present there for care. Most ALS referrals come from Southeast Michigan, although some can come from elsewhere in Michigan or elsewhere in the US in general. Henry Ford Medical Group has two fundamental data systems. The first is Corporate Data Store that is effectively a billing / abstract system that would be analogous to a claims database in that it includes an abstract of encounters or billable services; ICD-9 codes; and some information on drugs, lab tests, et cetera. The second is CarePlus, which is a fully detailed electronic medical record that serves to obtain case detail, doing much of the adjudication and the detailed follow-up. In the initial analyses, the HFHS data began with a list of 607 presumptive ALS cases that had at least one ALS or closely related diagnostic code. Of these cases, 331 were male and 276 were female. The race / ethnicity breakdown is: Asian 2%, Black 18%, White 71%, Other (including Hispanic) 4%, and Unknown 5%. This is reasonably reflective of the overall regional population. In terms of the agreement between the two independent reviewers on the pseudo-chart review, the agreement rate is extremely high with an overall agreement rate of 96%. Regarding the probability distribution of being not ALS, probable ALS, or uncertain, the two reviewers are essentially identical:

Amyotrophic Lateral Sclerosis and Multiple Sclerosis Surveillance Annual Meeting June 24-25, 2009 Summary Report
26
Not ALS Probable ALS
Uncertain Reviewer 1 Totals
Reviewer 1 Percent
Not ALS 211 3 2 216 35.6%
Probable ALS
1 291 11 303 49.9%
Uncertain 6 1 81 88 14.5%
Reviewer 2 Totals
218 295 94 607
Reviewer 2 Percent
35.9% 48.6% 15.5%
Interestingly, of the 607 cases, approximately a third were clearly classified as not being ALS. They found quickly that many of the cases for whom one or more diagnoses codes are assigned are clearly rule out cases, meaning that the code was assigned to initial consultation and may have been assigned to a diagnostic test. All of the events may have occurred in the course of either the initial diagnosis or a longer period of uncertainty, but it also becomes clear as subsequent events unfold that it is not ALS and the adjudicators can tell. Not all rule-outs have a related diagnosis (e.g., other MND). A significant number of cervical disk problems were found that had led to gait problems or other issues that caused the suspicion of ALS. In terms of the initial match results with those which came from CDC, there were 1432 cases on the CDC list. The number of presumptive cases was 607. There was match for 263 cases, which appeared on both lists. The number matched by Social Security Number only was 245, while the number matched by Social Security Number + name / gender / date of birth was 18. Potential reasons for absence of a match between the Medicare list and HFHS-generated list include the following: Real person with ALS, but not an HFHS patient (could be HAP member); real person, seen by HFHS, with no ALS code in any encounter at HFHS; some error in name, address, Social Security Number, or other matching variable; person with possible ALS, seen by HFHS, but ALS ruled out in favor of other diagnosis; person seen by HFHS for ALS, but no services were billed to Medicare; and / or coding error(s) in either HFHS data or in Medicare data. They are still in the process of exploring match results. The following graphically illustrates the match results:
Exploration of Match Results
1192
Have Henry Ford MRN547
No Henry Ford MRN645
HFH Presumptive ALS Cases (N = 607)
CDC/CMS List of Possible Cases (N = 1432)
240
Not Seen in 2001-2005467
Seen in 2001-200580
367

Amyotrophic Lateral Sclerosis and Multiple Sclerosis Surveillance Annual Meeting June 24-25, 2009 Summary Report
27
There were 80 people who were identified in the Medicare files as having ALS, were not identified by HFHS as having ALS, but within the 2001-2005 timeframe they were seen by HFHS. To explore this further, a sample of 10 records was pulled. In two of the cases, there was only one encounter, for example an emergency department visit, and no mention of ALS. On that basis, little can be said. They cannot say that the person does not have ALS, but at least it did not come up in the HFHS database. In four people, there were one or two encounters. While they do have a medical record, the HFHS interaction with these people is very light—they are not being seen for an expanded period of care. In these perhaps there was some possible ALS connection, meaning that there was a symptom such as a gait problem, but an ALS code was not assigned and did not appear in the text as a strong possibility. Another four of these people had extensive contact with HFHS, including neurology and neurosurgery, but the diagnosis was something else. One case was MS. Somewhere someone else assigned ALS to these 10 cases, but it was pretty clear that in the HFHS system, this was not assigned. Therefore, they did not appear in the list of 607. Starting with the groups from the pseudo chart review as the denominators looking at the match, about half of the cases that HFHS is pretty sure are ALS did not appear in the list HFHS was given from CDC. These are not all HMO members, so perhaps there are more complex reasons that these subjects did not show up. HFHS continues to explore that. For those HFHS does not believe are ALS, the match rate is lower. The adjudication process continues, which should offer further insight into what is occurring with a few of the uncertain cases and confirming that the judgments from the pseudo-charts are correct. HFHS continues to explore the issue of the match, which offers information about the predictive value of various case finding algorithms. Dr. Van Den Eeden reported on the development of an algorithm for classifying ALS cases using electronic records. During the first round, Kaiser concluded that surveillance based only on electronic records is going to have some misclassification. This will be somewhat problematic with respect to surveillance issues. If trying to estimate incidence, prevalence, and mortality but it is not clear what the case count is, this is more difficult. These types of systems have great value in supporting studies of etiology, progression, and resource deployment. The longer there is a consistent record to look at, the more informative it will be at the end of that story versus having one hit. For the algorithm, Classification And Regression Trees (CART) was used. CART was developed in 1984 by Stanford University and University of California, Berkeley statisticians. CART is a binary recursive partitioning approach to develop branching decision tree that can “prune” the tree, has automated validation procedures, handles missing data well, splits continuous variables at most definitive point (no need to pre-specify), indicates the level of misclassification, can generate an “easy” to understand flow diagram, specifies what variables are important, and permits the investigator to configure variables to perform differently (e.g., better). The following table illustrates the list of variables created:

Amyotrophic Lateral Sclerosis and Multiple Sclerosis Surveillance Annual Meeting June 24-25, 2009 Summary Report
28
Data used
Variable Format Importance Overall Primary Splitters
ALS dx by non-neurologist Continuous 100 1 3
ALS dx by neurologist Continuous 96.88 2 1
No. of EMG before ALS dx Continuous 63.73 3
No. of EMG before last ALS dx Binary 58.97 4
No. Neurology before last dx Continuous 58.51 5
NonALS MND dx by non-neurologist Continuous 46.01 6 2
NonALS MND dx by neurologist Continuous 24.79 7 4
Stroke dx afer ALS Continuous 19.7 8
No. of EMGs done Continuous 19.59 9
Length of follow-up after first MND/ALS note In Month 18.04 10 5
MND noted on death certificate Binary 15 11 8
No. of stroke dx Continuous 12.15 12
MND dx made by neurologist Continuous 11.58 13 6
Polio dx Continuous 8.41 14 7
Spinal stenosis after ALS dx Continuous 6.98 15 9
Cerebral degenerat. dx after ALS Continuous 6.85 16
Age of first MND/ALS note In Years 3.94 17 10
Cerebral degenerat. dx before ALS Binary 3.07 18
No. of riluzole prescriptions Continuous 2.94 19 11
No. of spinal stenosis dx Continuous 2.13 20
Spinal stenosis dx Binary 1.99 21
No.of fasiculation reports/notes Continuous 1.91 22
No. of Intubation/resp. support notes Continuous 1.35 25
Dr. Van Den Eeden walked the group through the upper right hand component of the current tree (e.g., history of an ALS diagnosis by a neurologist diagnosis in order to give them a flavor for what occurs:
Current tree
Not ALS
PLS, PMA, PseudBP,
PBP or CSP
>5 "Other MND" Dx by
NEU
Hx "Other MND" Dx by
Non-NEU
YESHx of ALS
Dx by Neurologist
NO
YESNO
YESNOHx >1 ALS Dx by Non-
NeuYESNO Hx Polio
YESNOPLS, PMA, PseudBP,
PBP or CSPALS
Hx >1 MND Dx by NEU
YESNO
ALS
>1 Dx of Spinal
Stenosis after Last ALS Dx YESNO
Not ALSALS
>17 months follow-up
post 1st ALS Dx
YESNO
Hx "Other MND" Dx by
NEU YESNO
PLS, PMA, PseudBP,
PBP or CSPNot ALS
Death Certificate
States "MND"
YES
NO
ALSHx "Other MND" Dx by
NEUYES
PLS, PMA, PseudBP,
PBP or CSP
NO
Reference Age >=60
YESNO
Not ALSHx >1 MND Dx by NEU YES
NO
Hx Riluzole
YESNO
Not ALS Insuff. Info
Unclear
The history of an ALS diagnosis is a yes / no classification. If there are more than five diagnoses that are not ALS, the system will classify these as Other MND. If the answer to that is no, the case ends up in a terminal node of ALS for which there is no need to split further. This is a self-validating program, so it subsets the data repeatedly, reruns the analysis, and says how well the classification systems come out. In terms of assessing the misclassification, 94 out of 119 non-ALS were concordant, 95 of the 100 other MND were concordant, and 475 of the 481 were concordant.
In summary, the algorithm concords with clinical processes, classifies according to the amount of information known, and improves classification with longer follow-up and comprehensiveness of data sources. The next step is to operationalize and test the algorithm at other sites. There is another independent effort underway. The algorithm can be and is being improved.
Amyotrophic Lateral Sclerosis and Multiple Sclerosis Surveillance Annual Meeting June 24-25, 2009 Summary Report
29
Comments / Questions • It was noted that this was what was observed with the VA registry. A couple of years ago
there were screening questions via telephone, the first of which was, “Has any healthcare provider ever said you have MND or ALS and do you have progressive weakness?” If those answers were both yes, it turned out to be 93% based on subsequent chart review. An inquiry was posed regarding whether a requirement for a second opinion by a neurologist was built into any of the predictive models and concordance sought between the two neurologists. Many people seek a second opinion, and many physicians refer someone they diagnose with ALS for other care (e.g., Mayo Clinic, Emory, Cleveland Clinic).
• Dr. Van Den Eeden responded that they had not, but that it would be easy to build into the system by simply creating a variable that asks, “Have you ever received an ALS diagnosis by two different neurologists.”
• Dr. Hornbrook replied that what they see in their databases is the fact that the neurologists
are themselves the referral / second opinion. In each of the health plans, there is a neurologist who is the ultimate arbiter of whether a person has ALS. In some cases, patients do not believe the diagnosis and go outside their plan. In other cases, people go by the nerve conduction test. If there is definite slowing, there is ambiguity and the neurologist is uncertain about what they are seeing in the nerve conduction tests and will write that in their chart notes. Sometimes they still put an ALS diagnosis on it, and sometimes they do not. Sometimes people return with more regression, which resolves the question.
• Dr. Bryan Traynor (NIH) pointed out that to estimate incidence and prevalence, they should
be talking about a population. It was not clear to him whether an HMO was sufficient in that regard. A defined catchment area and population are needed, and all of the individuals within that need to be captured. Singling out individual HMOs within an area may not be sufficient to estimate incidence and prevalence accurately. In Europe when algorithms are made for ALS and reaching a diagnoses, they use Brooks’ El Escorial criteria. He wondered if anyone had incorporated that into their algorithms. What really defines whether a patient has ALS is their symptoms and signs.
• Dr. Van Den Eeden responded that they had built El Escorial criteria, but these criteria will
not be found in medical records in most cases.
• Dr. Benatar said that not clear to him was that all of this was based on the pseudo-chart reviews, which were validated by the real charts. As with the European experience, Emory investigators have found that for the most part, they could not get enough data because of their referral system.
• Dr. Van Den Eeden replied that they searched El Escorial criteria for most of their cases. It
can be done. It seems most prudent to spend time on questionable cases rather than those that are clear.
• Dr. Traynor said that another point to consider, as he had published previously, regarded
the time point at which the patient was being examined. If they were being examined at the time they first presented to the neurologist’s office, there would be a lot of wiggle room. At three years post-diagnosis or post symptom onset, the diagnosis is much more concrete. The El Escorial can actually help.

Amyotrophic Lateral Sclerosis and Multiple Sclerosis Surveillance Annual Meeting June 24-25, 2009 Summary Report
30
• Dr. Van Den Eeden agreed. He also argued that HMOs provide one of the better places to
get reasonable information. They can calculate person months of exposure time of collecting new cases. There are not going to be problems with missing charts that they cannot look at.
• Dr. Traynor said the data would argue the opposite. For the Detroit location, half of the
cases had not charts.
• It was noted that Henry Ford Health Center is specifically unique.
• Dr. Hornbrook indicated that they are dealing with defined populations within an insurance model, so someone is enrolled regardless of whether they use the service. To the extent that people are loyal and stay enrolled for the whole data period, they have everything. To the extent that they come and go because they have other choices during that period, they do not have all of that time. The younger the enrollee, the more likely they are to switch based on pricing at the time of open enrollment. The older someone is and the more chronic disease they have, the more likely they are to stay. In looking at hundreds of charts, it is clear that once someone has neurological symptoms, they do not leave. There is no evidence that people disappear in the middle of their episode.
• Dr. Traynor drew everyone’s attention to the experience in Israel where it has been shown
that the incidence of ALS is 1.1 per 100,000. It is widely acknowledged that that is a tremendous underestimate mainly because Arabs are not able to access the Israeli health care system. There are essentially two proportions within Israel, so Dr. Traynor was worried that with the HMO project would result in the same problem—that the HMO population would not be representative of the general populations.
• Dr. Hornbrook responded that some of their HMOs have Medicaid risk contracts and some
do not. Clearly there is a bias toward blue collar and middle income.
• Dr. Kaye clarified that the pilot projects are not the end all for the surveillance system. The people participating were selected because they represent different populations: referral centers (Emory and Mayo), state-based system, and HMOs to determine where the holes would be in developing a national system and using existing data to determine which people would be missing. The HMO would not be the surveillance system.
• With regard to longitudinal data, Dr. Brooks inquired as to whether anyone had had a
chance yet to assess patients in the system who were first defined as unsure, but were later diagnosed.
• Dr. Van Den Eeden responded that most of the ones who were uncertain left the system.
This was 33 people out of 700 to 800 people. It was fairly low and there were insufficient records to make a judgment.
• Dr. Sorenson noted that one criticism that could be made is over-classifying / over-splitting.
• Dr. Ven Den Eeden reminded everyone that self-validation was built into the system. What
that says is that this performs in that way within these data. They did not split the sample. They felt it was more important to develop an algorithm that worked well with what they consider a reasonably complete set of data and then export it to some of the other
Amyotrophic Lateral Sclerosis and Multiple Sclerosis Surveillance Annual Meeting June 24-25, 2009 Summary Report
31
participants in the system. They will try to configure as many of the variables as possible to be generic so that they can be applied elsewhere.
• Dr. Williamson noted that there are several methods available that allow one to discriminate,
such as discriminate analysis, factor analysis, and neural networks. With that in mind, he wondered what drove them to CART. It seemed like there was an opportunity to use a couple of other methods later.
• Dr. Van Den Eeden replied that they engaged in long discussions within their group about
which one to choose. They selected CART at this point, though they plan to look at others, partly due to the simplicity of the algorithm. There is a flow diagram with binary cut points. They felt that this was something that could be easily programmed for other systems in a much easier way and it is easier to interpret.
• Dr. Hornbrook added that CART is easier in a general audience to explain that some of the
neural networks, which is extremely complex. Inside the systems that have electronic medical records, the electronic data are the medical-legal record. There is no other record against which to validate. The text entries or consulting report that go along with an encounter can be examined. These HMOs are a vision of the future in which every inpatient stay and outpatient visit is charted on the computer, with no paper records.
Question and Answer Panel ALS Pilot Projects • Dr. LaRocca said he was somewhat “blown away” by all of the presentations in terms of how
important the Medicare / Medicaid datasets are. The various speakers cited some of the issues with those datasets in terms of specificity, sensitivity, need for algorithms, et cetera. His thinking was running somewhat ahead of that because eventually, the goal was to address incidence / prevalence, prevention / treatment, and research / clinical trials. If they had to be so dependent upon the Medicare / Medicaid datasets and they eventually become an integral part of whatever comes out of this effort, he wondered how those datasets would be utilized in order to accomplish the long-term goals of the effort.
• Dr. Hornbrook responded that the Medicare / Medicaid datasets were the foundation with which they had to work currently because they are available, most universal, most used, and have training sessions to learn how to use the data. The FDA is ready to let contracts for building a sentinel network, which is going to raise a major set of informatics consortiums across the country who have access to diagnostic, procedure, and drug data to examine the safety of therapeutics systems across the country. It seems that there is a very straightforward “piggybacking” on the sentinel network informatics contracts for ALS and other types of disease registries that goes beyond pure claims data. What they did not show due to the time constraints was that the HMO Research Network has built a standardized data warehouse to make their data interoperable across all 16 sites. Rather than examining 16 different health plans, examination could be done in a single data warehouse for ALS registry input. They are thinking about how to tap into electronic medical records systems for vital and health status data without having to go through chart abstractions, send people out physically to doctor’s offices to conduct abstracts on ambulatory visits, et cetera. There will be much more electronic data in the future.
• Dr. Brooks pointed out that what was really needed was a front-end system. He wondered whether the web portal, for instance, would have a diagnostic algorithm that people could use, “If I’m weak, I’ll go to the CDC protocol, go through an algorithm, and then go to my

Amyotrophic Lateral Sclerosis and Multiple Sclerosis Surveillance Annual Meeting June 24-25, 2009 Summary Report
32
doctor.” That is the carrot for the patient as well as getting identification for somebody who may be registered. The Institute of Medicine (IOM) report on bioterrorism and the effect of chronic toxicity in communities highlighted how difficult it is to get on-line with respect to low level chronic toxicity leading to nervous system disease. This is already in the literature, for example in Tokyo, there is an example of old nerve toxicity leading to an MS-like disease that occurred across multiple ages. Eventually they were able to determine that this was a toxic exposure in a segment of Tokyo. The same issue arises in terms of the ALS clusters. It is important to garner information earlier than the dataset in order to have a signal about what is occurring.
• Ms. Kennedy noted that what is often observed at MDA clinics is that because they pay for patient care, they often have patients who receive all of their follow-up care at the multidisciplinary ALS clinics and leave their HMO system. It would be interesting to see if some of the Medicare records that disappeared could be accounted for in some of MDA’s patient records. Looking toward the ALS registry, if this is going to be a self-reported web portal, she wondered if they were considering the cost-benefits of curation of that data so that it would be usable for other purposes beyond surveillance.
• Reflecting on Dr. Williamson’s earlier comments about the first meeting, Mr. Gibson pointed out that while the diseases are similar, they are very different. Reviewing the first minutes, the goals are also very different in terms of the avenues available in moving forward. One of the major differences is that ALS has a waiver, but MS does not so a lot of cases are going to be lost. There seems to be a great deal left to flesh out in the ALS area before they begin pushing this all together. Medicare is a prime example. Apples and oranges cannot be compared.
• In terms of identifying cases in Europe, Dr. Traynor indicated that working with the various charities had been very successful (MDA, ALSA). With that in mind, he wondered what effort had been made within the various catchment areas to work with the various associations in terms of identifying cases.
• Dr. Hornbrook reminded everyone that there are patients who have ALS who cannot give any kind of informed consent because they are so far gone. They will not be the ones self-identifying on the web portal. It will be a caregiver or someone else doing this on their behalf. In that case, treatment is keeping them comfortable, fed, and breathing. Often, patients’ swallowing, breathing difficulties, and mobility problems are simply long-term care maintenance or frailty issues and the diagnosis is not that important because the person has multiple diseases. Inside of the systems they have to be aware that not all patients are very self-motivated and highly organized.

Amyotrophic Lateral Sclerosis and Multiple Sclerosis Surveillance Annual Meeting June 24-25, 2009 Summary Report
33
CMSC / NARCOMS Patient Registry Tuula Tyry, PhD, MAED Program Manager North American Research Committee on MS Registry Dr. Tyry reported that the rumors about people moving around are absolutely true. The CMSC project is a long-term project. Over 30,000 people are in the registry and some people have been in the registry for over 15 years. Thus, they have a sizable cohort of longitudinal data. What has changed is that they are now administratively part of two larger registries: The Global MS Patient Registry and the Global Demyelinating Disease Registry, which will be the larger registry. The data operating center is currently at the University of Alabama at Birmingham. They also continue operations in Phoenix, Denver, and Winnipeg in Canada. Dr. Vollmer, who was influential in starting the registry, continues as the Medical Director. Dr. Cutter at Birmingham is the Database Director. The pilot project includes government data sources: VA database (VHA, VBA, Pharmacy) and Medicare database (MP, OP, PB). The size of the VA database was about 1600 and Medicare about 16,000. Selected states included Minnesota, Georgia, and South Carolina. Data were also pulled from the NARCOMS database for the State of New York, which they gave to Dr. Barbara Teter. The selected time frame was 2001 to 2005. Query criteria for the national databases included ICD-9 codes and DMAMS. The National MS Society database was about 23,000. NARCOMS data for the three states was about 1400. Records were matched with NARCOMS and NMSS data in an attempt to find valid cases. Service use patterns of matched cases were assessed. There were good matches with NARCOMS. The total number of matches in the VA database and NARCOMS was 164 / 1599 (10.3%). Most of those were from the VHA database (n=157) and there were very few additional cases by adding the other sources: VBA (n=113) and Pharmacy (n=88). Overall, about 10% of the VA data was also in NARCOMS. With Medicare, 441 / 16626 (2.7%) were found. When the VA and Medicare sources were combined, 533 / 17713 (3.0%) cases were found. Of the total cases, 72 were in all databases. All of the cases found were also in the National MS Society database, which is explained at least partially because of the similar recruitment methods that are used for National MS Society and NARCOMS. Matching criteria included: first name, last name, middle name / initial, maiden name, date of birth, state of residence, city, sex, and race / ethnicity. Challenges included spelling errors in first and last names, married versus maiden name, guardian versus patient information, first and middle name reversed, nickname versus official name, suffixes (Sr, Jr, I, II), reversal in date of birth ( mm/dd/yyyy versus dd/mm/yyyy), coding of race / ethnicity (multi-race + Latino), and missing data (is NULL a better match than entries that do not match?). NARCOMS data on missing and matched groups is as follows:
Briefings on the MS Surveillance Projects

Amyotrophic Lateral Sclerosis and Multiple Sclerosis Surveillance Annual Meeting June 24-25, 2009 Summary Report
34
VA match Not in VA Medicare match Not in Medicaren 165 1692 442 1415% female 10.9 77.1 65.8 72.9Average age 61.9 53.3 59.2 52.5SD (years) 10.1 11.7 11.3 11.5Disease duration 20.5 13.8 18.3 13.1SD (years) 11.4 9.4 10.1 9.3 The primary point is that the disease duration is very important. With the matches, the disease duration was over 20 years. Obviously, someone who has had MS for 20 years will use very different services from someone who has been recently diagnosed. Further analyses with NARCOMS data that are either underway or are planned include service use patterns versus disease duration, service use patterns versus MS type, service use patterns versus symptoms, and service use patterns versus disability level. For those missed by the government databases, provider / alternative providers and therapy data can be examined from the NARCOMS database. For example, some patients may see a VA neurologist once a year just to keep their benefits, but they may opt to have their other neurologist serve as the primary MS care provider. New York State Barbara Teter, MPH, CHES, PhD Director, Research & Development Coordinating Office The Jacobs Neurological Institute New York State Multiple Sclerosis Consortium
Dr. Teter indicated that the New York State Multiple Sclerosis Consortium (NYSMSC) was established in 1994 to develop a durable database of demographic and clinical data to promote MS research and enhance patient care. At that time, they collected over 9,000 patient registrants’ histories with about 20,000 follow-up. The NYSMSC investigators examined 15 active sites that were collecting data. Unfortunately, 3 of the sites were denied academic IRB or HIPAA waiver to participate, so there are 11 participating sites: 3 in Western New York, 3 mid-state, and 5 in metro New York City. The Western and mid-state sites attract urban and rural popualtions, so they hope it is representative. The NYSMSC database was compared with NARCOMS, NMSS, VHA, VBA, and CMS. Because there were six databases, there were 63 possible sets of matching. The CMS and VHA records were not flattened. Of the more than 66,000 flattened records to compare, 88% found matches in queried databases. The NMSS database shows the highest percentage of records without matching in other queried databases (75.9% for single matches, 24% for 0 matches), so the investigators will examine and compare the characteristics of NMSS matched and unmatched NMSS database registrants closer. Overall, there was almost 86% unique matches between these databases. The investigators qualified and quantified each match on a scale from 7 to 1, with 7 being perfect. If 2 of the records matched at 4.5 or over, they were turned into two unique records.

Amyotrophic Lateral Sclerosis and Multiple Sclerosis Surveillance Annual Meeting June 24-25, 2009 Summary Report
35
With respect to match freqencies, for the state consortium there were 335 who had no matches. If the state consortium and VHA are combined, 11 had matches. With NMSS and CMS, there were 15,000 matches. There were 319 unique records that also appeared in all 6 databases. The 804 NYSMSC records are matched in 3 of 5 other databases (NMSS, NARCOMS, and CMS), while 319 records are matched in all 6 databases: (NYSMSC, NMSS, NARCOMS, VHA, VBA, and CMS). Dr. Teter stressed that New York’s CMS matches are Medicare only and not Medicaid, which will bring into some question some of the demographics where they believe they are missing cases. Of 7,909 records the percentage matched in other databases are: 4.24% no matches (n=335), 90.45% NMSS, 21.44% NARCOMS, 16.50% VHA, 5.50% VBA, and 81.67% CMS. For NMSS, of 30,229 records the percentage matched in other databases included the following: No matches 24.12% (n=7,290), NYSMSC: 23.67%, NARCOMS: 6.52%, VHA: 4.89%, VBA: 1.58%, and CMS: 72.10%. Of 1,991 NARCOMS records the percentage in other databases was: 0.40 no matches (n=8), NYSMSC: 85.18%, NMSS: 98.95%, VHA: 44.95%, VBA: 17.48%, and CMS: 97.09%. Of 1,503 VHA records the percentage of record overlap per database was: No matches = 0.33% (n=5), NYSMSC: 86.83%, NMSS: 98.27%, NARCOMS: 59.55%, VBA: 28.21%, and CMS: 97.60%. Of 483 VBA records, the percentage of patient overlap per database was: No matches 0.21%, NYSMSC: 90.06%, NMSS: 98.76%, NARCOMS: 72.05%, VHA: 87.78%, and CMS: 97.93%. Of 24,062 CMS records, the percentage of patient overlap per database was: No matches: 7.68% (n=1,849), NYSMSC: 26.84%, NMSS: 90.58%, NARCOMS: 8.03%, VHA: 6.10%, and VBA: 1.97%. Case characteristics included date of first visit, sex, race, and age. The proportions were compared between the databases. For the frequencies of time of first visit, some of the databases were limited to the years 2001 to 2006. The consortium left those years open assuming that matches would pick up the time range being targeted, although this needs to be further assessed. In terms of race and sex distribution, NARCOMS and NMSS had the highest proportions of African Americans, which was somewhat of a surprise. It comes close to the VHA. This needs to be further assessed because it is a very important population to capture. It is not clear why they are not picking it up here. It may be because they are not including Medicaid. The age distributions are very similar. Those in NMSS do tend to be younger. Looking at the difference in age distribution (%) by decades of NMSS records without matches compared to records with matches, the zero matches were compared to whether a subject had one match or more. NMSS records with no matches tended to be younger (<40). In this case because outliers were suspected to be causing problems in age distribution, the young outliers (<10) were removed because the investigators were not sure what that meant. This will be futher investigated later. As they grow older, the NMSS zero matches are likely to be younger and those with matches are likely to be older. Looking at differences in sex race distribution in the NMSS records, no matches versus one match, significant differences are not observed. However, it is important to be careful with race. Earlier she showed an n of 54 with Hispanics, but if a lot of the frequncy data is output, White people become mixed with Hispanics because of the NYSMSC database entering them as White, including Hispanic. When the algorithm was built, it picked up the word “Hispanic” so that needs to be sorted out. As NARCOMS is moving forward, they are trying to separate race further. In terms of the feasibility of using existing databases to populate a national surveillance registry for MS, of more than 66,000 MS case records, 85.7% were captured by multiple databases. This reveals the ability to provide a “just once count.” Distribution of sex and race were similar,

Amyotrophic Lateral Sclerosis and Multiple Sclerosis Surveillance Annual Meeting June 24-25, 2009 Summary Report
36
while age and race distribution differed. If the surveillance plans move forward, NMSS, NARCOMS, and VHA should continue to be utilized. Utilizing New York State as a pilot suggests that national databases are not fully inclusive. Who is missing must be determined. With regard to on-going collaboration, the quality of generalization to the MS population of MS center state databases should be investigated. A query of VHA should be conducted to identify states that differ significantly from New York State. New York’s feasiblity roadbloack was academic IRBs, so they were working across the state using NMSS care centers that are primarily located in academic institutions. In this project, IRBs were very nervous about the word “surveilalnce,” so it was called a “prevalence project.” The New York investigators would like to examine billing data by disease code in order to pick up people who are in neurology practices and not NMSS care centers, and pharmaceutical disease modifying therapy use. Comments / Questions • Mr. Gibson inquired as to whether New York has active or passive ascertainment and
whether they have mandatory reporting.
• Dr. Teter responded that they have active ascertainment, but they do not have mandatory reporting.
• Dr. Nerenz inquired as to the original source of the data on race / ethnicity in these various
sources.
• Dr. Teter responded that their data comes from actual visits in the NMSS care centers. Patients complete 10 pages themselves. They often have questions about race / ethnicity. It is very difficult because the investigators are trying to ascertain between race and ethnicity. Most people have trouble with the ethnicity question, although they are more certain about race. Neurologists complete 10 more pages of clinical data, at which time they verify race / ethnicity. They do have other studies in African American populations.
• Ms. Wu requested the definition for “matched” and QOM.
• Dr. Teter replied that the investigators had to work out different algorithms as they were
running the tests on the data. The considered a Social Security Number match a 7 without question. A match of 4 or more was considered to be quality. The complication is that they were comparing one database to another, one database to the third, and then back again. If was more than 4.5 it was kept as more than one record. If it was 4 or less, than it remained just one record. If a record is matched on a 1 or 2, it will indicate the level of the match between those two databases assessed. If there was a record match in 5 different databases, if one of them was 4 or over, it was kept as a unique record. If two of them on one line were matched in two different databases and it was 4.5 or more, it was retained as two separate records.
• Dr. Kaye asked whether a match score of 1 or 2 went into 0 matches.
• Dr. Teter responded that it did not know.
• Dr. Kasarskis requested clarification about the length of the data forms completed by the
patient and neurologist. If the neurologist’s form was, indeed, 10 pages he wondered what the neurologist’s cash flow must be to get a neurologist to complete a 10-page dataset for some other entity’s research purposes.

Amyotrophic Lateral Sclerosis and Multiple Sclerosis Surveillance Annual Meeting June 24-25, 2009 Summary Report
37
• Dr. Teter responded that the form is 10 pages for the patient and another 10 pages for the
neurologist. In terms of getting the neurologists to complete the dataset, the investigators built upon the database they had and then had to go back to each center to try to ascertain what additional information would be needed for this project. Their contribution to the consortium is that they founded this together in 1996 and they do it out of generosity to contribute to the database.
• Ms. Kennedy asked what percentage of patients are seen in the NMSS care centers are
actually in their database.
• Dr. Teter responded that she did not.
Question and Answer Panel MS Pilot Projects • Dr. Kaye asked for those who were on the National MS Society list that were not found,
whether there was any information on their characteristics.
• Dr. Teter replied that the only characteristics they have are sex, age, and race. They did not have provider codes for them. She would like to further examine the subgroup of NYSMSC patients who do not match up to assess more characteristics of who they are.
• Dr. LaRocca noted that the database in general tended to under-represent to some extent
rural, Southern US, younger age groups, and people who have been diagnosed for a shorter period of time.
• Dr. Kaye wondered whether there was a way to sort out the people on the list that are not in
the system, in addition to adding the ones that are there. There should be some people on there.
• Dr. LaRocca replied that there are and that is because miscodes when the database was
entered originally. There is probably about 10%.
• Dr. Teter indicated that they could break that down further by the quality of the match.
• In addition to miscoding, Dr. Muravov asked whether they believed that some family members or friends of MS patients may be on the list as well.
• Dr. LaRocca replied that this was what he meant by miscodes.
• For the National MS Society matching, Dr. Tyry noted that a lot of the dates were just the
month and year, so it was impossible to have a perfect match.

Amyotrophic Lateral Sclerosis and Multiple Sclerosis Surveillance Annual Meeting June 24-25, 2009 Summary Report
38
Oleg Muravov, MD, PhD Medical Epidemiologist Division of Health Studies Agency for Toxic Substances and Disease Registry Dr. Muravov reminded everyone that for the past few years, ATSDR has been working with the four pilot sites and other consultants to develop a standard form that the agency wanted to receive from each of the four ALS pilot sites. During the February 2008 meeting, a form was developed that every ALS pilot sent to ATSDR. This permitted the agency to combine the data because data from all pilot projects was received in the same format. The numbers of individuals identified with an MND ICD-9 code in the national and local datasets were Emory (2,413), South Carolina (2,090), Kaiser (17,924), and Mayo (1,483). The numbers of charts reviewed by site were: Kaiser (2,285), Emory (446), Mayo (547), and South Carolina (1,174). The numbers of individuals identified with an ALS or other MND ICD-9 code in the national and local datasets were: Emory (1,423 ALS; 990 MND) and Kaiser (11,482 ALS; 6,442 MND) found primarily ALS cases, and Mayo (949 ALS; 534 MND) and South Carolina (862 ALS; 1,228 MND) found more other MND cases. The criteria for stratifying individuals based on ICD-9 codes for possible ALS cases included: Only ALS (335.20), any MND code then changes to ALS, multiple different codes including ALS as one of the codes but not the last, and ALS code changes to PLS. For MND cases the criteria included: Only MND not specified (335.2), only PMA (335.21), only PBP (335.22), only PP (335.23), only PLS (335.24), only MND other (335.29), multiple MND codes with none of the codes ALS, and death certificate only. Regarding the number of charts reviewed by site and age, most charts were reviewed by Kaiser and South Carolina and most were of people between the ages of 50 and 80. In terms of the number of charts reviewed by site and race, most of the people seen by all sites were White. Kaiser also had a substantial number of unknowns. With regard to number of charts reviewed by site and sex, most were males with the ratio of male to females being between 1.1 and 1.3. With respect to charts reviewed compared with total possible cases by age, most of the charts reviewed were for people from ages 50 through 70 and older. Regarding charts reviewed compared with total possible cases by race, whites were predominant and there is a substantial number of unknowns. By sex, again most charts were those of male cases. With regard to charts reviewed for all individuals identified by ALS code and other MND codes by site, most cases seen by Kaiser and South Carolina were of MNDs, while Emory and Mayo reviewed primarily ALS cases. To build algorithms that identify true cases of ALS from national administrative datasets using medical records review as the gold standard, the following methods were used: combine records from all sites for those individuals whose medical records were reviewed; classify individuals as ALS, not ALS, or ALS status unknown based on the medical records review; identify characteristics of true cases to place in the algorithm model; and build an algorithm that maximizes sensitivity and specificity. The following tables reflect the number of sources including specific individual by confirmation of ALS diagnosis using El Escorial criteria, and the number of sources including specific individual by confirmation of ALS diagnosis using El Escorial criteria and neurologist review:
Combined Data Analysis Preliminary Findings

Amyotrophic Lateral Sclerosis and Multiple Sclerosis Surveillance Annual Meeting June 24-25, 2009 Summary Report
39
Number of Sources Including Specific Individual by Confirmation of ALS Diagnosis
Using El Escorial Criteria
ALS Not ALS Unknown
One Source 784 33.9% 1,482 64.0% 49 2.1%
Two Sources 638 46.7% 571 41.8% 156 11.4%
Three Sources 243 56.1% 93 21.5% 97 22.4%
Four Sources 55 35.3% 27 17.3% 74 47.4%
≥ Five Sources 25 21.7% 11 9.6% 79 68.7%
Number of Sources Including Specific Individual byConfirmation of ALS Diagnosis Using
El Escorial Criteria and Neurologist Review
ALS Not ALS Unknown
One Source 810 34.0% 1,541 64.6% 33 1.4%
Two Sources 659 48.4% 571 41.9% 132 9.7%
Three Sources 276 64.8% 92 21.6% 58 13.6%
Four Sources 108 66.7% 21 13.0% 33 20.4%
≥ Five Sources 81 68.6% 12 10.2% 25 21.2%
In the model using only El Escorial criteria, there was an increase of cases being confirmed as having ALS when the people appeared in either 2 or 3 sources, and then the number declines. Unknown people increases as number of sources increases. In the model using el Escorial and neurologist review, there is a steady increase in number of people confirmed as ALS cases as the number of sources they appear in increases. There are substantially fewer cases of unknowns. Terminology was defined as follows: Sensitivity is the probability of an ALS case being identified by the algorithm among true
cases of ALS. Specificity is the probability of a non-ALS case being identified by the algorithm among true
non-ALS cases. Positive predictive value is the probability of true ALS cases being identified as having
ALS by the algorithm.
Negative predictive value is the probability of true non-ALS cases being identified as not having ALS by the algorithm.
True cases of ALS are those individuals identified with an ICD-9 code of 335.2-335.29 and confirmed as having ALS based on neurologist review of medical records.
Four algorithms were used. In the Algorithm Development for Identifying True ALS Patients #1, for ALS the criteria were: ALS in more than one year from any source and death certificate or Rilutek; ALS in 2 or more years and a neurologist visit from any source, or ALS in 3 or more years from any source. For Not ALS the criteria were: No ALS visit and no prescription for Rilutek, ALS in 1 year and no neurologist visit, and age < 18 years. Sensitivity = 0.48; Specificity = 0.95; PPV = 0.85; and NPV = 0.77. In Algorithm Development for Identifying True ALS Patients #2, the ALS criteria were: ALS in more than one year in any source and death certificate or Rilutek, ALS in 2 or more years and a neurologist visit in any source, ALS in 3 or more years in any source, and MND in 1 or more years and 1 ALS visit following MND year and a neurologist visit in any source. Not ALS criteria were: No ALS visit and no prescription for Rilutek, ALS in 1 year and no neurologist visit, age < 18 years. Sensitivity = 0.68, Specificity = 0.89, PPV = 0.83, and NPV = 0.77. For Algorithm Development for Identifying True ALS Patients #3, the ALS criteria included: ALS in more than one year in the same source and death certificate or Rilutek, ALS in 2 or more years and neurologist visit in the same source, age ≤ 65, ALS in Medicare and a neurologist

Amyotrophic Lateral Sclerosis and Multiple Sclerosis Surveillance Annual Meeting June 24-25, 2009 Summary Report
40
visit. Not ALS criteria included: No ALS visit and no prescription for Rilutek, ALS in 1 year and no neurologist visit, and age < 18 years. Sensitivity = 0.66, Specificity = 0.91, PPV = 0.84, NPV = 0.79. For Algorithm Development for Identifying True ALS Patients #4, the criteria for ALS were: ALS in more than one year in the same source and death certificate or Rilutek, ALS in 2 or more years and neurologist visit in the same source, Age < 65, ALS in Medicare and a neurologist visit, and ALS in one or more years and a neurologist visit in the same source with ALS in another source. Not ALS criteria included: Sensitivity = 0.72, Specificity = 0.88, PPV = 0.82, and NPV = 0.81. The following diagram illustrates two potential models of draft criteria to establish the national ALS registry:
Criteria 1:Database
Identification
Criteria 2:Self-
registration
* Medicare, Medicaid, VHA, VBA
Draft Criteria for Determining the Feasibility of a National ALS Registry
National administrative
Databases*
ICD-9-CM code335.2 – 335.29
Apply algorithms/clinical case verification
Not ALS patient Possible ALS patient
True ALS patient
Exclude non-ALS patient
Evaluate case as more data
becomes available
ALS Registry
Excludenon-ALS patient
WebPortal
Potential ALSregistrant
Did not Pass Validation Questions
Passes Validation Questions
Exclude non-ALS patient
If requested. Administrator talks to potential case and obtains additional clinical information
True ALS patient
True ALS patient
The first criterion would be based entirely on database identification from national administrative databases (e.g., Medicare, Medicaid, VHA, and VBA), while the second criterion would include self-registration. Participants would answer a series of 6 validated questions that were found to be highly sensitive for finding true ALS patients (93%). Moving to MS, even though there are two wonderful pilot projects for the MS registry, data have only been received on all cases, not just those matched with local MS datasets. Therefore, no models of sensitivity or specificity could be offered at this point. In terms of the number of national MS records matched in local MS databases by age, NMSS provided the most cases. Most people who matched ranged in age from 40 to 70. With regard to number of national MS records matched in local MS databases by sex, most cases that were matched in NMSS and CMS databases were females. Not surprisingly, most VHA and VBA cases were males. Comments / Questions • Dr. Benatar’s sense from the individual reports of the pilot projects was that there is
tremendous heterogeneity or variability in the results being reported. He wondered whether it was right to be crude in the data without considering that variability. The common estimates actually seemed to reflect none of what they had actually seen in the individual projects. He also wondered how much of a problem that would be.
Amyotrophic Lateral Sclerosis and Multiple Sclerosis Surveillance Annual Meeting June 24-25, 2009 Summary Report
41
• Dr. Muravov responded that this had a great deal to do with the limitations of only two MS pilots, and that only one of those sent an entire package including those who did match and those who did not.
• Dr. Benatar clarified that he was speaking about ALS. His sense was that there was tremendous variability in the results of the ALS pilot projects reported. Like any meta-analysis, if the variability was not considered, it was not clear whether the right message was being sent.
• Dr. Kaye replied that part of this was related to the difference in the demographics between
the pilot sites. For another project she once looked at where people retire from the Military, and Minnesota was not high on the list. The fact that Minnesota did not achieve a lot of matching in the VA data was not a surprise. The idea initially was that these groups represent different populations on purpose such that they would expect variability, but when pooling them they would be more representative of the entire US.
• Dr. Benatar expressed concern that it was not solely a demographic issue. There are
fundamental methodological issues in the way the different pilot projects have approached this, and those differences may also account for some of the variability. For example, verifying a case based on a review of records and the clinical content of those records versus looking at existing electronic data without actually going to the text of the review to get the gestalt of what the neurologist felt in seeing that patient. There was tremendous variability in rates of verification or agreement that an ICD-9 identified case really was a case. He thought this was related more the methodology than to demographics.
• Dr. Muravov responded that they included pilots with totally different methodological
approaches, so variability was expected in confirmed cases. Another issue is related to the very few cases compared to the entire number of cases verified by neurologists. Literally 10% to 15% of cases have been verified by neurologists.
• Dr. Williamson responded that whereas meta-analysis is a very formal statistical analysis
that is an analysis of the results of various studies, what ATSDR is trying to do here is more descriptive. No inferences are being made. Instead, they are trying to describe the populations and the percentages / rates from an epidemiological standpoint just to get a handle on them. The goal is not to submit a formal paper to a peer-reviewed journal that would make inferences based on combined estimates from different populations, with different methodologies, with different factors that have to be considered.
• Dr. Benatar clarified that his concern was not the summaries of each of the pilots. His sense
was that from Emory they could say that across the board, the PPV of being identified as having ALS based on the ICD code is 83%. However, that would be very different for South Carolina and quite a bit lower. That really matters because going back to the algorithm, which states that with identified ALS someone will be placed in the registry without further verification, but the PPV is only 50%, that is not a good place to start.
• Dr. Williamson replied that the point about the various different datasets, data sources, and
analyses was to examine the different variables, determine whether there are some consistencies and / or blatant differences among the datasets, and then attempt to come up with a set of algorithms. He did not believe they would find a single algorithm that would do the job in every type of dataset.

Amyotrophic Lateral Sclerosis and Multiple Sclerosis Surveillance Annual Meeting June 24-25, 2009 Summary Report
42
• Dr. Traynor indicated that they did the same thing in Europe. The Iris, Scottish, Manchester, and various Italian registries all sprang up independently with no coordination between them. Yet, when they reported the results the incidence was remarkably uniform. The similarities between the databases was that they used a prospective design and as many sources of data as they possibly could. They did not limit the results. They slaved themselves to the El Escorial criteria. Once cases were found, someone directly followed up with the patient and / or physician.
• Dr. Kaye pointed out that in a country where there are 50 million uninsured people,
physicians are not going to collect / report anything they do not have to.
• Dr. Traynor pointed out that 7 neurologists acquired all they needed in Ireland.
• Dr. Muravov pointed out that Italy and Great Britain have free access to medical care.
• Dr. Williamson stressed that the point was to gain from the insight each pilot project had brought to the table so that collectively they could think together about how to best move forward. He recognized that there would be different circumstances for Ireland, Italy, Great Britain, and the US. That is fine because it offers additional insight. They have seen exactly what they expected to see in the sense that very diverse pilot sites, data sources, and providers were selected for this project. This will make them think through how to design and strengthen the system such that it answers the questions. He did not see any discrepancies. Instead he heard that there are differences and those needed to be taken into consideration.
• Mr. Gibson thought that a missing component on the national database side was active
ascertainment, as in Massachusetts where there is mandatory reporting and people are actually going out in the field to collect information. That would offer another piece of the puzzle to compare and contrast.
• Dr. Williamson agreed. It was not clear to him whether people had gotten the full sense of
information discussed regarding some of the additional efforts ATSDR would like to make, such as attempting to develop some building blocks in the states to have state registry information. ATSDR is talking with Massachusetts to gain their insight and is at the same time prepared to make grants to various states in order to gain insight into how they develop state registries. The intent is to combine that with what has been learned from the four pilot projects such that ATSDR will be better informed and better able to make decisions in order to meet the needs of the people who have ALS.
• Dr. Muravov added that ATSDR allocated funding to some states to develop statewide ALS
surveillance and registries. That was going to be the gold standard because states will be looking at real-time data from multiple offices that will allow comparison to national databases and find everyone who is missing.
• Dr. LaRocca requested that Dr. Muravov elaborate on these plans.
• Dr. Muravov indicated that some funding was provided to the Council of State and Territorial
Epidemiologists (CSTE) to determine whether states have a surveillance system that includes neurological conditions, and whether / which states are interested in conducting ALS surveillance and developing statewide registries.

Amyotrophic Lateral Sclerosis and Multiple Sclerosis Surveillance Annual Meeting June 24-25, 2009 Summary Report
43
At this time, the larger group divided into breakout sessions to deliberate the following: Group A: Additional Data Analysis Group B: Algorithm for Identifying Cases June 25, 2009
Group A: Additional Data Analysis Wendy E. Kaye, PhD Senior Epidemiologist McKing Consulting Corporation Dr. Kaye reported on the suggestions of the Additional Data Analyses group. For ALS Additional Purposes for a National ALS Registry: Two other issues that should be thought about include: Identification of atypical MNDs and toxic exposures; not having this information misses an
opportunity. Contact with individuals to collect additional information and invite them to participant in
clinical trials or other types of research (this is a long-term goal).
National ALS Registry Strategies: Move from “pie in the sky” to something more rigorous.
Every case should be reviewed by a neurologist
Interview every potential case or have a chart review; review only those about which there
are questions
A large number could be partitioned as Definite with ALS and No ALS and only review those that are indeterminate from existing data
Reports, Discussion, and Final Recommendations from Breakout Session
Breakout Sessions

Amyotrophic Lateral Sclerosis and Multiple Sclerosis Surveillance Annual Meeting June 24-25, 2009 Summary Report
44
Evaluation of PPV by Individual Pilot Sites According to Hierarchical Criteria: Raw neurological data for El Escorial criteria, including other MND to be evaluated by a
neurologist
ALS diagnosis and seen by a neurologist in a record OR evidence of disease progression via chart review
Any ALS diagnosis in any chart regardless of the record or provider OR riluzole Additional Analyses with Existing Data: Over the time period of the study, determine whether the number of people who are less
than 65 years of age has increased. The rule change kicked in around 2002. This information would be beneficial for the future.
Analyze the procedure codes for use of occupational therapy, physical therapy, riluzole use; consider the procedure and the frequency of use.
Analyze the characteristics of those in CMS databases versus those who are in the local
databases to determine what the difference is.
Analyze the characteristics of the locals who were not found in the CMS database to determine what kinds of populations are missing from the two groups.
Eventually, there will be CMS data for anybody who ever had an ALS code, including all of
their encounters whether the ALS code showed up or not. Analyze this information to determine what types of procedures / encounters people are having that do not include the ALS code to find out whether this is at all enlightening for who may or may not be missing.
Analyze whether ALS diagnosis in the same encounter with a neurologist is more predictive
than just saying they have an ALS diagnosis and they were seen by a neurologist—try to link those two to determine whether they were in the same encounter.
Identify codes / diagnoses in records with MNDs that predict NOT ALS. They have seen
some data from the various partners in which progressive muscular atrophy is sometimes used as a descriptor for Parkinson’s disease or stroke. Is there some way that this information can be used to pull out people and put them in the Definitely Not an MND code?
Determine whether ALS being the primary code in the database versus the secondary code
is a better predictor than it just being down the line. Within CMS, some files have 5 and some files have 10 ICD-9 codes. The VA has 5 to 15 codes. Perhaps there is some difference in those who receive the diagnosis as primary versus it being buried down in the bottom.
Determine whether any of the other MND codes have a high predictive value for being
correct. The goal would be to collect all MNDs for the registry if they could be sure that it was what it said it was. Based on the data so far, some of the other categories are not that accurate. One mentioned by South Carolina as being a candidate was 335.24, which is PLS. That seems to be pretty accurate / is not being used incorrectly.

Amyotrophic Lateral Sclerosis and Multiple Sclerosis Surveillance Annual Meeting June 24-25, 2009 Summary Report
45
Potential Additional Variables to Collect for ALS: Military history
Zip codes at birth, age 20, and at diagnosis to look for potential environmental exposures Potential Additional Sources of Data to Identify Cases of ALS: Determine if family history of ALS ICD-9 code modifier is part of administrative records
Determine if lab reporting of SOD-1 gene is feasible; it is analyzed by only one lab in the
US, so perhaps positive results could be acquired from this laboratory
Approach the Social Security Administration (SSA) to capture people who are receiving Social Security Disability Insurance for ALS, because once they receive that they become eligible for Medicare without the 2-year wait; perhaps some people receive Social Security Disability Insurance who do not go on to obtain Medicare services
Miscellaneous Comments Regarding ALS:
Decide whether “sensitivity” or “specificity is more important (e.g., is the interest more in
capturing every case or in making sure that every case is an MND); that decision must be made before deciding how to collect the information
Some of the other pilot projects were interested in the CART analysis and were willing to volunteer their data to be tested to determine whether that would work in a referral center in addition to an HMO
The change in VA service-connectedness for ALS not having to be within one year of
discharge from the military will increase the number of cases that will be identified through the VA. VA clinic data is better than provider data for the years under study because clinic was always collected and provider was just beginning to be used
The person only seen once is going to be really difficult to assess because people still
present to the emergency department at the very end who have never had a diagnosis
For MS Additional Analyses with Existing Data: Determine whether the ICD-9 code for MS as the primary diagnosis is more predictive than
secondary coding
Analyze procedures data for use of lumbar puncture, VEP, or MRIs; consider whether use of these and frequencies of use will help to determine whether someone is a case
Analyze MS prevalence by county in New York using CMS data; New York seems to have
pretty good coverage, and perhaps combine that with the data from the New York Registry to determine prevalence by county

Amyotrophic Lateral Sclerosis and Multiple Sclerosis Surveillance Annual Meeting June 24-25, 2009 Summary Report
46
Analyze MS prevalence by county in New York using CMS and NYSMSC data; the National MS Society has a great list of more than 300,000 people, some of whom do not have MS because of miscodes, but there is not enough data in this list to sort them out; therefore, it is necessary to go from CMS back and not the other way around
Analyze MS data in New York by county evaluating disparity index
Miscellaneous Comments
NMSS list does not have enough variables to try to identify those that are not cases
The good thing about a web portal is that it allows for consent for contact, which is a major
plus
HIPAA and IRB review, if necessary, for every data source will increase the difficulty of doing this
Legislative authority making the disease reportable would be desirable but is unlikely—even
if this is done, reportable disease information is not always complete
Does “national” really mean the entire US, or could there be a representative selection of states in which to conduct surveillance, similar to what SEER originally did for cancer?
Comments / Questions With regard to the VA comment made the previous day, Mr. Gibson pointed out that it was not just a sense of a time period. The change is that now all people with ALS who had continuous service for at least 90 days are eligible for benefits. It is not just for one campaign. All people with ALS having served in World War II on are now considered service-connected. That will mean that a major increase in people who have ALS who have never been seen or signed up.
• Dr. Hornbrook pointed out that patients have long careers with these diseases and many concurrent events (e.g., colds, coughs, flu). ALS and MS may be in the background and may be important to the doctor in making decisions about taking care of someone’s pneumonia or flu event, or it may not. Sometimes ALS will show up, disappear, and then reappear depending upon the particular mindset of the attending physician during a specific visit. This really puts a premium on having a long course of data as much as possible on each individual to assess their total history and to ensure that mentions are picked of ALS or MS. That means that the Medicare data is very important. Medicaid is more problematic because a lot of beneficiaries go in and out of Medicaid, especially younger patients. In the case of HMOs or any other insurance set, the long-term members could be found but people will have to be matched across various insurers because they switch around. Subscribers with ALS or MS tend to lose their ability to work and their access to health insurance. A dependent can stay on insurance for years. Missing from what has been examined thus far are the large, national commercial databases as a way of reaching into a huge proportion of the US population.
• Dr. Kasarskis noted that about 10 years ago an analysis of the cost to the patient annually
was conducted. The idea was that as the disease progressed and their ALS functional rating scale score deteriorated, their use of medical services went up in raw dollars. Also

Amyotrophic Lateral Sclerosis and Multiple Sclerosis Surveillance Annual Meeting June 24-25, 2009 Summary Report
47
calculated was lost wages to spouse and patient. If they could find a monetarily increasing use of medical resources, that would be a confirmatory collateral piece of data to substantiate ALS.
• Dr. Brooks indicated that the data to which Dr. Kasarskis was referring were not yet fully
published, although the investigators are currently working on a book.
• Dr. Traynor agreed that longitudinal follow-up to confirm the authenticity of a case was highly important and was key to the success of registries. The other point that needs to be addressed is use of multiple sources of data—not just relying on one geographical area on one source. Perhaps one solution to this is to pull in the various charities and organizations, which will be key to identifying cases. The gist of the conversation over the last two days has been an amalgam of identifying cases through longitudinal follow-up. Europe views separate pieces of the puzzle, using identifying the case as the first step and longitudinal follow-up to confirm as the second step.
• Dr. Kaye responded that once the national registry has begun, each year it will be more like
this because cases will be identified on a yearly, real-time basis.
• Dr. Stickler noted that longitudinal development is really dependent upon use of the code. When they looked at hospitalization, there were a couple of hundred encounters. After the chart was abstracted and ALS identified, it was found that they were admitted to the hospital with no record of ALS anywhere in the encounter. Even when people are followed longitudinal, there is a potential for that code not to be used.
• Dr. Kaye responded that with Medicare, once someone is identified as a person, they create
a finder file and another request can be made from Medicare for every encounter for that individual regardless of the code.
• Mr. Wildman indicated that with Social Security there were two programs: SSDI and
Supplemental Security Income, which will pick up people who for the most part qualify for Medicaid. The use of Massachusetts’ data could be beneficial for ALS.
• Regarding algorithm 4 that Dr. Muravov presented, Ms. Kennedy noted that it talks about having the coding show up for two subsequent years. A concern is that just one year would preclude the person from being in the registry, but then other records could be checked (emergency department, death certificate). Given the rapid progression of ALS sometimes, just because someone showed up only one year does not mean that they did not have ALS.
• Dr. LaRocca pointed out that most of the discussion over the last two days had centered on
case ascertainment and case definition, which focuses more on the incidence and prevalence issues. Another issue of importance is recruitment and informing people about opportunities, which is an outreach issue. Little has been said about the outreach issue, but it is important because all of the issues surrounding case ascertainment and definition are not really as important. In terms of outreach, they have found that as times have changed, they have needed to change the way they do outreach because the population has changed in terms of the way they seek and share information. There has been no discussion about the role of social networking sites in promoting information and recruitment. It is important to think of what they are trying to do in those two contexts. They are attempting to do something that is very rigorous and scientific in terms of incidence and prevalence, and perhaps eventually assessing clusters, but they are also trying to do something that is much

Amyotrophic Lateral Sclerosis and Multiple Sclerosis Surveillance Annual Meeting June 24-25, 2009 Summary Report
48
more related to marketing and outreach that requires different approaches and techniques that many of them are not accustomed to.
• Mr. Gibson expressed confusion over how this was evolving. In talking to his colleagues
from ALSA and MDA, they are just getting this information. Now they need to revisit their research components to assimilate and determine what the next steps are. It was challenging for him to understand what the next steps would be because he felt like they were jumping ahead so fast. There seemed to be pressure to come to consensus about the data presented thus far; however, this seemed premature. In addition, there are challenges on Capitol Hill of discussions underway. His understanding was that there was no consensus expected during this meeting about moving forward. Information needs to be taken back to the respective researchers at each pilot project to acquire their buy-in to move forward.
• Dr. LaRocca requested further information about the web portal.
• Dr. Kaye responded that it will not be possible to capture everybody from the datasets.
Some of the datasets are slow. The best they can hope for is a year lag time for a dataset, received on a yearly basis probably. Thus, they thought that being able to allow people to self-identify, especially with a motivated population, this would be a good way to find cases. There is then the question of validation of whether people who self-identify really have ALS. That is always a question with registries that allow self-registration. The idea was that when someone approached the website, they could make an account (ALS patient, researcher, general public). For those who are ALS patients, there will be a series of validated questions as mentioned earlier. Based on the gray area, 93% valid is pretty good. There will be enough information included to ensure that someone registering is not someone who has already been identified from one of the national datasets. A small amount of information is included in the registry, and all of the other information is in another location but can be linked. There would be markers regarding which dataset someone came from. There are many security issues involved with doing this on the web. This has to be approved by OMB and the Security Officer would have to approve collection of the information via the web.
• Dr. LaRocca inquired as to whether there was a comment deadline on what was published
in the Federal Register and what specifically was being solicited in the comment.
• Dr. Kaye replied that it is a notification that a package will be sent to OMB, explains the purpose, and indicates where to acquire more information.
• Ms. Dunaway indicated that this notice could be sent to everyone. It would be extremely
beneficial for everyone in this group to write in to support this idea. When ATSDR goes back to OMB with the next step, they can indicate how many comments have been received. Any suggestions made about how to proceed can also be included. This makes it more likely that OMB will approve the idea of having this portal. Ultimately, OMB has the authority to deny approval. The more information ATSDR can provide to OMB to substantiate need, the better. The reason this notice was published is because the OMB wants to provide an opportunity for people to have the ability to discuss new data collection that the federal government is going to engage in to ensure that it is not duplicative and to ensure that it is useful.
• Mr. Gibson expressed concern in moving forward because they work with many agencies.
Yet, when something is published they are barely notified, usually by a link that says FYI.

Amyotrophic Lateral Sclerosis and Multiple Sclerosis Surveillance Annual Meeting June 24-25, 2009 Summary Report
49
That is not encouraging, especially when this is very important. Suddenly, it seemed as if a great deal was coming out of the gate at them and there was no coordination, no opportunity to weigh in on important issues. This notice is just for ALS, yet no one at the table even knew about it until it came up in a Q & A session during this meeting. As they moved forward, he did not understand how they could be talking about structure when many components were suddenly being thrown at them “Oh, by the way, FYI.” He stressed the importance of coordinating these efforts, and that all projects are educated on the next steps.
Algorithm for Identifying Cases Oleg Muravov, MD, PhD Medical Epidemiologist Division of Health Studies Agency for Toxic Substances and Disease Registry Dr. Muravov indicated that he had tried to combine all of the comments received the day before into lists: ALS Algorithm Development Develop an algorithm to identify ASL cases and apply it to the rest of the chart-reviewed
data to determine strength; try to use Model #4; even though it is not perfect, it can be the basis for discussion:
Algorithm Development for Identifying True ALS Patients - 4
**In same source
Sensitivity = 0.72 PPV = 0.82
Specificity = 0.88 NPV = 0.81
ALS• ALS in more than one
year** and Death Certificate or Rilutek
• ALS in 2 or more years and Neurologist visit**
• Age < 65, ALS in Medicare and Neurologist Visit
• ALS in one or more years and Neurologist visit** with ALS in another source
Not ALS• No ALS visit and no
RX for Rilutek• ALS in 1 year and no
Neurologist visit• Age < 18 years
Neurologist Review
ALS Not ALS
Alg
orit
hm ALS 1134 438
Not
ALS
257 1826
Examine incremental value added by each rule in the algorithm
Sample overall chart reviewed data to create algorithm and then apply to the rest of chart reviewed data to determine strength
Look at algorithm rules across different databases, combined data from all data sources, and examine each database separately and determine strengths and limitations; think about how to put these together to think about how to improve the algorithm (e.g., Medicare and larger data bases)

Amyotrophic Lateral Sclerosis and Multiple Sclerosis Surveillance Annual Meeting June 24-25, 2009 Summary Report
50
What additional criteria could be used for lower overlap in some of the sites, such as HMORN, since multiple source criteria would not capture many of the ALS cases?
Look at algorithm rules across different databases to determine strength of each rule as
applied to the different sources
Consider adding procedure codes
Examine EMG procedures
As time progresses, Medicare (such as Part D) could prove to be even more beneficial, especially since the waiver has been implemented.
Examine utilization data as part of the algorithm (e.g., number of visits with a neurologist
with ALS code, with not as much focus on data source)
Neurology visit is paramount in determining ALS; additional information such as EMG procedures could improve sensitivity; rely on neurologist review (second opinion important for neurologist agreement)
El Escorial criteria: misses cases that present with Bulbar palsy, et cetera first
Examine those who live longer versus more rapid cases of ALS; longer to diagnose ALS
correlates with longer lifespan
Possibility of using information from registry for further study (e.g., gene-environment factors)
Possibility to identify true ALS cases based on information gathered from national
databases: if individual with VA did not pass screening for ALS, no ability to find out what the individual may have been diagnosed with instead
Address limitations on demographics such as race; race not available with CMS data;
however, CMS data is largest source of ALS-identified cases from pilot studies
Iterative procedures to be able to identify ALS cases as more information becomes available
Cannot access protected data for majority of cases; Massachusetts has mandated reporting, which may bypass the problem of access to data and should be the gold standard; other states may have ALS and / or MS systems underway for which the agency should try to garner funds to help support these efforts
Strengths and weaknesses of cancer registry as related to ALS registry: would need to be a
state law to make mandatory; extensive costs associated with mandatory reporting; information may not be gathered in timely fashion
Use CART analysis on different pilot sites to determine similarities from HMO results; up to 3
or more data sources will be more definite
Amyotrophic Lateral Sclerosis and Multiple Sclerosis Surveillance Annual Meeting June 24-25, 2009 Summary Report
51
Predictive values based on different criteria such as neurologist visit; what should be considered a sufficient PPV to achieve the objectives?
Is there enough data to support the idea that a national ALS registry would be feasible in
some way at this point
Longitudinal data and multiple sources will be important for determining ALS cases
Using the terms ALS, ALS Possible, ALS Case is confusing because there is a code for Possible ALS, so the term “Undetermined” should probably be used until there is sufficient data to put a person in the category of ALS or Not ALS
Progress has been made with ALSA; ALSA data source as an additional criterion; ALSA and
MDA are important sources for obtaining and distributing information
If state registries build systems using real clinical data, those would be very valuable to mesh with national data in terms of finding out how many people are missing and to provide names that are in national data to local registries so that those who are missed by hospitals can be captured
What incentives in the health care arena are in place to diagnose in timely fashion? VA and
Medicare have higher incentives for earlier diagnosis.
Acquire information from the ALS patient population. Is it possible to add explicit consent asking if the patient is willing to share information for research purposes on web-portal at time of registration?
Motivate people to self-register; high rate of participation in ALS patients
Registry is cumulative list of individuals identified. What about linkages or updates to death
certificates to identify deceased individuals within the registry?
Consider linking other data collection systems and data sets, such as those of the Indian Health Service (IHS). Karen Parko, an IHS neurologist, can provide advice from her experience analyzing the IHS national data set and linking this to IHS clinical records for neurological disease (epilepsy) surveillance.
MS Algorithm Development Volunteer reporting to help add better coverage of individuals with MS
Overlap of national databases as part of algorithm development
Strategic placement of state registries around the country to validate other sources
Work on obtaining physician verification as additional source of identifying individuals with
MS
Incentive for individuals may be important in order to increase volunteer reporting

Amyotrophic Lateral Sclerosis and Multiple Sclerosis Surveillance Annual Meeting June 24-25, 2009 Summary Report
52
Comments / Questions • Dr. Hornbrook inquired as to whether the concept of a chart was defined. Their integrated
medical record includes one chart per person that includes inpatient and outpatient care unified in the same place. In fee-for-service, patients may have 10 or more charts in different physicians’ offices. They need to specify whether any chart is sufficient or if it should be some minimum penetration of the number of charts the person has.
• Dr. Sorenson indicated that their electronic record is also combined, so it is easier for them. Billing and the medical record are all in one electronic database.
• Dr. Benatar responded that people often have multiple charts. For their purposes they have looked at the charts available at Emory or the charts available in community neurological practices in which they have gained access. It is by no means all of the medical record data that an individual has, given that they may be seeking care for multiple issues in different places. There has to be some minimum that they should look at.
• Dr. Stickler responded that they used the Trinity Hospital charts, which were pretty
inaccurate in terms of case confirmation.
• Dr. LaRocca noted that one source of data not discussed was commercial sources of data from market research and survey organizations, many of which have disease-specific panel. People on those panels are often not captured other databases or in other ways. Examples include Harris Interactive and IRC. About a third of the people in the Harris panel were not covered by his group’s database.
• Ms. Kennedy pointed out that there are other ALS registries from which they could learn.
They should examine those experiences before moving forward in building a national registry in order to assess the strengths and weaknesses.
• Dr. Kaye indicated that Dr. Bob Miller and Dr. Fred Anderson were both invited to the
meeting. They are involved in two of those registries, but their schedules did not allow them to attend.
• Mr. Wildman agreed about learning from other registries, but he also thought there were
other opportunities in the current environment and efforts that have occurred over the last few years, particularly with the ALS Registry Act and a lot of the activism and enthusiasm that has surrounded that. There are many opportunities to achieve higher participation in the proposed national registry than there have been previous years.
• Mr. Gibson agreed that they should look to other registries as examples, but some of the
challenges those faced no longer exist. Email and on-line registration were not as prevalent as they are currently. In addition, having the government handle the registry versus a registry supported buy one organization or by the pharmaceutical industry will be less biased.
• It was stressed that there was a lot of anticipation about the proposed national registry, and
the way they market and promote this will have a large impact on the level of impact that can be expected.

Amyotrophic Lateral Sclerosis and Multiple Sclerosis Surveillance Annual Meeting June 24-25, 2009 Summary Report
53
• Dr. Kasarskis’s take on this for the last day and a half was that if they simply wanted to enumerate the cases that are in a population with a certain confidence interval, they probably have enough strategy with the algorithms to do that with existing databases. ATSDR could thank everyone for attending the meeting and then merely develop the registry with the CMS data and all of the other information they have. Beginning the next day they would know how many cases are in the population in certain areas, with certain confidence intervals, and these could be tracked. However, the original introduction to this was that it was to be more than that. It was to be a platform for answering questions that patients, families, the research community, et cetera have about environmental exposure. Now they were talking about lifelong exposures, workplace exposures, and other potential factors that will require interaction with patients in a longitudinal manner. Consideration must be given to how to achieve that goal in light of protections and so forth. It seems that the patients will have to come forward with self-registration in order for ATSDR to achieve that communication with them and acquire information that could be of importance. In his opinion, the only way that this would occur would be to pay attention to how patients are recruited into clinical drug studies. It is pretty much everyone’s experience that if, in this case, the neurologists are personally vested in the concept in a passionate manner, patients understand that. If there are regional consortia where the referral patterns are known and the culture of how patients view their participation can be changed, this could work. However, it will take the practitioners continually communicating to patients that this is an important scientific effort and that if they have this unfortunately disease, this is part of what they should do. Simply telling people that there is a web entry and an 800 number is not sufficient. Every one of these patients has a large task list. One reason they have difficulty getting to an 8:00 am appointment is because they may have to get up at 3:00 am to get ready. One more thing like logging on to a web portal is not going to happen. However, if their practitioner is telling them that this is vitally important for research purposes and support that interaction with dollars, then they can build longitudinal data. ATSDR should make a commitment to support the active collection of data and active interaction with patients, or they will be stuck with existing datasets.
• Mr. Wildman agreed, pointing out that there is not an effective treatment for ALS. The
incentive is that registering will help lead to a treatment. It is very important to market this as a research project. The association has been advertising this as not simply a list of names, but is instead a research engine to drive things forward.
• Mr. Gibson stressed that ALS, unlike MS, has statutory language in the bill that was passed
with $10 million appropriated to work on these ALS projects. There are many differences, which makes it difficult to put ALS and MS all in one room and jump so far ahead. It is disingenuous to talk about a system for MS that has not been created that now Parkinson’s disease advocates are using it to go on the Hill. Now they are getting questions from the Hill about why it cost so much and how the money was used. This cycle is very challenging to deal with.
• Dr. Culpepper pointed out that even without the Congressional mandates, NARCOMS has
been doing exactly what Dr. Kasarskis was just talking about for 15 years successful and has provided valuable information over those years and continues to do so. That is a working model that could be use for ALS, Parkinson’s or any other neurologic disease.
• Dr. LaRocca indicated that although there are six FDA-approved treatments for MS, he did
not think anybody was satisfied with them. Even with treatments available, there is a tremendous interest in the development of new treatments. Even when research is

Amyotrophic Lateral Sclerosis and Multiple Sclerosis Surveillance Annual Meeting June 24-25, 2009 Summary Report
54
successful in developing treatments, patients will still be motivated to participate if they felt that participating is going to lead to further developments and better treatments.
• Mr. Gibson reviewed the notes from the first meeting and one of the differences between the
ALS and MS groups was that there were many avenues for research for MS; however, there are not for ALS. While MS may have a need for research it does not seem as urgent as the needs people with ALS have. That is a major difference in the two, and the level of risk for someone with ALS is different from the level of risk for someone with MS.
• Dr. LaRocca thought part of the reason why MS has asked for a smaller appropriation is
because of the differences in terms of the research opportunities, the research that has already been conducted, the treatments that have already been developed, et cetera.
• With respect to the proposed national registry, Ms. Kennedy pointed out that if this registry
was going to be for more than prevalence and surveillance data, they need to be carefully examining what the core data elements that go into that should be. Once populated, it should be a tool that can be useful in designing clinical trials, informing trials, and contacting people. While this may not be the meeting during which to do that, it will be very important to talk about those elements before any registry is designed and matched. There are international, established core datasets that they should ensure that the proposed dataset would sync with.
• Dr. Muravov said that the US has a very unique healthcare system which is substantially
different from that of Italy, the United Kingdom, and other countries that currently have either national or regional ALS registries. There is a definite benefit to developing ALS registries in at least a few states using ALS clinical data to have a “gold standard” and to increase the completeness and accuracy of the national ALS Registry. Massachusetts currently is the only state which has specific legislation and is developing a state-wide ALS registry. A registry, by definition, is a way to collect data. What is put in that database absolutely depends upon what the purpose is. The first goal would be to try to enroll everybody, or as many people as possible. There are obviously going to be security issues. ATSDR has received numerous requests from state and local epidemiologists and others requesting assessment of possible clusters of ALS. This cannot be done without having access to accurate national ALS prevalence data.
• Dr. Brooks said that just as foundries were the engines of the industrial revolution,
databases and registries are the engines of the information revolution. He thought they should have two goals: 1) considerable data from individual studies in MS and ALS and environmental factors; there is not an ability in real-time to go back to the patients who have these diseases; the only data available to CDC was the statistical mortality data; and 2) clinical trial readiness, which is where the database issues arise. In moving forward, real-time alive patients cannot be identified with the current methodology. The next iteration of this registry, a model / engine for clinical trial readiness, is going to be somewhat more difficult.
• Dr. Williamson agreed with Ms. Kennedy that they must be thinking about the data
elements. They anticipated that in this meeting there would be discussions about algorithms that are used on the current data from the pilot project findings, as well as algorithms and additional data elements that are needed regardless. There is also some time criticality. ATSDR / CDC is under some Congressional authorities to move ahead with the registry. It would be nice to have another meeting and they may be able to do so; however, this cannot

Amyotrophic Lateral Sclerosis and Multiple Sclerosis Surveillance Annual Meeting June 24-25, 2009 Summary Report
55
be guaranteed. Since they were in the room together already, they should take the opportunity to think through what was important to those present, ALS patients, a registry, et cetera. They must address next steps for MS and ALS, and particularly for ALS because they have already received funds and a mandate to develop a national registry. If the time is right to move forward with a national registry, then they need to determine how to do so. If the time is not right, ATSDR needs insight into why it is not and what needs to be done. He agreed that it needed to be made clear that the national registry would be different in that it would feed into clinical and research networks. In order to build such a registry, ATSDR must know which clinical and research networks it needed to fit into. He acknowledged that the marketing aspect was critical.
• Dr. Hornbrook suggested linking to the Social Security Death Index or the National Death
Index in order to have a marker for when individuals die. A possible selling point and function of the registry would be to measure the burden of ALS and MS, which can be done with claims data because the level of care / services to support breathing, feeding, mobility, long-term care, et cetera that are required can be determined. Cost could be added to that to arrive at a resource intensity burden on the country as well as on families. Also important is to work with neurologists in informatics systems in order to get direct transmission of nerve conduction test results.
• Dr. Nelson indicated that about five years ago, she and her colleagues at Stanford
established the ALS Consortium of Epidemiology Studies (ACES), which has close to 100 members. During the first three years, they had funding from the ALS Association. For the last year, they have not had funding. However, they were able to get to the point in which they conducted a series of meetings and had committees that developed standardized modules for the collection of risk factor data (core and extensive data elements) with the types of instruments used in a dedicated epidemiology study in either telephone or in-person interviews. They have the Associated Access Databases Documentation—a toolbox that anyone conducting these studies can use to construct their own instrument from a series of these modules depending upon their research questions. This is currently being used at several places in the US. All of the US investigators who have funding for epidemiology studies of ALS currently are using it. One site in Europe is using it as well. It needs further development, especially in the realm of self-administered data items. Not all of the questions that can be addressed in an in-person or telephone interview can be done in a self-administered or web-based format. This has also been linked with a Parkinson ’s disease consortium that has carried out similar work over this time period. She invited anyone interested in joining the consortium to visit aces.standford.edu. It would be great to receive additional funding so that they could continue to offer comprehensive literature updates every six months on risk factors for ALS, et cetera. She welcomed ideas for how they might keep that effort going. If the proposed national registry is developed, there will be regions of the country with superb case ascertainment in areas where there is HMO coverage as well as all of these other sources. Investigators there who are able to garner NIH funding could use the more elaborate instruments if they chose. Even those who do not have that funding could collect a smaller set of critical data.
• Reflecting on the question raised earlier about where they envisioned being in two year’s
time, Dr. Traynor would like to see the registry used as a way to identify patients and then feeding their DNA samples, if they agree to consent, into the Coriell Repository. The Coriell Repository has been a marvelous vehicle funded by various charities to collect samples. Unlike previous situations, these samples did not sit in a refrigerator. They were actually placed in the Coriell Repository in Camden, New Jersey. The idea is that any ALS
Amyotrophic Lateral Sclerosis and Multiple Sclerosis Surveillance Annual Meeting June 24-25, 2009 Summary Report
56
researcher in the world can acquire access to these samples. That would be a powerful resource for which the registry could be used. Obviously, it would require additional funding because that was not cheap. Approximately 2000 ALS samples and a similar number of controls were collected, which cost several million to do. He envisioned the registry as a Christmas tree on which they would hang various things as time went on.
• It was noted that the Registry Act references that specifically.
• Dr. Kasarskis noted that information about where people are who are interested in ALS from
the standpoint of medical centers can be found in three sources: 1) Ms. Matland, who can provide a map of the ALS Association Centers; 2) Ms. Kennedy, who can provide a map of MDA-supported centers; and 3) the paper that described the Coriell Registry. These are the individuals who are interested in ALS and advancing it. The backbone and network are there. With Coriell, in a very short time, a monumental amount of patient interaction, consent, DNA, and brief data abstraction was done. The patients and faculty were very enthusiastic. He said he was making the pitch because the people knew where the patients were in “their own backyards.” The relationships with referring neurologists were already established, and the interest of a faculty member to lead their regional efforts was there. It is unlikely to be successful to have someone in Pittsburgh directing sample collection in Utah. However, there are relationships and networks all over that can facilitate this. It is similar to web hits.
• Ms. Matland thought the only reason the DNA banking shut down because it filled up so
quickly and there were no funds to do more. It was supposed to be two years, but lasted a year. Lessons learned can certainly be taken from that. The ALS Functional Rating Scale (ALS-FRS) is a data gathering tool that is a standardized approach, and is one that most neurologists already use.
• Dr. Kasarskis indicated that the VA administered the ALS Functional Rating Scale to the
registrants in the VA registry over the phone every six months. The progression of the disease can be tracked this way and can be administered to the patient or the caregiver. This has been validated to track the course of the illness. Remote methods are being developed and validated that would be a potential component of the phenotype that would be in the registry. Collecting DNA, environmental data, and detailed GIS analyses of where people lived during their entire lives would be most beneficial.
• Ms. Kruse wondered if they could engage in a process to list all of the possible data desired,
develop a method to prioritize those based on benefit versus cost, and then at least use that as a starting point in order to move forward. The engineering world calls that a quality functional deployment.
• Dr. Traynor replied that this is exactly what was done in Europe. A two-day meeting was
convened to discuss nothing else but what would go on the form.
• Mr. Gibson added that there is language about beginning networks in the bill that should be utilized as a foundation and then they could move on from there.
• Dr. Stickler wondered if having a physician component in the web portal would raise too
much of an IRB approval issue, and / or whether that was beyond the scope of what this group was doing.

Amyotrophic Lateral Sclerosis and Multiple Sclerosis Surveillance Annual Meeting June 24-25, 2009 Summary Report
57
• Ms. Kennedy replied that this related to what the registry was going to be used for. If it is going to be used for clinical or drug trial design, there needs to be some element of curation in this database. Regardless of what the system is used for, she thought it was very feasible for every exam room in the country to have a computer. A lot of centers already have some type of laptop access in their waiting areas, so while people are waiting to be seen, they can be entering or updating their information. Collection is less an issue currently than contact.
During this session, the group deliberated the draft criteria for determining the feasibility of a national ALS registry: Criterion 1: Database Identification; Criterion 2: Self-Registration. The following major points were made:
Criterion 1: Database Identification Patient identification should be made from national databases
Keep in mind the limitation of various datasets, given that they are the backbone of this plan
Remember that currently the only people who can be contacted are those who self-register
because they will provide consent at the time that they register; additional permission would need to be approved by CMS and the VA for contact
ALSA will make every effort to provide patient lists; these data are not central—each chapter
owns its own information and some chapters have been willing to share while others have not
MDA agreed to share the information for the study period from 2001-2005, but beyond that
there will have to be discussion about moving forward
It is still not clear how useful the CMS data will be for this model, particularly given that CMS will not share data for surveillance purposes—it is only for research purposes; CMS has no mechanism for releasing data under HIPAA permitted but not required public health activities; there is no ability to contact individuals under the current agreement
Make sure that no other important databases / patient sources are overlooked, such as: Major tertiary referral centers for providing care for ALS; as hard a job as this is,
they cannot be ignored; one thing learned from the pilots is that the national databases, as good as they are, do not capture them; If access is gained to tertiary ALS referral centers and their buy-in is obtained, patient recruitment could be done directly through these centers to entice people to sign up for the registration
Outcome databases that are already established between centers (The Hope Foundation, Neal’s)
Recommendations and Next Steps
Amyotrophic Lateral Sclerosis and Multiple Sclerosis Surveillance Annual Meeting June 24-25, 2009 Summary Report
58
Clinical Trials Registry (NIH-supported patients) if they want to ensure that all clinical trials from this point forward include the language that identified information to be fed into the central ALS registry; this is another way of capture-recapture
Trying to acquire HIPAA waivers and consent at every organization will be time-
consuming to contact people directly
Major gaps include Medicare risk contracting (including dual eligible), commercially insured, self-insured, self-paid, health centers for the uninsured
A gold standard is needed for the algorithm
75% was suggested as a cut-off
This was thought to be too high by some, too low by others
The registry is not just ALS, it is MND also, so the disease will act, mimic, and
might evolve; it is better to be inclusive and capture those; once the infrastructure is in place, the various research projects can subset that
If the cut-off is 75%, a lot of people will be excluded
Setting this limit is not what determines who is in the registry; there is potential
case identification, based on algorithms there is PPV that says certain people are definitely in and do not need further chart review; the remaining population must be assessed to determine whether they should be included—that is where the MND, atypical cases, people for whom it is less clear will be identified; this is just the first pass to determine which charts can be triaged because they are in; for the cases being included, they must be more confident for the ones included than a 25% false positive rate
For 75% there would need to be no false positives
90% was thought to be ideal by some; there was 90% ascertainment for the CMS
and VA data with a low false positive rate
80% was thought to be feasible by some panelists, and ATSDR appears to have this now; others objected to 80% as being too low, especially if trying to estimate incidence and prevalence
Europe stuck strictly to the El Escorial criteria and aimed for 100%; they believed
that key to having a good registry is getting as close to 100% as possible; it is quite easy to get to 80%, but the remaining 20% is very costly because a nurse must be paid to go into the field
83% was achieved from merely being in a database with a review by a
neurologist
There is going to be misclassification

Amyotrophic Lateral Sclerosis and Multiple Sclerosis Surveillance Annual Meeting June 24-25, 2009 Summary Report
59
The algorithm dumps people into three categories: people definitely in, people definitely out, and those who need further evaluation
The threshold for setting PPV is within the original search
Many cases are sub-clinical because they are still in the process of being
diagnosed; diagnosis is one of the last things that happens before people die, so they may be picking people up during the last phase of illness
In view of the algorithms discussed already, perhaps this should be presented as
a stratification, taking into consideration what the deliverables are: 75% of the patients can be identified within a year; if looking at a cluster analysis, perhaps only 25% of the cases can be identified within a certain amount of time; using another algorithm will yield 80%; using the gold standard of going to a center to look at a universe, the yield will be closer to 100%
The utility of the registry must be kept in mind; the registry should be useful and
functional Criterion 2: Self-Registration Self-registration comes in with respect to getting at the remainder of cases that are costly to
capture; the web portal was designed to capture people who are being missed in the original search
Some people (primarily younger) will not meet Medicare criteria, which is the age group among which they are hoping to pick up more people through the web portal; it is a multi-pronged approach with database ascertainment and self-registration running concurrently
The way that ATSDR views this web portal, which is already in its testing phase, is that it is
important to ensure that those people who are “falling through the cracks” are found; the agency envisions utilizing ALSA and MDA with their huge / rich constituent databases to promote this system and to direct people to this portal so that they can register; once a person gets to the web portal, they will go through a series of validation questions through which they will be ruled in as potentially having ALS or they will be ruled out
The power of the web-portal strategy is that it allows stakeholders (e.g., individual voluntary
organizations outside of ALSA and MDA) to begin pushing that forward; the combination strategy has to move forward
A patient registered through the portal may not appear for a year in other databases, by
which time a number of ALS patient will have died
Perhaps the language is wrong; self-registration is not picking up people who are missing from database identification; database identification is picking up prevalent cases with some confidence that they really have ALS; in terms of building the registry, it seems that everyone should come through the self-registration portal so that they can be contacted again and something can be done beyond enumeration of who may be in the population

Amyotrophic Lateral Sclerosis and Multiple Sclerosis Surveillance Annual Meeting June 24-25, 2009 Summary Report
60
A strong partnership is encouraged with ALSA and MDA because of their power to influence; another avenue will be through the chapters because not everybody goes through the clinics
Move beyond just service organizations to professional organizations
A busy practitioner may see only one case in their professional career, so marketing at a
lower level may be wasted
The strategy for success with facilitating self-registration is medical centers that have self-selected; overlay the two maps of geographic distribution of ALS Association centers with the MDA-affiliated centers; these are the faculty members that will serve as region team leaders who will drive this because they are enthusiastic and see value in it; they can be aggregated into large units
There is still a high percentage of people who will not be comfortable submitting their personal information on-line
Not everybody has an email address / computer access There are other mechanisms that can be used to help people self-register if they can be
identified; at the World Trade Center people were sent out to houses to help people register Although total content has not been developed for the web portal, it does include the ACES
survey and content can be added
Next Steps / General Comments The registry and the web portal are not standalone efforts; they will be run in conjunction
The DNA banking effort did not happen by accident; a great deal of work was done behind
the scenes in terms of constructing the one-page abstraction form, et cetera; a great deal of buy-in was required among the research community to collect the DNA and some amount of financial support to drive that process
$10 million is a phenomenal amount of money; registries in Europe operate on $15,000 per
year
No one present disagreed with moving forward with the national registry
Decide which states should go forward at this time, with the idea of building on those in the future
A priority would be to select states in which intensive case finding efforts can be
achieved (e.g., those with HMO networks, those in which MDA and ALSA groups are willing to release their lists)
Emory, Mayo, Massachusetts, South Carolina, California should be included Should the states be representative of the country demographically? That adds
another layer of rural, urban, ethnicity, et cetera

Amyotrophic Lateral Sclerosis and Multiple Sclerosis Surveillance Annual Meeting June 24-25, 2009 Summary Report
61
Set up a working group or other body of experts to work on content:
The bill calls for an advisory committee to be established
There are different ways for an advisory committee to be enacted, but this committee
is considered to be an advisory committee to ATSDR in essence by virtue of being convened to work on this; while this can be formalized, it was premature to have a formal advisory committee before determining whether to move forward with a registry
The dataset for the web portal needs to be defined beyond the basic identifier /
demographic information; a working group could be convened for this as well, although issues related to security are not negotiable
Keep the current group informed about progress in real-time; perhaps create a listserv
(Federal Register notices, et cetera)
Don’t forget about race; it is important to determine whether the incidence of ALS is the same across races; that is a scientific issue
Continue to involve the investigators from the pilot projects in order to obtain buy-in
At the conclusion of this session, with no further business posed, Dr. Williamson thanked everyone for their participation and officially adjourned the meeting.

Amyotrophic Lateral Sclerosis and Multiple Sclerosis Surveillance Annual Meeting June 24-25, 2009 Summary Report
62
Melissa Adams, RN, MPH, PhD, FACE Rare Disorders and Outcomes Team RTI International Atlanta, GA Vinicius Antao, MD Agency for Toxic Substances and Disease Registry Atlanta, GA Michael Benatar, MD Neurologist, Emory Department of Neurology Atlanta, GA Donald Betts, MPA Deputy Director Division of Human Development and Disability National Center on Birth Defects and Developmental Disabilities Centers for Disease Control and Prevention Atlanta, GA Benjamin R. Brooks, MD Director, Neuromuscular/ALS-MDA Center Carolinas Medical Center Charlotte, NC Joanna Bulkley, PhD ALS Registry Project Director Kaiser Permanente Center for Health Research Portland, OR Jim Burmester, PhD Senior Research Scientist Marshfield Clinic Research Foundation Marshfield, WI Kimberly Cantor Manager, Federal Government Relations National MS Society Washington, DC
Timothy Copeland Agency for Toxic Substances and Disease Registry Atlanta, GA William Culpepper II, PhD, MA Associate Director, Epidemiology Outcomes MS Center of Excellence Batimore VAMC Baltimore, MD Zahra Daar, MS Geisinger Center for Health Research Geisinger Health System Danville, PA Betsey Dunaway, MS, Ed.S ATSDR Privacy Act Officer NCEH, ATSDR Office of Science Agency for Toxic Substances and Disease Registry Atlanta, GA Stevan Gibson Vice President, Government Relations & Public Affairs Amyotrophic Lateral Sclerosis Association Washington, DC Carolyn Harris Division of Health Studies Agency for Toxic Substances and Disease Registry Atlanta, GA Mark C. Hornbrook, PhD Chief Scientist, The Center for Health Research Northwest/Hawai'i/Southeast Kaiser Permanente Northwest Portland, OR D. Kevin Horton, MSPH Agency for Toxic Substances and Disease Registry Atlanta, GA
Participants
Amyotrophic Lateral Sclerosis and Multiple Sclerosis Surveillance Annual Meeting June 24-25, 2009 Summary Report
63
Edward Kasarskis, MD, PhD Co-Principal Investigator, VA Neurology Service VA ALS Registry Lexington, KY Wendy Kaye, PhD Senior Epidemiologist McKing Consulting Corporation Atlanta, GA Annie Kennedy Vice President - Advocacy Muscular Dystrophy Association Washington, DC Gloria Krahn, PhD, MPH Director Division of Human Development and Disability National Center on Birth Defects and Developmental Disabilities Centers for Disease Control and Prevention Atlanta, GA Rachel Kruse, MS Director, Systems Engineering Joint Attack Munition Systems Nicholas LaRocca, PhD Vice President, Health Care Delivery and Policy Research National Multiple Sclerosis Society New York, NY Jay Mandrekar, PhD Statistician Mayo Clinic Rochester, MN Sharon Matland, RN, MBA Vice President, Patient Services Amyotrophic Lateral Sclerosis Association Calabasas Hills, CA Caroline McDonald Deputy Director, Division of Health Studies Agency for Toxic Substances and Disease Registry Atlanta, GA Oleg Muravov, MD, PhD Agency for Toxic Substances and Disease Registry Atlanta, GA
Lorene Nelson, PhD Associate Profession & Chief Division of Epidemiology Department of Health Research & Policy Stanford University School of Medicine Stanford, CA David Nerenz, PhD Director, Outcomes Research, Neuroscience Institute Henry Ford Hospital Detroit, MI Julie Royer, MSPH Statistician, Office of Research and Statistics South Carolina Budget and Control Board Columbia, SC James Sejvar, MD Centers for Disease Control and Prevention Atlanta, GA Michael Shainline, MS, MBA Director of Research Development Lovelace Clinic Foundation Albuquerque, NM Judy Smith Agency for Toxic Substances and Disease Registry Atlanta, GA Eric Sorenson, MD Neurologist Mayo Clinic Rochester, MN Marchelle Sanchez, MS Statistician McKing Consulting Corporation Atlanta, GA Anne Sowell, PhD Agency for Toxic Substances and Disease Registry Atlanta, GA David Stickler, MD Assistant Professor of Neurology Director, ALS Clinic Medical University of South Carolina Charleston, SC
Amyotrophic Lateral Sclerosis and Multiple Sclerosis Surveillance Annual Meeting June 24-25, 2009 Summary Report
64
Barbara Teter, MPH, PhD Director, Clinical Research and Development Jacobs Neurological Institute NYS Multiple Sclerosis Consortium Buffalo, NY David Thurman, MD, MPH Centers for Disease Control and Prevention Atlanta, GA Bryan J. Traynor, M.D., MRCPI, M.Sc., Neuromuscular Diseases Research Group, Laboratory of Neurogenetics, NIA, National Institutes of Health, Bethesda, MD Deborah Tress, JD Attorney Centers for Disease Control and Prevention Atlanta, GA Tuula Tyry, PhD, MAED Project Manager, NARCOMS Barrow Neurological Institute St. Joseph's Hospital and Medical Center Phoenix, AZ Sharon Usher, RN Research Nurse, Emory Department of Neurology Atlanta, GA Stephen Van Den Eeden, PhD Senior Epidemiologist, Division of Research Kaiser Permanente Northern California Oakland, CA Kevin Ward, PhD Georgia Center for Cancer Statistics Atlanta, GA Patrick Wildman Director, Communications and Public Policy Amyotrophic Lateral Sclerosis Association Washington, DC
G. David Williamson, PhD Director, Division of Health Studies Agency for Toxic Substances and Disease Registry Atlanta, GA Jenny Wu Agency for Toxic Substances and Disease Registry Atlanta, GA Joanne Wuu, ScM Biostatistician and Associate in Neurology Department of Neurology Emory University School of Medicine Atlanta, GA