center for state health policy · 2019-09-23 · a unit of the institute for health, health care...
TRANSCRIPT

Center for State Health Policy
A Unit of the Institute for Health, Health Care Policy and Aging Research
February 2016
Evaluation of the Faith in Prevention Initiative:
Year 1 Report
Manisha Agrawal, M.P.H. Margaret Koller, M.S.


Table of Contents Acknowledgments............................................................................................................................ i
Executive Summary ..........................................................................................................................ii
Introduction .................................................................................................................................... 1
Methods .......................................................................................................................................... 2
Results ............................................................................................................................................. 3
Section 1: Camden Coalition of Healthcare Providers (CCHP) .................................................... 4
Section 2: Greater Newark Healthcare Coalition (GNHC) ......................................................... 16
Section 3: Trenton Health Team (THT) ...................................................................................... 28
Challenges ..................................................................................................................................... 42
Conclusion ..................................................................................................................................... 42
Appendix A: Camden Coalition of Healthcare Providers .............................................................. 43
Appendix B: Greater Newark Healthcare Coalition ...................................................................... 56
Appendix C: Trenton Health Team................................................................................................ 66
Appendix D: Survey Instruments .................................................................................................. 81

i Rutgers Center for State Health Policy, February 2016
Acknowledgments Funding for this project was provided through the New Jersey Department of Health, Division of Family Health Services. We are grateful for the support provided by the members of the evaluation planning team: Uta Steinhauser, Melissa Santorelli, and Nashon Hornsby. A special thanks to the Camden Coalition of Healthcare Providers, Greater Newark Healthcare Coalition, and Trenton Health Team for providing the data. Finally, we thank CSHP colleagues Jennifer Farnham, M.S., for her editorial comments and Bram Poquette, M.L.I.S., for his contributions in formatting this report.

ii Evaluation of the Faith in Prevention Initiative: Year 1 Report
Evaluation of the Faith in Prevention Initiative: Year 1 Report Manisha Agrawal, M.P.H. and Margaret Koller, M.S.
Executive Summary Faithful Families Eating Smart and Moving More (FFESMM) uses a multi-level model that focuses on both individual behavior change and policy and environmental change within the faith community. As part of the Centers for Disease Control and Prevention’s Preventive Health and Health Services Block Grant (PHHSBG) funding, the New Jersey Department of Health (NJDOH) piloted the Faith in Prevention Initiative in three cities: Camden, Newark, and Trenton. The NJDOH provided grants to the Camden Coalition of Healthcare Providers (CCHP), Greater Newark Healthcare Coalition (GNHC), and Trenton Health Team (THT) to expand the role of Faith-Based Organizations (FBOs) in the delivery of preventive health services in these communities. The goal of this initiative was to: 1) encourage the faith community to adopt policy and environmental changes that promote better health; 2) educate the faith community members about health-improving life changes for better health; and 3) build partnerships between health care systems and faith-based organizations to improve health outcomes among congregants. For Year 1, each grantee received an award of $300,000 for hiring dedicated program staff, and buying program materials, conducting trainings of lay leaders, and funding mini-grants to implement evidence-based strategies to effect policy, environmental, and behavioral change within the FBO. The connection between faith and physical health is an important aspect of FFESMM and was part of the key teachings of the participating FBOs. The curriculum is co-taught by health educators and trained lay leaders. The NJDOH contracted with Rutgers Center for State Health Policy (CSHP) to assess the effectiveness of the program in changing individual behavior as well as practices and environments of faith communities. Two survey instruments were used to assess the implementation of the Faith in Prevention Initiative which utilize Faithful Families Eating Smart and Moving More (FFESMM) program: 1) pre/post Faith Community Assessment; and 2) pre/post Faithful Families Member Health and Interest Survey.

iii Rutgers Center for State Health Policy, February 2016
Overall, 26 FBOs in the three cities participated in the program. Among those who participated, 350 participants completed the pre-test, 290 completed the post-test, and 25 participants completed the three month post-test. Impact on FBOs: All faith-based organizations had at least some health and wellness infrastructure in place and many reported developing new partnerships and programs and implementing changes to their nutrition and physical activity environment and policies for better health of their congregants. Participants shared interest in seeing their faith communities serving healthy meals and snacks and providing space as well as opportunities for members to be more physically active. Impact on Participants: This focus on prevention and wellness had a positive impact on the participants. The data indicated better outcomes for most measures (increased knowledge and understanding, change in behavior for healthier eating and physical activity, and an improvement in faith community environment to support healthier lifestyle) in the post-test. Participation in the Faith in Prevention Initiative led to reported improvement in eating smaller portions, increasing consumption of fruits and vegetables, decreasing consumption of sugar sweetened beverages, planning weekly menus, preparing more meals at home, and spending more time doing physical activity. The pre/post differences were statistically significant (p < .05) for seven items in Camden (consumption of sugar-sweetened beverages, choosing healthier options and controlling portions to manage weight, trying to be more physically active, trying additional ways to be physically active such as using stairs or walk or bike to places, and changes in the faith community environment) and three items in Newark (consumption of fruits, planning weekly meals, and choosing healthier options and controlling portions to manage weight) indicating that the program did help participants change their eating and physical activity behavior. However, a pre/post comparison of participant data is not reported for Trenton because the questionnaires used for pre- and post-test were different from each other. The three month post data for Trenton affirm that participants maintained changes in healthy eating and physical activity behavior after three months following program completion. Overall, the surveys show that the Faith in Prevention Initiative had a positive effect on both FBOs and members. The results are pivotal to participating FBOs and participants in Year 2 as it demonstrates that the intervention did help in building a culture of prevention and wellness for both the FBOs and the faith community members.

1 Evaluation of the Faith in Prevention Initiative: Year 1 Report
Evaluation of the Faith in Prevention Initiative: Year 1 Report Manisha Agrawal, M.P.H. and Margaret Koller, M.S.
Introduction Faithful Families Eating Smart and Moving More (FFESMM) is a “practice-tested intervention” that focuses on both individual behavior change and policy and environmental changes within the faith community. The FFESMM program, originally developed in North Carolina (http://www.faithfulfamiliesesmm.org/), is a multi-level programmatic intervention that involves the community in program design and provides opportunities to influence health behaviors at the individual, interpersonal, organizational, and community level. The FFESMM framework serves as a link between the faith community and local resources. It promotes healthy eating habits and increases physical activity through a series of group nutrition and physical activity education sessions. These sessions are designed to encourage the faith community to identify its needs (for supporting health and wellness of members) and adopt policy and environmental changes to meet those needs, and empowers the faith community members to make health-improving choices. These efforts address key factors such as physical inactivity and unhealthy eating that raise the risk of diseases. The lessons are co-taught by nutrition and physical activity educators and trained lay leaders from faith communities in small group sessions. FFESMM can be adapted to any faith tradition. Promoting the connection between faith and health is important to the success of Faithful Families. Health messages from the faith community may have a greater impact on individuals as members may be more open to health messages received from faith community leaders. Families begin to consider how their physical health is connected to the faith they live out daily and help them in becoming advocates for policy and environmental changes that promote healthy eating and physical activity in their organization and in the community at large. In 2014, the New Jersey Department of Health (NJDOH) received Prevention and Public Health Funds under the Preventive Health and Health Services Block Grant (PHHSBG) from the Centers for Disease Control and Prevention (CDC) for implementing community based primary prevention services. The Faith in Prevention Initiative, a pilot project under this grant, focused on: 1) recruiting faith-based organizations to participate in the pilot to implement changes in

2 Rutgers Center for State Health Policy, February 2016
environments and practices to support healthy eating and physical activity; and 2) changing individual behavior by giving them the information they need to Eat Smart and Move More. This is in line with the U.S. Department of Health and Human Services Healthy People 2020 objectives, specifically Educational and Community-Based Programs (ECBP) 10.7, 10.8, and 10.9, which call for an increase in the number of community-based organizations (including local health departments, Tribal health services, nongovernmental organizations, and State agencies) providing population-based primary prevention services in the areas of chronic disease, nutrition, and physical activity. The NJDOH contracted with Rutgers Center for State Health Policy (CSHP) to assess the effectiveness of the program in changing individual behavior as well as practices and environments of faith communities.
Methods The NJDOH provided grants to Camden Coalition of Healthcare Providers (CCHP), Greater Newark Healthcare Coalition (GNHC), and Trenton Health Team (THT) to implement the Faith in Prevention Initiative utilizing the FFESMM curriculum within congregations in Camden, Newark, and Trenton respectively. Year 1 of the program was October 1, 2014–September 30, 2015. The evaluation design is a pre/post design with no comparison group. The existing FFESMM tools (as developed by the North Carolina Department of Health) were modified for the target population by CSHP with input from NJDOH. Two different types of data collection tools were used:
• Pre/post Faith Community Assessment Survey: provides information about the environment, policies, and practices in place to support healthy eating and physical activity in the participating faith community.
• Pre/post Faith in Prevention Member Health and Interest Survey (MHIS): helps determine the impact of the program on participants in making healthy food choices, planning meals, health beliefs, food safety and physical activity. (Note: Trenton Health Team used a different version of MHIS for pre-test and “Participant Survey” from the FFESMM curriculum for post-test. This prevented across-the-board analysis later in the report).
The grantees mailed/emailed the survey data to CSHP for data entry and analysis. All participant data were de-identified, and were analyzed using SPSS. This report includes comparison of frequencies of all survey items for participants completing pre-test (Camden = 131; Newark = 56) and post-test (Camden = 132; Newark = 36). It also includes comparison of frequencies of all survey items for participants completing both pre- and post-test (Camden = 71; Newark = 25). For Trenton (pre-test = 163; post-test = 122), a pre- post comparison of frequencies are not reported due to different versions of the form. A paired t-test of the matched sample was used to determine whether mean differences of all survey items before and after attending the sessions were statistically significant. In addition, two faith-based organizations (FBOs) in Trenton
3 Evaluation of the Faith in Prevention Initiative: Year 1 Report
collected three month post-test data. This report also includes pre- (N=22) and three month post-test (N=25) comparison of frequencies of all survey items from the two FBOs. A human subjects protocol for the study was reviewed and approved by Rutgers University’s Institutional Review Board (IRB).
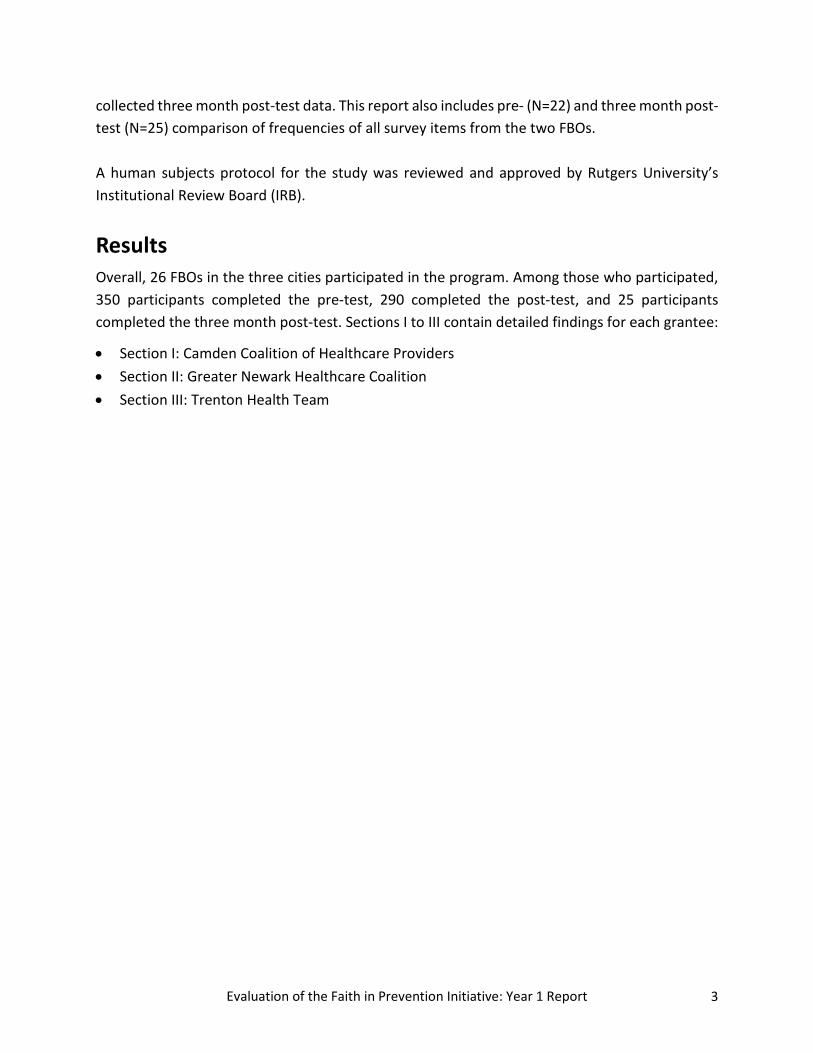
Results Overall, 26 FBOs in the three cities participated in the program. Among those who participated, 350 participants completed the pre-test, 290 completed the post-test, and 25 participants completed the three month post-test. Sections I to III contain detailed findings for each grantee:
• Section I: Camden Coalition of Healthcare Providers • Section II: Greater Newark Healthcare Coalition • Section III: Trenton Health Team
4 Rutgers Center for State Health Policy, February 2016
Section 1: Camden Coalition of Healthcare Providers (CCHP)
Data Collection CCHP submitted the following completed forms to CSHP for analysis. All participant data were de-identified and analyzed using SPSS.
Data Sources • Faith Community Assessment: 9 FBOs completed both pre- and post-test. • Member Health and Interest Survey: 131 participants completed the pre-test and 132
completed the post-test.
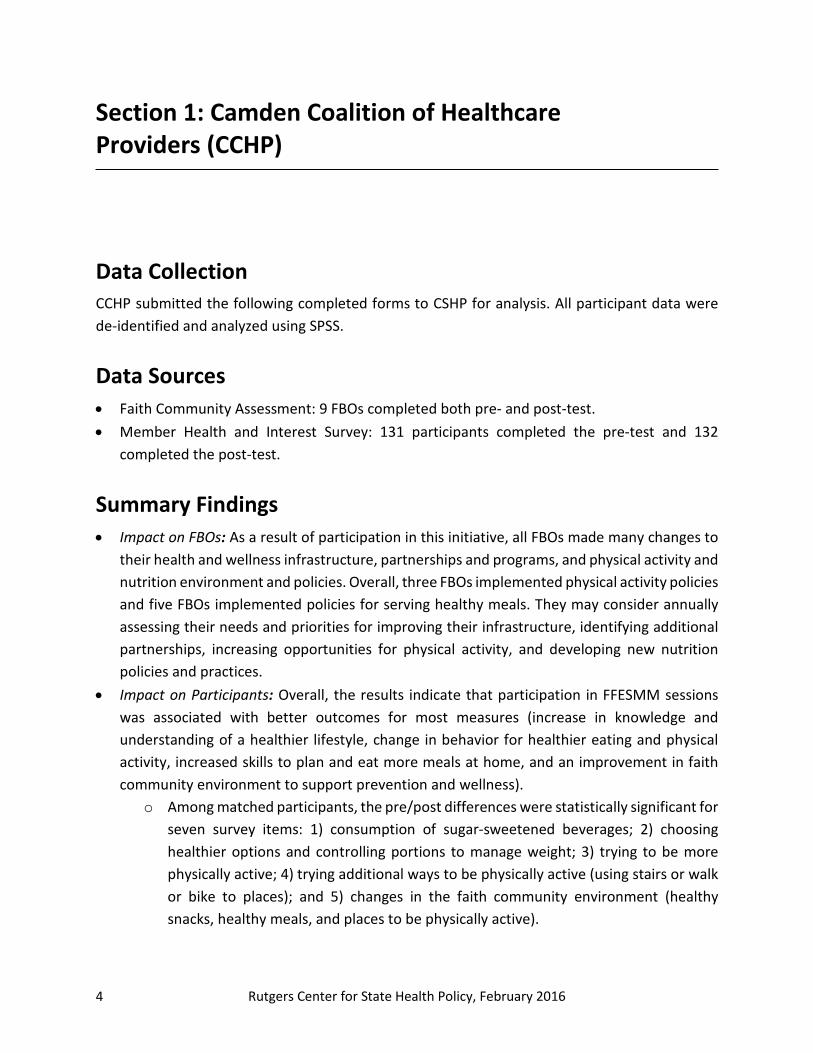
Summary Findings • Impact on FBOs: As a result of participation in this initiative, all FBOs made many changes to
their health and wellness infrastructure, partnerships and programs, and physical activity and nutrition environment and policies. Overall, three FBOs implemented physical activity policies and five FBOs implemented policies for serving healthy meals. They may consider annually assessing their needs and priorities for improving their infrastructure, identifying additional partnerships, increasing opportunities for physical activity, and developing new nutrition policies and practices.
• Impact on Participants: Overall, the results indicate that participation in FFESMM sessions was associated with better outcomes for most measures (increase in knowledge and understanding of a healthier lifestyle, change in behavior for healthier eating and physical activity, increased skills to plan and eat more meals at home, and an improvement in faith community environment to support prevention and wellness).
o Among matched participants, the pre/post differences were statistically significant for seven survey items: 1) consumption of sugar-sweetened beverages; 2) choosing healthier options and controlling portions to manage weight; 3) trying to be more physically active; 4) trying additional ways to be physically active (using stairs or walk or bike to places); and 5) changes in the faith community environment (healthy snacks, healthy meals, and places to be physically active).
5 Evaluation of the Faith in Prevention Initiative: Year 1 Report
Detailed Findings
Faith Community Assessment (Pre/Post-test) Key Findings and Recommendations
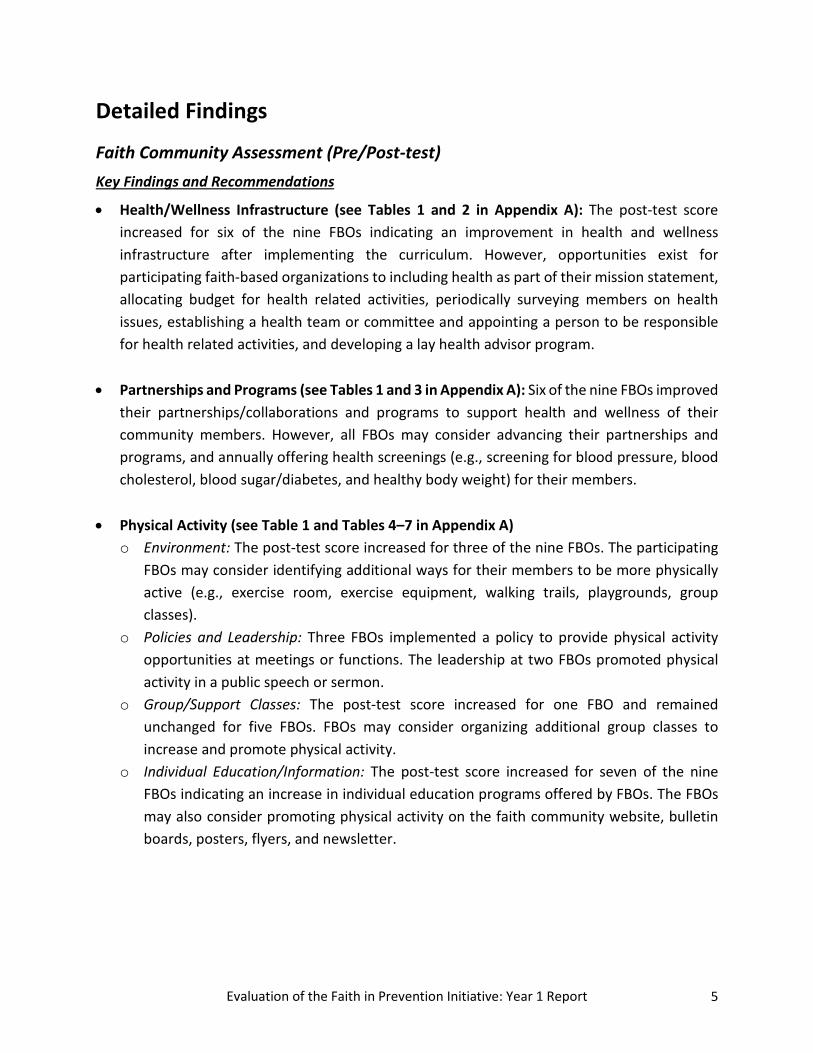
• Health/Wellness Infrastructure (see Tables 1 and 2 in Appendix A): The post-test score increased for six of the nine FBOs indicating an improvement in health and wellness infrastructure after implementing the curriculum. However, opportunities exist for participating faith-based organizations to including health as part of their mission statement, allocating budget for health related activities, periodically surveying members on health issues, establishing a health team or committee and appointing a person to be responsible for health related activities, and developing a lay health advisor program.
• Partnerships and Programs (see Tables 1 and 3 in Appendix A): Six of the nine FBOs improved
their partnerships/collaborations and programs to support health and wellness of their community members. However, all FBOs may consider advancing their partnerships and programs, and annually offering health screenings (e.g., screening for blood pressure, blood cholesterol, blood sugar/diabetes, and healthy body weight) for their members.
• Physical Activity (see Table 1 and Tables 4–7 in Appendix A)
o Environment: The post-test score increased for three of the nine FBOs. The participating FBOs may consider identifying additional ways for their members to be more physically active (e.g., exercise room, exercise equipment, walking trails, playgrounds, group classes).
o Policies and Leadership: Three FBOs implemented a policy to provide physical activity opportunities at meetings or functions. The leadership at two FBOs promoted physical activity in a public speech or sermon.
o Group/Support Classes: The post-test score increased for one FBO and remained unchanged for five FBOs. FBOs may consider organizing additional group classes to increase and promote physical activity.
o Individual Education/Information: The post-test score increased for seven of the nine FBOs indicating an increase in individual education programs offered by FBOs. The FBOs may also consider promoting physical activity on the faith community website, bulletin boards, posters, flyers, and newsletter.

6 Rutgers Center for State Health Policy, February 2016
• Nutrition (see Table 1 and Tables 8–11 in Appendix A) o Environment: The post-test scores remained unchanged for seven of the nine FBOs. The
FBOs may consider improving the nutrition environment by developing a community garden onsite to improve access to fresh fruits and vegetables.
o Policies and Leadership: The post-test score increased for six of the nine FBOs. Five FBOs implemented policies to serve healthier options for faith community meals. The leadership at three FBOs promoted nutrition in a public speech or sermon.
o Group Support/Classes: Six of the nine FBOs showed improvement in their post-test scores indicating an increase in the number of group/support classes for the members.
o Individual Education/Information: The post-test score increased for five of the nine FBOs. All FBOs may consider identifying additional ways to promote and support nutrition and wellness of their members and promote nutrition on the faith community website.
Faith in Prevention Member Health and Interest Survey Demographics (see Tables 12 and 13 in Appendix A) Overall, 131 participants completed the pre-test. Nearly nine out of ten participants (87.4%) were females, about three out of ten (29.1%) completed some college or vocational school, and one-fourth (25.2%) completed high school. About eight out of ten (80.2%) were non-Hispanics, and more than nine out of ten (95.1%) were Black or African-American. For household income, three out of ten (30.5%) reported their income to be between $25,000 and $49,999, one-fourth (25.2%) reported it to be between $10,000 and $24,999, and nearly one-fifth (18.3%) said that it is under $10,000. Almost all participants (96.5%) said that their faith or spirituality is very important/important to their physical health. Change in Knowledge (see Figures 1 and 2 below and Table 14 in Appendix A) Overall, the participants reported an increase in understanding of five out of six survey items: healthy food choices, ways to include more fruits and vegetables in their diet, reading labels before buying food, benefits of physical activity for staying healthy, and interest in receiving health information that they can read, listen to or watch on their own after attending the sessions. Among participants with matched pre- and post-test, the increase was mainly for understanding of healthy food choices (91.7% vs. 94.4%), reading food labels (61.4 vs. 64.3%), and understanding of benefits of physical activity (93.0% vs. 97.1%). A paired t-test for all six items indicated that the differences were not statistically significant (see Table 17 in Appendix A).

7 Evaluation of the Faith in Prevention Initiative: Year 1 Report
93.8 92.2
62.5
79.1
93.8
85.3
96.9 94.6
68.0
77.3
97.7
88.5
0
20
40
60
80
100
Understandhealthy food
Know how toinclude healthy
choices
Read food labels Leave foodoutside for a long
time
Understandbenefits of
physical activity
Interest inreceiving health
information
Perc
ent
Figure 1: All Participants: Change in Knowledge after Attending the Workshop
Pre-test Post-test
91.7 93.0
61.4
80.3
93.087.3
94.4 93.0
64.3
80.0
97.1
88.6
0
20
40
60
80
100
Understandhealthy food
Know how toinclude healthy
choices
Read food labels Leave foodoutside for a
long time
Understandbenefits of
physical activity
Interest inreceiving health
information
Perc
ent
Figure 2: Participants with Matched Pre- and Post-Test: Change in Knowledge after Attending the Workshop
Pre-test Post-test

8 Rutgers Center for State Health Policy, February 2016
Change in Behavior (see Figures 3 and 4 below and Table 15 in Appendix A) Overall, an increased percentage of participants reported eating vegetables on most days (83.1% vs. 86.4%) and participating in physical activities or exercises (68.5% vs. 74.2%) after attending the sessions. Among participants with matched pre- and post-test, a notable increase was seen in participation in physical activities or exercises (71.8% vs. 76.4%) after attending the session. A paired t-test indicated that the pre/post differences were not statistically significant (see Table 17 in Appendix A).
83.1 80.0
68.5
86.479.5
74.2
0
20
40
60
80
100
Eat vegetables most days Eat fruits most days Physical activity in the past month
Perc
ent
Figure 3: All Participants: Change in Eating Vegetables, Fruits, and Physical Activity Level Pre-test Post-test
87.3 85.7
71.8
86.1 87.5
76.4
0
20
40
60
80
100
Eat vegetables most days Eat fruits most days Physical activity in the past month
Perc
ent
Figure 4: Participants with Matched Pre- and Post-Test: Change in Eating Vegetables, Fruits, and Physical Activity Level
Pre-test Post-test

9 Evaluation of the Faith in Prevention Initiative: Year 1 Report
Nutrition (see Table 15 in Appendix A) • Consumption of Sugar Sweetened Beverages (see Figures 5 and 6 below): The percentage of
participants not drinking (21.9% vs. 25.8%) any sweetened beverages increased notably after attending the sessions. For other levels, the percentage decreased for two times per day (30.5% vs. 23.3%) or four or more times per day (11.7% vs. 9.1%).
o Among participants with matched pre- and post-test, the data indicated a similar trend. A paired t-test indicated a statistically significant difference in the consumption of sugar sweetened beverages before (mean=1.8, SD=1.3) and after (mean=1.5, SD=1.3) attending the sessions; t(69)= -2.4, p = 0.02. These results suggest that the sessions helped participants in reducing consumption of sweetened beverages (see Table 17 in Appendix A).
21.928.1 30.5
7.011.7
0.8
25.832.6
23.5
7.6 9.11.5
0
20
40
60
80
100
None One time Two times Three times Four or more times Other
Perc
ent
Figure 5: All Participants: Change in Consumption of Sugar Sweetened BeveragesPre-test Post-test

10 Rutgers Center for State Health Policy, February 2016
• Planning and Preparing Meals (see Figures 7 and 8 below): The percentage of participants
preparing and eating more meals at home (81.4% vs. 89.3%), planning weekly meals (28.7% vs. 39.5%), choosing healthier food options and controlling portion size (47.3% vs. 65.9%) increased markedly after attending the sessions.
o The trend was similar among participants with matched pre- and post-test. A paired t-test indicated that the differences were statistically significant for choosing healthier options and controlling portion size to manage weight (pre-mean=2.1, SD=1.0; post-mean=2.3, SD=0.9; t(69)= 3.0, p = 0.00). These results suggest that the sessions made participants more mindful of what and how much they are eating (see Table 17 in Appendix A).
18.325.4
32.4
7.015.5
22.2
36.1
18.111.1 11.1
0
20
40
60
80
100
None One time Two times Three times Four or more times
Perc
ent
Figure 6: Participants with Matched Pre- and Post-Test: Change in Consumption of Sugar Sweetened Beverages
Pre-test Post-test

11 Evaluation of the Faith in Prevention Initiative: Year 1 Report
Physical Activity (see Table 15 in Appendix A) • Number of Times per Week (see Figures 9 and 10 below): The data illustrate a shift in trend
as an increased percentage of participants reported more frequent participation in physical activity per week.
81.4
28.7
47.3
33.8
89.3
39.5
65.9
31.7
0
20
40
60
80
100
Prepare and eat more mealsat home
Plan weekly meals Choose healthier food andcontrol portions
Dislike healthy foods
Perc
ent
Figure 7: All Participants: Change in Eating Behavior after Attending the Workshop
Pre-test Post-test
85.9
31.0
47.9
33.3
90.1
41.1
62.9
31.9
0
20
40
60
80
100
Prepare and eat moremeals at home
Plan weekly meals Choose healthier foodand control portions
Dislike healthy foods
Perc
ent
Figure 8: Participants with Matched Pre- and Post-Test: Change in Eating Behavior after Attending the Workshop
Pre-test Post-test

12 Rutgers Center for State Health Policy, February 2016
o Among participants with matched pre- and post-test, the percentage increased for two times per week (13.9% vs. 16.7%), and three times per week (16.7% vs. 23.6%) but decreased for four or more times per week (31.9% vs. 29.2%). However, the differences were not statistically significant (see Table 17 in Appendix A).
7.6
16.8 15.3
26.733.6
6.1 6.113.6
23.531.8
18.9
0
20
40
60
80
100
None One time Two times Three times Four or more times Missing/NA
Perc
ent
Figure 9: All Participants: Change in Participation in Physical Activity per Week in the Past Month
Pre-test Post-test
8.313.9 16.7
31.9 29.2
6.9 6.9
16.723.6
29.2
16.7
0
20
40
60
80
100
None One time Two times Three times Four or more times Missing/NA
Perc
ent
Figure 10: Participants with Matched Pre- and Post-Test: Change in Participation in Physical Activity per Week in the Past Month
Pre-test Post-test

13 Evaluation of the Faith in Prevention Initiative: Year 1 Report
• Efforts to Increase Physical Activity Level (see Figures 11 and 12 below): The percentage increased markedly for all three survey items after attending the sessions: participants trying to be more physically active, using stairs instead of elevators or walking or biking instead of driving, and participating in team sports.
o Among participants with matched pre- and post-test, the data indicated a similar trend. A paired t-test indicated that the differences were statistically significant for both trying to be more physically active (pre-mean=2.6, SD=0.8; post-mean=2.8, SD=0.5; t(68)= 3.0, p = 0.00); and using stairs or walking or biking to places (pre-mean=2.3, SD=0.9; post-mean=2.6, SD=0.8; t(70)= 3.7, p = 0.00). These results suggest that the sessions made participants more physically active, and helped them in identifying additional ways to increase their physical activity level (see Table 17 in Appendix A).
78.7
55.0
8.5
92.1
74.2
15.0
0
20
40
60
80
100
Try to be more active Use stairs, or walk or bike to places Participate in team sports
Perc
ent
Figure 11: All Participants: Change in Physical Activity Behavior after Attending the Workshop Pre-test Post-test

14 Rutgers Center for State Health Policy, February 2016
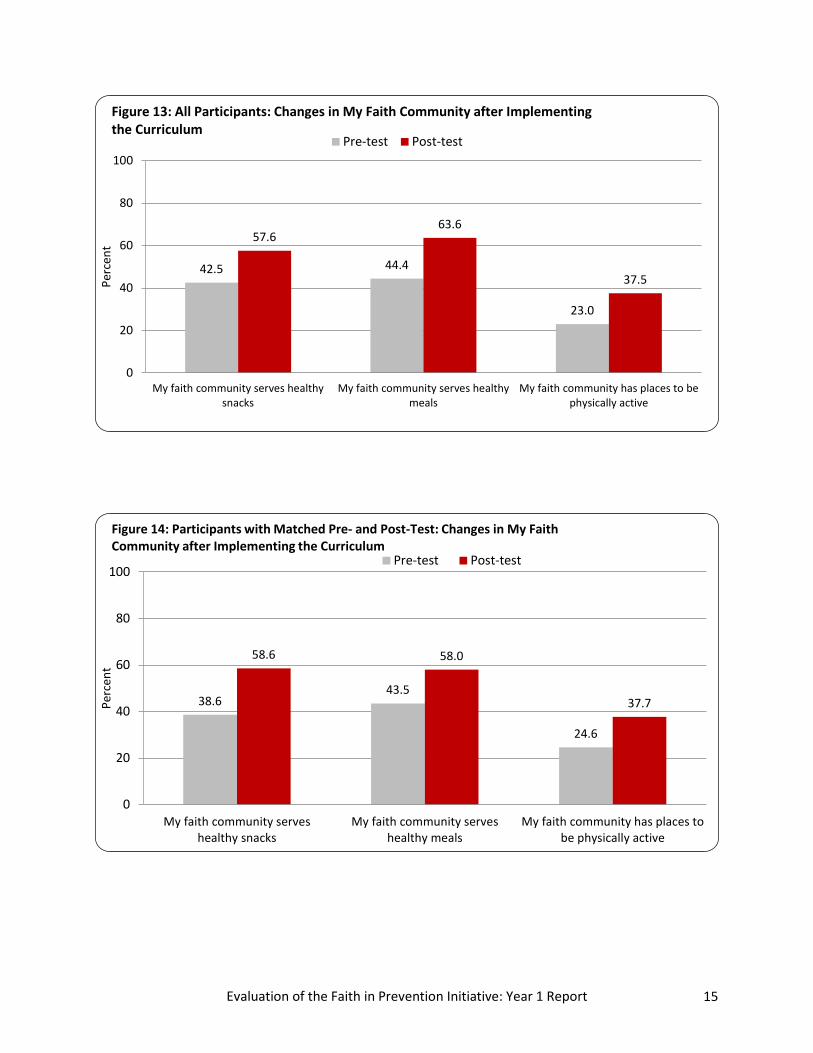
Change in My Faith Community (see Figures 13 and 14 below and Table 16 in Appendix A) As a result of participation in the Faith in Prevention Initiative, an increased percentage of participants reported that their faith community serves healthy snacks (42.5% vs. 57.6%), serves healthy meals (44.4% vs. 63.6%), and has places (e.g., gym, playground, fitness room) available for members to be physically active (23.0% vs. 37.5%). Among participants with matched pre- and post-test, the trend was similar and a paired t-test indicated that the differences were statistically significant for all three items: faith community serves healthy snacks (pre-mean=2.1, SD=0.8; post-mean=2.4, SD=0.8; t(68)= 3.7, p = 0.00); faith community serves healthy meals (pre-mean=2.1, SD=0.9; post-mean=2.4, SD=0.8; t(67)= 2.6, p = 0.01); and faith community has places available for members to be physically active (pre-mean=1.7, SD=0.9; post-mean=1.9, SD=0.9; t(67)= 2.3, p = 0.02). The results indicate that as a result of participation in this grant, the FBOs made changes to their nutrition and physical activity environment and policies to improve health and wellness of their members (see Table 17 in Appendix A).
77.1
64.8
8.5
89.981.7
13.0
0
20
40
60
80
100
Try to be more active Use stairs, or walk or bike to places Participate in team sports
Perc
ent
Figure 12: Participants with Matched Pre- and Post-Test: Change in Physical Activity Behavior after Attending the Workshop
Pre-test Post-test
15 Evaluation of the Faith in Prevention Initiative: Year 1 Report
42.5 44.4
23.0
57.663.6
37.5
0
20
40
60
80
100
My faith community serves healthysnacks
My faith community serves healthymeals
My faith community has places to bephysically active
Perc
ent
Figure 13: All Participants: Changes in My Faith Community after Implementing the Curriculum
Pre-test Post-test
38.643.5
24.6
58.6 58.0
37.7
0
20
40
60
80
100
My faith community serveshealthy snacks
My faith community serveshealthy meals
My faith community has places tobe physically active
Perc
ent
Figure 14: Participants with Matched Pre- and Post-Test: Changes in My Faith Community after Implementing the Curriculum
Pre-test Post-test

16 Rutgers Center for State Health Policy, February 2016
Section 2: Greater Newark Healthcare Coalition (GNHC)
Data Collection GNHC submitted the following completed forms to CSHP for analysis. All participant data were de-identified and analyzed using SPSS.
Data Sources • Faith Community Assessment: 7 FBOs completed the pre-test. • Member Health and Interest Survey: 56 participants completed the pre-test and 36
completed the post-test.
Summary Findings • Impact on FBOs: All faith-based organizations had at least some health and wellness
infrastructure in place. The leadership at almost all FBOs promoted physical activity and nutrition in a public speech/sermon in the past 12 months. Four of the seven FBOs had a policy in place to offer water for faith community meals. Opportunities were identified across all participating faith-based organizations to strengthen partnerships, survey members on health issues, sponsor health screenings, implement policies to support physical activity at meetings, increase opportunities for physical activity, and promote nutrition policies and practices.
• Impact on Participants: Overall, the results indicate that participation in FFESMM sessions was associated with better outcomes for most measures (increase in knowledge and understanding of a healthier lifestyle, change in behavior for healthier eating and physical activity, increased skills to plan and eat more meals at home, and an improvement in faith community environment to support prevention and wellness).
o Among matched participants, the pre/post differences were statistically significant for three survey items: 1) eating fruits on most days; 2) choosing healthier options and controlling portions to manage weight; and 3) planning weekly meals.
17 Evaluation of the Faith in Prevention Initiative: Year 1 Report
Detailed Findings
Faith Community Assessment (Pre/Post-test) Key Findings and Recommendations (see Tables 1 and 2 in Appendix B)
• Health/Wellness Infrastructure: All seven FBOs reported appointing a person for all health related activities, and six of the seven FBOs established a health team or committee for their members. However, opportunities exist across all participating faith-based organizations to allocate a budget for health related activities, periodically survey members on health issues, and develop a lay health advisor program.
• Partnerships and Programs: Six of the seven FBOs developed and/or had existing
partnerships with another health, health promotion, or human services agency. Five of the seven FBOs sponsored blood pressure screenings, and four FBOs sponsored a healthy body weight screening in the past 12 months. All FBOs may consider strengthening their partnerships and programs, and periodically offering/organizing health screenings (e.g., screening for blood pressure, blood cholesterol, blood sugar/diabetes, and healthy body weight) for their members.
• Physical Activity: All seven FBOs reported that the leadership promoted physical activity in a
public speech in the past 12 months. However, all FBOs may consider identifying additional ways for their members to be more physically active (e.g., exercise room, exercise equipment, walking trials, playgrounds, fitness guides, group classes), developing policies for supporting physical activity opportunities at meetings or functions, and promoting physical activity through posted information, bulletins, and on their website.
• Nutrition: Six of the seven FBOs have a kitchen or place to prepare meals for the members,
and their leadership promoted nutrition in a public speech/sermon in the past 12 months. Four of the seven FBOs had a policy in place to offer water for faith community meals, serve healthy foods at food events, offer weight loss support groups, and promote nutrition in bulletin, programs or newsletters. However, all FBOs may consider developing a community garden for their members, offering group classes to teach healthy cooking, organizing weight loss support groups, developing guidelines to offer healthier options for faith community meals, and finding additional ways to promote and support nutrition and wellness of their members.

18 Rutgers Center for State Health Policy, February 2016
Faith in Prevention Member Health and Interest Survey Demographics (Tables 3 and 4 in Appendix B) Overall, 56 participants completed the pre-test. More than nine out of ten participants (94.5%) were females, about three out of ten (29.1%) completed some college or vocational school, and nearly one-fifth (18.2%) completed four years of college. More than two-thirds (69.6%) were non-Hispanics, and 92.7% were Black or African-American. For household income, a little less than one-fourth (23.2%) said that their income is between $50,000 and $74,000, and 21.4% said that it is between $25,000 and $49,999. Almost all participants (98.1%) said that faith or spirituality is very important/important to their physical health. Change in Knowledge (see Figures 1 and 2 below and Table 5 in Appendix B) Overall, participants reported a notable increase in understanding of: healthy food choices (92.9% vs. 100.0%), ways to include more fruits and vegetables in their diet (94.5% vs. 100.0%), how to read labels before buying food (67.9% vs. 71.4%), and benefits of physical activity for staying healthy (94.4% vs. 100.0%) after attending the sessions. However, participants shared a little lesser interest (83.3% vs. 80.0%) in receiving health information that they can read, listen or watch on their own.
92.9 94.5
67.9
78.2
94.4
83.3
100.0 100.0
71.477.1
100.0
80.0
0
20
40
60
80
100
Understandhealthy food
Know how toinclude healthy
choices
Read food labels Understand foodsafety
Understandbenefits of
physical activity
Interest inreceiving health
information
Perc
ent
Figure 1: All Participants: Change in Knowledge after Attending the Workshop
Pre-test Post-test

19 Evaluation of the Faith in Prevention Initiative: Year 1 Report
Among participants with matched pre- and post-test, the data showed a similar trend. However, there was a notable increase in the percentage of participants (84.0% vs. 91.7%) interested in receiving health information that they can read, listen, or watch on their own. A paired t-test for all six items indicated that the differences were not statistically significant (see Table 8 in Appendix B).
Change in Behavior (see Figures 3 and 4 below and Table 6 in Appendix B) Overall, an increased percentage of participants reported eating vegetables (87.5% vs. 94.4%) and fruits (77.4% vs. 85.3%) on most days. However, the percentage of participants participating in physical activities or exercises in the past month decreased (89.1% vs. 80.0%) after attending the sessions. Among participants with matched pre- and post-test, the increase was more noticeable for fruits consumption (68.0% vs. 87.5%). In addition, the percentage of participants participating in physical activities or exercises remained same (92.0% vs. 91.7%) after attending the sessions. A paired t-test indicated a significant difference in the consumption of fruits before (mean=2.4, SD=0.9) and after (mean=2.6, SD=0.7) attending the sessions; t(23) = 2.4, p = 0.03. These results suggest that the sessions did have a positive impact on the fruits consumption behavior of participants (see Table 8 in Appendix B).
96.0 96.0
68.076.0
96.084.0
100.0 100.0
83.375.0
100.091.7
0
20
40
60
80
100
Understandhealthy food
Know how toinclude healthy
choices
Read food labels Leave foodoutside for a
long time
Understandbenefits of
physical activity
Interest inreceiving health
information
Perc
ent
Figure 2: Participants with Matched Pre- and Post-Test: Change in Knowledge after Attending the Workshop
Pre-test Post-test

20 Rutgers Center for State Health Policy, February 2016
Nutrition (see Table 6 in Appendix B) • Consumption of Sugar Sweetened Beverages (see Figures 5 and 6 below): Overall, the
percentage of participants not drinking (29.1% vs. 25.0%) any sweetened beverages decreased after attending the sessions. For other levels, the percentages also decreased for
87.5
77.4
89.194.4
85.380.0
0
20
40
60
80
100
Eat vegetables most days Eat fruits most days Physical activity in the pastmonth
Perc
ent
Figure 3: All Participants: Change in Eating Vegetables, Fruits, and Physical Activity Level
Pre-test Post-test
92.0
68.0
92.0100.0
87.591.7
0
20
40
60
80
100
Eat vegetables most days Eat fruits most days Physical activity in the pastmonth
Perc
ent
Figure 4: Participants with Matched Pre- and Post-Test: Change in Eating Vegetables, Fruits, and Physical Activity Level
Pre-test Post-test

21 Evaluation of the Faith in Prevention Initiative: Year 1 Report
three times a day (10.9% vs. 5.6%) as well as four or more times a day (9.1% vs. 5.6%) but increased notably for once a day (18.2% vs. 30.6%).
o Among participants with matched pre- and post-test, the increase was for both once (16.7% vs. 24.0%) as well as twice (29.2% vs. 40.0%) a day. However, no participant reported drinking sugar sweetened beverages four or more times a day after attending the sessions. A paired t-test indicated that the pre/post differences were not statistically significant.
29.1
18.2
32.7
10.9 9.1
25.030.6 33.3
5.6 5.6
0
20
40
60
80
100
None One time Two times Three times Four or more times
Perc
ent
Figure 5: All Participants: Change in Consumption of Sugar Sweetened BeveragesPre-test Post-test
29.2
16.7
29.2
12.5 12.5
28.024.0
40.0
8.0
0
20
40
60
80
100
None One time Two times Three times Four or more times
Perc
ent
Figure 6: Participants with Matched Pre- and Post-Test: Change in Consumption of Sugar Sweetened Beverages
Pre-test Post-test

22 Rutgers Center for State Health Policy, February 2016
• Planning and Preparing Meals (see Figures 7 and 8 below): Overall, the percentage of participants preparing and eating more meals at home (72.7% vs. 85.3%), planning weekly meals (24.1% vs. 39.4%), choosing healthier food options and controlling portion size (47.3% vs. 65.9%) increased markedly after attending the sessions.
o Among participants with matched pre- and post-test, the data indicated a similar trend and the increase was more prominent for planning weekly meals (16.0% vs. 50.0%) as well as choosing healthier options and controlling portions (68.0% vs. 91.7%). A paired t-test indicated that the differences were statistically significant for both planning weekly meals (pre-mean=1.4, SD=0.8; post-mean=2.0, SD=1.0; t(21)= 3.4, p = 0.00) and choosing healthier options and controlling portions (pre-mean=2.4, SD=0.9; post-mean=2.8, SD=0.6; t(23)= 2.6, p = 0.02). These results suggest that the sessions helped participants in planning their weekly menu and made them more mindful of what and how much they are eating (see Table 8 in Appendix B).
72.7
24.1
60.7
26.4
85.3
39.4
82.4
36.4
0
20
40
60
80
100
Prepare and eat moremeals at home
Plan weekly meals Choose healthier food andcontrol portions
Dislike healthy foods
Perc
ent
Figure 7: All Participants: Change in Eating Behavior after Attending the Workshop
Pre-test Post-test

23 Evaluation of the Faith in Prevention Initiative: Year 1 Report
Physical Activity (see Table 6 in Appendix B) • Number of Times per Week (see Figures 9 and 10 below): The percentage of participants not
participating in any physical activity decreased slightly (5.4% vs. 2.8%) after attending the sessions. For other frequencies, the percentage increased for two times per week (21.4% vs. 25.0%) but decreased for three times per week (23.2% vs. 11.1%).
o Among participants with matched pre- and post-test, the percentage increased for two times per week (20.0% vs. 36.0%), and four or more times per week (24.0% vs. 32.0%) but decreased for three times per week (36.0% vs. 16.0%). However, the differences were not statistically significant.
72.0
16.0
68.0
26.1
87.0
50.0
91.7
27.3
0
20
40
60
80
100
Prepare and eat moremeals at home
Plan weekly meals Choose healthier foodand control portions
Dislike healthy foods
Perc
ent
Figure 8: Participants with Matched Pre- and Post-Test: Change in Eating Behavior after Attending the Workshop
Pre-test Post-test

24 Rutgers Center for State Health Policy, February 2016
5.4 8.9
21.4 23.2
35.7
5.42.88.3
25.0
11.1
36.1
16.7
0
20
40
60
80
100
None One time Two times Three times Four or moretimes
Missing/NA
Perc
ent
Figure 9: All Participants: Change in Participation in Physical Activity per Week in the Past Month
Pre-test Post-test
12.020.0
36.0
24.0
8.012.0
36.0
16.0
32.0
4.0
0
20
40
60
80
100
One time Two times Three times Four or more times Missing/NA
Perc
ent
Figure 10: Participants with Matched Pre- and Post-Test: Change in Participation in Physical Activity per Week in the Past Month
Pre-test Post-test

25 Evaluation of the Faith in Prevention Initiative: Year 1 Report
• Efforts to Increase Physical Activity Level (see Figures 11 and 12 below): Overall, the percentage of participants trying to be more physically active (84.9% vs. 97.1%) increased markedly after attending the sessions. However, there was no change in the percentage of participants trying to increase their physical activity level in specific ways such as using stairs or walking or biking to places (55.6% vs. 54.5%) and participating in team sports (14.8% vs. 14.3%).
o Among participants with matched pre- and post-test, there was a small increase in the percentage trying to be more physically active (95.8%% vs. 100.0%) and decrease in participation in team sports (12.0% vs. 8.3%) after attending the sessions. However, the differences were not statistically significant.
84.9
55.6
14.8
97.1
54.3
14.3
0
20
40
60
80
100
Try to be more active Use stairs, or walk or bike to places Participate in team sports
Perc
ent
Figure 11: All Participants: Change in Physical Activity Behavior after Attending the Workshop
Pre-test Post-test

26 Rutgers Center for State Health Policy, February 2016
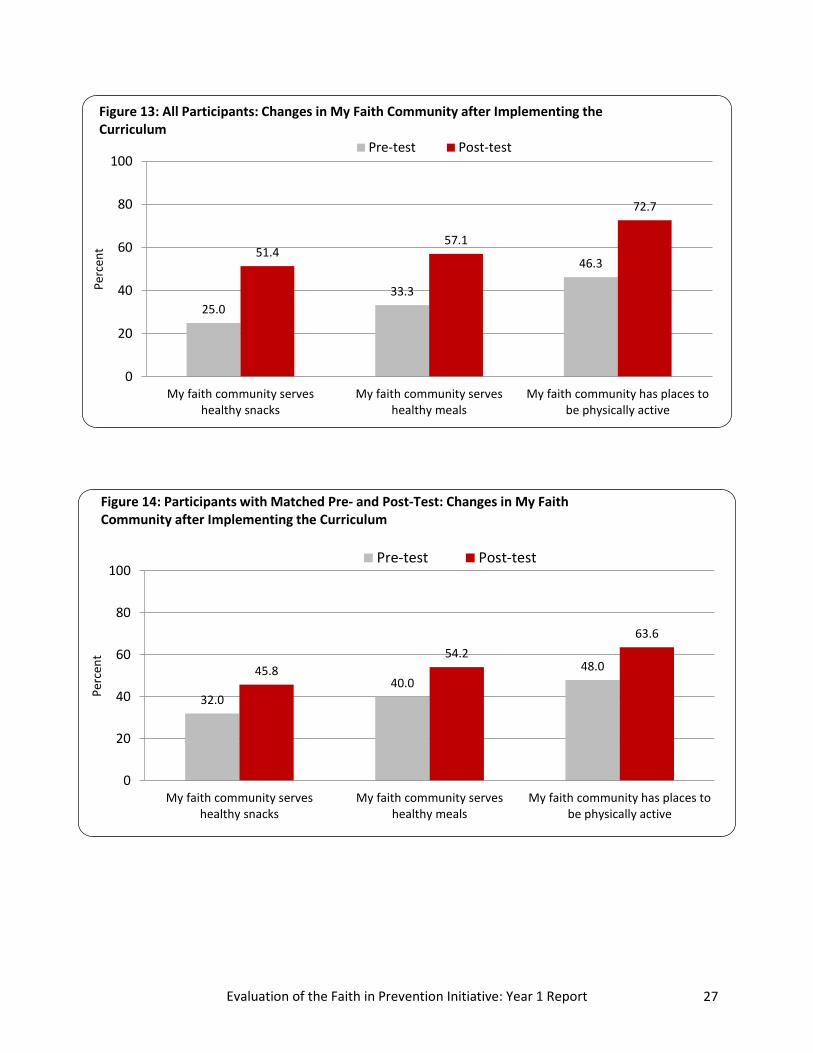
Change in My Faith Community (see Figures 13 and 14 below and Table 7 in Appendix B) As a result of participation in the Faith in Prevention Initiative, an increased percentage of participants reported that their faith community serves healthy snacks (25.0% vs. 51.4%), serves healthy meals (33.3% vs. 57.1%), and has places (e.g., gym, playground, fitness room) available for members to be physically active (46.3% vs. 72.7%).
o Among participants with matched pre- and post-test, the data indicated a similar trend for all three survey items. However, the differences were not statistically significant.
95.8
54.2
12.0
100.0
54.2
8.3
0
20
40
60
80
100
Try to be more active Use stairs, or walk or bike toplaces
Participate in team sports
Perc
ent
Figure 12: Participants with Matched Pre- and Post-Test: Change in Physical Activity Behavior after Attending the Workshop
Pre-test Post-test
27 Evaluation of the Faith in Prevention Initiative: Year 1 Report
32.040.0
48.045.854.2
63.6
0
20
40
60
80
100
My faith community serveshealthy snacks
My faith community serveshealthy meals
My faith community has places tobe physically active
Perc
ent
Figure 14: Participants with Matched Pre- and Post-Test: Changes in My Faith Community after Implementing the Curriculum
Pre-test Post-test
25.033.3
46.351.4
57.1
72.7
0
20
40
60
80
100
My faith community serveshealthy snacks
My faith community serveshealthy meals
My faith community has places tobe physically active
Perc
ent
Figure 13: All Participants: Changes in My Faith Community after Implementing the Curriculum
Pre-test Post-test

28 Rutgers Center for State Health Policy, February 2016
Section 3: Trenton Health Team (THT)
Data Collection THT submitted the following completed forms to CSHP for analysis. All participant data were de-identified, and analyzed using SPSS.
Data Sources • Faith Community Assessment: 10 faith-based organizations (FBOs) completed the pre-test
and 8 FBOs completed the post-test. • Eat Smart, Move More Member Health and Interest Survey: 163 participants completed the
survey. • Participant Survey: 122 participants completed the survey. In addition, 9 completed the
Spanish version of pre-test for post-test. • Three month Post-test: 25 participants from 2 FBOs completed the survey.
Summary Findings • Impact on FBOs: As a result of participation in this initiative, all FBOs made many changes to
their health and wellness infrastructure, partnerships and programs, and physical activity and nutrition environment and policies. Overall, two FBOs implemented physical activity policies and four FBOs implemented policies for serving healthy meals. They may consider completing this tool annually to identify their needs and priorities for improving their infrastructure, identifying additional partnerships, increasing opportunities for physical activity, and developing new nutrition policies and practices.
• Impact on Participants: Overall, the majority of participants shared interest in learning about healthy food choices, portion sizes, benefits of physical activity, and increasing their physical activity level. Participants also shared a strong interest in seeing policy and environmental changes in their faith community (healthy snacks, healthy meals, places to be physically active, and regular classes offered on healthy eating or physical activity).
o The post-test shows that the FFESMM sessions made nearly eight out of ten participants mindful of their diet and getting physical activity every day. More than 60% of participants reported improvement in eating smaller portions, increasing

29 Evaluation of the Faith in Prevention Initiative: Year 1 Report
consumption of fruits and vegetables, drinking fewer calorie containing beverages, preparing more meals at home, and participation in physical activities.
o The three month post-test results support a long-term impact of the program. Participants indicated a continued interest in learning about healthy eating three months after completing the six week FFESMM sessions. Overall, a notable increase in consumption of fruits and vegetables was seen in the three month post-test. A decreased percentage of participants shared interest in seeing healthy meals served for the faith community meals in the three month post-test. However, an increased percentage of participants reported interest in seeing their leaders talk about healthy eating and physical activity in sermons, messages or other talks, and their faith community regularly offering classes on physical activity or healthy eating.
Detailed Findings
Faith Community Assessment (Pre/Post-test) Key Findings and Recommendations
Health/Wellness Infrastructure (see Tables 1 and 2 in Appendix C) The post-test score increased for three of the ten FBOs indicating an improvement in health and wellness infrastructure after implementing the curriculum. However, opportunities exist for participating faith-based organizations to sponsor health fairs for members, establish a health team or committee, and appoint a person to be responsible for health related activities. Physical Activity (see Tables 1, 3 and 4 in Appendix C) • Policies and Environment: The post-test score increased for eight of the ten FBOs. Six FBOs
made changes to their environment for their members to be more physically active (e.g., exercise room, exercise equipment, walking trails, playgrounds, group classes), and two FBOs implemented policies for supporting physical activity opportunities at meetings or functions.
• Programs and Education: The post-test score increased for six of the ten FBOs. This indicates that FBOs may consider organizing additional group classes for increasing and promoting physical activity. They may also consider promoting physical activity through posted information, bulletins, and newsletters.
Nutrition (see Tables 1, 5 and 6 in Appendix C) • Policies and Environment: The post-test scores increased for four FBOs and remained
unchanged for four FBOs. Three FBOs developed a community garden and four FBOs implemented policies to offer healthier options for faith community meals. The FBOs may consider developing a community garden with the help of the members, supporting healthier

30 Rutgers Center for State Health Policy, February 2016
meal preparation, and developing guidelines to offer healthier options for faith community meals.
• Programs and Education: The post-test score increased for seven of the ten FBOs. This indicates that FBOs may consider identifying additional ways such as group/support classes to promote and support nutrition and wellness of their members.
Eat Smart, Move More Member Health and Interest Survey Healthy Eating and Physical Activity Habits (see Figures 1 and 2 below and Table 7 in Appendix C) • A little less than half (46.4%) of participants reported eating two–three cups of vegetables on
most days and nearly six out of ten (58.5%) reported eating one and half–two cups of fruits on most days.
• More than seven out of ten (72.6%) reported not drinking regular soda every day. • More than eight out of ten (83.1%) reported doing 30 or more minutes of moderate or
vigorous physical activity in addition to their normal routine on most days.
24.2
58.5
46.4
72.6
33.3
38.4
3.2
8.1
15.2
0 20 40 60 80 100
Drink regular (not diet) sodaevery day
Eat 1.5-2 cups of fruits on mostdays
Eat 2-3 cups of vegetables onmost days
Percent
Figure 1: Eat Smart, Move More Member Health and Interest Survey: Healthy Eating Habits
Yes No Not sure

31 Evaluation of the Faith in Prevention Initiative: Year 1 Report
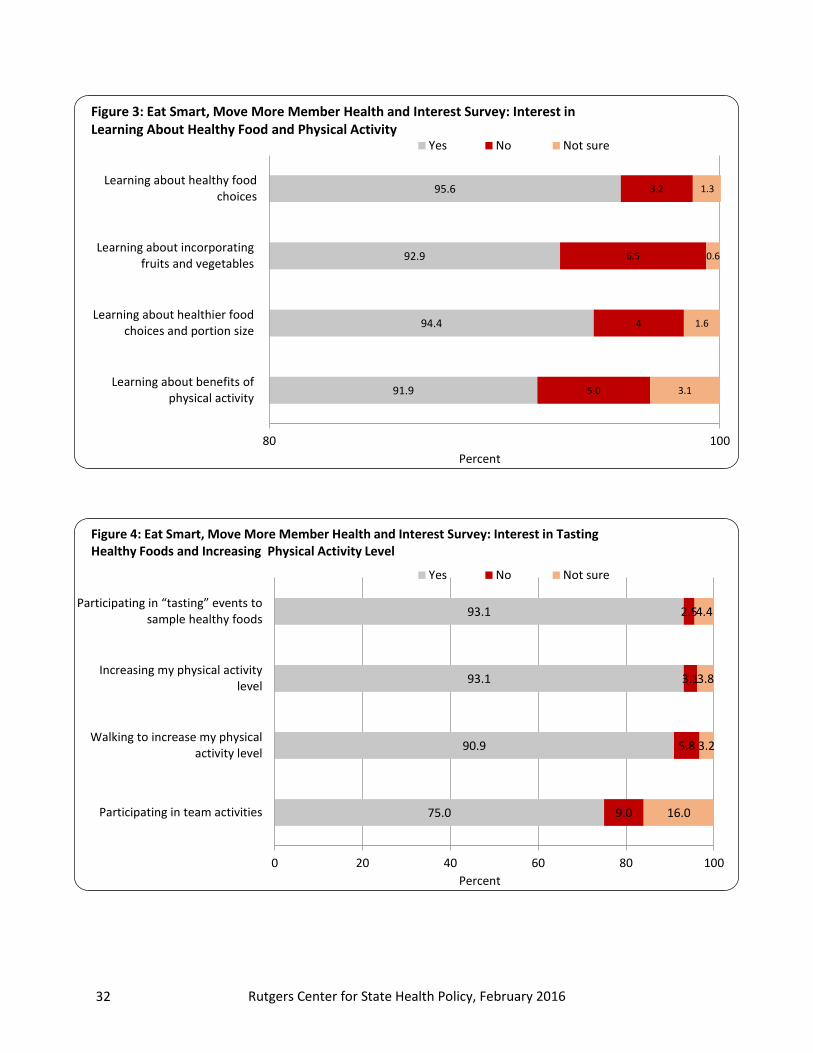
Interest in Learning about Eating Healthy and Physical Activity (see Figures 3 and 4 below and Table 8 in Appendix C) • More than nine out of ten participants (>90%) shared interest in learning about healthy food
choices, incorporating fruits and vegetables into their diet, portion size, benefits of physical activity, and Increasing physical activity level.
• Three-fourths (75.0%) shared interest in participating in team activities.
44.438.7
16.9
0
20
40
60
80
100
More than 1 hour 30-60 minutes Less than 30 minutes
Perc
ent
Figure 2: Eat Smart, Move More Member Health and Interest Survey: Duration of Moderate or Vigorous Physical Activity on Most Days
Moderate or vigorous physcial activity on most days
32 Rutgers Center for State Health Policy, February 2016
91.9
94.4
92.9
95.6
5.0
4
6.5
3.2
3.1
1.6
0.6
1.3
80 100
Learning about benefits ofphysical activity
Learning about healthier foodchoices and portion size
Learning about incorporatingfruits and vegetables
Learning about healthy foodchoices
Percent
Figure 3: Eat Smart, Move More Member Health and Interest Survey: Interest in Learning About Healthy Food and Physical Activity
Yes No Not sure
75.0
90.9
93.1
93.1
9.0
5.8
3.1
2.5
16.0
3.2
3.8
4.4
0 20 40 60 80 100
Participating in team activities
Walking to increase my physicalactivity level
Increasing my physical activitylevel
Participating in “tasting” events to sample healthy foods
Percent
Figure 4: Eat Smart, Move More Member Health and Interest Survey: Interest in Tasting Healthy Foods and Increasing Physical Activity Level
Yes No Not sure

33 Evaluation of the Faith in Prevention Initiative: Year 1 Report
Interest in Seeing Changes in the Faith Community (see Figure 5 below and Table 9 in Appendix C) • Participants shared a strong interest in seeing policy and environmental changes, such as
availability of healthy snacks (95.5%), healthy meals (92.7%), and more places to be physically active (92.3%) implemented in their faith community.
• Nearly two-thirds (64.7%) said that they would like their leader to talk about healthy eating and physical activity in sermons, messages, or other talks.
• About nine out of ten (90.4%) reported that they would like their faith community to regularly offer physical activity or healthy eating classes.
Interest in Participation in Health Activities (see Figure 6 below and Table 10 in Appendix C) • Nearly five out of ten (49.0%) participants reported that they would like to participate in
health activities before services, and 46.5% said that they would like to participate after services.
• About eight out of ten (79.2%) shared interest in participating in health activities like physical activity breaks or healthy food tastings during regularly scheduled faith community events.
90.4
64.7
92.3
92.7
95.5
3.5
24.7
2.6
4.9
1.9
6.1
10.7
5.1
2.4
2.6
0 20 40 60 80 100
Seeing regular classes on physicalactivity or healthy eating offered…
Seeing our leaders talk abouthealthy eating and physical…
Seeing more places to be physicallyactive in our faith community
Having healthy meals served in ourfaith community
Having healthy snacks available inour faith community
Percent
Figure 5: Eat Smart, Move More Member Health and Interest Survey: Interest in Seeing Changes in the Faith Community
Yes No Not sure

34 Rutgers Center for State Health Policy, February 2016
Preferred Methods for Receiving Health Information (see Figure 7 below and Table 11 in Appendix C) • More than nine out of ten (91.3%) said that they would like to receive health information that
they can read, listen to, or watch on their own. • Nearly three-fourths (74.8%) said that they would like to see health information in bulletins,
newsletters, and on bulletin boards.
79.2
46.5
49.0
8.0
36.1
31.2
12.8
17.4
19.7
0 20 40 60 80 100
Participate in health activitiesduring regularly scheduled faith
community events
Participate in health activitiesafter services
Participate in health activitiesbefore services
Percent
Figure 6: Eat Smart, Move More Member Health and Interest Survey: Interest in Participation in Health Activities Yes No Not sure
74.8
91.3
18.5
4.3
6.6
4.3
0 20 40 60 80 100
See health information in ourbulletins, newsletter and on
bulletin boards
Receive health information that Ican read, listen to or watch on
my own
Percent
Figure 7: Eat Smart, Move More Member Health and Interest Survey: Preferred Methods for Receiving Health Information
Yes No Not sure

35 Evaluation of the Faith in Prevention Initiative: Year 1 Report
Participant Survey Demographics (see Table 12 in Appendix C) • Overall, 122 participants completed this survey and nine participants completed the Spanish
version of pre-test for post-test. • Nearly eight out of ten (77.7%) participants were female. • About one-third (33.7%) were aged 55 or older. However, 14.7% were under 25 years of age. • More than half (51.7%) of the participants were African American, nearly one-third (31.7%)
were Hispanic/Latino, and the rest were White (6.7%), American Indian (0.8%) or Other (4.2%). Moreover, 4.9% of participants reported more than one race.
Program Effect (see Figures 8 and 9 below and Table 13 in Appendix C) As a result of participation in this program, participants reported improvements in the following areas: • Nutrition
o More than eight out of ten (84.3%) reported that they are now mindful of their diet, and more than three-fourths (78.3%) said that they are more mindful of getting physical activity every day.
o More than three-fourths (77.7%) reported controlling portion sizes, and more than two-thirds reported eating less fast food (68.9%) and drinking fewer calorie containing beverages (67.8).
o About six out of ten reported preparing and eating more meals at home (60.5%), and eating two-three cups of vegetables (62.5%), and one and a half–two cups of fruits (60.7%) on most days. However, one-fourth participants reported not eating two–three cups of vegetables (25.0%) and one a half–two cups of fruits (25.6%).
• Physical Activity o As a result of participating in this program, more than two-thirds (66.9%) reported
doing at least 30 minutes of physical activity on most days. • Screen Time
o More than six out of ten reported limiting screen time for themselves (63.6%) as well as their family (61.1%).

36 Rutgers Center for State Health Policy, February 2016
60.5
62.5
54.5
60.7
68.9
67.8
84.3
77.7
6.7
25.0
25.6
25.6
7.6
6.8
5.8
10.7
32.8
12.5
19.8
13.7
23.5
25.4
9.9
11.6
0 20 40 60 80 100
Prepare and eat more meals at home
Eat 2-3 cups of vegetables on most days
Eat breakfast most days
Eat 1.5 – 2 cups of fruits on most days
Eat less fast food
Drink fewer calorie containing beverages
More mindful of what and how much Ieat
Eat smaller portions
Percent
Figure 8: Effect of FFESMM Program on Nutrition
Yes No Was already doing
63.6
61.1
66.9
78.3
19.8
22.1
7.6
4.2
16.5
16.8
25.4
17.5
0 20 40 60 80 100
Limit screen time for myself
Limit screen time for my family
Physically active at least 30 minutes mostdays
More mindful of getting physical activityeach day
Percent
Figure 9: Effect of FFESMM Program on Physical Activity Habits
Yes No Was already doing

37 Evaluation of the Faith in Prevention Initiative: Year 1 Report
Eat Smart, Move More Member Health and Interest Survey Pre- and Three Month Post-test Two FBOs collected three month post-test data. The analysis below compares pre- (N = 22) and three month post-test (N = 25) of two FBOs. Healthy Eating and Physical Activity Habits (see Figures 10 and 11 below and Table 14 in Appendix C) • Overall, the participants reported a notable increase in consumption of two–three cups of
vegetables (36.4% vs. 68.0%) and one a half–two cups of fruits (66.7% vs. 75.0%) on most days in the three month post-test.
• The percentage of participants drinking regular soda (27.3 vs. 24.0) decreased in the three month post-test.
• For physical activity, the percentage increased for participants spending 30–60 minutes (27.3% vs. 37.5%) in moderate or vigorous physical activity on most days in addition to their normal routine.
36.4
66.7
27.3
68.075.0
24.0
0
20
40
60
80
100
Eat 2-3 cups of vegetables on mostdays
Eat 1.5-2 cups of fruits on mostdays
Drink regular (not diet) soda everyday
Perc
ent
Figure 10: Pre- and 3 Month Post-test: Healthy Eating HabitsPre-test Post-post test

38 Rutgers Center for State Health Policy, February 2016
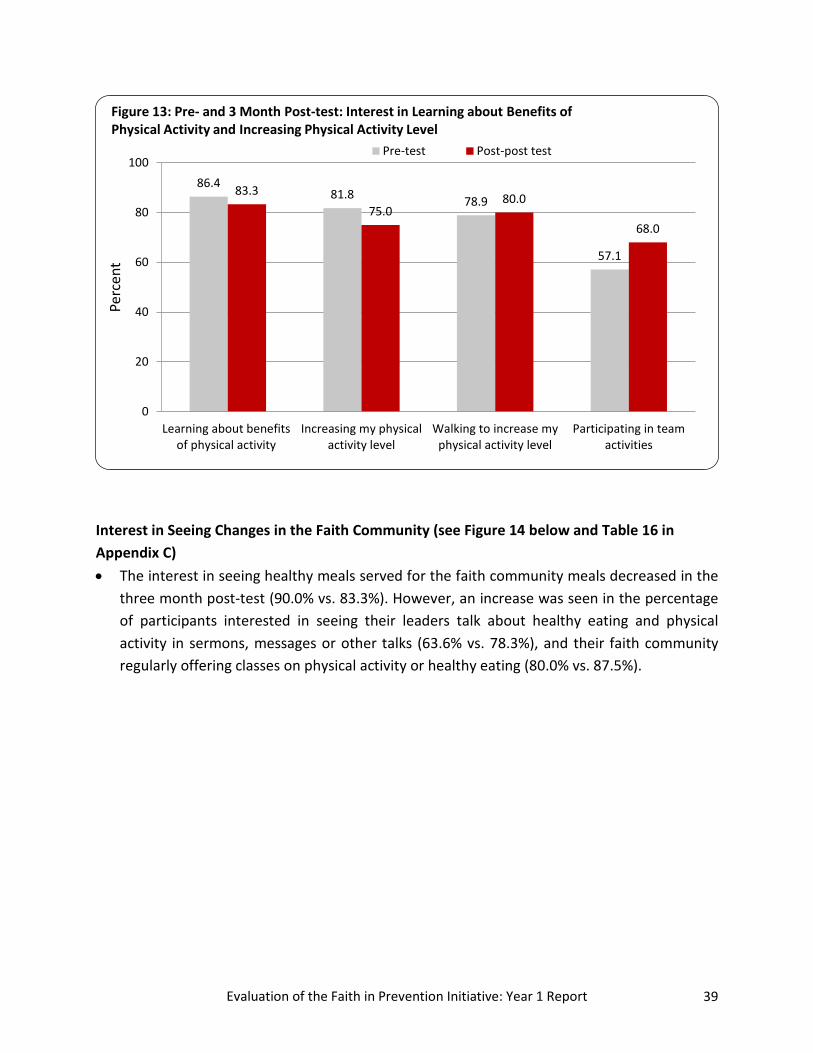
Interest in Learning about Eating Healthy and Physical Activity (see Figures 12 and 13 below and Table 15 in Appendix C) • The data indicated a consistent interest in learning about healthy eating and portion size
three months after completing the sessions. • For physical activity, participants shared a little lesser interest in learning about benefits of
physical activity (86.4% vs. 83.3%), and increasing their physical activity level (81.8% vs. 75.0%), and more interest in participating in team activities (57.1% vs. 68.0%).
95.5
80.090.5 86.4
95.8
82.691.3 87.0
0
20
40
60
80
100
Learning about healthyfood choices
Learning aboutincorporating fruits andvegetables into my diet
Learning about healthierfood choices and portionsize to help manage my
weight
Participating in “tasting” events to sample healthy
foods
Perc
ent
Figure 12: Pre- and 3 Month Post-test: Interest in Learning about Healthy Food
Pre-test Post-post test
50.0
27.322.7
41.737.5
20.8
0
20
40
60
80
100
Less than 30 minutes 30-60 minutes More than 1 hour
Perc
ent
Figure 11: Pre- and 3 Month Post-test: Moderate or Vigorous Physical Activity on Most Days
Pre-test Post-post test
39 Evaluation of the Faith in Prevention Initiative: Year 1 Report
Interest in Seeing Changes in the Faith Community (see Figure 14 below and Table 16 in Appendix C) • The interest in seeing healthy meals served for the faith community meals decreased in the
three month post-test (90.0% vs. 83.3%). However, an increase was seen in the percentage of participants interested in seeing their leaders talk about healthy eating and physical activity in sermons, messages or other talks (63.6% vs. 78.3%), and their faith community regularly offering classes on physical activity or healthy eating (80.0% vs. 87.5%).
86.481.8 78.9
57.1
83.375.0
80.0
68.0
0
20
40
60
80
100
Learning about benefitsof physical activity
Increasing my physicalactivity level
Walking to increase myphysical activity level
Participating in teamactivities
Perc
ent
Figure 13: Pre- and 3 Month Post-test: Interest in Learning about Benefits of Physical Activity and Increasing Physical Activity Level
Pre-test Post-post test

40 Rutgers Center for State Health Policy, February 2016
Interest in Participation in Health Activities (see Figure 15 below and Table 17 in Appendix C) There was a slight increase in the percentage of participants interested in participating in health activities before services (50.0% vs. 52.2%) or after services (47.6% vs. 52.2%). However, the percentage of participants interested in participating in physical activity breaks or healthy food tasting during regularly scheduled faith community events increased markedly in the three month post-test.
95.2 90.081.8
63.6
80.0
95.783.3 80.0 78.3
87.5
0
20
40
60
80
100
Healthy snacksavailable
Healthy mealsserved
More places to bephysically active
Leaders talk abouthealthy eating andphysical activity in
sermons , messagesor other talks
Classes on physicalactivity or healthy
eating offeredregularly
Perc
ent
Figure 14: Pre- and 3 Month Post-test: Interest in Seeing Changes in the Faith Community
Pre-test Post-post test

41 Evaluation of the Faith in Prevention Initiative: Year 1 Report
Preferred Methods for Receiving Health Information (see Figure 16 below and Table 18 in Appendix C) The three month post-test indicates an increased interest in receiving health information that participants can read, listen to, or watch on their own (90.0% vs. 96.0%) as well as seeing the health information in bulletins, newsletters and on bulletin boards (85.7% vs. 88.0).
50.0 47.6
77.3
52.2 52.2
90.9
0
20
40
60
80
100
Participate in health activitiesbefore services
Participate in health activities afterservices
Participate in health activitiesduring faith community events
Perc
ent
Figure 15: Pre- and 3 Month Post-test: Interest in Participation in Health Activities
Pre-test Post-post test
90.985.7
96.088.0
0
20
40
60
80
100
Receive health information that I can read,listen to or watch on my own
See health information in our bulletins,newsletter and on bulletin boards
Perc
ent
Figure 16: Pre- and 3 Month Post-test: Preferred Methods for Receiving Health Information Pre-test Post-post test

42 Rutgers Center for State Health Policy, February 2016
Challenges Participant Retention: Nearly half of the participants completed both pre- and post-test in Camden and Newark and about six out of ten completed both pre- and post-test in Trenton. Flexibility in scheduling and exploring strategies for recruitment and retention may help in increasing both program participation and completion rates.
• Staff Turnover: Impacted the full delivery of the first year requirements at one site and delayed data collection.
• Different Versions of the Form: Impacted pre/post comparison and across-the-board analysis.
Conclusion The Faith in Prevention Initiative has potential for broader reach, adoption, implementation, and greater impact. The program can be adapted to fit the needs of any faith community and its members. Participation in this grant helped the FBOs identify and adopt policies and practices that support the health and wellness of their members. The participating FBOs were at different stages of readiness to support member health and wellness. With regard to their participation, all 26 participating FBOs completed all elements of the program and made multiple positive changes to their food and physical activity policies and environments. They may consider completing this tool annually to identify most pressing needs of their community, discuss the priorities with the leadership and community members, and create an action plan to build healthier communities. The impact of the program on participants was evident by better outcomes for most measures (including increased knowledge and understanding, change in behavior for healthier eating and physical activity, and an improvement in faith community environment to support healthier lifestyle) in all three cities. The pre/post differences were statistically significant for seven items in Camden and three items in Newark. The findings show that FFESMM sessions had a positive effect on participants and increased their consumption of fruits and vegetables, provided the skills and motivation to eat more meals at home, and increased regular physical activity. The three month post-test indicated that the behavioral changes sustained after three months of program completion. This suggests that implementing FFESMM may help FBOs improve health and the quality of life of their congregants.

43 Evaluation of the Faith in Prevention Initiative: Year 1 Report
Appendix A: Camden Coalition of Healthcare Providers
Faith Community Assessment (Pre/Post-test)
Table 1: Faith Community Assessment: Change in Pre/Post Test Scores
Category Scores Increased* Scores Decreased * Scores Unchanged*
Health/Wellness Infrastructure 6 1 2
Partnerships and Programs 6 1 1
Physical Activity Environment 3 4 1
Physical Activity Policies and Leadership 5 1 3
Physical Activity Group/Support Classes 2 2 5
Physical Activity Individual Education/Information 6 0 3
Nutrition Environment 2 0 7
Nutrition Policies and Leadership 6 2 1
Nutrition Group/Support Classes 6 0 3
Nutrition Individual Education/Information 5 1 2

44 Rutgers Center for State Health Policy, February 2016
Table 2: Health/Wellness Infrastructure (# of items = 7)
Faith-based Organization Pre-test Score Post-test Score Action Items for FBOs to Consider
Baptist Temple Church 28.6% 14.3% • Include health in your mission statement • Establish a health team or committee • Develop a lay health advisor program • Conduct survey of members on health issues • Allocate funds for health promotion or
health related activities and establish health or wellness goals for the organization/membership
Bethel Deliverance Church 71.4% 100.0% None
Ferry Avenue United Methodist Church
28.6% 71.4% • Include health in your mission statement • Develop a lay health advisor program
Hosanna AMEC 0.0% 57.1% • Establish a health team or committee and appoint a person to be responsible for health related activities
• Allocate funds for health promotion or health related activities
Masjidun-Nur Inc. 57.1% 57.1% Data missing
New Life Church 85.7% 85.7% • Include health in your mission statement
New Life Ministries 42.9% 71.4% • Develop a lay health advisor program • Allocate funds for health promotion or
health related activities Parkside United Methodist Church 85.7% 100.0% None
Tenth Street Baptist Church 42.9% 100.0% None

45 Evaluation of the Faith in Prevention Initiative: Year 1 Report
Table 3: Partnerships and Programs (# of items = 8)
Faith-based Organization Pre-test Score Post-test Score Action Items for FBOs to Consider
Baptist Temple Church 0% 0% • Develop partnership and programs for sponsoring health fairs, offering health screenings, health promotion, and develop association with a community health coalition or committee and another health or human services agency to provide services to members
Bethel Deliverance Church 75.0% 87.5% • Appoint faith community nurse by participating in a parish nursing program to promote health and wellness of community members
Ferry Avenue United Methodist Church
25.0% 50.0% • Sponsor health fairs • In addition to other health screenings, offer
blood cholesterol and diabetes screenings • Participate in a parish nursing program
Hosanna AMEC 0.0% 37.5% • Sponsor health fairs • In addition to other health screenings, offer
blood cholesterol and diabetes screenings • Participate in a parish nursing program • Represent faith community by serving on a
community health coalition or council Masjidun-Nur Inc. 25.0% 75.0% • In addition to other health screenings, offer
diabetes screening • Participate in a parish nursing program
New Life Church 87.5% 75.0% • In addition to other health screenings, offer blood cholesterol screening
New Life Ministries 37.5% 50.0% • Sponsor health fairs • In addition to other health screenings, offer
blood cholesterol, diabetes and healthy body weight screenings
Parkside United Methodist Church
50.0% Data missing • Sponsor health fairs
Tenth Street Baptist Church 62.5% 75.0% • Participate in a parish nursing program • Represent faith community by serving on a
community health coalition or council

46 Rutgers Center for State Health Policy, February 2016
Table 4: Physical Activity - Environment (# of items = 5)
Faith-based Organization Pre-test Score Post-test Score Action Items for FBOs to Consider
Baptist Temple Church 20.0% 0% • Develop environment for increasing and promoting physical activity by making space and equipment available
Bethel Deliverance Church 40.0% 100.0% None
Ferry Avenue United Methodist Church
60.0% 20.0% • Develop environment for increasing and promoting physical activity by making space, walking trails, playground available
Hosanna AMEC 40.0% 0.0% • Identify ways (availability of space, equipment, walking trail, playground) for members to be physically active
Masjidun-Nur Inc. 0.0% 0.0% • Identify ways (availability of space, equipment, walking trail, playground) for members to be physically active
New Life Church 80.0% 40.0% • Identify additional ways (availability of exercise equipment, walking trail etc.) for members to be physically active
New Life Ministries 0.0% 20.0% • Identify ways (availability of exercise equipment, walking trail, playground) for members to be physically active
Parkside United Methodist Church
40.0% Data missing Data missing
Tenth Street Baptist Church 20.0% 100.0% None
Table 5: Physical Activity – Policies and Leadership (# of items = 3)
Faith-based Organization Pre-test Score Post-test Score Action Items for FBOs to Consider
Baptist Temple Church 33.3% 66.7% • Support physical activity opportunities at meetings or functions
Bethel Deliverance Church 66.7% 66.7% • Support physical activity opportunities at meetings or functions
Ferry Avenue United Methodist Church
66.6% 100.0% None
Hosanna AMEC 0.0% 33.3% • Develop a policy supporting physical activity opportunities at meeting or functions and support physical activity opportunities at meetings or functions

47 Evaluation of the Faith in Prevention Initiative: Year 1 Report
Table 5: Physical Activity – Policies and Leadership (contd.)
Masjidun-Nur Inc. 33.3% 0.0% • Develop a policy supporting physical activity opportunities at meeting or functions and support physical activity opportunities at meetings or functions
New Life Church 100.0% 100.0% None
New Life Ministries 33.3% 100.0% None
Parkside United Methodist Church
33.3% 33.3% • Develop a policy supporting physical activity opportunities at meeting or functions and support physical activity opportunities at meetings or functions
Tenth Street Baptist Church 66.7% 100.0% None
Table 6: Physical Activity – Group/Support Classes (# of items = 3)
Faith-based Organization Pre-test Score Post-test Score Action Items for FBOs to Consider
Baptist Temple Church 0.0% 0.0% • Develop programs for increasing and promoting physical activity (e.g. group classes, walking clubs, sports team)
Bethel Deliverance Church 100.0% 66.7% • Sponsor or support sports team for members
Ferry Avenue United Methodist Church
33.3% 33.3% • Develop programs for increasing and promoting physical activity (e.g. walking clubs, sports team)
Hosanna AMEC 0.0% 33.3% • Develop programs for increasing and promoting physical activity (e.g. walking clubs, sports team)
Masjidun-Nur Inc. 33.3% 33.3% None
New Life Church 66.7% 33.3% • Develop programs for increasing and promoting physical activity (e.g. walking clubs, sports team)
New Life Ministries 33.3% 100.0% None
Parkside United Methodist Church
33.3% 33.3% • Develop programs for increasing and promoting physical activity (e.g. walking clubs, sports team)
Tenth Street Baptist Church 33.3% 33.3% • Develop programs for increasing and promoting physical activity (e.g. walking clubs, sports team)

48 Rutgers Center for State Health Policy, February 2016
Table 7: Physical Activity – Individual Education/Information (# of items = 7)
Faith-based Organization Pre-test Score Post-test Score Action Items for FBOs to Consider
Baptist Temple Church 28.6% 42.9% • Provide fitness counseling to members • Promote physical activity on the faith
community website • Cultivate relationship with a fitness club to
get discounted rates for members Bethel Deliverance Church 85.7% 85.7% • Promote physical activity on the faith
community website
Ferry Avenue United Methodist Church
42.9% 85.7% • Cultivate relationship with a fitness club to get discounted rates for members
Hosanna AMEC 0.0% 85.7% • Promote physical activity on the faith community website
Masjidun-Nur Inc. 28.6% 28.6% None
New Life Church 57.1% 85.7% • Promote physical activity on the faith community website
New Life Ministries 28.6% 57.1% • Provide fitness counseling to members • Promote physical activity on the faith
community website • Cultivate relationship with a fitness club to
get discounted rates for members Parkside United Methodist Church
42.6% 71.4% • Promote physical activity on the faith community website
• Cultivate relationship with a fitness club to get discounted rates for members
Tenth Street Baptist Church 71.4% 71.4% • Promote physical activity on the faith community website, bulletin boards, newsletter

49 Evaluation of the Faith in Prevention Initiative: Year 1 Report
Table 8: Nutrition-Environments (# of items = 3)
Faith-based Organization Pre-test Score Post-test Score Action Items for FBOs to Consider
Baptist Temple Church 66.7% 66.7% • Develop community garden for members to share work and benefits
Bethel Deliverance Church 66.7% 100.0% None
Ferry Avenue United Methodist Church
66.7% 66.7% • Develop community garden for members to share work and benefits
Hosanna AMEC 66.7% 66.7% • Develop community garden for members to share work and benefits
Masjidun-Nur Inc. 100.0% 100.0% None
New Life Church 66.7% 66.7% • Develop community garden for members to share work and benefits
New Life Ministries 66.7% 66.7% • Develop community garden for members to share work and benefits
Parkside United Methodist Church
66.7% 66.7% • Develop community garden for members to share work and benefits
Tenth Street Baptist Church 66.7% 100.0% None
Table 9: Nutrition – Policies and Leadership (# of items = 8)
Faith-based Organization Pre-test Score Post-test Score Action Items for FBOs to Consider
Baptist Temple Church 37.5% 75.0% • Develop guidelines to offer 100% fruit juice for faith community meals and serve healthier options at food events
Bethel Deliverance Church 62.5% 87.5% • Develop guidelines to offer 100% fruit juice for faith community meals
Ferry Avenue United Methodist Church
100.0% 100.0% None
Hosanna AMEC 12.5% 75.0% • Develop guidelines to offer low-fat items and low/no sugar items for faith community meals
Masjidun-Nur Inc. 12.5% 25.0% • Develop guidelines to offer healthier options for faith community meals

50 Rutgers Center for State Health Policy, February 2016
Table 9: Nutrition – Policies and Leadership (contd.)
New Life Church 87.5% 75.0% • Develop guidelines to offer low/no sugar items and low-sodium items for faith community meals
New Life Ministries 100.0% 62.5% • Develop guidelines to offer low-fat items, low/no sugar items and low-sodium items for faith community meals
Parkside United Methodist Church
87.5% 100.0% None
Tenth Street Baptist Church 87.5% 100.0% None
Table 10: Nutrition - Group Support/Classes (# of items = 3)
Faith-based Organization Pre-test Score Post-test Score Action Items for FBOs to Consider
Baptist Temple Church 33.3% 100.0% None
Bethel Deliverance Church 66.7% 66.7% • Offer/organize weight loss support groups
Ferry Avenue United Methodist Church
66.7% 66.7% • Offer/organize weight loss support groups
Hosanna AMEC 0.0% 66.7% • Offer/organize weight loss support groups
Masjidun-Nur Inc. 0.0% 66.7% None
New Life Church 100.0% 100.0% None
New Life Ministries 0.0% 33.3% • Offer/organize weight loss support groups and any other nutrition classes or groups
Parkside United Methodist Church
66.7% 100.0% None
Tenth Street Baptist Church 66.7% 100.0% None

51 Evaluation of the Faith in Prevention Initiative: Year 1 Report
Table 11: Nutrition- Individual Education/Information (# of items = 6)
Faith-based Organization Pre-test Score Post-test Score Action Items for FBOs to Consider
Baptist Temple Church 50.0% 50.0% • Provide individual weight control or nutrition counseling
• Promote nutrition on faith community website
• Identify additional ways to support nutrition (e.g. healthy food guidelines for faith community day care program, for meals for seniors or needy families)
Bethel Deliverance Church 100.0% 83.3% • Provide individual weight control or nutrition counseling
Ferry Avenue United Methodist Church
50.0% 83.3% • Provide individual weight control or nutrition counseling
Hosanna AMEC 0.0% 66.7% • Promote nutrition on faith community website
• Identify additional ways to support nutrition (e.g. healthy food guidelines for faith community day care program, for meals for seniors or needy families)
Masjidun-Nur Inc. 33.3% 33.3% Data missing
New Life Church 16.7% Data missing Data missing
New Life Ministries 33.3% 66.7% • Promote nutrition on faith community website
• Identify additional ways to support nutrition (e.g. healthy food guidelines for faith community day care program, for meals for seniors or needy families)
Parkside United Methodist Church
50.0% 83.3% • Promote nutrition on faith community website
Tenth Street Baptist Church 16.7% 66.7% • Promote nutrition through posted information, bulletin, newsletter, and on the faith community website

52 Rutgers Center for State Health Policy, February 2016
Table 12: Participant Demographics (N=131) Valid%* n Gender Female 87.4 111 Male 12.6 16 Race White or Caucasian 2.5 3 Black or African American 95.1 116 American Indian or Alaska Native 0.8 1 Chinese 0.0 0 Filipino 0.0 0 Japanese 0.0 0 Korean 0.0 0 Vietnamese 0.0 0 Other Asian 0.0 0 Native Hawaiian 0.0 0 Guamanian or Chamorro 0.0 0 Samoan 0.0 0 Other Pacific Islander 0.8 1 More than 1 race 0.8 1 Level of Education Grade 8 or below 3.9 5 Some high school 13.4 17 Grade 12 or GED 25.2 32 Some college or vocational school 29.1 37 Graduated 2 year college 14.2 18 Graduated 4 year college 9.4 12 Graduate school 4.7 6 *Does not include missing values
Table 13: Participant Demographics (N= 56) % n Hispanic, Latino, or Spanish Origin Yes 4.6 6 No 80.2 105 Missing 15.3 20 Total Household Income Less than 10,000 18.3 24 $10,000 - $24,999 25.2 33 $25,000 - $49,999 30.5 40 $50,000 $74,999 6.1 8 $75,000 - $99,999 6.1 8 $100,000 or over 2.3 3 Missing 11.5 15

53 Evaluation of the Faith in Prevention Initiative: Year 1 Report
Table 14: Change in Knowledge All Participants Participants with Matched Pre-
and Post-test Pre-test
(N=131)* % (n)
Post-test (N=132)*
% (n)
Pre-test (n=72)*
% (n)
Post-test (n=72)*
% (n) I understand what healthy food choices mean Yes 93.8 (122) 96.9 (127) 91.7 (66) 94.4 (68) No 0.8 (1) 3.1 (4) 8.3 (6) 5.6 (4) Not sure 5.4 (7) 0.0 0.0 0.0 I know how to include healthy choices Yes 92.2 (119) 94.6 (123) 93.0 (66) 93.0 (66) No 3.9 (5) 3.8 (5) 5.6 (4) 5.6 (4) Not sure 3.9 (5) 1.5 (2) 1.4 (1) 1.4 (1) Read food labels Yes 62.5 (80) 68.0 (87) 61.4 (43) 64.3 (45) No 35.2 (45) 26.6 (34) 37.1 (26) 31.4 (22) Not sure 2.3 (3) 5.5 (7) 1.4 (1) 4.3 (3) Leave food outside the refrigerator Yes 18.6 (24) 19.5 (25) 16.9 (12) 18.6 (13) No 79.1 (102) 77.3 (99) 80.3 (57) 80.0 (56) Not sure 2.3 (3) 3.1 (4) 2.8 (2) 1.4 (1) I understand the benefits of physical activity Yes 93.8 (121) 97.7 (125) 93.0 (66) 97.1 (67) No 3.1 (4) 2.3 (3) 2.8 (2) 2.9 (2) Not sure 3.1 (4) 0.0 4.2 (3) 0.0 Interested in receiving health information Yes 85.3 (110) 88.5 (115) 87.3 (62) 88.6 (62) No 11.6 (15) 7.7 (10) 9.9 (7) 5.7 (4) Not sure 3.1 (4) 3.8 (5) 2.8 (2) 5.7 (4) *Does not include missing values
Table 15: Change in Behavior All Participants Participants with Matched Pre-
and Post-test Pre-test
(N=131)* % (n)
Post-test (N=132)*
% (n)
Pre-test (n=72)*
% (n)
Post-test (n=72)*
% (n) Eat vegetables on most days Yes 83.1 (108) 86.4 (114) 87.3 (62) 86.1 (61) No 16.2 (21) 11.4 (15) 12.7 (9) 12.5 (9) Not sure 0.8 (1) 0.8 (1) 0.0 0.0 Eat Fruits on most days Yes 80.0 (100) 79.5 (105) 85.7 (60) 87.5 (63) No 18.4 (23) 17.4 (23) 12.9 (9) 12.5 (9) Not sure 1.6 (2) 2.3 (3) 1.4 (1) 0.0

54 Rutgers Center for State Health Policy, February 2016
Table 15: Change in Behavior (contd.) All Participants Participants with Matched Pre-
and Post-test Pre-test
(N=131)* % (n)
Post-test (N=132)*
% (n)
Pre-test (n=72)*
% (n)
Post-test (n=72)*
% (n) Physical activity in the past month Yes 68.5 (87) 74.2 (98) 71.8 (51) 76.4 (55) No 30.7 (39) 24.2 (32) 26.8 (19) 22.2 (16) Not sure 0.8 (1) 0.0 1.4 (1) 1.4 (1) Prepare and eat more meals at home Yes 81.4 (105) 89.3 (117) 85.9 (61) 90.1 (64) No 18.6 (24) 9.9 (13) 14.1 (10) 9.9 (7) Not sure 0.0 0.8 (1) 0.0 0.0 Plan weekly meals Yes 28.7 (37) 39.5 (51) 31.0 (22) 41.1 (29) No 70.5 (91) 60.5 (78) 69.0 (49) 58.6 (41) Not sure 0.8 (1) 0.0 0.0 0.0 Choose healthier food and control portions Yes 47.3 (61) 65.9 (83) 47.9 (34) 62.9 (44) No 45.0 (58) 27.8 (35) 43.7 (31) 30.0 (21) Not sure 7.8 (10) 6.3 (8) 8.5 (6) 5 (7.1) Dislike healthy food choices Yes 33.8 (44) 31.7 (40) 33.3 (24) 31.9 (22) No 52.3 (68) 57.1 (72) 54.2 (39) 56.5 (39) Not sure 13.8 (18) 11.1 (14) 12.5 (9) 11.6 (8) No. of sugar sweetened beverages/day 0 21.9 (28) 25.8 (34) 18.3 (13) 22.2 (16) 1 28.1 (36) 32.6 (43) 25.4 (18) 36.1 (26) 2 30.5 (39) 23.5 (31) 32.4 (23) 18.1 (13) 3 7.0 (9) 7.6 (10) 7.0 (5) 11.1 (8) 4 or more 11.7 (15) 9.1 (12) 15.5 (11) 11.1 (8) Occasionally 0.8 (1) 1.5 (2) 1.4 (1) 1.4 (1) Try to be more physically active Yes 78.7 (100) 92.1 (116) 77.1 (54) 89.9 (62) No 17.3 (22) 4.8 (6) 18.6 (13) 5.8 (4) Not sure 3.9 (5) 3.2 (4) 4.3 (3) 4.3 (3) Use stairs or walk or bike to places Yes 55.0 (71) 74.2 (95) 64.8 (46) 81.7 (58) No 40.3 (52) 25.8 (33) 32.4 (23) 18.3 (13) Not sure 4.7 (6) 0.0 2.8 (2) 0.0 Participate in team sports Yes 8.5 (11) 15.0 (19) 8.5 (6) 13.0 (9) No 91.5 (118) 84.3 (107) 91.5 (65) 87.0 (60) Not sure 0.0 0.8 (1) 0.0 0.0 *Does not include missing values

55 Evaluation of the Faith in Prevention Initiative: Year 1 Report
Table 16: Change in My Faith Community All Participants Participants with Matched Pre- and
Post-test Pre-test (N=131)*
% (n) Post-test (N=132)*
% (n) Pre-test (n=72)*
% (n) Post-test (n=72)*
% (n) My faith community serves healthy snacks Yes 42.5 (54) 57.6 (72) 38.6 (27) 58.6 (41) No 28.3 (36) 24.0 (30) 31.4 (22) 20.0 (14) Not sure 29.1 (37) 18.4 (23) 30.0 (21) 21.4 (15) My faith community serves healthy meals Yes 44.4 (56) 63.6 (77) 43.5 (30) 58.0 (40) No 25.4 (32) 20.7 (25) 29.0 (20) 21.7 (15) Not sure 30.2 (38) 15.7 (19) 27.5 (19) 20.3 (14) My faith community has places to be physically active Yes 23.0 (29) 37.5 (48) 24.6 (17) 37.7 (26) No 63.5 (80) 51.6 (66) 56.5 (39) 47.8 (33) Not sure 13.5 (17) 10.9 (14) 18.8 (13) 14.5 (10) *Does not include missing values
Table 17: Comparing Means, Matched Participants Participants with Matched Pre- and Post-test Pre-test Mean Post-test Mean P value Change in knowledge I understand what healthy food choices mean 2.9 2.9 0.16 I know how to include healthy choices 2.9 2.9 1.00 Read food labels 2.2 2.3 0.22 Understand food safety 1.4 1.4 0.83 I understand the benefits of physical activity 2.9 3.0 0.09 Interested in receiving health information 2.8 2.8 0.40 Change in behavior Eat vegetables on most days 2.7 2.7 1.00 Eat Fruits on most days 2.7 2.7 0.74 No. of sugar sweetened beverages 1.8 1.5 0.02 Physical activity in the past month 2.4 2.5 0.13 No. of times physical activity 3.1 3.0 0.78 Prepare and eat more meals at home 2.7 2.8 0.18 Plan weekly meals 1.6 1.8 0.06 Choose healthier food and control portions 2.1 2.3 0.00 Dislike healthy food choices 1.7 1.8 0.87 Try to be more physically active 2.6 2.8 0.00 Use stairs or walk or bike to places 2.3 2.6 0.00 Participate in team sports 1.2 1.3 0.18 Change in my faith community My faith community serves healthy snacks 2.1 2.4 0.00 My faith community serves healthy meals 2.1 2.4 0.01 My faith community has places to be physically active 1.7 1.9 0.02
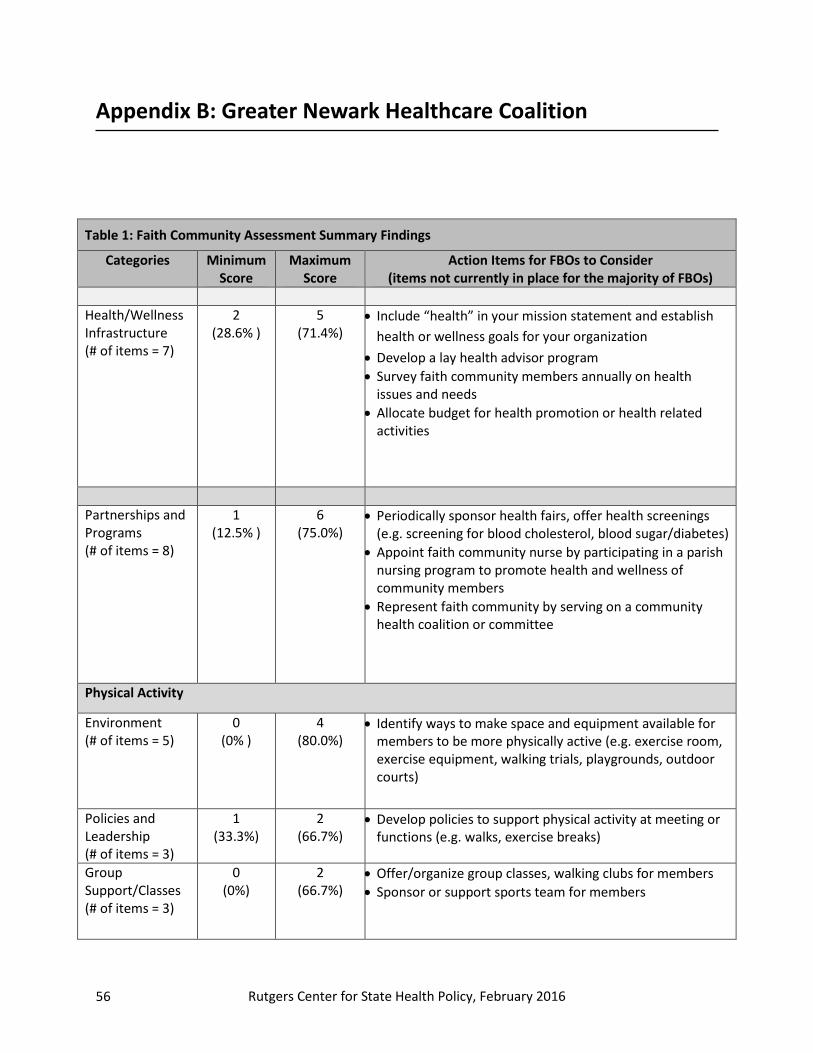
56 Rutgers Center for State Health Policy, February 2016
Appendix B: Greater Newark Healthcare Coalition
Table 1: Faith Community Assessment Summary Findings
Categories Minimum Score
Maximum Score
Action Items for FBOs to Consider (items not currently in place for the majority of FBOs)
Health/Wellness Infrastructure (# of items = 7)
2 (28.6% )
5 (71.4%)
• Include “health” in your mission statement and establish health or wellness goals for your organization
• Develop a lay health advisor program • Survey faith community members annually on health
issues and needs • Allocate budget for health promotion or health related
activities
Partnerships and Programs (# of items = 8)
1 (12.5% )
6 (75.0%)
• Periodically sponsor health fairs, offer health screenings (e.g. screening for blood cholesterol, blood sugar/diabetes)
• Appoint faith community nurse by participating in a parish nursing program to promote health and wellness of community members
• Represent faith community by serving on a community health coalition or committee
Physical Activity
Environment (# of items = 5)
0 (0% )
4 (80.0%)
• Identify ways to make space and equipment available for members to be more physically active (e.g. exercise room, exercise equipment, walking trials, playgrounds, outdoor courts)
Policies and Leadership (# of items = 3)
1 (33.3%)
2 (66.7%)
• Develop policies to support physical activity at meeting or functions (e.g. walks, exercise breaks)
Group Support/Classes (# of items = 3)
0 (0%)
2 (66.7%)
• Offer/organize group classes, walking clubs for members • Sponsor or support sports team for members

57 Evaluation of the Faith in Prevention Initiative: Year 1 Report
Table 1: Faith Community Assessment Summary Findings (contd.) Categories Minimum
Score Maximum
Score Action Items for FBOs to Consider
(items not currently in place for the majority of FBOs) Individual Education/Information (# of items = 7)
0 (0%)
3 (42.9%)
• Develop policies and programs for increasing and promoting physical activity (e.g. supporting opportunities at meetings or functions, group classes, walking clubs, fitness counseling, posting on the bulletin boards, newsletter, website)
• Find additional ways to support physical activity (e.g. include physical activity time during religious education classes)
• Cultivate relationship with a fitness club to get discounted rates for members
Nutrition Environment (# of items = 3)
0 (0%)
3 (100.0%)
• Develop community garden for members to share work and benefits
Policies and Leadership (# of items = 8)
0 (0%)
8 (100.0%)
• Develop guidelines for offering healthier options for faith community meals
Group Support/Classes (# of items = 3)
0 (0%)
3 (100.0%)
• Offer weight loss support groups to motivate members and find additional nutrition related classes for members
Individual Education/Information (# of items = 6)
0 (0%)
4 (66.7%)
• Offer weight control or nutrition counseling to members • Promote nutrition on the faith community website to raise
awareness • Find additional ways to support nutrition (e.g. healthy food
guidelines for faith community programs)

58 Rutgers Center for State Health Policy, February 2016
Table 2: Faith Community Assessment Pre-test by Participating FBOs
Faith-based Organization
% Scored Action Items for FBOs to Consider
Allen AME Church
• Health and wellness: 28.6% • Partnerships and Programs:
75.0% • Physical Activity
o Environment: 0.0% o Policies and Leadership:
66.7% o Group/Support Classes:
0.0% o Individual
Education/Information: 0.0%
• Nutrition: o Environment: 0.0% o Policies and Leadership:
100.0% o Group/Support Classes:
33.3% o Individual
Education/Information: 33.3%
• Include health in your mission statement • Establish a health team or committee • Develop a lay health advisor program • Conduct survey of members on health issues • Allocate funds for health promotion or health related activities • Represent faith community by serving on a community health
coalition or committee and develop relationship with other health or human services agency to provide services to members
• Develop environment that supports and promotes physical activity by making space and equipment available (such as exercise room, walking trails, playground etc.)
• Develop policies and programs for increasing and promoting physical activity (e.g. supporting opportunities at meetings or functions, group classes, walking clubs, fitness counseling, posting on the bulletin boards, newsletter, website)
• Cultivate relationship with a fitness club to get discounted rates for members
• Build kitchen and community garden and have a cooking or hospitality committee in place
• Organize nutrition-related classes to teach healthy cooking, weight loss support groups, and promote nutrition on the faith community website bulletin boards, newsletter etc.
Greater Abyssinian Baptist Church
• Health and wellness: 28.6% • Partnerships and Programs:
12.5% • Physical Activity:
o Environment: 60.0% o Policies and Leadership:
66.7% o Group/Support Classes:
66.7% o Individual
Education/Information: 42.9%
• Nutrition: o Environment: 66.7%
• Establish framework to support health and wellness of community members (e.g. include health in your mission statement, develop a lay health advisor program, conduct survey of members on health issues, establish health or wellness goals for your organization, allocate budget for health related activities)
• Develop partnership and programs for sponsoring health fairs, offering screenings, and represent faith community by serving on a community health coalition or committee
• Promote physical activity on the faith community website, provide individual fitness counseling, distribute fitness guides, and identify ways for members to be more physically active (e.g. outdoor courts, playground)
• Cultivate relationship with a fitness club to get discounted rates for members

59 Evaluation of the Faith in Prevention Initiative: Year 1 Report
Table 2: Faith Community Assessment Pre-test by Participating FBOs
o Policies and Leadership: 12.5%
o Group/Support Classes: 0.0%
o Individual Education/Information: 0.0%
• Develop community garden for members to share work and benefits
• Develop guidelines to offer healthier options for faith community meals
• Offer/organize group classes to teach healthy cooking and nutrition, weight control counseling, and distribute nutrition guides or healthy recipes
• Organize weight loss support groups, distribute nutrition guides or healthy recipes and promote nutrition on the faith community website
Jehovah-Jireh Praise and Worship Church Center
• Health and wellness: 71.4% • Partnerships and Programs:
12.5% • Physical Activity:
o Environment: 80.0% o Policies and Leadership:
66.7% o Group/Support Classes:
66.7% o Individual
Education/Information: 28.6%
• Nutrition: o Environment: 66.7% o Policies and Leadership:
25.0% o Group/Support Classes:
66.7% o Individual
Education/Information: 50.0%
• Develop a lay health advisor program, and allocate budget for health related activities
• Develop partnership and programs for sponsoring health fairs, offering screenings, and health promotion activities
• Promote physical activity through posted information, faith community website
• Identify additional ways for members to be more physically active (e.g. organize group classes, fitness counseling, equipment available for exercise, distribute fitness guides)
• Develop policies for supporting physical activity opportunities at meetings or functions
• Cultivate relationship with a fitness club to get discounted rates for members
• Develop community garden for members to share work and benefits
• Develop guidelines to offer healthier options for faith community meals
• Offer/organize group classes to teach healthy cooking and nutrition, weight control counseling, and weight loss support groups
• Promote nutrition through posted information, bulletins, programs, newsletter, and on the faith community website
Clearview Baptist Church
• Health and wellness: 42.9% • Partnerships and Programs:
50.0% • Physical Activity:
o Environment: 20.0% o Policies and Leadership:
33.3% o Group/Support Classes:
33.3%
• Establish framework to support health and wellness of community members (e.g. include health in your mission statement, develop a lay health advisor program, conduct survey of members on health issues, establish health or wellness goals for your organization)
• Develop partnership and programs for sponsoring health fairs, and offering screenings
• Promote physical activity through posted information, bulletin, newsletter, faith community website
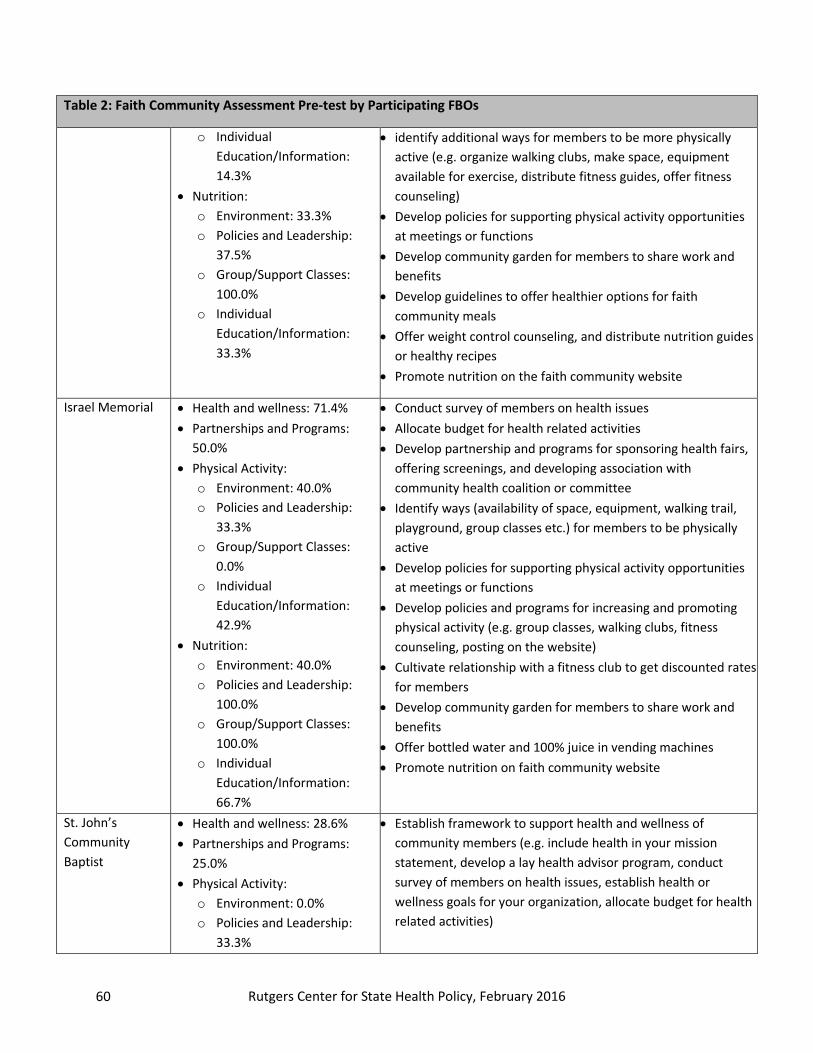
60 Rutgers Center for State Health Policy, February 2016
Table 2: Faith Community Assessment Pre-test by Participating FBOs
o Individual Education/Information: 14.3%
• Nutrition: o Environment: 33.3% o Policies and Leadership:
37.5% o Group/Support Classes:
100.0% o Individual
Education/Information: 33.3%
• identify additional ways for members to be more physically active (e.g. organize walking clubs, make space, equipment available for exercise, distribute fitness guides, offer fitness counseling)
• Develop policies for supporting physical activity opportunities at meetings or functions
• Develop community garden for members to share work and benefits
• Develop guidelines to offer healthier options for faith community meals
• Offer weight control counseling, and distribute nutrition guides or healthy recipes
• Promote nutrition on the faith community website
Israel Memorial • Health and wellness: 71.4% • Partnerships and Programs:
50.0% • Physical Activity:
o Environment: 40.0% o Policies and Leadership:
33.3% o Group/Support Classes:
0.0% o Individual
Education/Information: 42.9%
• Nutrition: o Environment: 40.0% o Policies and Leadership:
100.0% o Group/Support Classes:
100.0% o Individual
Education/Information: 66.7%
• Conduct survey of members on health issues • Allocate budget for health related activities • Develop partnership and programs for sponsoring health fairs,
offering screenings, and developing association with community health coalition or committee
• Identify ways (availability of space, equipment, walking trail, playground, group classes etc.) for members to be physically active
• Develop policies for supporting physical activity opportunities at meetings or functions
• Develop policies and programs for increasing and promoting physical activity (e.g. group classes, walking clubs, fitness counseling, posting on the website)
• Cultivate relationship with a fitness club to get discounted rates for members
• Develop community garden for members to share work and benefits
• Offer bottled water and 100% juice in vending machines • Promote nutrition on faith community website
St. John’s Community Baptist
• Health and wellness: 28.6% • Partnerships and Programs:
25.0% • Physical Activity:
o Environment: 0.0% o Policies and Leadership:
33.3%
• Establish framework to support health and wellness of community members (e.g. include health in your mission statement, develop a lay health advisor program, conduct survey of members on health issues, establish health or wellness goals for your organization, allocate budget for health related activities)

61 Evaluation of the Faith in Prevention Initiative: Year 1 Report
Table 2: Faith Community Assessment Pre-test by Participating FBOs
o Group/Support Classes: 0.0%
o Individual Education/Information: 0.0%
• Nutrition: o Environment: 100.0% o Policies and Leadership:
37.5% o Group/Support Classes:
33.3% o Individual
Education/Information: 50.0%
• Develop partnership and programs for sponsoring health fairs, offering screenings, and represent faith community by serving on a community health coalition or committee
• Identify ways (availability of space, equipment, walking trail, playground, group classes, walking clubs, distribute fitness guides, offer fitness counseling etc.) for members to be physically active
• Promote physical activity through newsletter, bulletin board, and on the faith community website
• Cultivate relationship with a fitness club to get discounted rates for members
• Develop guidelines to offer healthier options for faith community meals
• Offer/organize group classes to teach healthy cooking and nutrition, weight control counseling, and promote on faith community website
Franklin St. John’s UMC
• Health and wellness: 42.9% • Partnerships and Programs:
75.0% • Physical Activity:
o Environment: 0.0% o Policies and Leadership:
33.3% o Group/Support Classes:
0.0% o Individual
Education/Information: 0.0%
• Nutrition: o Environment: 66.7% o Policies and Leadership:
0.0% o Group/Support Classes:
33.3% o Individual
Education/Information: 66.7%
• Establish framework to support health and wellness of community members (e.g. include health in your mission statement, conduct survey of members on health issues, establish health or wellness goals for your organization, allocate budget for health related activities)
• Sponsor health fairs, and represent faith community by serving on a community health coalition or committee
• Identify ways (availability of space, equipment, walking trail, playground, group classes, walking clubs, distribute fitness guides, offer fitness counseling etc.) for members to be physically active
• Promote physical activity through newsletter, bulletin board, and on the faith community website
• Establish a cooking, kitchen or hospitality committee • Develop guidelines to offer healthier options for faith
community meals • Offer/organize group classes to teach healthy cooking and
nutrition, weight control counseling, and promote on faith community website
• Distribute nutrition guides/healthy recipes to members and promote nutrition and healthy eating on faith community website)

62 Rutgers Center for State Health Policy, February 2016
Table 3: Participant Demographics (N= 56) Valid%* n Gender Female 94.5 52 Male 5.5 3 Race White or Caucasian 1.8 1 Black or African American 92.7 51 American Indian or Alaska Native 0.0 0 Asian Indian 0.0 0 Chinese 0.0 0 Filipino 0.0 0 Japanese 0.0 0 Korean 0.0 0 Vietnamese 0.0 0 Other Asian 0.0 0 Native Hawaiian 0.0 0 Guamanian or Chamorro 0.0 0 Samoan 0.0 0 Other Pacific Islander 1.8 1 More than 1 race 3.6 2 Level of Education Grade 8 or below 1.8 1 Some high school 3.6 2 Grade 12 or GED 16.4 9 Some college or vocational school 29.1 16 Graduated 2 year college 14.5 8 Graduated 4 year college 18.2 10 Graduate school 16.4 9 *Does not include missing values
Table 4: Participant Demographics (N= 56) % n Hispanic, Latino, or Spanish Origin Yes 1.8 1 No 69.6 39 Missing 28.6 16 Total Household Income Less than 10,000 5.4 3 $10,000 - $24,999 8.9 5 $25,000 - $49,999 21.4 12 $50,000 $74,999 23.2 13 $75,000 - $99,999 7.1 4 $100,000 or over 8.9 5 Other (retired ) 1.8 1 Missing 23.2 13

63 Evaluation of the Faith in Prevention Initiative: Year 1 Report
Table 5: Change in Knowledge All Participants Participants with Matched Pre-
and Post-test Pre-test (N=56)*
% (n) Post-test (N=36)*
% (n) Pre-test (N=25)*
% (n)
Post-test (N=25)*
% (n) I understand what healthy food choices mean Yes 92.9 (52) 100.0 (35) 96.0 (24) 100.0 (24) No 1.8 (1) 0.0 4.0 (1) 0.0 Not sure 5.4 (3) 0.0 0.0 0.0 I know how to include healthy choices Yes 94.5 (52) 100.0 (35) 96.0 (24) 100.0 (24) No 1.8 (1) 0.0 4.0 (1) 0.0 Not sure 3.6 (2) 0.0 0.0 0.0 Read food labels Yes 67.9 (38) 71.4 (25) 68.0 (17) 83.3 (20) No 30.4 (17) 28.6 (10) 32.0 (8) 16.7 (4) Not sure 1.8 (1) 0.0 0.0 0.0 Understand food safety Yes 18.2 (10) 22.9 (8) 20.0 (5) 25.0 (6) No 78.2 (43) 77.1 (27) 76.0 (19) 75.0 (18) Not sure 3.6 (2) 0.0 0.0 0.0 I understand the benefits of physical activity Yes 94.4 (51) 100.0 (35) 96.0 (24) 100.0 (24) No 1.9 (1) 0.0 4.0 (1) 0.0 Not sure 3.7 (2) 0.0 0.0 0.0 Interested in receiving health information Yes 83.3 (45) 80.0 (28) 84.0 (21) 91.7 (22) No 11.1 (6) 20.0 (7) 8.0 (2) 8.3 (2) Not sure 5.6 (3) 0.0 8.0 (2) 0.0 *Does not include missing values
Table 6: Change in Behavior All Participants Participants with Matched Pre-
and Post-test Pre-test (N=56)*
% (n) Post-test (N=36)*
% (n)
Pre-test (N=25)*
% (n)
Post-test (N=25)*
% (n) Eat vegetables on most days Yes 87.5 (49) 94.4 (34) 92.0 (23) 100.0 (25) No 12.5 (7) 5.6 (2) 8.0 (2) 0.0 Not sure 0.0 0.0 0.0 0.0 Eat Fruits on most days Yes 77.4 (41) 85.3 (29) 68.0 (17) 87.5 (21) No 20.8 (11) 14.7 (5) 28.0 (7) 12.5 (3) Not sure 1.9 (1) 0.0 0.0 0.0

64 Rutgers Center for State Health Policy, February 2016
Table 6: Item Frequencies, Change in Behavior (contd.) All Participants Participants with Matched Pre-
and Post-test Physical activity in the past month Yes 89.1 (49) 80.0 (28) 92.0 (23) 91.7 (22) No 10.9 (6) 20.0 (7) 8.0 (2) 8.3 (2) Not sure 0.0 0.0 0.0 0.0 Prepare and eat more meals at home Yes 72.7 (40) 85.3 (29) 72.0 (18) 87.0 (20) No 25.5 (14) 14.7 (5) 28.0 (7) 13.0 (3) Not sure 1.8 (1) 0.0 0.0 0.0 Plan weekly meals Yes 24.1 (13) 39.4 (13) 16.0 (4) 50.0 (11) No 74.1 (40) 57.5 (19) 84.0 (21) 45.5 (10) Not sure 1.9 (1) 3.0 (1) 0.0 4.5 (1) Choose healthier food and control portions Yes 60.7 (34) 82.4 (28) 68.0 (17) 91.7 (22) No 30.4 (17) 14.7 (5) 24.0 (6) 8.3 (2) Not sure 8.9 (5) 1 (2.9) 8.0 (2) 0.0 Dislike healthy food choices Yes 26.4 (14) 36.4 (12) 26.1 (6) 27.3 (6) No 66.0 (35) 60.6 (20) 60.9 (14) 63.6 (14) Not sure 7.5 (4) 3.0 (1) 13.0 (3) 9.1 (2) No. of sugar sweetened beverages/day 0 29.1 (16) 25.0 (9) 29.2 (7) 28.0 (7) 1 18.2 (10) 30.6 (11) 16.7 (4) 24.0 (6) 2 32.7 (18) 33.3 (12) 29.2 (7) 40.0 (10) 3 10.9 (6) 5.6 (2) 12.5 (3) 8.0 (2) 4 or more 9.1 (5) 5.6 (2) 12.5 (3) 0.0 Try to be more physically active Yes 84.9 (45) 97.1 (34) 95.8 (23) 100.0 (24) No 13.2 (7) 2.9 (1) 4.2 (1) 0.0 Not sure 1.9 (1) 0.0 0.0 0.0 Use stairs or walk or bike to places Yes 55.6 (30) 54.3 (19) 54.2 (13) 54.2 (13) No 44.4 (24) 40.0 (14) 45.8 (11) 33.3 (8) Not sure 0.0 5.7 (2) 0.0 12.5 (3) Participate in team sports Yes 14.8 (8) 14.3 (5) 12.0 (3) 8.3 (2) No 85.2 (46) 82.9 (29) 88.0 (22) 87.5 (21) Not sure 0.0 2.9 (1) 0.0 4.2 (1) *Does not include missing values

65 Evaluation of the Faith in Prevention Initiative: Year 1 Report
Table 7: Change in My Faith Community All Participants Participants with Matched Pre- and
Post-test Pre-test (N=56)*
% (n) Post-test (N=36)*
% (n) Pre-test (N=25)*
% (n) Post-test (N=25)*
% (n) My faith community serves healthy snacks Yes 25.0 (14) 51.4 (18) 32.0 (8) 45.8 (11) No 46.4 (26) 28.6 (10) 40.0 (10) 41.7 (10) Not sure 28.6 (16) 20.0 (7) 28.0 (7) 12.5 (3) My faith community serves healthy meals Yes 33.3 (18) 57.1 (20) 40.0 (10) 54.2 (13) No 40.7 (22) 22.9 (8) 32.0 (8) 33.3 (8) Not sure 25.9 (14) 20.0 (7) 28.0 (7) 12.5 (3) My faith community has places to be physically active Yes 46.3 (25) 72.7 (24) 48.0 (12) 63.6 (14) No 46.3 (25) 27.3 (9) 44.0 (11) 36.4 (8) Not sure 7.4 (4) 0.0 8.0 (2) 0.0 *Does not include missing values
Table 8: Comparing Means, Matched Participants Participants with Matched Pre- and Post-test (N=25) Pre-test Mean Post-test Mean P value Change in Knowledge I understand what healthy food choices mean 3.0 3.0 0.33 I know how to include healthy choices 3.0 3.0 0.32 Read food labels 2.4 2.7 0.18 Understand food safety 1.5 1.5 0.86 I understand the benefits of physical activity 2.9 3.0 0.33 Interested in receiving health information 2.8 2.8 0.16 Change in behavior Eat vegetables on most days 2.8 3.0 0.16 Eat Fruits on most days 2.4 2.6 0.03 No. of sugar sweetened beverages 1.6 1.3 0.12 Physical activity in the past month 2.9 2.8 0.57 No. of times physical activity 2.8 2.7 0.69 Prepare and eat more meals at home 2.4 2.7 0.16 Plan weekly meals 1.4 2.0 0.00 Choose healthier food and control portions 2.4 2.8 0.02 Dislike healthy food choices 1.8 1.7 0.84 Try to be more physically active 2.9 3.0 0.33 Use stairs or walk or bike to places 2.1 2.2 0.87 Participate in team sports 1.3 1.2 0.79 Change in my faith community My faith community serves healthy snacks 2.0 2.0 0.65 My faith community serves healthy meals 2.1 2.2 0.52 My faith community has places to be physically active 2.1 2.3 0.36

66 Rutgers Center for State Health Policy, February 2016
Appendix C: Trenton Health Team
Table 1: Faith Community Assessment: Change in Pre/Post Test Scores
Category Scores Increased* Scores Decreased * Scores Unchanged*
Health/Wellness Infrastructure (# of items = 5)
3 2 3
Physical Activity Policies and Environment (# of items = 7)
8 0 0
Physical Activity Programs and Education (# of items = 5)
6 2 0
Healthy Eating Policies and Environments ((# of items = 6)
4 0 4
Healthy Eating Programs and Education (# of items = 6)
7 0 1
*Post-test data not available for 2 FBOs

67 Evaluation of the Faith in Prevention Initiative: Year 1 Report
Table 2: Health/Wellness Infrastructure (# of items = 5)
Faith-based Organization Pre-test Score
Post-test Score
Action Items for FBOs to Consider
Bethany Evangelical Lutheran Church
40.0% 80.0% • Sponsor health fairs for members
Bethel World Outreach 80.0% 60.0% • Sponsor health fairs for members • Represent your organization by serving on
community health coalition or committee Cadwalader Asbury United Methodist Church
40.0% 40.0% • Establish a health team or committee and appoint a person for all health related activities
• Sponsor health fairs for members Christ Episcopal Church 100.0% 60.0% • Sponsor health fairs for members
• Develop association with community health coalition or committee and another health or human services agency to represent your organization as well as provide services to members
Church of the Blessed Sacrament 80.0% 100.0% None
El Centro of Catholic Charities 40.0% 80.0% • Represent your organization by serving on community health coalition or committee
Saint Vladimir Orthodox Church 20.0% 20.0% • Establish a health team or committee and appoint a person for all health related activities
• Sponsor health fairs for members • Represent your organization by serving on
community health coalition or committee Shiloh Baptist Church 60.0% • Sponsor health fairs for members
• Represent your organization by serving on community health coalition or committee
Trinity Episcopal Church 100.0% 100.0% None
Westminster Presbyterian Church 60.0% • Sponsor health fairs for members • Represent your organization by serving on
community health coalition or committee

68 Rutgers Center for State Health Policy, February 2016
Table 3: Physical Activity Policies and Environment (# of items = 7)
Faith-based Organization Pre-test Score
Post-test Score Action Items for FBOs to Consider
Bethany Evangelical Lutheran Church
28.6% 42.9% • Identify ways (availability of space, equipment, walking trail, playground) for members to be physically active
• Develop policies for supporting physical activity opportunities at meetings or functions
Bethel World Outreach 71.4% 100.0% None
Cadwalader Asbury United Methodist Church
0.0% 14.3% • Identify ways (availability of space, equipment, walking trail, playground etc.) for members to be physically active
• Develop policies for supporting physical activity opportunities at meetings or functions
Christ Episcopal Church 42.9% 57.1% • Develop environment for increasing and promoting physical activity (e.g. walking trails, courts etc.)
• Develop policies for supporting physical activity opportunities at meetings or functions
Church of the Blessed Sacrament
28.6% 71.4% • Develop environment for increasing and promoting physical activity (e.g. walking trails, courts etc.)
El Centro of Catholic Charities
28.6% 42.9% • Identify ways (availability of space, equipment, walking trail, courts etc.) for members to be physically active
Saint Vladimir Orthodox Church
0% 57.1% • Identify ways (availability of space, equipment, walking trail, playground) for members to be physically active
Shiloh Baptist Church 14.3% Data missing • Identify ways (availability of space, equipment, walking trail, playground) for members to be physically active
• Develop policies for supporting physical activity opportunities at meetings or functions
• Request leadership to promote physical activity in a public speech or sermon
Trinity Episcopal Church 57.1% 85.7% None
Westminster Presbyterian Church
85.7% Data missing • Develop environment for increasing and promoting physical activity by making exercise equipment available

69 Evaluation of the Faith in Prevention Initiative: Year 1 Report
Table 4: Physical Activity Programs and Education (# of items = 5)
Faith-based Organization Pre-test Score Post-test Score Action Items for FBOs to Consider
Bethany Evangelical Lutheran Church
0% 20.0% • Develop programs for increasing and promoting physical activity (e.g. walking clubs, sports team)
• Promote physical activity in through posted information, bulletins, newsletter
Bethel World Outreach 100.0% 80.0% • Develop walking clubs for increasing and promoting physical activity
Cadwalader Asbury United Methodist Church
0% 20.0% • Develop programs for increasing and promoting physical activity (e.g. group classes, walking clubs, sports team)
• Promote physical activity in bulletins, newsletter Christ Episcopal Church 40.0% 100.0% None
Church of the Blessed Sacrament
100.0% 80.0% • Organize or support a sports team for members
El Centro of Catholic Charities
40.0% 80.0% • Organize or support a sports team for members
Saint Vladimir Orthodox Church
0.0% 60.0% • Develop programs for increasing and promoting physical activity (e.g. walking clubs, sports team)
Shiloh Baptist Church 20.0% Data missing • Develop programs for increasing and promoting physical activity (e.g. group classes, sports team)
• Promote physical activity in through posted information, bulletins, newsletter
Trinity Episcopal Church 0% 20.0% • Organize or support a sports team for members
Westminster Presbyterian Church
80.0% Data missing • Promote physical activity in bulletins, newsletter

70 Rutgers Center for State Health Policy, February 2016
Table 5: Healthy Eating Policies and Environments (# of items = 6)
Faith-based Organization Pre-test Score Post-test Score Action Items for FBOs to Consider
Bethany Evangelical Lutheran Church
33.3% 83.3% • Plan to buy an equipment (e.g. steamers, blenders etc.) that supports healthier meal preparation
Bethel World Outreach 83.3% 83.3% • Develop community garden for members to share work and benefits
Cadwalader Asbury United Methodist Church
50.0% 50.0% • Develop community garden for members to share work and benefits
• Create a private and comfortable space for women to breastfeed
• Plan to buy an equipment (e.g. steamers, blenders etc.) that supports healthier meal preparation
Christ Episcopal Church 33.3% 100.0% None
Church of the Blessed Sacrament
50.0% 83.3% • Develop community garden for members to share work and benefits
El Centro of Catholic Charities
50.0% 50.0% • Develop community garden for members to share work and benefits
• Develop guidelines to offer healthier options for faith community meals
• Plan to buy an equipment (e.g. steamers, blenders etc.) that supports healthier meal preparation
Saint Vladimir Orthodox Church
16.7% 83.3% • Develop guidelines to offer healthier options for faith community meals
Shiloh Baptist Church 33.3% Data missing • Develop community garden for members to share work and benefits
• Develop guidelines to offer healthier options for faith community meals
• Request leadership to promote healthy eating in a public speech
• Create a private and comfortable space for women to breastfeed
Trinity Episcopal Church 100.0% 100.0% None
Westminster Presbyterian Church
83.3% Data missing • Plan to buy an equipment (e.g. steamers, blenders etc.) that supports healthier meal preparation

71 Evaluation of the Faith in Prevention Initiative: Year 1 Report
Table 6: Healthy Eating Programs and Education (# of items = 6)
Faith-based Organization Pre-test Score Post-test Score Action items for FBOs to Consider
Bethany Evangelical Lutheran Church
0% 100.0% None
Bethel World Outreach 0% 66.7% • Offer/organize weight loss support groups and nutrition related classes
Cadwalader Asbury United Methodist Church
66.7% 66.7% • Offer/organize weight loss support groups and nutrition related classes
Christ Episcopal Church 50.0% 83.3% • Offer/organize weight loss support groups
Church of the Blessed Sacrament
83.3% 100.0% None
El Centro of Catholic Charities
0% 83.3% • Offer/organize weight loss support groups
Saint Vladimir Orthodox Church
66.7% 83.3% • Offer/organize weight loss support groups
Shiloh Baptist Church 16,7% Data missing • Offer/organize weight loss support groups and nutrition related classes
• Distribute healthy eating guides or health recipes
• Promote healthy eating through posted information, bulletins, programs or news letter
Trinity Episcopal Church 83.3% 100.0% None
Westminster Presbyterian Church
83.3% Data missing • Offer/organize weight loss support groups

72 Rutgers Center for State Health Policy, February 2016
Eat Smart, Move More Member Health and Interest Survey (N=163)
Table 7: Item Frequencies, Healthy Eating and Physical Activity Habits
Valid %* n
Nutrition
Eat 2-3 cups of vegetables on most days
Yes 46.4 58 No 38.4 48
Not sure 15.2 19 Missing** 38
Eat 1.5-2 cups of fruits on most days
Yes 58.5 72 No 33.3 41
Not sure 8.1 10 Missing** 40
Drink regular (not diet) soda every day
Yes 24.2 30 No 72.6 90
Not sure 3.2 4 Missing** 39
Physical Activity
I do moderate or vigorous physical activity on most days for
Less than 30 mins 44.4 55 30-60 mins 38.7 48
More than 1 hour 16.9 21 Missing** 39
*Does not include missing values **36 participants completed the Spanish version of the pre-test where this question was different or missing

73 Evaluation of the Faith in Prevention Initiative: Year 1 Report
Table 8: Item Frequencies, Interest in Learning About Healthy Food and Physical Activity
I am interested in - Valid%* n
learning about healthy food choices Yes 95.6 151 No 3.2 5
Not sure 1.3 2
learning about incorporating fruits and vegetables into my diet
Yes 92.9 144 No 6.5 10
Not sure 0.6 1
learning about healthier food choices and portion size to help manage my weight
Yes 94.4 119 No 4.0 5
Not sure 1.6 2
participating in “tasting” events to sample healthy foods
Yes 93.1 149 No 2.5 4
Not sure 4.4 7
learning about benefits of physical activity
Yes 91.9 147 No 5.0 8
Not sure 3.1 5
increasing my physical activity level Yes 93.1 149 No 3.1 5
Not sure 3.8 6
walking to increase my physical activity level
Yes 90.9 140 No 5.8 9
Not sure 3.2 5
participating in team activities Yes 75.0 117 No 9.0 14
Not sure 16.0 25 *Does not include missing values

74 Rutgers Center for State Health Policy, February 2016
Table 9: Item Frequencies, Interest in Seeing Changes in the Faith Community
I am interested in - Valid%* n
having healthy snacks available in our faith community
Yes 95.5 148 No 1.9 3
Not sure 2.6 4
having healthy meals served in our faith community**
Yes 92.7 114 No 4.9 6
Not sure 2.4 3
seeing more places to be physically active in our faith community
Yes 92.3 144 No 2.6 4
Not sure 5.1 8 seeing our leaders talk about healthy eating and physical activity in sermons , messages or other talks
Yes 64.7 97 No 24.7 37
Not sure 10.7 16 seeing regular classes on physical activity or healthy eating offered in my faith community**
Yes 90.4 104 No 3.5 4
Not sure 6.1 7 **36 participants completed the Spanish version of the pre-test where this question was different *Does not include missing values
Table 10: Item Frequencies, Interest in Participation in Health Activities
I would like to - Valid%* n
participate in health activities before services
Yes 49.0 77 No 31.2 49
Not sure 19.7 31
participate in health activities after services
Yes 46.5 72 No 36.1 56
Not sure 17.4 27 participate in health activities like physical activity breaks or healthy food tastings during regularly scheduled faith community events**
Yes 79.2 99 No 8.0 10
Not sure 12.8 16
**36participants completed the Spanish version of the pre-test where this question was different *Does not include missing values
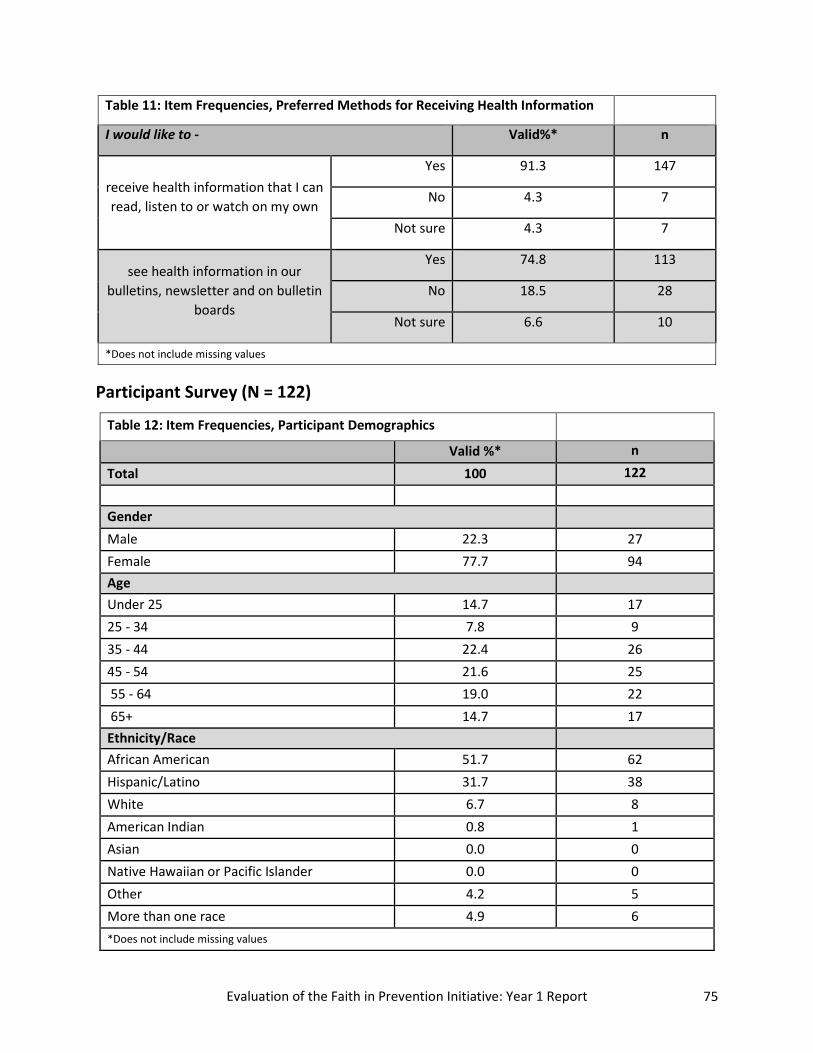
75 Evaluation of the Faith in Prevention Initiative: Year 1 Report
Table 11: Item Frequencies, Preferred Methods for Receiving Health Information
I would like to - Valid%* n
receive health information that I can read, listen to or watch on my own
Yes 91.3 147
No 4.3 7
Not sure 4.3 7
see health information in our bulletins, newsletter and on bulletin
boards
Yes 74.8 113
No 18.5 28
Not sure 6.6 10
*Does not include missing values Participant Survey (N = 122)
Table 12: Item Frequencies, Participant Demographics
Valid %* n
Total 100 122
Gender
Male 22.3 27 Female 77.7 94 Age Under 25 14.7 17 25 - 34 7.8 9 35 - 44 22.4 26 45 - 54 21.6 25 55 - 64 19.0 22 65+ 14.7 17 Ethnicity/Race African American 51.7 62 Hispanic/Latino 31.7 38 White 6.7 8 American Indian 0.8 1 Asian 0.0 0 Native Hawaiian or Pacific Islander 0.0 0 Other 4.2 5 More than one race 4.9 6 *Does not include missing values

76 Rutgers Center for State Health Policy, February 2016
Table 13: Item Frequencies, Program Effect As a result of this program, I -
Valid%* n
am physically active at least 30 minutes most days
Yes 66.9 79 No 7.6 9 I was already doing this 25.4 30
eat smaller portion Yes 77.7 94 No 10.7 13 I was already doing this 11.6 14
eat less fast food Yes 68.9 82 No 7.6 9 I was already doing this 23.5 28
drink fewer calorie containing beverages
Yes 67.8 80 No 6.8 8 I was already doing this 25.4 30
prepare and eat more meals at home Yes 60.5 72 No 6.7 8 I was already doing this 32.8 39
eat breakfast most days Yes 54.5 66 No 25.6 31 I was already doing this 19.8 24
eat 2-3 cups of vegetables on most days
Yes 62.5 75 No 25.0 30 I was already doing this 12.5 15
eat 1.5 – 2 cups of fruits on most days
Yes 60.7 71 No 25.6 30 I was already doing this 13.7 16
am more mindful of what and how much I eat
Yes 84.3 102 No 5.8 7 I was already doing this 9.9 12
am more mindful of getting physical activity each day
Yes 78.3 94 No 4.2 5 I was already doing this 17.5 21
limit screen time for myself Yes 63.6 77 No 19.8 24 I was already doing this 16.5 20
limit screen time for my family Yes 61.1 69 No 22.1 25 I was already doing this 16.8 19
*Does not include missing values

77 Evaluation of the Faith in Prevention Initiative: Year 1 Report
Eat Smart, Move More Member Health and Interest Survey: Pre- and Three Month Post-test Comparison
Table 14: Item Frequencies, Healthy Eating and Physical Activity Habits
Pre-test (N=22) %* (n)
3 Month Post-test (N=25) %*(n)
Nutrition
Eat 2-3 cups of vegetables on most days
Yes 36.4 (8) 68.0 (17) No 54.5 (12) 28.0 (7)
Not sure 9.1 (2) 4.0 (1)
Eat 1.5-2 cups of fruits on most days Yes 66.7 (14) 75.0 (18) No 28.6 (6) 20.8 (5)
Not sure 4.8 (1) 4.2 (1)
Drink regular (not diet) soda every day
Yes 27.3 (6) 24.0 (6) No 68.2 (15) 76.0 (19)
Not sure 4.5 (1) 0.0 Physical Activity
I do moderate or vigorous physical activity on most days for
Less than 30 mins 50.0 (11) 41.7 (10) 30-60 mins 27.3 (6) 37.5 (9)
More than 1 hour 22.7 (5) 20.8 (5) *Does not include missing values

78 Rutgers Center for State Health Policy, February 2016
Table 15: Item Frequencies, Interest in Learning About Healthy Food and Physical Activity
I am interested in - Pre-test (N=22)
%* (n)
3 Month Post-test (N=25) %*(n)
learning about healthy food choices Yes 95.5 (21) 95.8 (23) No 0.0 4.2 (1)
Not sure 4.5 (1) 0.0
learning about incorporating fruits and vegetables into my diet
Yes 80.0 (16) 82.6 (19) No 15.0 (3) 13.0 (3)
Not sure 5.0 (1) 4.3 (1)
learning about healthier food choices and portion size to help manage my weight
Yes 90.5 (19) 91.3 (21) No 4.8 (1) 4.3 (1)
Not sure 4.8 (1) 4.3 (1)
participating in “tasting” events to sample healthy foods
Yes 86.4 (19) 87.0 (20) No 0.0 4.3 (1)
Not sure 13.6 (3) 8.7 (2)
learning about benefits of physical activity
Yes 86.4 (19) 83.3 (20) No 9.1 (2) 8.3 (2)
Not sure 4.5 (1) 8.3 (2)
increasing my physical activity level Yes 81.8 (18) 75.0 (18) No 0.0 8.3 (2)
Not sure 18.2 (4) 16.7 (4)
walking to increase my physical activity level
Yes 78.9 (15) 80.0 (20) No 0.0 20.0 (5)
Not sure 21.1 (4) 0.0
participating in team activities Yes 57.1 (12) 68.0 (17) No 9.5 (2) 16.0 (4)
Not sure 33.3 (7) 16.0 (4) *Does not include missing values

79 Evaluation of the Faith in Prevention Initiative: Year 1 Report
Table 16: Item Frequencies, Interest in Seeing Changes in the Faith Community
I am interested in - Pre-test (N=22)
%* (n)
3 Month Post-test (N=25) %*(n)
having healthy snacks available in our faith community
Yes 95.2 (20) 95.7 (22) No 0.0 4.3 (1)
Not sure 4.8 (1) 0.0
having healthy meals served in our faith community
Yes 90.0 (18) 83.3 (20) No 5.0 (1) 16.7 (4)
Not sure 5.0 (1) 0.0
seeing more places to be physically active in our faith community
Yes 81.8 (18) 80.0 (20) No 18.2 (4) 4.0 (1)
Not sure 0.0 16.0 (4)
seeing our leaders talk about healthy eating and physical activity in sermons , messages or other talks
Yes 63.6 (14) 78.3 (18) No 18.2 (4) 17.4 (4)
Not sure 18.2 (4) 4.3 (1)
seeing regular classes on physical activity or healthy eating offered in my faith community
Yes 80.0 (16) 87.5 (21) No 10.0 (2) 4.2 (1)
Not sure 10.0 (2) 8.3 (2) *Does not include missing values
Table 17: Item Frequencies, Interest in Participation in Health Activities
I would like to - Pre-test (N=22)
%* (n)
3 Month Post-test (N=25) %*(n)
participate in health activities before services
Yes 50.0 (11) 52.2 (12) No 22.7 (5) 30.4 (7)
Not sure 27.3 (6) 17.4 (4)
participate in health activities after services
Yes 47.6 (10) 52.2 (12) No 33.3 (7) 30.4 (7)
Not sure 19.0 (4) 17.4 (4) participate in health activities like physical activity breaks or healthy food tastings during regularly scheduled faith community events
Yes 77.3 (17) 90.9 (20) No 13.6 (3) 0.0
Not sure 9.1 (2) 9.1 (2)
**Does not include missing values

80 Rutgers Center for State Health Policy, February 2016
Table 18: Item Frequencies, Preferred Methods for Receiving Health Information
I would like to - Pre-test (N=22)
%* (n)
3 Month Post-test (N=25) %*(n)
receive health information that I can read, listen to or watch on my own
Yes 90.9 (20) 96.0 (24) No 0.0 0.0
Not sure 9.1 (2) 0.0
see health information in our bulletins, newsletter and on bulletin boards
Yes 85.7 (18) 88.0 (22) No 9.5 (2) 4.0 (1)
Not sure 4.8 (1) 8.0 (2) *Does not include missing values

81 Evaluation of the Faith in Prevention Initiative: Year 1 Report
Appendix D: Survey Instruments Continued on next page.

Faith Community Assessment
General Information Date:___/____/
Name of Faith Organization: __________________________________________ Address of Faith Organization: ________________________________________
Phone Number of Faith Organization: ______________________________________ County: ______________Person conducting survey: _________________
Name and title of interviewee:
Phone number of interviewee:
Email address of interviewee:
PROFILE OF THE FAITH COMMUNITY
1. Faith Tradition: A.M.E. Zion Baptist (not specified) Baptist (Southern) Baptist–GBSC Episcopal Disciples of Christ Greek Orthodox Jewish (Reform) Latter Day Saints Jewish (Conservative) Jewish (Orthodox) Presbyterian Church of Am. Lutheran Methodist United Church of Christ Pentecostal Presbyterian (USA) Hindu Roman Catholic Seventh Day Adventist Muslim Non-denominational Christian Inter-denominational Christian Buddhist Other Tradition: _________________________________________________________________
2. What is interviewee’s role in the organization?
Pastor/Priest/Rabbi/Imam Deacon Member Other: ________________________________________________________________________________________
3. About what percent of the faith community is made up of:
_____ Hispanics _____ White _____ Black or African American
_____ American Indian or Alaska Native _____ Native Hawaiian _____ Vietnamese
_____ Asian Indian _____ Guamanian or Chamorro _____ Korean _____ Chinese _____ Samoan _____ Japanese _____ Filipino _____ Other Pacific Islander _____ Other Asian
NJDOH Faith in
Prevention Initiative
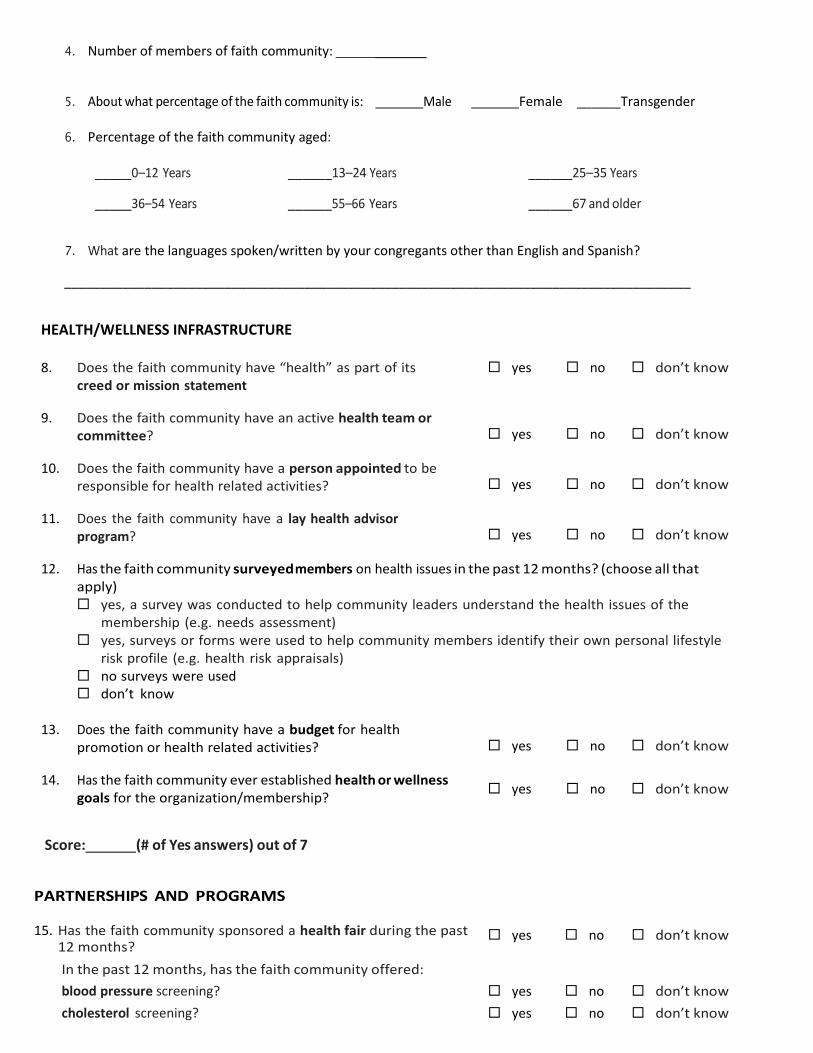
4. Number of members of faith community: _______
5. About what percentage of the faith community is: Male Female ______Transgender
6. Percentage of the faith community aged:
_____0–12 Years
______13–24 Years ______25–35 Years
_____36–54 Years ______55–66 Years ______67 and older 7. What are the languages spoken/written by your congregants other than English and Spanish? ______________________________________________________________________________________
HEALTH/WELLNESS INFRASTRUCTURE
8. Does the faith community have “health” as part of its yes no don’t know creed or mission statement
9. Does the faith community have an active health team or committee?
yes no don’t know
10. Does the faith community have a person appointed to be responsible for health related activities?
yes no don’t know
11. Does the faith community have a lay health advisor program?
yes no don’t know
12. Has the faith community surveyed members on health issues in the past 12 months? (choose all that apply) yes, a survey was conducted to help community leaders understand the health issues of the
membership (e.g. needs assessment) yes, surveys or forms were used to help community members identify their own personal lifestyle
risk profile (e.g. health risk appraisals) no surveys were used don’t know
13. Does the faith community have a budget for health
promotion or health related activities?
yes no don’t know
14. Has the faith community ever established health or wellness goals for the organization/membership? yes no don’t know
Score: (# of Yes answers) out of 7
PARTNERSHIPS AND PROGRAMS
15. Has the faith community sponsored a health fair during the past 12 months?
yes no don’t know
In the past 12 months, has the faith community offered:
blood pressure screening? yes no don’t know cholesterol screening? yes no don’t know

blood sugar/diabetes screening? yes no don’t know healthy body weight screening? yes no don’t know
16. Has the faith community participated in a parish nursing program within the past 12 months?
yes no don’t know
17. Do any members currently represent the faith community by
serving on a community health coalition or committee (e.g. fitness/nutrition council)?
yes no don’t know
18. Has the faith community had a relationship with another health, health promotion, or human services agency to provide services to members in the past 12 months?
yes no don’t know
If so, what are those agencies?
Agency 1: _______________________________ Agency 2: ___________________________________ Agency 3: _______________________________ Agency 4: ___________________________________
Score: (# of Yes answers) out of 8 PEOPLE
19. How many of the following people are members of this faith community? Physicians/doctors _____________ Other health professionals ________________ Dentists _________________________ Type of health professionals counted above:
________________________________________ Nurses/CNAs ___________________ Health educators _______
PHYSICAL ACTIVITY—ENVIRONMENT
20. Does the faith community have an exercise room? yes no don’t know
21. Does the faith community have any exercise equipment on-site? yes no don’t know
22. Does the faith community have a walking trail? yes no don’t know
23. Does the faith community have any outdoor courts or ball fields? yes no don’t know
24. Does the faith community have a playground? yes no don’t know
Score: (# of Yes answers) out of 5
PHYSICAL ACTIVITY—POLICIES AND LEADERSHIP
25. Does the faith community have a policy supporting physical activity
opportunities at meetings or functions (e.g. walks, exercise breaks)? yes no don’t know
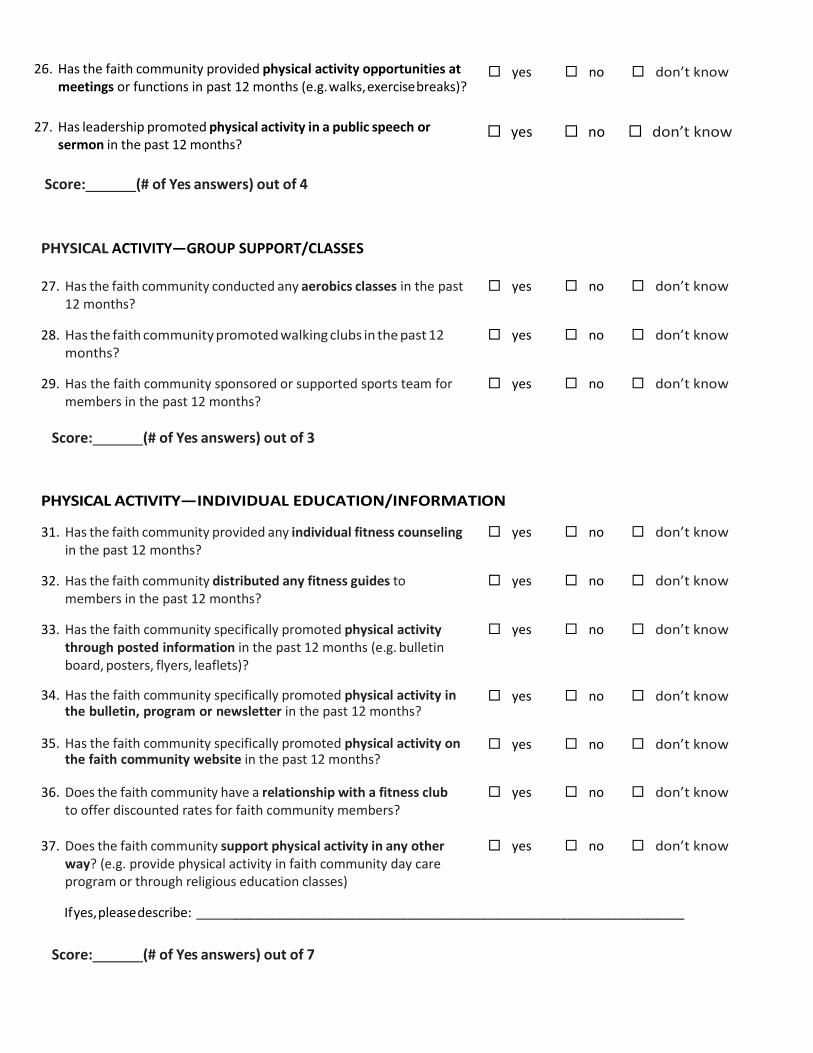
26. Has the faith community provided physical activity opportunities at
meetings or functions in past 12 months (e.g. walks, exercise breaks)? yes no don’t know
27. Has leadership promoted physical activity in a public speech or sermon in the past 12 months?
yes no don’t know
Score: (# of Yes answers) out of 4
PHYSICAL ACTIVITY—GROUP SUPPORT/CLASSES 27. Has the faith community conducted any aerobics classes in the past
12 months?
yes no don’t know
28. Has the faith community promoted walking clubs in the past 12 months?
yes no don’t know
29. Has the faith community sponsored or supported sports team for members in the past 12 months?
yes no don’t know
Score: (# of Yes answers) out of 3
PHYSICAL ACTIVITY—INDIVIDUAL EDUCATION/INFORMATION 31. Has the faith community provided any individual fitness counseling
in the past 12 months?
yes no don’t know
32. Has the faith community distributed any fitness guides to members in the past 12 months?
yes no don’t know
33. Has the faith community specifically promoted physical activity through posted information in the past 12 months (e.g. bulletin board, posters, flyers, leaflets)?
yes no don’t know
34. Has the faith community specifically promoted physical activity in the bulletin, program or newsletter in the past 12 months?
yes no don’t know
35. Has the faith community specifically promoted physical activity on the faith community website in the past 12 months?
yes no don’t know
36. Does the faith community have a relationship with a fitness club to offer discounted rates for faith community members?
yes no don’t know
37. Does the faith community support physical activity in any other way? (e.g. provide physical activity in faith community day care program or through religious education classes)
yes no don’t know
If yes, please describe: ______________________________________________________________
Score: (# of Yes answers) out of 7
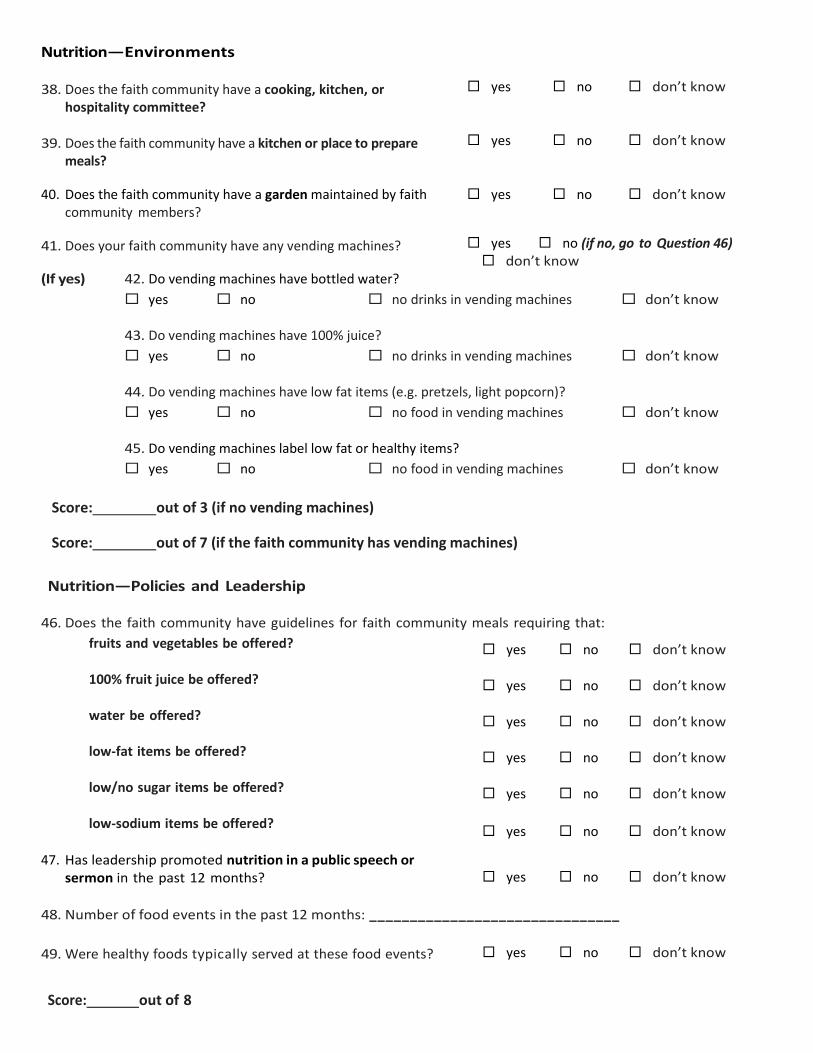
Nutrition—Environments
38. Does the faith community have a cooking, kitchen, or hospitality committee?
yes no don’t know
39. Does the faith community have a kitchen or place to prepare meals?
yes no don’t know
40. Does the faith community have a garden maintained by faith community members?
yes no don’t know
41. Does your faith community have any vending machines? yes no (if no, go to Question 46) don’t know
(If yes) 42. Do vending machines have bottled water? yes no no drinks in vending machines don’t know
43. Do vending machines have 100% juice? yes no no drinks in vending machines don’t know
44. Do vending machines have low fat items (e.g. pretzels, light popcorn)? yes no no food in vending machines don’t know
45. Do vending machines label low fat or healthy items? yes no no food in vending machines don’t know
Score: out of 3 (if no vending machines)
Score: out of 7 (if the faith community has vending machines)
Nutrition—Policies and Leadership
46. Does the faith community have guidelines for faith community meals requiring that: fruits and vegetables be offered?
yes no don’t know
100% fruit juice be offered?
yes no don’t know
water be offered?
yes no don’t know
low-fat items be offered?
yes no don’t know
low/no sugar items be offered?
yes no don’t know
low-sodium items be offered?
yes no don’t know
47. Has leadership promoted nutrition in a public speech or sermon in the past 12 months?
yes no don’t know
48. Number of food events in the past 12 months: _______________________________
49. Were healthy foods typically served at these food events? yes no don’t know Score: out of 8

Nutrition—Group Support/Classes 50. Has the faith community had any healthy cooking classes in past
12 months?
yes no don’t know
51. Has the faith community offered or organized any weight loss support groups in past 12 months?
yes no don’t know
52. Has the faith community provided any other nutrition-related classes or groups in the past 12 months?
yes no don’t know
Score: ______out of 3
Nutrition — Individual Education/Information 53. Has the faith community provided any individual weight control
or nutrition counseling in past 12 months?
yes no don’t know
54. Has the faith community distributed any nutrition guides or healthy recipes (including cookbooks) to faith community members in the past 12 months?
yes no don’t know
55. Has the faith community promoted nutrition through posted information (e.g. posters, flyers, leaflets) in the past 12 months?
yes no don’t know
56. Has the faith community promoted nutrition in the bulletin, program or newsletter in the past 12 months?
yes no don’t know
57. Has the faith community promoted nutrition on the faith community website in the past 12 months?
yes no don’t know
58. Does the faith community support nutrition in any other way? (e.g. healthy food guidelines for faith community day care program, for meals for seniors or needy families)
yes no don’t know
If yes, please describe: ______________________________________________________________
Score: ______________out of 6
Relationship Between Religion and Health In Faith Community
58. What are some key teachings about health in the faith community? ______________________________________________________________________________________ ____________________________________________________________________________________________ ____________________________________________________________________________________________
59. What are some key scriptures, inspirational passages or religious teachings about health from this community’s
faith tradition? ___________________________________________________________________________________ ____________________________________________________________________________________________ ____________________________________________________________________________________________

60. Why is it important to participate in the Faith in Prevention program?
____________________________________________________________________________________________ ____________________________________________________________________________________________ ____________________________________________________________________________________________
Scoring: Health/Wellness Nutrition Health/Wellness Infrastructure: of 7 Nutrition Environments:_________ of 3 or 7
(dependent on vending machine) Health/Wellness Percentage: _____ Nutrition Environments Percentage: Partnerships and Programs: _______of 8 Nutrition Policies and Leadership: _______of 8 Partnerships and Programs Percentage: _____ Nutrition Policies and Leadership Percentage: _ Physical Activity Nutrition Group Support/Classes: _________of 3 Nutrition Group Support/Classes Percentage: _ Physical Activity Environments: ______of 5 Physical Activity Environments Percentage: _____ Nutrition Individual Education/Information: _____of 6
Nutrition Individual Education/ Information Percentage: _____
Physical Activity Policies and Leadership: _______of 4 Physical Activity Policies and Leadership Percentage:_________ Physical Activity Physical Activity Group Support/Classes: _______of 3 Area with highest percentage (e.g. environment, group,
individual, etc.):__________________
Physical Activity Group Support/Classes Percentage:________ Area with lowest percentage (e.g. environment, group, individual, etc.): __________________
Physical Activity Individual Education/ Information: ____of 7 Physical Activity Individual Education/Information Percentage: _______
Nutrition
Area with highest percentage (e.g. environment, group, individual, etc.): ___________________
Area with lowest percentage (e.g. environment, group, individual, etc.): __________________
*This survey is adapted from North Carolina’s Faithful Families Eating Smart and Moving More Program

Faith in Prevention Member Health and Interest Survey*
Pre-Workshop Participant Survey
Directions: The survey will take approximately 10 minutes to complete. Your participation is completely voluntary and confidential and our report will include only total information. Please read each statement or question carefully and give the response that best describes you. Your responses are very important to us. ID Number: _____________ Date: _________________ Zip Code: _________________ 1. I eat vegetables most days. � Yes � No � Not Sure 2. If you answered yes to Question 1, on average, how many servings of vegetables do you eat per day?
Some examples of one serving of vegetables are 1 cup of raw, leafy vegetables like lettuce or greens (about the size of a baseball), or ½ cup of chopped vegetables such as carrots (about the size of a computer mouse).
� 1 � 4 � 7 � 10 or more � 2
� 5
� 8
� 3
� 6 � 9
3. I eat fruits most days. � Yes � No � Not Sure 4. If you answered yes to Question 3, on average, how many servings of fruit do you eat per day? Some
examples of one serving of fruit would be one medium apple, orange, pear, or banana, or ½ cup of chopped or canned fruit (about the size of a computer mouse).
� 1 � 4 � 7 � 10 or more � 2
� 5
� 8
� 3
� 6 � 9
5. On a typical day, how many times do you drink sweetened beverages, not including diet or sugar-free
beverages?
� One time � Four or More Times � Two Times � None � Three Times

6. During the past month, other than your regular job, did you participate in any physical activities or
exercises such as running, golf, gardening, or walking for exercise? � Yes � No � Not Sure 7. If you answered yes to Question 6, how many times per week did you take part in these activities
during the past month?
� One time � Four or More Times � Two Times � None � Three Times
Please check the box that best describes you: 8. I understand what healthy food choices mean.
� Yes � No � Not Sure
9. I prepare and eat more meals at home. � Yes � No � Not Sure
10. I plan weekly meals and make a grocery list of the planned menu. � Yes � No � Not Sure
11. I know how to include fruits and vegetables into my diet. � Yes � No � Not Sure
12. I often choose healthier food and control portions of my food to manage my weight. � Yes � No � Not Sure
13. I don’t like the taste of many foods that are called healthy. � Yes � No � Not Sure
14. When shopping for food, I look at the food label before buying. � Yes � No � Not Sure
15. Sometimes I leave foods such as meat, dairy products out of the refrigerator for more than 2 hours. � Yes � No � Not Sure
16. My faith community serves healthy snacks. � Yes � No � Not Sure
17. My faith community serves healthy meals. � Yes � No � Not Sure 18. I understand the benefits of physical activity and how it
can make me healthier. � Yes � No � Not Sure
19. I try to be more physically active. � Yes � No � Not Sure 20. I use stairs instead of elevator, or walk or bike to places
instead of driving to increase my physical activity level.
� Yes � No � Not Sure
21. I participate in team activities (e.g. basketball, baseball, soccer, other). � Yes � No � Not Sure
22. My faith community has places available for me to be physically active (gym, playground, fitness room). � Yes � No � Not Sure
23. I would like to receive health information that I can read, listen to or watch on my own. � Yes � No � Not Sure

24. Are there reasons why you cannot find healthy food choices in your neighborhood? Tell us what those
reasons are. ____________________________________________________________________________________________________________________________________________________________________________________________________________________________________________________________________________________________________________________________________________________________________________________________________________________________________________________________________________________
25. What is your gender? � Male � Female � Transgender
26. What is your highest grade completed in school? � Grade 8 or below � Some college � Some high school � Graduated 2 year college � Grade 12 or GED � Graduated 4 year college � Post graduate
27. Are you Hispanic, Latino/a, or Spanish origin (one or more categories may be selected)
� No, not of Hispanic, Latino/a, or Spanish origin � Yes, Mexican, Mexican American, Chicano/a � Yes, Puerto Rican � Yes, Cuban � Yes, another Hispanic, Latino, or Spanish origin
28. What is your race? (One or more categories may be selected)
� White � Korean � Black or African American � Vietnamese � American Indian or Alaska Native � Other Asian � Asian Indian � Native Hawaiian � Chinese � Guamanian or Chamorro � Filipino � Samoan � Japanese � Other Pacific Islander
29. At this time what is your total household income? (The information provided is completely
confidential) � Less than 10,000 � $50,000 - $74,999 � $10,000 - $24,999 � $75,000 - $99,999 � $25,000 - $49,999 � $100,000 or over
30. What is your height? ______________feet ____inches (________________________)

31. What is your weight? ____ (________________________) 32. How important is your faith or spirituality to your physical health (check one)?
Very important Important A little important
Not important
33. If you answered important, very important or moderately important to the question above, why is your faith or spirituality important to your physical health?
________________________________________________________________________________________________________ _______________________________________________________________________________________________________ ________________________________________________________________________________________________________ ________________________________________________________________________________________________________
34. When would you like to participate in events or programs around healthy eating and physical activity in your faith community (check all that apply)?
Before services Friday evenings After services Saturdays Sundays Other: _______________ Wednesday evenings
35. How would you like to receive information about eating smart and moving more (check all that apply)? Bulletin inserts, program inserts or newsletter articles
Incorporated into weekly sermons, homilies, or leader’s lessons
Educational classes (Sunday School or Bible Study/Weekly Scripture) Mailed to my home
Other: _________________
General Comments, Questions or Suggestions for the Faith in Prevention Program: ___________________________________________________________________________________________________________________________________________________________________________________________________________________________________________________________________________________________________________________________________________________________________________________________________________________________________________________________________________________________
Thank you for completing the survey
*This survey is adapted from North Carolina’s Faithful Families Eating Smart and Moving More Program

Faith in Prevention Member Health and Interest Survey*
Post-Workshop Participant Survey
Directions: The survey will take approximately 10 minutes to complete. Your participation is completely voluntary and confidential and our report will include only total information. Please read each statement or question carefully and give the response that best describes you. Your responses are very important to us. ID Number: _____________ Date: _________________ Zip Code: _________________ 1. I eat vegetables most days. � Yes � No � Not Sure 2. If you answered yes to Question 1, on average, how many servings of vegetables do you eat per day?
Some examples of one serving of vegetables are 1 cup of raw, leafy vegetables like lettuce or greens (about the size of a baseball), or ½ cup of chopped vegetables such as carrots (about the size of a computer mouse).
� 1 � 4 � 7 � 10 or more � 2
� 5
� 8
� 3
� 6 � 9
3. I eat fruits most days. � Yes � No � Not Sure 4. If you answered yes to Question 3, on average, how many servings of fruit do you eat per day? Some
examples of one serving of fruit would be one medium apple, orange, pear, or banana, or ½ cup of chopped or canned fruit (about the size of a computer mouse).
� 1 � 4 � 7 � 10 or more � 2
� 5
� 8
� 3
� 6 � 9
5. On a typical day, how many times do you drink sweetened beverages, not including diet or sugar-free
beverages?
� One time � Four or More Times � Two Times � None � Three Times

6. During the past month, other than your regular job, did you participate in any physical activities or
exercises such as running, golf, gardening, or walking for exercise? � Yes � No � Not Sure 7. If you answered yes to Question 6, how many times per week did you take part in these activities
during the past month?
� One time � Four or More Times � Two Times � None � Three Times
Please check the box that best describes you: 8. I understand what healthy food choices mean.
� Yes � No � Not Sure
9. I prepare and eat more meals at home. � Yes � No � Not Sure
10. I plan weekly meals and make a grocery list of the planned menu. � Yes � No � Not Sure
11. I know how to include fruits and vegetables into my diet. � Yes � No � Not Sure
12. I often choose healthier food and control portions of my food to manage my weight. � Yes � No � Not Sure
13. I don’t like the taste of many foods that are called healthy. � Yes � No � Not Sure
14. When shopping for food, I look at the food label before buying. � Yes � No � Not Sure
15. Sometimes I leave foods such as meat, dairy products out of the refrigerator for more than 2 hours. � Yes � No � Not Sure
16. My faith community serves healthy snacks. � Yes � No � Not Sure
17. My faith community serves healthy meals. � Yes � No � Not Sure 18. I understand the benefits of physical activity and how it
can make me healthier. � Yes � No � Not Sure
19. I try to be more physically active. � Yes � No � Not Sure 20. I use stairs instead of elevator, or walk or bike to places
instead of driving to increase my physical activity level.
� Yes � No � Not Sure
21. I participate in team activities (e.g. basketball, baseball, soccer, other). � Yes � No � Not Sure
22. My faith community has places available for me to be physically active (gym, playground, fitness room). � Yes � No � Not Sure
23. I would like to receive health information that I can read, listen to or watch on my own. � Yes � No � Not Sure

24. Are there reasons why you cannot find healthy food choices in your neighborhood? Tell us what those
reasons are. ____________________________________________________________________________________________________________________________________________________________________________________________________________________________________________________________________________________________________________________________________________________________________________________________________________________________________________________________________________________
25. What is your gender? � Male � Female � Transgender
26. What is your highest grade completed in school? � Grade 8 or below � Some college � Some high school � Graduated 2 year college � Grade 12 or GED � Graduated 4 year college � Post graduate
27. Are you Hispanic, Latino/a, or Spanish origin (one or more categories may be selected)
� No, not of Hispanic, Latino/a, or Spanish origin � Yes, Mexican, Mexican American, Chicano/a � Yes, Puerto Rican � Yes, Cuban � Yes, another Hispanic, Latino, or Spanish origin
28. What is your race? (One or more categories may be selected)
� White � Korean � Black or African American � Vietnamese � American Indian or Alaska Native � Other Asian � Asian Indian � Native Hawaiian � Chinese � Guamanian or Chamorro � Filipino � Samoan � Japanese � Other Pacific Islander
29. At this time what is your total household income? (The information provided is completely
confidential) � Less than 10,000 � $50,000 - $74,999 � $10,000 - $24,999 � $75,000 - $99,999 � $25,000 - $49,999 � $100,000 or over
30. What is your height? ______________feet ____inches (________________________)

31. What is your weight? ____ (________________________) 32. How important is your faith or spirituality to your physical health (check one)?
Very important Important A little important
Not important
33. If you answered important, very important or moderately important to the question above, why is your faith or spirituality important to your physical health?
________________________________________________________________________________________________________ _______________________________________________________________________________________________________ ________________________________________________________________________________________________________ ________________________________________________________________________________________________________
34. When would you like to participate in events or programs around healthy eating and physical activity in your faith community (check all that apply)?
Before services Friday evenings After services Saturdays Sundays Other: _______________ Wednesday evenings
35. How would you like to receive information about eating smart and moving more (check all that apply)? Bulletin inserts, program inserts or newsletter articles
Incorporated into weekly sermons, homilies, or leader’s lessons
Educational classes (Sunday School or Bible Study/Weekly Scripture) Mailed to my home
Other: _________________
General Comments, Questions or Suggestions for the Faith in Prevention Program: ___________________________________________________________________________________________________________________________________________________________________________________________________________________________________________________________________________________________________________________________________________________________________________________________________________________________________________________________________________________________
Thank you for completing the survey
*This survey is adapted from North Carolina’s Faithful Families Eating Smart and Moving More Program

Appendix A. Faith Community Health Assessment Survey
Faith Community Health Assessment SuiveyFaith Community Name:
Date of Survey:
Please read each statement carefully and check the response that best describes our faith community.
Section I: Health and Wellness
1. Does our faith community have an active health teamor committee?
2. Does our faith community have a person appointedto be responsible for health related activities?
3. Has our faith community sponsored or helped sponsor ahealth fair during the past 12 months?
4. Do any members currently represent our faith communityby serving on a community health coalition or committee(e.g. fitness/nutrition council)?
5. Has our faith community had a relationship with anotherhealth, health promotion, or human services agency toprovide services to our members in the past 12 months?
Section II: Physical Activity—Policies and Environments
6. Does our faith community have an exercise room?
7. Does our faith community have any exercise equipmenton-site?
8. Does our faith community have a walking trail?
9. Does our faith community have any ball fields or courts?
10. Does our faith community have a playground?
11. Does our faith community have a policy supportingphysical activity opportunities at meetings/functions?
12. Has leadership promoted physical activity in a publicspeech or sermon in the past 12 months?
DYes EN0 LiNotSure
El Yes []No [El NotSure
DYes LINo ENotSure
El Yes [ElNo ENot Sure
LI Yes [E]No ENotSure
Section III: Physical Activity Programs & Education
1 3. Has our faith community organized or provided any typeof exercise class in the past 12 months?
14. Has our faith community organized walking groups orclubs in the past 12 months?
15. Has our faith community organized or supported a sportsteam for members in the past 12 months?
El Yes ENo ElNotSure
DYes ENo LlNotSure
U Yes ENo LlNotSure
44444
444
I
DYes EINo ElNot Sure
U Yes El No El Not Sure
El Yes El No El Not Sure
El Yes El No El Not Sure
El Yes El No El Not Sure
DYes ElNo ElNotSure
El Yes El No El Not Sure
EATING SMART AND MOVING MORE PLANNING GUIDE FOR FAITH COMMUNITIES
Used by the Trenton Health Team

16. Has our faith community specifically promoted physical EEl Yes El No LI Not Sureactivity through posted information in the past 12 months(e.g. bulletin board, posters, flyers, leaflets)?
17. Has our faith community specifically promoted physical El Yes LI No LI Not Sureactivity in the bulletin, program or newsletter in thepast 12 months?
Section IV: Healthy Eating Policies and Environments
18. Does our faith community have a kitchen or place LI Yes EEl No LI Not Sureto prepare meals?
19. Does our faith community have a garden or LI Yes LI No LI Not Surefarmer’s market on-site?
20. Does our faith community have guidelines for faith LI Yes LI No El Not Surecommunity meals requiring that:fruits and vegetables be offered?100% fruit juice be offered?water be offered?low-fat items be offered?low/no sugar items be offered?low sodium items be offered?
21. Has leadership promoted healthy eating in a public LI Yes LI No El Not Surespeech, sermon, talk or homily in the past 12 months?
22. Does our faith community have a private and comfortable LI Yes LI No LI Not Surespace for women to breastfeed or express breast milk?
23. Does our faith community have equipment that allows El Yes LI No LI Not Surefor preparation of healthier food (steamers, blenders,salad bars, etc.)?
Section V: Healthy Eating Programs and Education
24. Has our faith community organized or provided any El Yes El No El Not Surehealthy cooking classes in past 12 months?
25. Has our faith community organized or provided any LI Yes LI No El Not Sureweight loss support groups in past 12 months?
26. Has our faith community organized or provided any other LI Yes El No LI Not Surenutrition-related classes or groups in the past 12 months?
27. Has our faith community distributed any healthy eating LI Yes LI No El Not Sureguides or healthy recipes (including cookbooks) to faithcommunity members in the past 12 months?
28. Has our faith community promoted healthy eating LI Yes LI No El Not Surethrough posted information (e.g. posters, flyers, leaflets)in the past 12 months?
29. Has our faith community promoted healthy eating El Yes LI No LI Not Surein the bulletin, program or newsletter in the past12 months?
EATING SMART AND MOVING MORE PLANNING GUIDE FOR FAITH COMMUNITIES 21
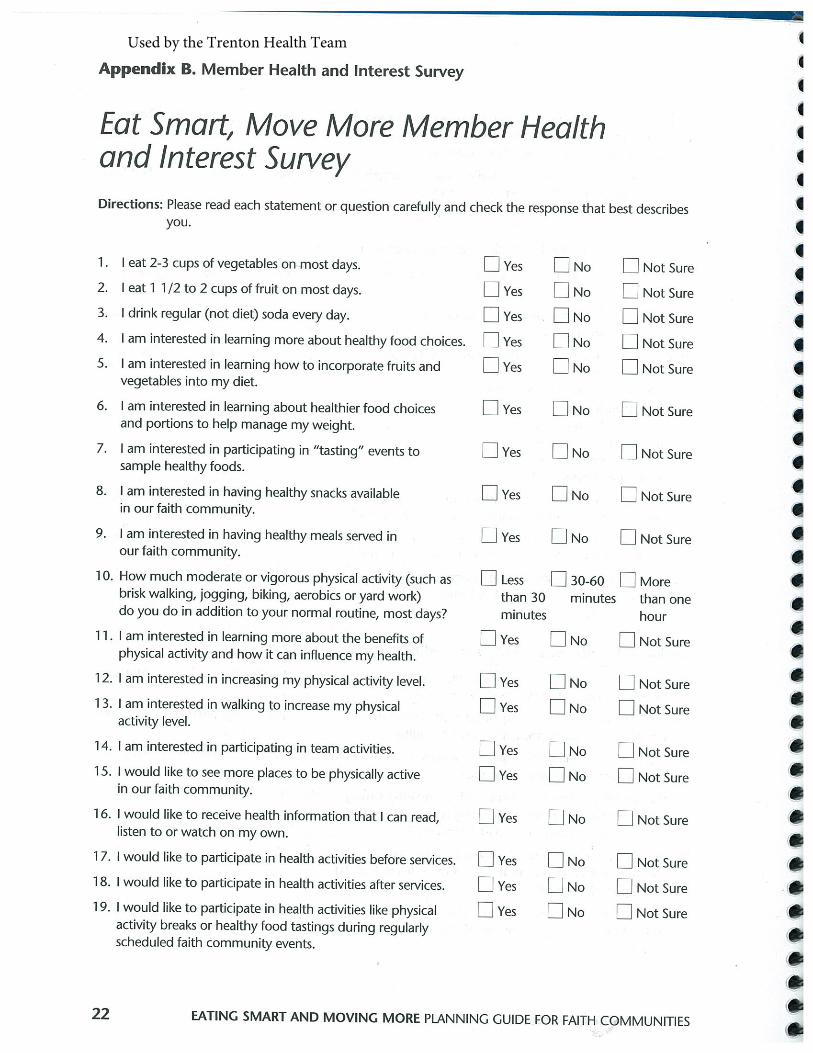
Appendix B. Member Health and Interest Survey
Eat Smart, Move More Member Healthand Interest SurveyDirections: Please read each statement or question carefully and check the response that best describes
you.
1. I eat 2-3 cups of vegetables on most days. H Yes H No H Not Sure
2. I eat 11/2 to 2 cups of fruit on most days. H Yes H No H Not Sure
3. I drink regular (not diet) soda every day. H Yes H No H Not Sure
4. I am interested in learning more about healthy food choices. H Yes H No H Not Sure
5. I am interested in leaming how to incorporate fruits and H Yes H No H Not Surevegetables into my diet. a
6. I am interested in learning about healthier food choices H Yes H No H Not Sure Iand portions to help manage my weight. a
7. I am interested in participating in “tasting” events to H Yes H No H Not Suresample healthy foods.
8. I am interested in having healthy snacks available H Yes H No H Not Surein our faith community. I
9. I am interested in having healthy meals served in H Yes H No H Not Sureour faith community.
10. How much moderate or vigorous physical activity (such as H Less H 30-60 H More Ibrisk walking, jogging, biking, aerobics or yard work) than 30 minutes than onedo you do in addition to your normal routine, most days? minutes hour
11. I am interested in learning more about the benefits of H Yes H No H Not Surephysical activity and how it can influence my health.
12. I am interested in increasing my physical activity level. H Yes H No H Not Sure
1 3. I am interested in walking to increase my physical H Yes H No H Not Sureactivity level.
14. I am interested in participating in team activities. H Yes H No H Not Sure
15. I would like to see more places to be physically active H Yes H No H Not Surein our faith community.
16. I would like to receive health information that I can read, H Yes H No H Not Surelisten to or watch on my own.
1 7. I would like to participate in health activities before services. H Yes H No H Not Sure
18. I would like to participate in health activities after services. H Yes H No H Not Sure
19. I would like to participate in health activities like physical H Yes H No H Not Sureactivity breaks or healthy food tastings during regularlyscheduled faith community events.
EATING SMART AND MOVING MORE PLANNING GUIDE FOR FAITH COMMUNITIES
Used by the Trenton Health Team

20. I would like for our leaders to talk about healthy eating DYes LI No LI Not Sureand physical activity in sermons, messages or other talks.
21. I would like to see health information in our bulletins, El Yes LI No El Not Surenewsletters and on bulletin boards.
22. I would like our faith community to offer regular classes LI Yes El No El Not Sureon physical activity or healthy eating.
General Comments, Questions or Suggestions for the Eating Smart and Moving More Program:
Please return this survey to _______________________________________________________________________
By ___________________________________________
EATING SMART AND MOVING MORE PLANNING GUIDE FOR FAITH COMMUNITIES 23

1. What is your gender?
2. What is your age?
3. How do you identify yourself? Check all that apply.
H African American LI American Indian
LI Asian H Hispanic/Latino
LI Native Hawaiian/Pacific Islander
4. How many of the 9 sessions did you attend? ______________
5. If you missed a session, how many of those sessions did youfrom your teacher? _________
As a result of this program, I now:
1. Am physically active at least 30 minutesmost days
2 Eat smaller portions
3. Eat less fast food
4. Drink fewer calorie-containing beverages
5. Prepare and eat more meals at home
6. Eat breakfast most days
7. Eat 2—3 cups of vegetables on most days
8. Eat 11/2_2 cups of fruit on most days
9. Am more mindful of what and how much I eat
10. Am more mindful of getting physical activityeach day
11. Limit screen time (Wand computer) for myself
12. Limit screen time (TV and computer)for my family
Are there any comments about Faithful Families Eating Smart and Moving Moreyou would like to share?
_______ North Carohna NORTH CAROLINAPublic Health
_EM HFFamthesEating Smart
‘ ANDMoving More
H White
H Other
get the information
I was alreadyNo Yes doing this
H H H
H H H
H H H
H H H
H H H
H H H
H H H
H H H
H H H
H H H
H H H
H H H
NC StuF~th~~~tOtT STI~.
COOPERATIV[______ EXTENSION


Center for State Health Policy Rutgers, The State University of New Jersey 112 Paterson Street, 5th Floor New Brunswick, NJ 08901 p. 848-932-3105 f. 732-932-0069 [email protected] www.cshp.rutgers.edu