center for energy workforce development energy workforce ... · pdf filecenter for energy...
TRANSCRIPT

Center for Energy Workforce Development
ENERGY WORKFORCE DEMAND NORTHWEST REGION
NOVEMBER 2015

INTRODUCTION
This report is designed to exhibit data on the present and future demand
for specific energy occupations within private sector electric and natural
gas utility industries for all CEWD regions in the United States.* The goal
of this report is to provide stakeholders with critical information on energy
workforce characteristics, which can be used for planning efforts and as a
benchmark for future studies on the region, as well as a comparison against
other regions. It is important to note that this report does not contain data
on utilities industries that are public owned or operated.
The report provides an overview of employment for select energy indus-
tries, broken out by CEWD regions, considering historic, current and future
circumstances. This is followed by a regional breakdown of employment by
occupations typically associated with the Energy sector.
Energy occupations by field were identified by the Center for Energy Workforce
Development and EMSI.*
* Please refer to the appendix for the descriptions of the electric and natural gas utility industries and standard occupation classifications included in this report.
DATA SOURCES
Quarterly Census of Employment and Wages (QCEW); Regional
Economic Information System (REIS); Alaska Department of
Labor and Workforce Development, Idaho Department of
Labor; Montana Department of Labor and Industry, Research
and Analysis Bureau; Oregon Employment Department, Ore-
gon Labor Market Information System; Washington State
Employment Security Department, Labor Market and Eco-
nomic Analysis Branch; Wyoming Department of Employ-
ment, Research and Planning.
PREPARED FOR
The Center for Energy Workforce Development
REGION DEFINITION
Northwest United States: Alaska, Idaho, Montana,
Oregon, Washington, Wyoming
TABLE OF CONTENTS
3 Summary: Northwest
Region Energy Workforce
overview for Electric and
Natural Gas Utilities
7 State-Level
Occupation Data
25 About This Report
27 Appendix: Occupation and
Industry Definitions
Center for Energy Workforce Development
ENERGY WORKFORCE DEMANDNORTHWEST REGION

W O R K F O R C E D E M A N D | N O R T H W E S T R E G I O N 1
HISTORICAL INDUSTRY OVERVIEW
The following graphs display energy sector jobs in 2014 with their percent of national
employment, and the regional and national job change from 2009 to 2014. In 2012, the
Quarterly Census of Employment and Wages (QCEW) reclassified much of the employ-
ment contained in various electric power generation industries, specifically Other electric
power generation (NAICS 221119) was deleted and subdivided into multiple new categories
including Solar electric power generation (NAICS 221114); Wind electric power generation
(NAICS 221115); Geothermal electric power generation (221116); Biomass electric power
generation (NAICS 221117); and Other electric power generation (NAICS 221118). Since
our reporting time frame covers this reclassification event, the job numbers reflect the
shift accordingly. One must therefore, not overly scrutinize individual industries affected
by the reclassification but rather look to the overall energy sector job change total as an
indicator of job growth or decline.
SUMMARY Northwest Region Energy Workforce overview for Electric and Natural Gas Utilities
Hydroelectric Generation
Fossil Fuel Generation
Nuclear Generation
Solar Generation
Wind Generation
Geothermal Generation
Biomass Generation
Other Electric Generation
Electric Bulk Transmission
Electric Distribution
Natural Gas Distribution
–100% 100%75%50%25%0%–25%–50%–75%
2009–2014 % Job Change
% of National Jobs
0Thousands
0%
0+0+78+0+0+0+0+90+0+9+2
Energy Industry Jobs, 2014 35+10+0+0+0+0+0+0+70+0+0
82+28+7+0+0+0+0+86+6+0+0
National % Regional %
164 8 122+24+0+0+4+0+1+0+24+84+3816+3+0+1+11+0+5+1+10+4+3 0+0+0+0+0+0+0+0+0+42+4
16%4% 8% 12%

W O R K F O R C E D E M A N D | N O R T H W E S T R E G I O N 2
Northwest/National Comparison, Electrical and Natural Gas Utilities, All Jobs by Energy Field
NAICS Energy Field
2014 Regional
Jobs
2009-14 Regional Change
2014 National
Jobs
2009-14 National Change
221111 Hydroelectric Power Generation 844 217 6,826 -31,773
221112 Fossil Fuel Electric Power Generation 2,916 260 98,951 -39,298
221113 Nuclear Electric Power Generation 11 -39 49,463 -3,666
221114 Solar Electric Power Generation 27 -- 1,592 --
221115 Wind Electric Power Generation 382 -- 3,888 --
221116 Geothermal Electric Power Generation 13 -- 1,163 --
221117 Biomass Electric Power Generation 57 -- 1,806 --
221118 Other Electric Power Generation 20 -308 1,653 -10,159
221121 Electric Bulk Power Transmission/Control 1,965 840 25,116 -1,529
221122 Electric Power Distribution 7,882 -767 211,540 62,622
221210 Natural Gas Distribution 3,803 -110 117,264 4,836
Total 17,919 573 519,263 -10,519
Our analysis of the energy sector in the Northwest Region shows a total of 17,919 jobs for
2014. Between 2009 and 2014 the industry as a whole increased by 573 jobs, a change of
3%. This increase was largely driven by Electric Bulk Power Transmission, with lesser con-
tributions from Hydroelectric Power Generation, Fossil Fuel Electric Power Generation, and
Fossil Fuel Electric Power Generation, as well as from the alternative energy sectors—Solar,
Wind, Geothermal, and Biomass.
Industries that decreased notably over the past five years include Electric Power Distribu-
tion and Natural Gas Distribution, which collectively declined by 877 jobs. Looking forward
from 2014 to 2019, employment in the energy sector in the Northwest Region is projected
to remain stable, losing fewer than 50 jobs over that period of time.
2004 Jobs
10,000
4,000
2,000
2009 Jobs
2014 Jobs
2024 Jobs
0
2019 Jobs
8,000
6,000
ENERGY FIELD REGIONAL GROWTH PROJECTIONS
Growth projections are designed to portray EMSI’s best approximation of the future state
of all private sector jobs energy jobs in the region. The following table shows the projected
employment growth across all eleven energy sectors for the Northwest region. The cat-
egories include: “2014 Jobs” or the total number of private sector energy workers in 2014;
“2014-2019 Growth” or the number of new jobs projected to be created between 2014 and
2019; “% Growth”; “2014-2019 Annual Job Growth” or the average annual growth over the
five year period; “2014-2019 Projected Attrition & Retirements” and “2014-2024 Projected
Attrition & Retirements” or the projected annual job turnover/openings for the sector for
the respective five or ten year period; and “Median Annual Earnings” or the median aver-
age earnings per worker.*
* Projected attrition and retirements rates are taken from CEWD’s energy industry survey results.

W O R K F O R C E D E M A N D | N O R T H W E S T R E G I O N 3
KEY OCCUPATIONS IN THE NORTHWEST REGION
The following table shows the number of workers that were employed in occupations typi-
cally associated with the Energy field in 2009 and 2014, along with projected employment in
2019 and 2024. The columns of data progressively list jobs, job change, and percent change
from either 2009 or 2014. The associated projected attritions and retirements occurring over
the same 5 to ten year period are listed next. Finally, “Median Annual Earnings” indicates
the average median wages across all occupations in the respective industry.
Northwest Region, Electrical and Natural Gas Utilities, All Jobs by Energy Field
NAICS Title 2014 Jobs2014-19 Growth
2014-19 % Growth
2014-19 Aver-age Annual
Net Job Change
2014-19 Projected
Attrition & Retirement
Openings
2014-24 Projected
Attrition & Retirement
Openings
Median Annual
Earnings
221111 Hydroelectric Power Generation 844 -616 -73% -123 331 433 $63,854
221112 Fossil Fuel Electric Power Generation 2,916 -514 -18% -103 1,145 1,498 $63,800
221113 Nuclear Electric Power Generation 11 -1 -11% -0 4 6 $63,718
221114 Solar Electric Power Generation 27 -7 -28% -1 10 14 $62,365
221115 Wind Electric Power Generation 382 17 5% 3 150 196 $64,854
221116 Geothermal Electric Power Generation 13 -8 -63% -2 5 7 $60,925
221117 Biomass Electric Power Generation 57 17 30% 3 23 29 $62,172
221118 Other Electric Power Generation 20 0 2% 0 8 10 $41,821
221121 Electric Bulk Power Transmission/Control 1,965 449 23% 90 771 1,010 $65,912
221122 Electric Power Distribution 7,882 574 7% 115 3,095 4,050 $64,697
221210 Natural Gas Distribution 3,803 40 1% 8 1,493 1,954 $55,679
Total 17,919 -48 -0% -10 7,036 9,208 $62,693

W O R K F O R C E D E M A N D | N O R T H W E S T R E G I O N 4
Northwest Region, Electrical and Natural Gas Utilities, Key Occupation Employment*
SOC Code Description 2
00
9 J
ob
s
20
09
-14
Ch
an
ge
20
09
-14
%C
ha
ng
e
20
14 J
ob
s
20
19 J
ob
s
20
14-1
9 C
ha
ng
e
20
14-1
9 %
Ch
an
ge
20
24
Jo
bs
20
14-2
4 C
ha
ng
e
20
14-2
4 %
Ch
an
ge
20
14-1
9 P
roje
cte
d
Att
riti
on
&
Re
tire
me
nts
20
14-2
4 P
roje
cte
d
Att
riti
on
&
Re
tire
me
nts
Me
dia
n A
nn
ua
l
Ea
rnin
gs
Lineworkers 2,635 319 12.1% 2,954 3,025 71 2.3% 3,095 141 4.6% 870 1,209 $78,442
49-1011First-line supervisors/managers of mechanics, installers, & repairers
520 5 1.0% 525 520 -5 -1.0% 514 -11 -2.1% 155 215 $64,129
49-9051 Electrical power-line installers and repairers 2,115 314 14.8% 2,429 2,505 76 3.1% 2,581 152 6.3% 715 994 $81,536
Plant/Field Operators 1,841 65 3.5% 1,906 1,820 -86 -4.7% 1,786 -120 -6.7% 704 937 $68,571
51-8011 Nuclear power reactor operators 152 8 5.3% 160 168 8 5.0% 174 14 8.8% 59 79 $83,175
51-8013 Power plant operators 1,286 74 5.8% 1,360 1,279 -81 -6.0% 1,238 -122 -9.0% 502 668 $69,641
51-8092 Gas plant operators 403 -17 -4.2% 386 373 -13 -3.4% 374 -12 -3.1% 143 190 $58,750
Technicians 2,778 173 6.2% 2,951 2,987 36 1.2% 3,032 81 2.7% 1,060 1,375 $64,301
17-3023 Electrical & Electronics Engineering Technicians 230 6 2.6% 236 230 -6 -2.5% 226 -10 -4.2% 85 110 $59,454
19-4051 Nuclear technicians 156 42 26.9% 198 214 16 8.1% 228 30 15.2% 71 92 $75,934
47-2111 Electricians 304 8 2.6% 312 300 -12 -3.8% 293 -19 -6.1% 112 145 $58,161
47-2151 Pipelayers 18 0 0.0% 18 18 0 0.0% 18 0 0.0% 6 8 $41,568
47-2152 Plumbers, pipefitters, and steamfitters 263 -6 -2.3% 257 260 3 1.2% 263 6 2.3% 92 120 $56,006
47-3015 Helpers, pipelayers, plumbers, pipefitters, and steamfitters 3 1 33.3% 4 4 0 0.0% 4 0 0.0% 1 2 $37,663
49-2095Electrical and electronics repairers, powerhouse, substation, and relay
388 35 9.0% 423 447 24 5.7% 465 42 9.9% 152 197 $82,457
49-9012Control and valve installers and repairers, except mechanical door
568 -5 -0.9% 563 554 -9 -1.6% 549 -14 -2.5% 202 262 $52,895
49-9041 Industrial machinery mechanics 355 28 7.9% 383 408 25 6.5% 430 47 12.3% 138 179 $51,428
49-9044 Millwrights 14 1 7.1% 15 15 0 0.0% 15 0 0.0% 5 7 $61,175
51-4041 Machinists 17 1 5.9% 18 18 0 0.0% 19 1 5.6% 6 8 $43,432
51-4121 Welders, cutters, solderers, & brazers 89 2 2.2% 91 90 -1 -1.1% 89 -2 -2.2% 33 42 $40,119
51-8012 Power Distributors & Dispatchers 373 60 16.1% 433 429 -4 -0.9% 433 0 0.0% 156 202 $86,704
Engineers 1,138 125 11.0% 1,263 1,309 46 3.5% 1,341 78 5.8% 453 661 $93,818
11-9041 Engineering managers 118 3 2.5% 121 124 3 2.5% 123 2 1.7% 43 63 $126,121
17-2041 Chemical engineers 22 1 4.5% 23 22 -1 -4.3% 22 -1 -4.3% 8 12 $94,231
17-2051 Civil engineers 81 0 0.0% 81 80 -1 -1.2% 79 -2 -2.5% 29 42 $77,202
17-2071 Electrical engineers 576 63 10.9% 639 672 33 5.2% 703 64 10.0% 229 334 $91,062
17-2081 Environmental engineers 30 0 0.0% 30 28 -2 -6.7% 27 -3 -10.0% 11 16 $85,733
17-2111Health and safety engineers, except mining safety engineers & inspectors
13 0 0.0% 13 13 0 0.0% 12 -1 -7.7% 5 7 $89,338
17-2141 Mechanical engineers 43 2 4.7% 45 45 0 0.0% 45 0 0.0% 16 24 $84,861
17-2161 Nuclear engineers 255 56 22.0% 311 325 14 4.5% 330 19 6.1% 112 163 $93,473
Total - All Occupations 8,392 682 8.1% 9,074 9,141 67 0.7% 9,254 180 1.9% 3,087 4,182 $73,910
* Job numbers by employment category may not equal total Key Occupation Employment for each region, due to rounding.

W O R K F O R C E D E M A N D | N O R T H W E S T R E G I O N 5
Standard Occupation Classification (SOC) employment data is provided by total number of
jobs and projected jobs in the region spanning the years 2009, 2014, 2019 and 2024. Addi-
tionally, projected attrition & retirements rates are applied to show the amount of open
positions over the next ten years. Employment numbers are reported as of quarter 2 of 2015.
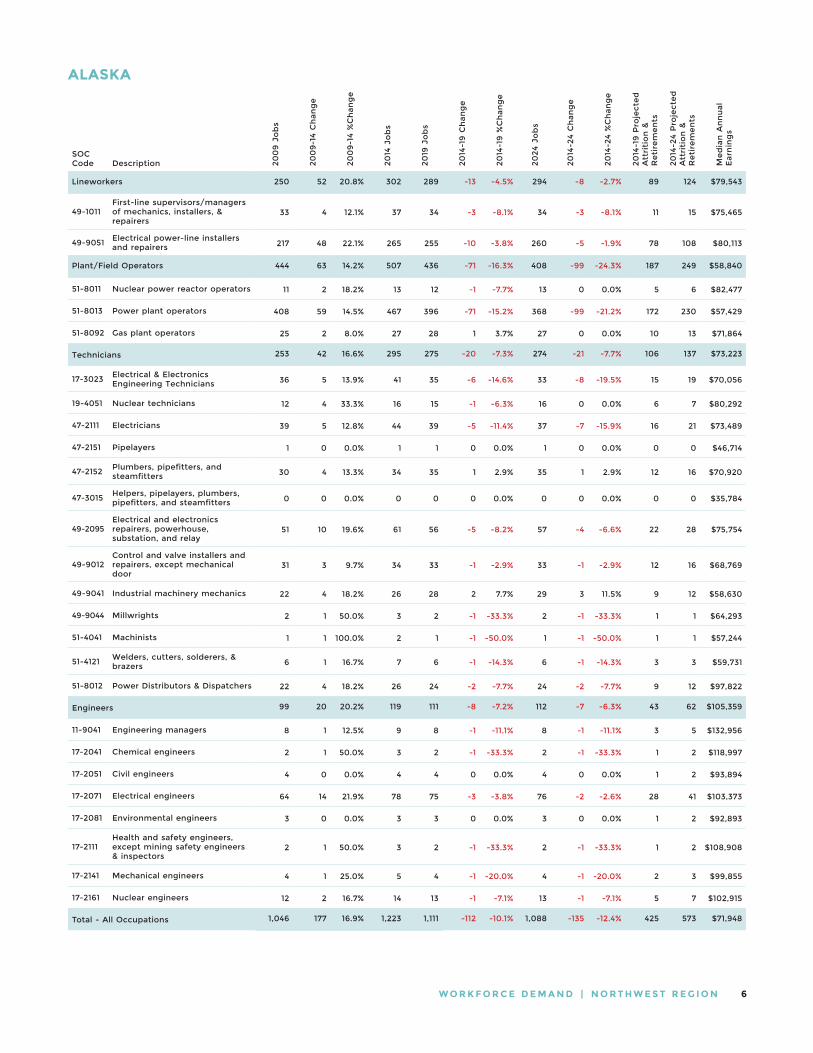
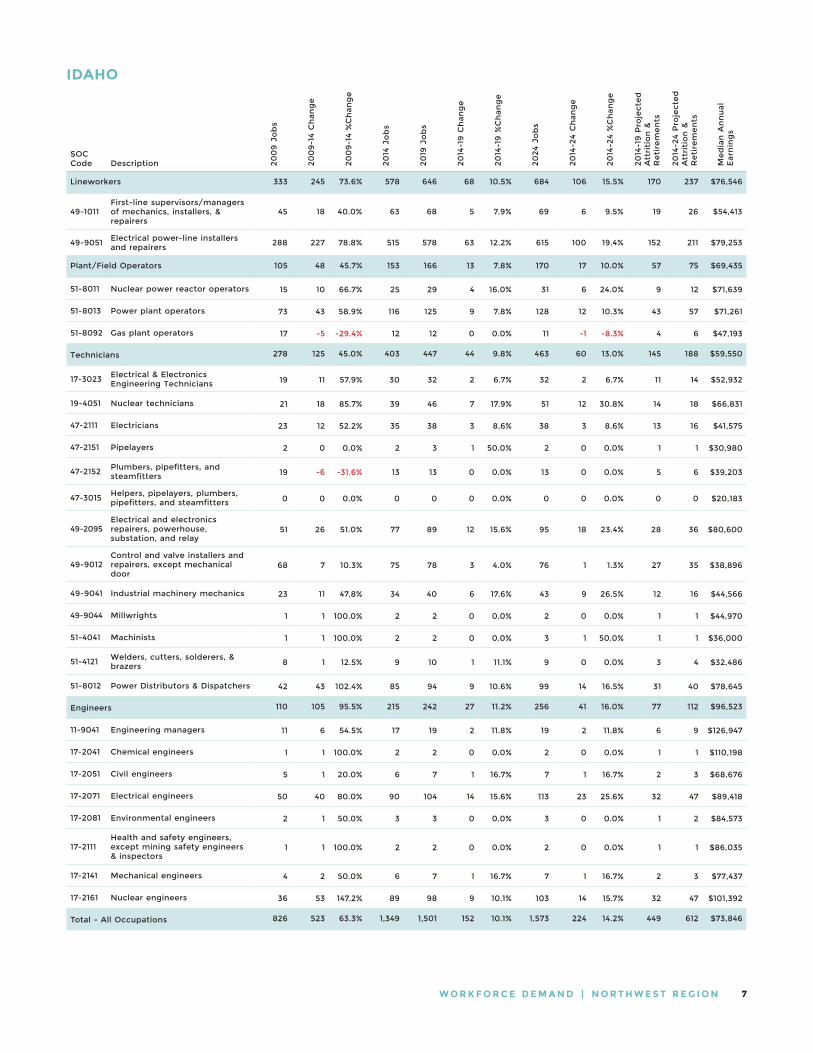
STATE-LEVEL Occupation Data
W O R K F O R C E D E M A N D | N O R T H W E S T R E G I O N 6
ALASKA
SOC Code Description 2
00
9 J
ob
s
20
09
-14
Ch
an
ge
20
09
-14
%C
ha
ng
e
20
14 J
ob
s
20
19 J
ob
s
20
14-1
9 C
ha
ng
e
20
14-1
9 %
Ch
an
ge
20
24
Jo
bs
20
14-2
4 C
ha
ng
e
20
14-2
4 %
Ch
an
ge
20
14-1
9 P
roje
cte
d
Att
riti
on
&
Re
tire
me
nts
20
14-2
4 P
roje
cte
d
Att
riti
on
&
Re
tire
me
nts
Me
dia
n A
nn
ua
l
Ea
rnin
gs
Lineworkers 250 52 20.8% 302 289 -13 -4.5% 294 -8 -2.7% 89 124 $79,543
49-1011First-line supervisors/managers of mechanics, installers, & repairers
33 4 12.1% 37 34 -3 -8.1% 34 -3 -8.1% 11 15 $75,465
49-9051 Electrical power-line installers and repairers 217 48 22.1% 265 255 -10 -3.8% 260 -5 -1.9% 78 108 $80,113
Plant/Field Operators 444 63 14.2% 507 436 -71 -16.3% 408 -99 -24.3% 187 249 $58,840
51-8011 Nuclear power reactor operators 11 2 18.2% 13 12 -1 -7.7% 13 0 0.0% 5 6 $82,477
51-8013 Power plant operators 408 59 14.5% 467 396 -71 -15.2% 368 -99 -21.2% 172 230 $57,429
51-8092 Gas plant operators 25 2 8.0% 27 28 1 3.7% 27 0 0.0% 10 13 $71,864
Technicians 253 42 16.6% 295 275 -20 -7.3% 274 -21 -7.7% 106 137 $73,223
17-3023 Electrical & Electronics Engineering Technicians 36 5 13.9% 41 35 -6 -14.6% 33 -8 -19.5% 15 19 $70,056
19-4051 Nuclear technicians 12 4 33.3% 16 15 -1 -6.3% 16 0 0.0% 6 7 $80,292
47-2111 Electricians 39 5 12.8% 44 39 -5 -11.4% 37 -7 -15.9% 16 21 $73,489
47-2151 Pipelayers 1 0 0.0% 1 1 0 0.0% 1 0 0.0% 0 0 $46,714
47-2152 Plumbers, pipefitters, and steamfitters 30 4 13.3% 34 35 1 2.9% 35 1 2.9% 12 16 $70,920
47-3015 Helpers, pipelayers, plumbers, pipefitters, and steamfitters 0 0 0.0% 0 0 0 0.0% 0 0 0.0% 0 0 $35,784
49-2095Electrical and electronics repairers, powerhouse, substation, and relay
51 10 19.6% 61 56 -5 -8.2% 57 -4 -6.6% 22 28 $75,754
49-9012Control and valve installers and repairers, except mechanical door
31 3 9.7% 34 33 -1 -2.9% 33 -1 -2.9% 12 16 $68,769
49-9041 Industrial machinery mechanics 22 4 18.2% 26 28 2 7.7% 29 3 11.5% 9 12 $58,630
49-9044 Millwrights 2 1 50.0% 3 2 -1 -33.3% 2 -1 -33.3% 1 1 $64,293
51-4041 Machinists 1 1 100.0% 2 1 -1 -50.0% 1 -1 -50.0% 1 1 $57,244
51-4121 Welders, cutters, solderers, & brazers 6 1 16.7% 7 6 -1 -14.3% 6 -1 -14.3% 3 3 $59,731
51-8012 Power Distributors & Dispatchers 22 4 18.2% 26 24 -2 -7.7% 24 -2 -7.7% 9 12 $97,822
Engineers 99 20 20.2% 119 111 -8 -7.2% 112 -7 -6.3% 43 62 $105,359
11-9041 Engineering managers 8 1 12.5% 9 8 -1 -11.1% 8 -1 -11.1% 3 5 $132,956
17-2041 Chemical engineers 2 1 50.0% 3 2 -1 -33.3% 2 -1 -33.3% 1 2 $118,997
17-2051 Civil engineers 4 0 0.0% 4 4 0 0.0% 4 0 0.0% 1 2 $93,894
17-2071 Electrical engineers 64 14 21.9% 78 75 -3 -3.8% 76 -2 -2.6% 28 41 $103,373
17-2081 Environmental engineers 3 0 0.0% 3 3 0 0.0% 3 0 0.0% 1 2 $92,893
17-2111Health and safety engineers, except mining safety engineers & inspectors
2 1 50.0% 3 2 -1 -33.3% 2 -1 -33.3% 1 2 $108,908
17-2141 Mechanical engineers 4 1 25.0% 5 4 -1 -20.0% 4 -1 -20.0% 2 3 $99,855
17-2161 Nuclear engineers 12 2 16.7% 14 13 -1 -7.1% 13 -1 -7.1% 5 7 $102,915
Total - All Occupations 1,046 177 16.9% 1,223 1,111 -112 -10.1% 1,088 -135 -12.4% 425 573 $71,948
W O R K F O R C E D E M A N D | N O R T H W E S T R E G I O N 7
IDAHO
SOC Code Description 2
00
9 J
ob
s
20
09
-14
Ch
an
ge
20
09
-14
%C
ha
ng
e
20
14 J
ob
s
20
19 J
ob
s
20
14-1
9 C
ha
ng
e
20
14-1
9 %
Ch
an
ge
20
24
Jo
bs
20
14-2
4 C
ha
ng
e
20
14-2
4 %
Ch
an
ge
20
14-1
9 P
roje
cte
d
Att
riti
on
&
Re
tire
me
nts
20
14-2
4 P
roje
cte
d
Att
riti
on
&
Re
tire
me
nts
Me
dia
n A
nn
ua
l
Ea
rnin
gs
Lineworkers 333 245 73.6% 578 646 68 10.5% 684 106 15.5% 170 237 $76,546
49-1011First-line supervisors/managers of mechanics, installers, & repairers
45 18 40.0% 63 68 5 7.9% 69 6 9.5% 19 26 $54,413
49-9051 Electrical power-line installers and repairers 288 227 78.8% 515 578 63 12.2% 615 100 19.4% 152 211 $79,253
Plant/Field Operators 105 48 45.7% 153 166 13 7.8% 170 17 10.0% 57 75 $69,435
51-8011 Nuclear power reactor operators 15 10 66.7% 25 29 4 16.0% 31 6 24.0% 9 12 $71,639
51-8013 Power plant operators 73 43 58.9% 116 125 9 7.8% 128 12 10.3% 43 57 $71,261
51-8092 Gas plant operators 17 -5 -29.4% 12 12 0 0.0% 11 -1 -8.3% 4 6 $47,193
Technicians 278 125 45.0% 403 447 44 9.8% 463 60 13.0% 145 188 $59,550
17-3023 Electrical & Electronics Engineering Technicians 19 11 57.9% 30 32 2 6.7% 32 2 6.7% 11 14 $52,932
19-4051 Nuclear technicians 21 18 85.7% 39 46 7 17.9% 51 12 30.8% 14 18 $66,831
47-2111 Electricians 23 12 52.2% 35 38 3 8.6% 38 3 8.6% 13 16 $41,575
47-2151 Pipelayers 2 0 0.0% 2 3 1 50.0% 2 0 0.0% 1 1 $30,980
47-2152 Plumbers, pipefitters, and steamfitters 19 -6 -31.6% 13 13 0 0.0% 13 0 0.0% 5 6 $39,203
47-3015 Helpers, pipelayers, plumbers, pipefitters, and steamfitters 0 0 0.0% 0 0 0 0.0% 0 0 0.0% 0 0 $20,183
49-2095Electrical and electronics repairers, powerhouse, substation, and relay
51 26 51.0% 77 89 12 15.6% 95 18 23.4% 28 36 $80,600
49-9012Control and valve installers and repairers, except mechanical door
68 7 10.3% 75 78 3 4.0% 76 1 1.3% 27 35 $38,896
49-9041 Industrial machinery mechanics 23 11 47.8% 34 40 6 17.6% 43 9 26.5% 12 16 $44,566
49-9044 Millwrights 1 1 100.0% 2 2 0 0.0% 2 0 0.0% 1 1 $44,970
51-4041 Machinists 1 1 100.0% 2 2 0 0.0% 3 1 50.0% 1 1 $36,000
51-4121 Welders, cutters, solderers, & brazers 8 1 12.5% 9 10 1 11.1% 9 0 0.0% 3 4 $32,486
51-8012 Power Distributors & Dispatchers 42 43 102.4% 85 94 9 10.6% 99 14 16.5% 31 40 $78,645
Engineers 110 105 95.5% 215 242 27 11.2% 256 41 16.0% 77 112 $96,523
11-9041 Engineering managers 11 6 54.5% 17 19 2 11.8% 19 2 11.8% 6 9 $126,947
17-2041 Chemical engineers 1 1 100.0% 2 2 0 0.0% 2 0 0.0% 1 1 $110,198
17-2051 Civil engineers 5 1 20.0% 6 7 1 16.7% 7 1 16.7% 2 3 $68,676
17-2071 Electrical engineers 50 40 80.0% 90 104 14 15.6% 113 23 25.6% 32 47 $89,418
17-2081 Environmental engineers 2 1 50.0% 3 3 0 0.0% 3 0 0.0% 1 2 $84,573
17-2111Health and safety engineers, except mining safety engineers & inspectors
1 1 100.0% 2 2 0 0.0% 2 0 0.0% 1 1 $86,035
17-2141 Mechanical engineers 4 2 50.0% 6 7 1 16.7% 7 1 16.7% 2 3 $77,437
17-2161 Nuclear engineers 36 53 147.2% 89 98 9 10.1% 103 14 15.7% 32 47 $101,392
Total - All Occupations 826 523 63.3% 1,349 1,501 152 10.1% 1,573 224 14.2% 449 612 $73,846

W O R K F O R C E D E M A N D | N O R T H W E S T R E G I O N 8
MONTANA
SOC Code Description 2
00
9 J
ob
s
20
09
-14
Ch
an
ge
20
09
-14
%C
ha
ng
e
20
14 J
ob
s
20
19 J
ob
s
20
14-1
9 C
ha
ng
e
20
14-1
9 %
Ch
an
ge
20
24
Jo
bs
20
14-2
4 C
ha
ng
e
20
14-2
4 %
Ch
an
ge
20
14-1
9 P
roje
cte
d
Att
riti
on
&
Re
tire
me
nts
20
14-2
4 P
roje
cte
d
Att
riti
on
&
Re
tire
me
nts
Me
dia
n A
nn
ua
l
Ea
rnin
gs
Lineworkers 451 49 10.9% 500 508 8 1.6% 530 30 5.7% 147 205 $70,915
49-1011First-line supervisors/managers of mechanics, installers, & repairers
100 2 2.0% 102 98 -4 -3.9% 97 -5 -4.9% 30 42 $58,356
49-9051 Electrical power-line installers and repairers 351 47 13.4% 398 410 12 3.0% 433 35 8.8% 117 163 $74,133
Plant/Field Operators 188 2 1.1% 190 186 -4 -2.2% 187 -3 -1.6% 70 93 $77,010
51-8011 Nuclear power reactor operators 27 2 7.4% 29 30 1 3.4% 31 2 6.9% 11 14 $76,584
51-8013 Power plant operators 138 3 2.2% 141 135 -6 -4.3% 134 -7 -5.0% 52 69 $79,061
51-8092 Gas plant operators 23 -3 -13.0% 20 21 1 5.0% 22 2 10.0% 7 10 $63,170
Technicians 381 19 5.0% 400 407 7 1.7% 419 19 4.5% 144 186 $61,770
17-3023 Electrical & Electronics Engineering Technicians 31 0 0.0% 31 31 0 0.0% 30 -1 -3.2% 11 14 $61,575
19-4051 Nuclear technicians 18 4 22.2% 22 24 2 9.1% 26 4 18.2% 8 10 $69,317
47-2111 Electricians 61 2 3.3% 63 59 -4 -6.3% 58 -5 -7.9% 23 29 $50,956
47-2151 Pipelayers 1 0 0.0% 1 1 0 0.0% 2 1 100.0% 0 0 $28,248
47-2152 Plumbers, pipefitters, and steamfitters 51 2 3.9% 53 54 1 1.9% 56 3 5.7% 19 25 $47,234
47-3015 Helpers, pipelayers, plumbers, pipefitters, and steamfitters 0 0 0.0% 0 0 0 0.0% 1 1 0.0% 0 0 $23,303
49-2095Electrical and electronics repairers, powerhouse, substation, and relay
52 3 5.8% 55 58 3 5.5% 60 5 9.1% 20 26 $86,632
49-9012Control and valve installers and repairers, except mechanical door
40 0 0.0% 40 41 1 2.5% 42 2 5.0% 14 19 $65,083
49-9041 Industrial machinery mechanics 46 2 4.3% 48 50 2 4.2% 53 5 10.4% 17 22 $43,149
49-9044 Millwrights 2 1 50.0% 3 3 0 0.0% 3 0 0.0% 1 1 $41,517
51-4041 Machinists 5 0 0.0% 5 5 0 0.0% 5 0 0.0% 2 2 $32,480
51-4121 Welders, cutters, solderers, & brazers 17 1 5.9% 18 17 -1 -5.6% 17 -1 -5.6% 6 8 $32,503
51-8012 Power Distributors & Dispatchers 57 4 7.0% 61 64 3 4.9% 66 5 8.2% 22 28 $85,592
Engineers 212 12 5.7% 224 224 0 0.0% 231 7 3.0% 80 117 $73,075
11-9041 Engineering managers 17 0 0.0% 17 17 0 0.0% 17 0 0.0% 6 9 $100,586
17-2041 Chemical engineers 8 0 0.0% 8 7 -1 -12.5% 7 -1 -12.5% 3 4 $90,563
17-2051 Civil engineers 13 1 7.7% 14 13 -1 -7.1% 13 -1 -7.1% 5 7 $62,277
17-2071 Electrical engineers 145 11 7.6% 156 156 0 0.0% 163 7 4.5% 56 82 $70,137
17-2081 Environmental engineers 6 0 0.0% 6 6 0 0.0% 5 -1 -16.7% 2 3 $77,813
17-2111Health and safety engineers, except mining safety engineers & inspectors
2 0 0.0% 2 2 0 0.0% 2 0 0.0% 1 1 $60,357
17-2141 Mechanical engineers 7 0 0.0% 7 7 0 0.0% 7 0 0.0% 3 4 $71,095
17-2161 Nuclear engineers 14 0 0.0% 14 16 2 14.3% 17 3 21.4% 5 7 $73,974
Total - All Occupations 1,232 82 6.7% 1,314 1,325 11 0.8% 1,367 53 3.9% 442 602 $69,380

W O R K F O R C E D E M A N D | N O R T H W E S T R E G I O N 9
OREGON
SOC Code Description 2
00
9 J
ob
s
20
09
-14
Ch
an
ge
20
09
-14
%C
ha
ng
e
20
14 J
ob
s
20
19 J
ob
s
20
14-1
9 C
ha
ng
e
20
14-1
9 %
Ch
an
ge
20
24
Jo
bs
20
14-2
4 C
ha
ng
e
20
14-2
4 %
Ch
an
ge
20
14-1
9 P
roje
cte
d
Att
riti
on
&
Re
tire
me
nts
20
14-2
4 P
roje
cte
d
Att
riti
on
&
Re
tire
me
nts
Me
dia
n A
nn
ua
l
Ea
rnin
gs
Lineworkers 613 -32 -5.2% 581 561 -20 -3.6% 542 -39 -7.2% 171 238 $79,526
49-1011First-line supervisors/managers of mechanics, installers, & repairers
128 -12 -9.4% 116 116 0 0.0% 112 -4 -3.4% 34 47 $61,238
49-9051 Electrical power-line installers and repairers 485 -20 -4.1% 465 445 -20 -4.3% 430 -35 -7.5% 137 190 $84,089
Plant/Field Operators 262 -28 -10.7% 234 237 3 1.3% 230 -4 -1.7% 86 115 $67,779
51-8011 Nuclear power reactor operators 47 -4 -8.5% 43 45 2 4.7% 44 1 2.3% 16 21 $80,108
51-8013 Power plant operators 165 -24 -14.5% 141 140 -1 -0.7% 133 -8 -5.7% 52 69 $64,813
51-8092 Gas plant operators 50 0 0.0% 50 52 2 4.0% 53 3 6.0% 18 25 $65,541
Technicians 690 -19 -2.8% 671 675 4 0.6% 666 -5 -0.8% 241 313 $63,862
17-3023 Electrical & Electronics Engineering Technicians 67 -6 -9.0% 61 61 0 0.0% 59 -2 -3.3% 22 28 $57,195
19-4051 Nuclear technicians 14 -1 -7.1% 13 14 1 7.7% 14 1 7.7% 5 6 $77,149
47-2111 Electricians 70 -7 -10.0% 63 61 -2 -3.2% 57 -6 -9.5% 23 29 $63,610
47-2151 Pipelayers 4 0 0.0% 4 5 1 25.0% 5 1 25.0% 1 2 $37,069
47-2152 Plumbers, pipefitters, and steamfitters 80 4 5.0% 84 88 4 4.8% 89 5 6.0% 30 39 $61,286
47-3015 Helpers, pipelayers, plumbers, pipefitters, and steamfitters 0 1 0.0% 1 1 0 0.0% 1 0 0.0% 0 0 $28,615
49-2095Electrical and electronics repairers, powerhouse, substation, and relay
68 -7 -10.3% 61 64 3 4.9% 64 3 4.9% 22 28 $78,790
49-9012Control and valve installers and repairers, except mechanical door
135 -3 -2.2% 132 137 5 3.8% 136 4 3.0% 47 62 $51,771
49-9041 Industrial machinery mechanics 87 1 1.1% 88 95 7 8.0% 98 10 11.4% 32 41 $50,449
49-9044 Millwrights 3 -1 -33.3% 2 2 0 0.0% 2 0 0.0% 1 1 $55,578
51-4041 Machinists 3 0 0.0% 3 3 0 0.0% 3 0 0.0% 1 1 $43,628
51-4121 Welders, cutters, solderers, & brazers 20 -1 -5.0% 19 20 1 5.3% 20 1 5.3% 7 9 $38,667
51-8012 Power Distributors & Dispatchers 139 1 0.7% 140 124 -16 -11.4% 118 -22 -15.7% 50 65 $85,509
Engineers 236 -17 -7.2% 219 234 15 6.4% 236 17 7.2% 79 115 $89,748
11-9041 Engineering managers 38 -4 -10.5% 34 36 2 5.9% 35 1 2.9% 12 18 $129,940
17-2041 Chemical engineers 5 0 0.0% 5 5 0 0.0% 5 0 0.0% 2 3 $84,822
17-2051 Civil engineers 25 -2 -8.0% 23 23 0 0.0% 23 0 0.0% 8 12 $74,203
17-2071 Electrical engineers 88 -6 -6.8% 82 90 8 9.8% 93 11 13.4% 29 43 $79,655
17-2081 Environmental engineers 7 0 0.0% 7 7 0 0.0% 6 -1 -14.3% 3 4 $82,264
17-2111Health and safety engineers, except mining safety engineers & inspectors
3 0 0.0% 3 3 0 0.0% 3 0 0.0% 1 2 $82,116
17-2141 Mechanical engineers 12 0 0.0% 12 12 0 0.0% 12 0 0.0% 4 6 $80,429
17-2161 Nuclear engineers 58 -5 -8.6% 53 58 5 9.4% 59 6 11.3% 19 28 $90,321
Total - All Occupations 1,801 -96 -5.3% 1,705 1,707 2 0.1% 1,674 -31 -1.9% 577 780 $73,063

W O R K F O R C E D E M A N D | N O R T H W E S T R E G I O N 1 0
WASHINGTON
SOC Code Description 2
00
9 J
ob
s
20
09
-14
Ch
an
ge
20
09
-14
%C
ha
ng
e
20
14 J
ob
s
20
19 J
ob
s
20
14-1
9 C
ha
ng
e
20
14-1
9 %
Ch
an
ge
20
24
Jo
bs
20
14-2
4 C
ha
ng
e
20
14-2
4 %
Ch
an
ge
20
14-1
9 P
roje
cte
d
Att
riti
on
&
Re
tire
me
nts
20
14-2
4 P
roje
cte
d
Att
riti
on
&
Re
tire
me
nts
Me
dia
n A
nn
ua
l
Ea
rnin
gs
Lineworkers 630 -5 -0.8% 625 634 9 1.4% 644 19 3.0% 184 256 $81,267
49-1011First-line supervisors/managers of mechanics, installers, & repairers
120 -7 -5.8% 113 109 -4 -3.5% 107 -6 -5.3% 33 46 $67,114
49-9051 Electrical power-line installers and repairers 510 2 0.4% 512 525 13 2.5% 537 25 4.9% 151 210 $84,391
Plant/Field Operators 396 -23 -5.8% 373 354 -19 -5.4% 350 -23 -6.6% 138 183 $63,951
51-8011 Nuclear power reactor operators 34 -1 -2.9% 33 35 2 6.1% 36 3 9.1% 12 16 $91,543
51-8013 Power plant operators 154 -10 -6.5% 144 141 -3 -2.1% 139 -5 -3.5% 53 71 $81,141
51-8092 Gas plant operators 208 -12 -5.8% 196 178 -18 -9.2% 175 -21 -10.7% 72 96 $46,675
Technicians 763 -1 -0.1% 762 748 -14 -1.9% 760 -2 -0.3% 274 355 $66,726
17-3023 Electrical & Electronics Engineering Technicians 47 -4 -8.5% 43 43 0 0.0% 42 -1 -2.3% 15 20 $62,384
19-4051 Nuclear technicians 78 16 20.5% 94 98 4 4.3% 103 9 9.6% 34 44 $80,059
47-2111 Electricians 49 -4 -8.2% 45 43 -2 -4.4% 43 -2 -4.4% 16 21 $58,500
47-2151 Pipelayers 9 -1 -11.1% 8 7 -1 -12.5% 7 -1 -12.5% 3 4 $47,149
47-2152 Plumbers, pipefitters, and steamfitters 66 -9 -13.6% 57 52 -5 -8.8% 51 -6 -10.5% 20 27 $57,811
47-3015 Helpers, pipelayers, plumbers, pipefitters, and steamfitters 1 0 0.0% 1 1 0 0.0% 1 0 0.0% 0 0 $48,130
49-2095Electrical and electronics repairers, powerhouse, substation, and relay
104 1 1.0% 105 111 6 5.7% 117 12 11.4% 38 49 $87,173
49-9012Control and valve installers and repairers, except mechanical door
198 -9 -4.5% 189 171 -18 -9.5% 167 -22 -11.6% 68 88 $52,811
49-9041 Industrial machinery mechanics 85 3 3.5% 88 91 3 3.4% 96 8 9.1% 32 41 $52,565
49-9044 Millwrights 3 0 0.0% 3 3 0 0.0% 3 0 0.0% 1 1 $68,099
51-4041 Machinists 4 -1 -25.0% 3 3 0 0.0% 4 1 33.3% 1 1 $45,338
51-4121 Welders, cutters, solderers, & brazers 21 -1 -4.8% 20 19 -1 -5.0% 18 -2 -10.0% 7 9 $40,977
51-8012 Power Distributors & Dispatchers 98 8 8.2% 106 106 0 0.0% 108 2 1.9% 38 49 $88,338
Engineers 345 5 1.4% 350 356 6 1.7% 358 8 2.2% 126 183 $95,839
11-9041 Engineering managers 33 0 0.0% 33 33 0 0.0% 32 -1 -3.0% 12 17 $125,749
17-2041 Chemical engineers 3 0 0.0% 3 3 0 0.0% 3 0 0.0% 1 2 $93,288
17-2051 Civil engineers 24 -1 -4.2% 23 22 -1 -4.3% 21 -2 -8.7% 8 12 $79,831
17-2071 Electrical engineers 146 2 1.4% 148 157 9 6.1% 163 15 10.1% 53 77 $95,743
17-2081 Environmental engineers 6 -1 -16.7% 5 5 0 0.0% 4 -1 -20.0% 2 3 $88,109
17-2111Health and safety engineers, except mining safety engineers & inspectors
2 0 0.0% 2 2 0 0.0% 2 0 0.0% 1 1 $91,748
17-2141 Mechanical engineers 10 -1 -10.0% 9 9 0 0.0% 10 1 11.1% 3 5 $87,914
17-2161 Nuclear engineers 121 6 5.0% 127 125 -2 -1.6% 123 -4 -3.1% 46 66 $92,068
Total - All Occupations 2,134 -24 -1.1% 2,110 2,092 -18 -0.9% 2,112 2 0.1% 721 977 $75,372

W O R K F O R C E D E M A N D | N O R T H W E S T R E G I O N 1 1
WYOMING
SOC Code Description 2
00
9 J
ob
s
20
09
-14
Ch
an
ge
20
09
-14
%C
ha
ng
e
20
14 J
ob
s
20
19 J
ob
s
20
14-1
9 C
ha
ng
e
20
14-1
9 %
Ch
an
ge
20
24
Jo
bs
20
14-2
4 C
ha
ng
e
20
14-2
4 %
Ch
an
ge
20
14-1
9 P
roje
cte
d
Att
riti
on
&
Re
tire
me
nts
20
14-2
4 P
roje
cte
d
Att
riti
on
&
Re
tire
me
nts
Me
dia
n A
nn
ua
l
Ea
rnin
gs
Lineworkers 356 12 3.4% 368 387 19 4.9% 399 31 7.8% 108 151 $73,775
49-1011First-line supervisors/managers of mechanics, installers, & repairers
93 1 1.1% 94 95 1 1.1% 95 1 1.1% 28 38 $66,825
49-9051 Electrical power-line installers and repairers 263 11 4.2% 274 292 18 6.6% 304 30 10.9% 81 112 $76,160
Plant/Field Operators 444 3 0.7% 447 441 -6 -1.4% 440 -7 -1.6% 165 220 $74,102
51-8011 Nuclear power reactor operators 16 0 0.0% 16 17 1 6.3% 18 2 12.5% 6 8 $96,136
51-8013 Power plant operators 348 2 0.6% 350 341 -9 -2.6% 336 -14 -4.0% 129 172 $75,899
51-8092 Gas plant operators 80 1 1.3% 81 83 2 2.5% 86 5 6.2% 30 40 $61,984
Technicians 413 7 1.7% 420 435 15 3.4% 448 28 6.3% 151 196 $59,400
17-3023 Electrical & Electronics Engineering Technicians 30 0 0.0% 30 30 0 0.0% 29 -1 -3.3% 11 14 $50,987
19-4051 Nuclear technicians 13 1 7.7% 14 16 2 14.3% 18 4 28.6% 5 7 $47,730
47-2111 Electricians 62 0 0.0% 62 60 -2 -3.2% 60 -2 -3.2% 22 29 $51,861
47-2151 Pipelayers 1 0 0.0% 1 1 0 0.0% 1 0 0.0% 0 0 $33,988
47-2152 Plumbers, pipefitters, and steamfitters 17 0 0.0% 17 19 2 11.8% 20 3 17.6% 6 8 $39,420
47-3015 Helpers, pipelayers, plumbers, pipefitters, and steamfitters 1 0 0.0% 1 1 0 0.0% 1 0 0.0% 0 0 $30,305
49-2095Electrical and electronics repairers, powerhouse, substation, and relay
62 2 3.2% 64 69 5 7.8% 72 8 12.5% 23 30 $79,144
49-9012Control and valve installers and repairers, except mechanical door
96 -3 -3.1% 93 94 1 1.1% 94 1 1.1% 33 43 $58,864
49-9041 Industrial machinery mechanics 92 7 7.6% 99 104 5 5.1% 110 11 11.1% 36 46 $55,015
49-9044 Millwrights 3 0 0.0% 3 3 0 0.0% 3 0 0.0% 1 1 $65,853
51-4041 Machinists 3 0 0.0% 3 3 0 0.0% 3 0 0.0% 1 1 $42,707
51-4121 Welders, cutters, solderers, & brazers 18 0 0.0% 18 18 0 0.0% 19 1 5.6% 6 8 $45,658
51-8012 Power Distributors & Dispatchers 15 0 0.0% 15 17 2 13.3% 18 3 20.0% 5 7 $111,123
Engineers 131 3 2.3% 134 142 8 5.6% 148 14 9.5% 48 70 $80,605
11-9041 Engineering managers 10 0 0.0% 10 11 1 10.0% 11 1 10.0% 4 5 $104,486
17-2041 Chemical engineers 2 0 0.0% 2 2 0 0.0% 2 0 0.0% 1 1 $80,475
17-2051 Civil engineers 10 1 10.0% 11 11 0 0.0% 11 0 0.0% 4 6 $70,392
17-2071 Electrical engineers 82 3 3.7% 85 91 6 7.1% 96 11 12.9% 31 44 $75,157
17-2081 Environmental engineers 6 0 0.0% 6 5 -1 -16.7% 5 -1 -16.7% 2 3 $77,667
17-2111Health and safety engineers, except mining safety engineers & inspectors
1 0 0.0% 1 1 0 0.0% 1 0 0.0% 0 1 $68,791
17-2141 Mechanical engineers 6 0 0.0% 6 6 0 0.0% 6 0 0.0% 2 3 $75,238
17-2161 Nuclear engineers 14 -1 -7.1% 13 15 2 15.4% 16 3 23.1% 5 7 $111,253
Total - All Occupations 1,344 25 1.9% 1,369 1,405 36 2.6% 1,435 66 4.6% 472 636 $70,140

W O R K F O R C E D E M A N D | N O R T H W E S T R E G I O N 1 2
ABOUT This Report
This report was produced in collaboration between the Center for Energy Workforce Devel-
opment (CEWD) and Economic Modeling Specialists, Inc. (EMSI).
REGION DEFINITIONS
Mid-Atlantic Midwest Northeast Northwest South Southeast West
Delaware Illinois Connecticut Alaska Arkansas Alabama Arizona
Maryland Indiana Maine Idaho Louisiana Florida California
Pennsylvania Iowa Massachusetts Montana Oklahoma Georgia Colorado
Virginia Kansas New Hampshire Oregon Texas Kentucky Hawaii
West Virginia Michigan New Jersey Washington Mississippi Nevada
Washington, D.C. Minnesota New York Wyoming North Carolina New Mexico
Missouri Rhode Island South Carolina Utah
Nebraska Vermont Tennessee
North Dakota
Ohio
South Dakota
Wisconsin
ABOUT CEWD
Formed in March 2006, the Center for Energy Workforce Development (CEWD) is a non-
profit consortium of electric, natural gas, and nuclear utilities and their associations—Edi-
son Electric Institute, American Gas Association, Nuclear Energy Institute, and National
Rural Electric Cooperative Association. CEWD was formed to help utilities work together
to develop solutions to the coming workforce shortage in the utility industry. It is the first
partnership between utilities, their associations, contractors and unions to focus on the
need to build a skilled workforce pipeline that will meet future industry needs. Our mis-
sion is to build the alliances, processes, and tools to develop tomorrow’s energy workforce.
For more information about CEWD, visit us at www.cewd.org, or call us at 202.638.5802.
ABOUT EMSI
Economic Modeling Specialists International (EMSI), a CareerBuilder company, is a leading
provider of economic impact studies, labor market data, data-driven reports, and custom
consulting services to educational institutions, workforce planners, economic development

W O R K F O R C E D E M A N D | N O R T H W E S T R E G I O N 1 3
professionals, and private industry in North America and the UK. EMSI specializes in
detailed information about regional economies for assessment and planning purposes,
bringing together industry, workforce, economic development, and education/training per-
spectives. EMSI’s expertise is centered on regional economics, data integration and analysis,
programming, and design so that it can provide the best available products and services
for regional decision makers.
EMSI’s understands that a skilled, well-prepared workforce drives economic prosperity. The
successful development of that workforce requires the right training, recruiting, hiring,
and planning. These activities are largely dependent on our ability to process data that
illuminates many facets of employment and human capital so that we can make better
decisions. EMSI is here to provide that data. For more information about EMSI, visit us at
www.economicmodeling.com, or call us toll- free at 866.999.3674.

W O R K F O R C E D E M A N D | N O R T H W E S T R E G I O N 1 4
NORTH AMERICAN INDUSTRY CLASSIFICATION SYSTEM
Industry descriptions are taken from the North American Industry Classification System
(NAICS) website.* The NAICS codes listed below are those requested by CEWD for this report.
Hydroelectric Energy (NAICS 221111)—This U.S. industry comprises establishments pri-
marily engaged in operating hydroelectric power generation facilities. These facilities use
water power to drive a turbine and produce electric energy. The electric energy produced
in these establishments is provided to electric power transmission systems or to electric
power distribution systems.
Fossil Fuel Energy (NAICS 221112)—TThis U.S. industry comprises establishments pri-
marily engaged in operating fossil fuel powered electric power generation facilities. These
facilities use fossil fuels, such as coal, oil, or gas, in internal combustion or combustion
turbine conventional steam process to produce electric energy. The electric energy produced
in these establishments is provided to electric power transmission systems or to electric
power distribution systems.
Nuclear Energy (NAICS 221113)—This U.S. industry comprises establishments primarily
engaged in operating nuclear electric power generation facilities. These facilities use nuclear
power to produce electric energy. The electric energy produced in these establishments is
provided to electric power transmission systems or to electric power distribution systems.
Solar Electric Power Generation (NAICS 221114)—This U.S. industry comprises establish-
ments primarily engaged in operating solar electric power generation facilities. These
facilities use energy from the sun to produce electric energy. The electric energy produced
in these establishments is provided to electric power transmission systems or to electric
power distribution systems.
Wind Electric Power Generation (221115)—This U.S. industry comprises establishments
primarily engaged in operating wind electric power generation facilities. These facilities use
wind power to drive a turbine and produce electric energy. The electric energy produced
in these establishments is provided to electric power transmission systems or to electric
power distribution systems.
* U.S. Census Bureau, “North American Industry Classification System (NAICS).” http://www.census.gov/eos/www/naics/ (accessed April 26, 2012).
APPENDIX Industry & Occupation Definitions

W O R K F O R C E D E M A N D | N O R T H W E S T R E G I O N 1 5
Geothermal Electric Power Generation (NAICS 221116)—This U.S. industry comprises
establishments primarily engaged in operating geothermal electric power generation facili-
ties. These facilities use heat derived from the Earth to produce electric energy. The electric
energy produced in these establishments is provided to electric power transmission systems
or to electric power distribution systems.
Biomass Electric Power Generation (NAICS 221117)—This U.S. industry comprises estab-
lishments primarily engaged in operating biomass electric power generation facilities.
These facilities use biomass (e.g., wood, waste, alcohol fuels) to produce electric energy.
The electric energy produced in these establishments is provided to electric power trans-
mission systems or to electric power distribution systems.
Other Electric Power Generation (NAICS 221118)—This U.S. industry comprises establish-
ments primarily engaged in operating electric power generation facilities (except hydroelectric,
fossil fuel, nuclear, solar, wind, geothermal, biomass). These facilities convert other forms
of energy, such as tidal power, into electric energy. The electric energy produced in these
establishments is provided to electric power transmission systems or to electric power dis-
tribution systems. For example, this industry could include tidal electric power generation.
Electric Bulk Transmission & Control (NAICS 221121)—This U.S. industry comprises estab-
lishments primarily engaged in operating electric power transmission systems and/or con-
trolling (i.e., regulatory voltage) the transmission of electricity from the generating source
to distribution centers or other electric utilities. The transmission system includes lines
and transformer stations.
Electric Power Distribution (NAICS 221122)—This U.S. industry comprises electric power
establishments primarily engaged in either (1) operating electric power distribution sys-
tems (i.e., consisting of lines, poles, meters, and wiring) or (2) operating as electric power
brokers or agents that arrange the sale of electricity via power distribution systems oper-
ated by others.
Natural Gas Distribution (NAICS 221210)—This industry comprises: (1) establishments
primarily engaged in operating gas distribution systems (e.g., mains, meters); (2) estab-
lishments known as gas marketers that buy gas from the well and sell it to a distribution
system; (3) establishments known as gas brokers or agents that arrange the sale of gas
over gas distribution systems operated by others; and (4) establishments primarily engaged
in transmitting and distributing gas to final consumers.
STANDARD OCCUPATION CLASSIFICATIONS
Standard Occupation Classification (SOC) employment codes are taken from the U.S. Depart-
ment of Labor, Bureau of Labor Statistics.* The SOCs listed below are those requested by
CEWD for this report.
* U.S. Department of Labor, Bureau of Labor Statistics, http://www.bls.gov/soc/major_groups.htm (accessed April 26, 2012).

W O R K F O R C E D E M A N D | N O R T H W E S T R E G I O N 1 6
LINEWORKERS:
49-1011 First-Line Supervisors of Mechanics, Installers, and Repairers—Directly super-
vise and coordinate the activities of mechanics, installers, and repairers. Excludes team
or work leaders.
49-9051 Electrical Power-Line Installers and Repairers—Install or repair cables or wires
used in electrical power or distribution systems. May erect poles and light or heavy-duty
transmission towers. Excludes “Electrical and Electronics Repairers, Powerhouse, Substa-
tion, and Relay” (49-2095).
PLANT/FIELD OPERATORS:
51-8011 Nuclear Power Reactor Operators—Operate or control nuclear reactors. Move
control rods, start and stop equipment, monitor and adjust controls, and record data in logs.
Implement emergency procedures when needed. May respond to abnormalities, determine
cause, and recommend corrective action.
51-8013 Power Plant Operators—Control, operate, or maintain machinery to generate
electric power. Includes auxiliary equipment operators. Excludes “Nuclear Power Reactor
Operators” (51-8011).
51-8092 Gas Plant Operators—Distribute or process gas for utility companies and others
by controlling compressors to maintain specified pressures on main pipelines.
TECHNICIANS:
17-3023 Electrical and Electronics Engineering Technicians—Apply electrical and elec-
tronic theory and related knowledge, usually under the direction of engineering staff, to
design, build, repair, calibrate, and modify electrical components, circuitry, controls, and
machinery for subsequent evaluation and use by engineering staff in making engineering
design decisions. Excludes “Broadcast Technicians” (27-4012).
19-4051 Nuclear Technicians—Assist nuclear physicists, nuclear engineers, or other sci-
entists in laboratory or production activities. May operate, maintain, or provide quality
control for nuclear testing and research equipment. May monitor radiation.
47-2111 Electricians—Install, maintain, and repair electrical wiring, equipment, and fix-
tures. Ensure that work is in accordance with relevant codes. May install or service street
lights, intercom systems, or electrical control systems. Excludes “Security and Fire Alarm
Systems Installers” (49-2098).
47-2151 Pipelayers—Lay pipe for storm or sanitation sewers, drains, and water mains.
Perform any combination of the following tasks: grade trenches or culverts, position pipe,
or seal joints. Excludes “Welders, Cutters, Solderers, and Brazers” (51-4121).
47-2152 Plumbers, Pipefitters, and Steamfitters—Assemble, install, alter, and repair
pipelines or pipe systems that carry water, steam, air, or other liquids or gases. May install
heating and cooling equipment and mechanical control systems. Includes sprinklerfitters.

W O R K F O R C E D E M A N D | N O R T H W E S T R E G I O N 1 7
47-3015 Helpers—Pipelayers, Plumbers, Pipefitters, and Steamfitters—Help plumbers,
pipefitters, steamfitters, or pipelayers by performing duties requiring less skill. Duties include
using, supplying or holding materials or tools, and cleaning work area and equipment. Con-
struction laborers who do not primarily assist plumbers, pipefitters, steamfitters, or pipelay-
ers are classified under “Construction Laborers” (47-2061). Apprentice workers are classified
with the appropriate skilled construction trade occupation (47-2011 through 47-2231).
49-2095 Electrical and Electronics Repairers, Powerhouse, Substation, and Relay—
Inspect, test, repair, or maintain electrical equipment in generating stations, substations,
and in-service relays.
49-9012 Control and Valve Installers and Repairers, Except Mechanical Door—Install,
repair, and maintain mechanical regulating and controlling devices, such as electric meters,
gas regulators, thermostats, safety and flow valves, and other mechanical governors.
49-9041 Industrial Machinery Mechanics—Repair, install, adjust, or maintain industrial
production and processing machinery or refinery and pipeline distribution systems. Excludes
“Millwrights” (49-9044), “Mobile Heavy Equipment Mechanics, Except Engines” (49-3042),
and “Maintenance Workers, Machinery” (49-9043).
49-9044 Millwrights—Install, dismantle, or move machinery and heavy equipment accord-
ing to layout plans, blueprints, or other drawings.
51-4041 Machinists—Set up and operate a variety of machine tools to produce precision
parts and instruments. Includes precision instrument makers who fabricate, modify, or repair
mechanical instruments. May also fabricate and modify parts to make or repair machine
tools or maintain industrial machines, applying knowledge of mechanics, mathematics,
metal properties, layout, and machining procedures.
51-4121 Welders, Cutters, Solderers, and Brazers—Use hand-welding, flame-cutting,
hand-soldering, or brazing equipment to weld or join metal components or to fill holes,
indentations, or seams of fabricated metal products.
51-8012 Power Distributors and Dispatchers—Coordinate, regulate, or distribute electric-
ity or steam.
ENGINEERS:
11-9041 Architectural and Engineering Managers—Plan, direct, or coordinate activities in
such fields as architecture and engineering or research and development in these fields.
Excludes “Natural Sciences Managers” (11-9121).
17-2041 Chemical Engineers—Design chemical plant equipment and devise processes
for manufacturing chemicals and products, such as gasoline, synthetic rubber, plastics,
detergents, cement, paper, and pulp, by applying principles and technology of chemistry,
physics, and engineering.

W O R K F O R C E D E M A N D | N O R T H W E S T R E G I O N 1 8
17-2051 Civil Engineers—Perform engineering duties in planning, designing, and oversee-
ing construction and maintenance of building structures, and facilities, such as roads,
railroads, airports, bridges, harbors, channels, dams, irrigation projects, pipelines, power
plants, and water and sewage systems. Includes architectural, structural, traffic, ocean,
and geo-technical engineers. Excludes “Hydrologists” (19-2043).
17-2071 Electrical Engineers—Research, design, develop, test, or supervise the manufac-
turing and installation of electrical equipment, components, or systems for commercial,
industrial, military, or scientific use. Excludes “Computer Hardware Engineers” (17-2061).
17-2081 Environmental Engineers—Research, design, plan, or perform engineering duties
in the prevention, control, and remediation of environmental hazards using various engi-
neering disciplines. Work may include waste treatment, site remediation, or pollution
control technology.
17-2111 Health and Safety Engineers, Except Mining Safety Engineers and Inspec-
tors—Promote worksite or product safety by applying knowledge of industrial processes,
mechanics, chemistry, psychology, and industrial health and safety laws. Includes industrial
product safety engineers.
17-2141 Mechanical Engineers—Perform engineering duties in planning and designing tools,
engines, machines, and other mechanically functioning equipment. Oversee installation,
operation, maintenance, and repair of equipment such as centralized heat, gas, water, and
steam systems.
17-2161 Nuclear Engineers—Conduct research on nuclear engineering projects or apply
principles and theory of nuclear science to problems concerned with release, control, and
use of nuclear energy and nuclear waste disposal.
