census transportation planning products (ctpp) penelope weinberger ctpp program manager - aashto
DESCRIPTION
Census Transportation Planning Products (CTPP) Penelope Weinberger CTPP Program Manager - AASHTO. Oregon SDC Meeting (November 4, 2010). What is the CTPP Program Today?. - PowerPoint PPT PresentationTRANSCRIPT
Census Transportation Planning Products (CTPP)
Penelope Weinberger CTPP Program Manager - AASHTO
Oregon SDC Meeting(November 4, 2010)
1

What is the CTPP Program Today?
The CTPP is an umbrella program of data products, custom tabulations, training, technical assistance, and research for the transportation community.
CTPP uses American Community Survey (ACS) data from U.S. Census Bureau.
WARNING!
Decennial Census has no Long Form – No JTW data in Decennial Census!
2

History of CTPP
Buyers/Users Direct Cost Tables
1960 OMB ??? ???
1970 Individual contracts (112)
$0.6 M 43
1980 Individual contracts (152)
$2.0 M 82
1990Nationwide
covering all States and MPOs
$2.5 M 120
2000 $3.0 M 203
today $5.8 M 200*

CTPP Then and Now
CTPPackage CTPProducts Program
The CTPP program now includes:
– Data products
– Training and technical assistance• On-call user support• Training classes and web seminars
– Research• Integration of data sources• Disclosure avoidance
4

CTPP Program Activities and Costs
Develop specialized data products 63%
Conduct research, training and outreach 21%
Manage the program 3%
Unallocated balance 12%
Total Program Costs $5,844,332
5-Year Program: 2008 ~ 20125

CTPP Basics
• Planning Support for over 20 federal planning requirements• Data for supporting a wide variety of transportation
planning tasks – Policy studies– Travel demand modeling– Congestion management– Emergency preparedness– Corridor and project studies– Transit new start and service planning– Environmental justice studies– Air quality conformity – Environmental justice reviews– Trends analyses

CTPP Accomplishments To Date
• State, Local and County Profiles for 2005-2007 are completed and posted at the AASHTO website
• CTPP based on 3-Year ACS list finalized and Special Tabulations delivered to FHWA and AASHTO in late June/early July, with web-based delivery to practitioners expected October/November 2010
• Data access software development underway – Beta testing in November– Final in December
• Plans for a TRB Census Conference in fall 2011 are underway
• CTPP based on 5-Year ACS (2006 – 2010) table list developed as part of NCHRP 8-79 Disclosure Proofing Research Project

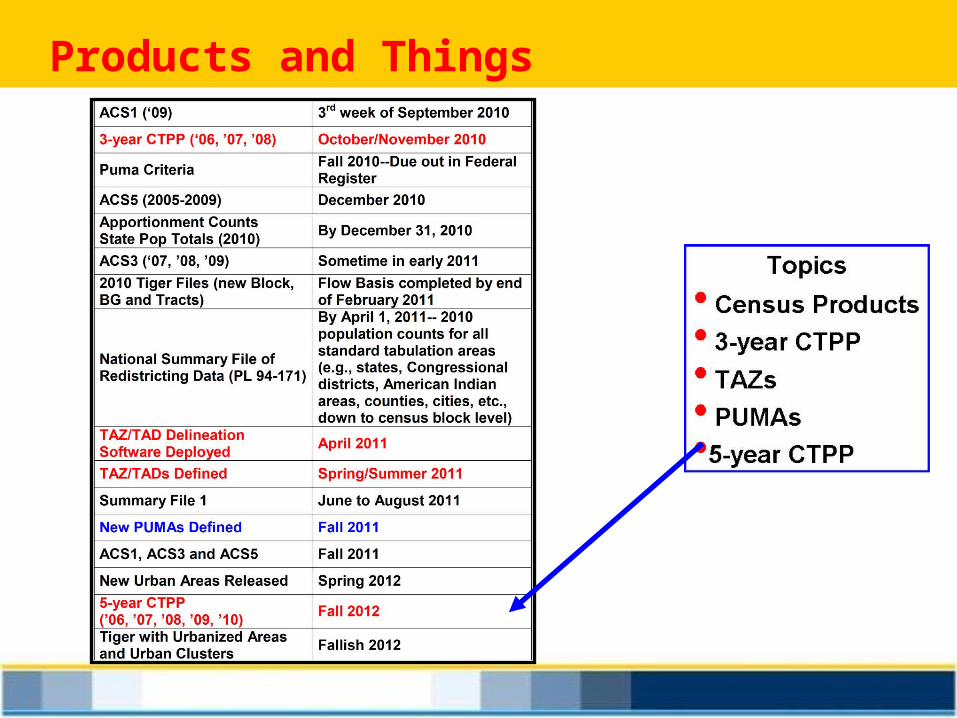
Products and Things

3-year CTPP Data Product
CTPP 3-Year
September 2010
Oct/Nov 2010
2006, 2007, 2008
20,000 Pop. Areas
(County, Place, PUMAs)
Actual Flows
http://trbcensus.com/products
_______________

The 3-year Product Design
2000 Geography
MSA – EACH Principal City
Metropolitan Statistical Area
State-POW PUMA
State-PUMA
State-Place
State-County-MCD
State-County
Nation (US Total)
Product Structure
3-Parts
Part 1- Place of Residence
Part 2- Place of Work
Part 3- Flows between Home and Work
with On-Line Extraction Software
State
http://ctpp.transportation.org/Documents/CTPP_custom_tabulations_based_on_3yracs2006_2008.xls
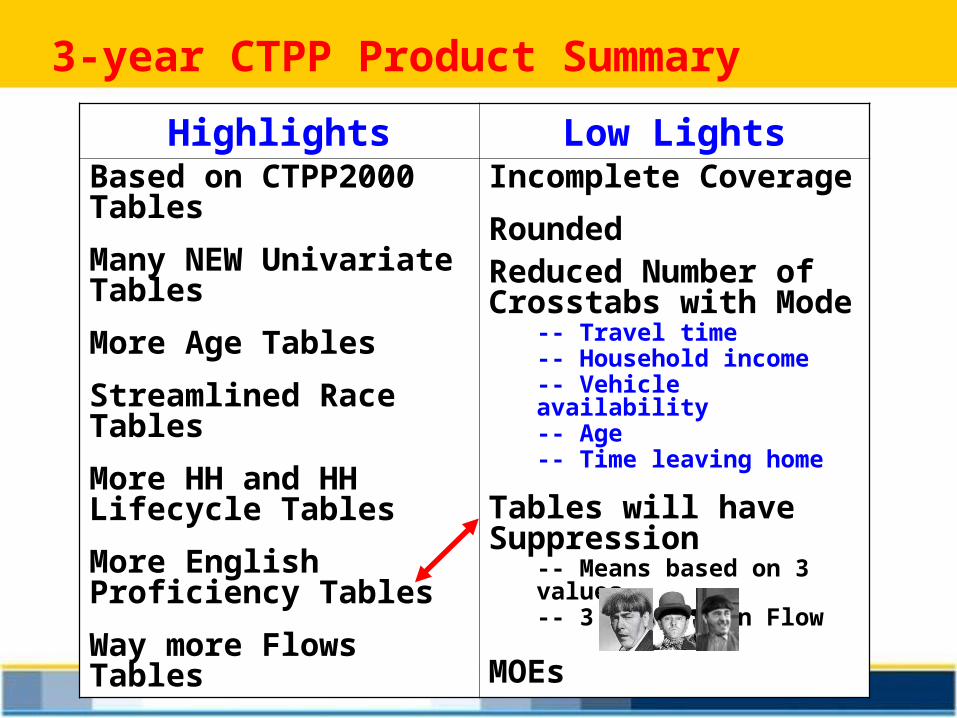
3-year CTPP Product Summary
Highlights Low LightsBased on CTPP2000 Tables
Many NEW Univariate Tables
More Age Tables
Streamlined Race Tables
More HH and HH Lifecycle Tables
More English Proficiency Tables
Way more Flows Tables
Incomplete Coverage
RoundedReduced Number of Crosstabs with Mode
-- Travel time-- Household income-- Vehicle availability-- Age-- Time leaving home
Tables will have Suppression
-- Means based on 3 values -- 3 records in Flow
MOEs
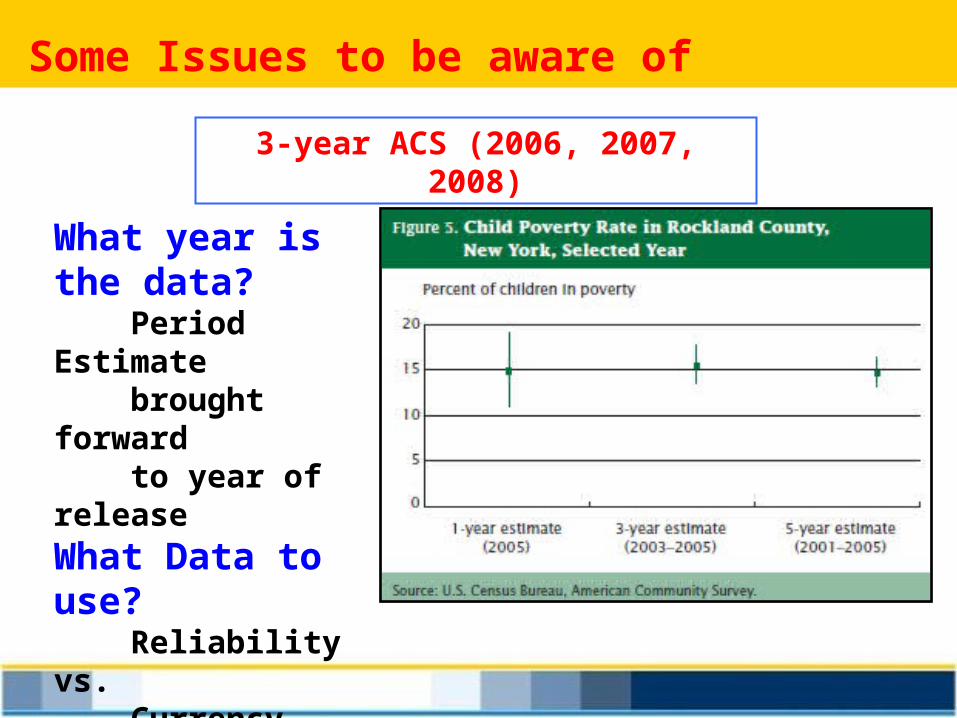
Some Issues to be aware of
What year is the data? Period Estimate brought forward to year of releaseWhat Data to use? Reliability vs. Currency
3-year ACS (2006, 2007, 2008)

Significance Testing--Why do it?
MOE, MOE, MOE
http://www.edthefed.com/presentations/significance%20testing.ppt
Source: CTPP Data Profiles http://ctpp.transportation.org/Pages/overview.aspx

A Compass for Understanding And Using ACS Data
Set of user-specific handbooks
Train-the trainer materials
E-learning ACS Tutorial
http://www.census.gov/acs/www/UseData/Compass/compass_series.html
Working with ACS
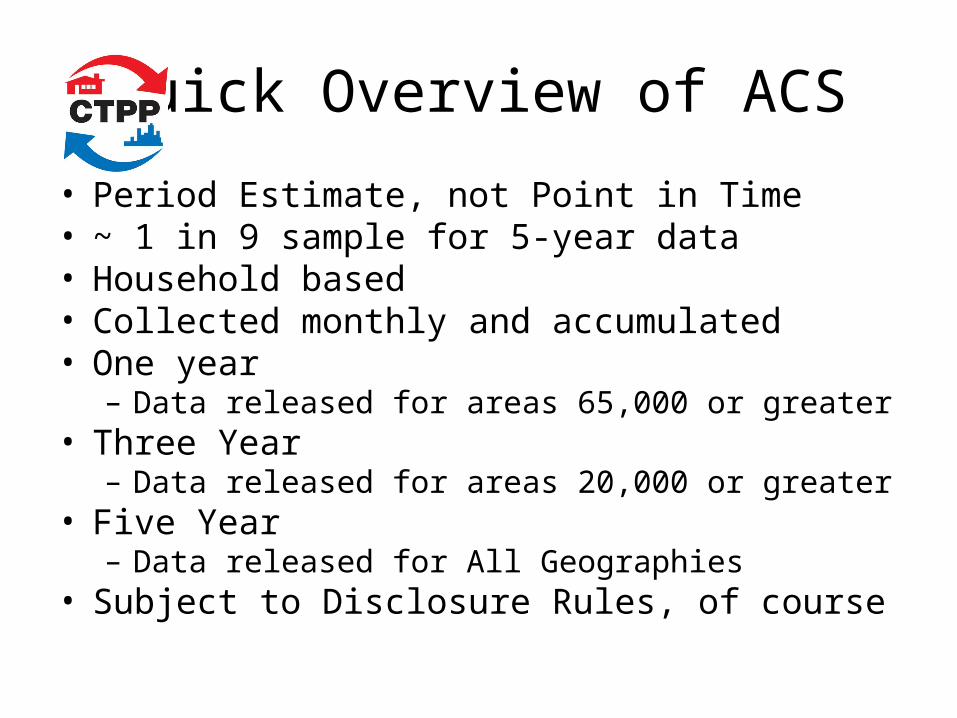
Quick Overview of ACS
• Period Estimate, not Point in Time• ~ 1 in 9 sample for 5-year data• Household based• Collected monthly and accumulated• One year
– Data released for areas 65,000 or greater• Three Year
– Data released for areas 20,000 or greater• Five Year
– Data released for All Geographies• Subject to Disclosure Rules, of course

Collapsing
3 unweighted records for each Mode
A word about Collapsing
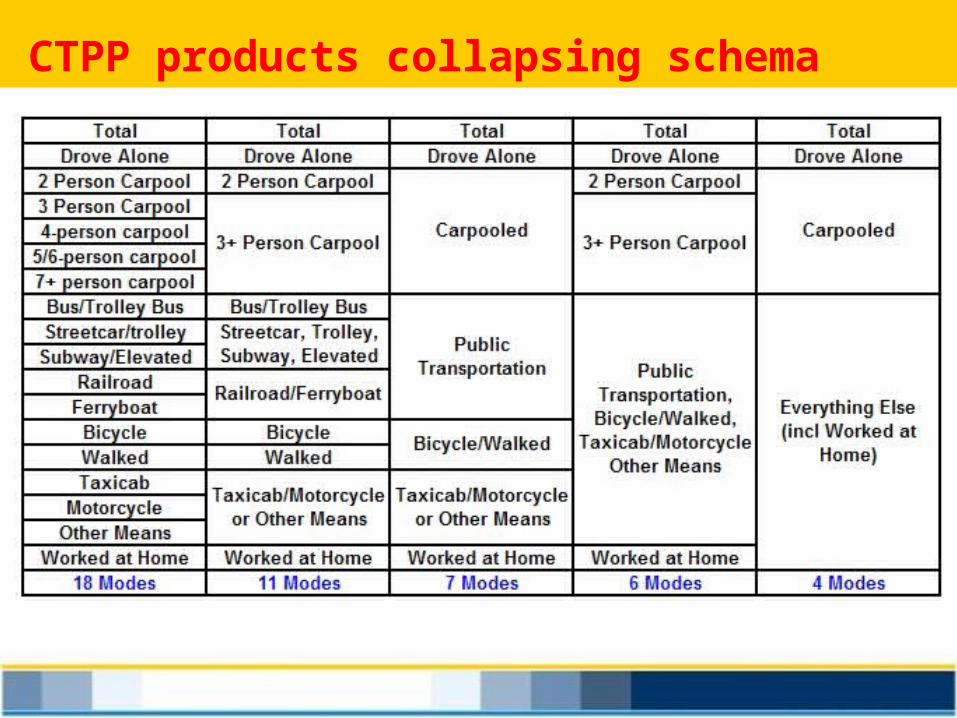
CTPP products collapsing schema
Accessing the 3-year data
• All available on a single easy-to-use free website– Free to use, but you do need to register– Online help and tutorials help users along the way
• Create “sessions”, which are groups of tables with a common geography selection– Select geography using a map and/or drill down
through the geographic hierarchy
• Search for tables by dimension name or any relevant word– Either within one of the parts or across all parts

Viewing the data
• Open any table, either in your “session” or from the public view.
• From there, you can customize your view of the data:– Rearrange dimensions– Make selections on any dimension– View charts– View the data on a thematic map– Aggregate items using standard functions or provide a formula
(margin of error will be recalculated for you for simpler formulas)– Save your report for future use– Save your selections and aggregations for use in other tables

Exporting the Data
• Once you have set up the table you want to see, you can export it:
– Export the data in CSV, XLS or Beyond 20/20 (IVT) format for use in your own analysis tools
– Export SHP files for viewing maps in your own GIS engine
• Entire “sessions” can be exported in a single operation.

Products and Things

TAZ
• Software being developed by Caliper at CB
• TAZ Delineation Business Rules

TAZ Size
• The Census Bureau recommends – approximately 600 persons
• This minimum corresponds to the minimum threshold allowable for 2010 Census block groups.
– threshold is guideline not a requirement. – Base TAZ may be defined with fewer than 600
residents or workers – as a general rule, data reliability and availability
improves as population size or number of workers increases.
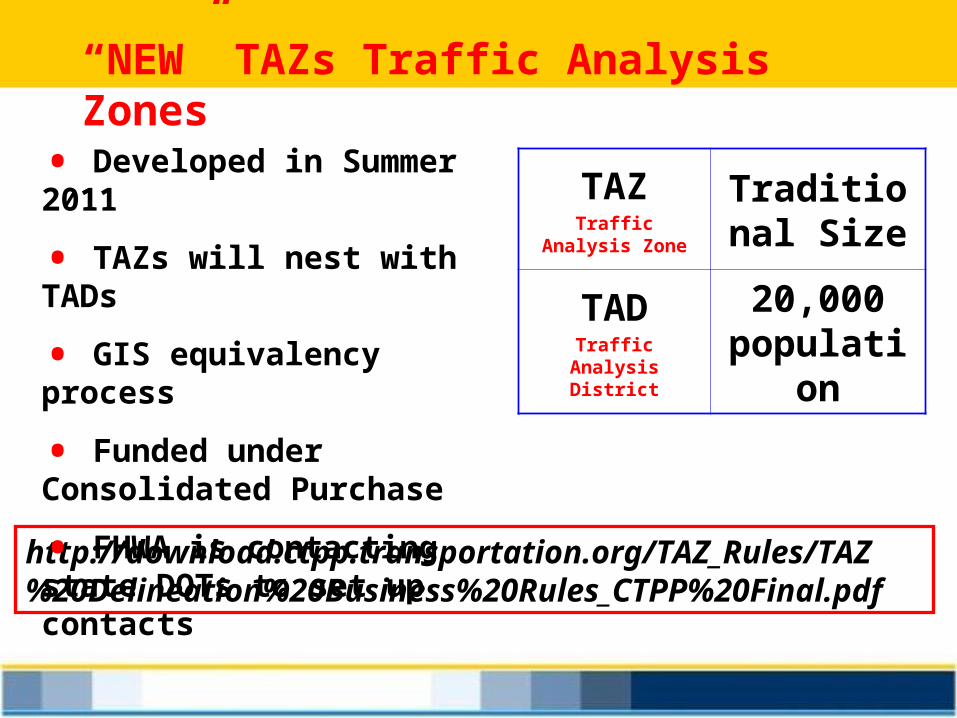
“NEW” TAZs Traffic Analysis Zones
http://download.ctpp.transportation.org/TAZ_Rules/TAZ%20Delineation%20Business%20Rules_CTPP%20Final.pdf
• Developed in Summer 2011
• TAZs will nest with TADs
• GIS equivalency process
• Funded under Consolidated Purchase
• FHWA is contacting state DOTs to set up contacts
TAZTraffic Analysis Zone
Traditional Size
TADTraffic Analysis
District
20,000 population

Products and Things

Why are PUMAs Important?
Let’s Look at Annual Data
● Annual Data
● 65K+
● Note the areas in gray
● We call this Swiss Cheese
NE Illinois (2008 pop estimate)
Chicago
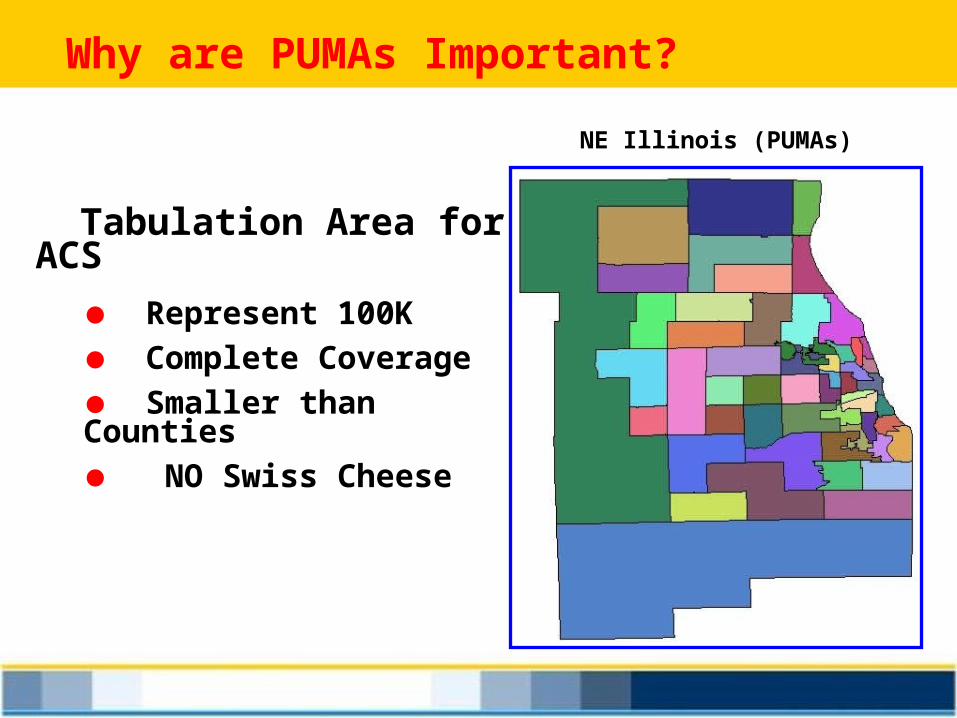
Why are PUMAs Important?
NE Illinois (PUMAs)
Tabulation Area for ACS
● Represent 100K
● Complete Coverage
● Smaller than Counties
● NO Swiss Cheese

How many PUMAs should this area have?
http://www.census.gov/geo/www/maps/puma5pct.htm
City of Chicago 2000 PUMAs
2,896,016 (2000 Pop)
Why are PUMAs Important?
- Defines areas for analysis - Tabulation Area for ACS
Who Defines Them? - The Community - Led by State Data Center
When are They Defined? - Summer 2011 - Criteria out Spring 2010
Products and Things
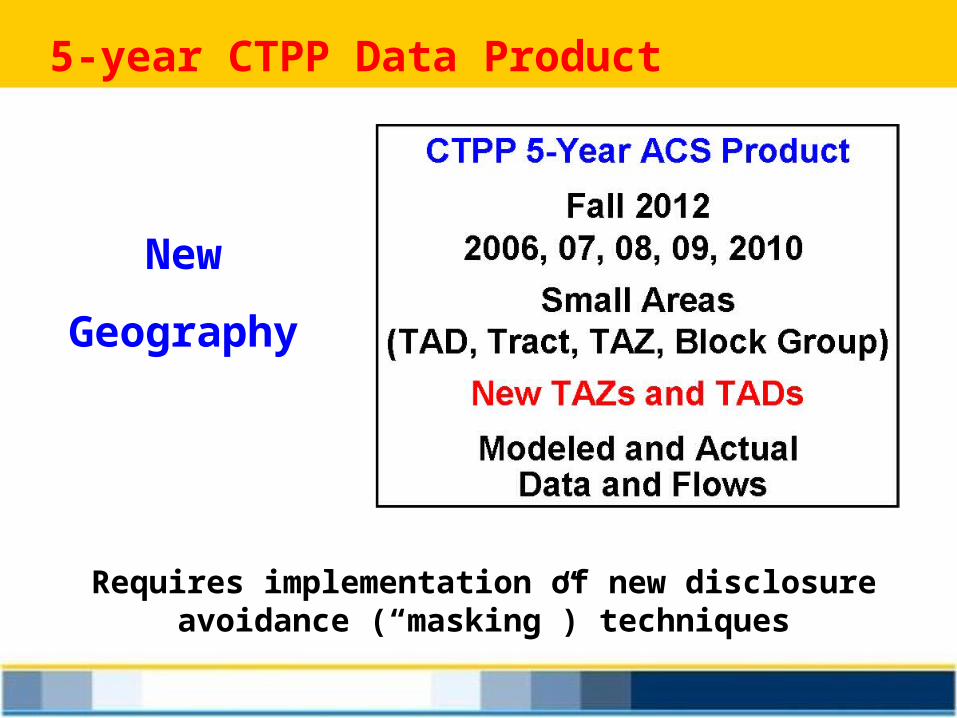
New
Geography
Requires implementation of new disclosure avoidance (“masking”) techniques
5-year CTPP Data Product
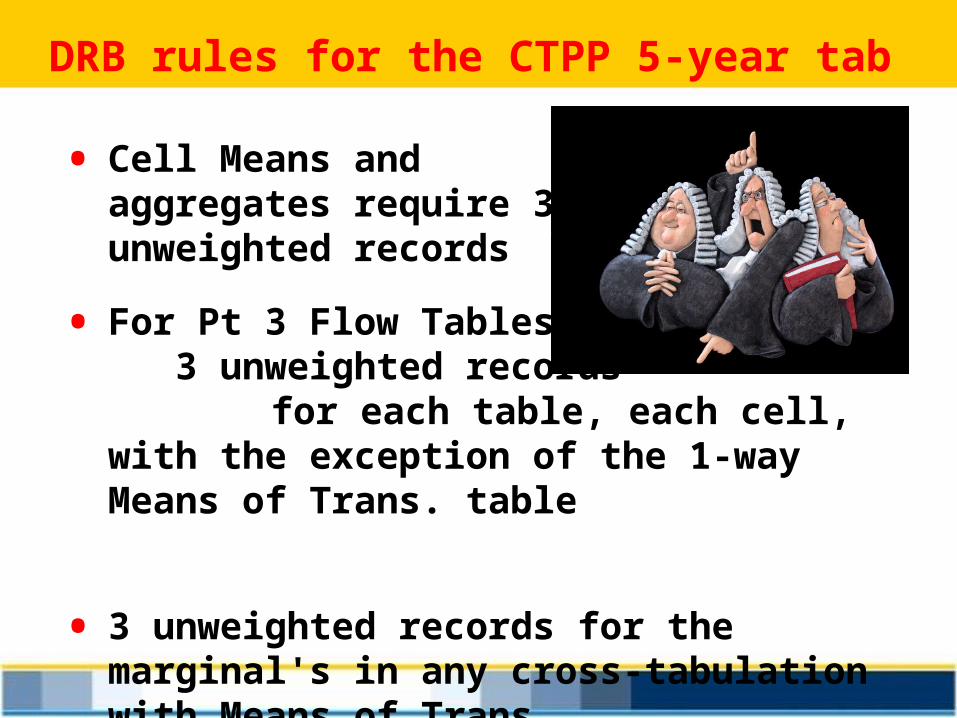
• Cell Means and aggregates require 3 unweighted records
DRB rules for the CTPP 5-year tab
• For Pt 3 Flow Tables: 3 unweighted records for each table, each cell, with the exception of the 1-way Means of Trans. table
• 3 unweighted records for the marginal's in any cross-tabulation with Means of Trans.

5-year CTPP Data Product
NCHRP 08-79 ($550K) Producing Transportation Data Products from the ACS that Comply With Disclosure Rules
NCHRP is funded by State DOTs SP&R
Project schedule: Jan 2010-July 2011Fast-track with final report due in July 2011
Need results to be applied to 2006-2010 ACS for the 5-year CTPP (delivery to software vendor in summer 2012)
http://rip.trb.org/browse/dproject.asp?n=22349

CTPP Oversight Board17 Voting Members – 9 States, 8 MPOs
10 Ex-Officio Members
• Jennifer Finch, Chair, CO
• Jonette Kreideweis, Vice Chair, MN
• Laine Heltebridle, PA • Nathan Erlbaum, NY• Hui Wei Shen, FL• Paul Agnello, VA • Phillip Mescher, IA• Ahmad Jaber, UT• Ayalew Adamu, CA
• Kuo-Ann Chiao, NYMTC• Mell Henderson, MARC• Arash Mirzaei, NCTCOG• Guy Rousseau, ARC• Clara Reschovsky,
MWCOG• Pete Swensson, TRPC• Vacancy*• Penelope Weinberger,
AASHTO, CTPP Program Manager
33
CTPP Oversight BoardEx-Officio Members
• Ed Christopher, FHWA• Alison Fields, Census
Bureau• Rich Denbow, AMPO• Elaine Murakami, FHWA• Melanie Rapino, Census
Bureau
• Erika Young, NARC• Alan Pisarski,
Consultant• Steven Polzin, USF.
CUTR • Nanda Srinivasan, TRB• Ken Cervenka, FTA
AASHTO Census Data Work Group With 30+ MembersCTPP Federal Technical Advisory Group
TRB Subcommittees– List Serve (830 Members) & Quarterly Newsletters
34
CTPP Key Contacts
• Penelope WeinbergerAASHTO CTPP Program [email protected]
• Brian McKenzieCensus BureauJTW & Migration [email protected]
http://ctpp.transportation.org
35