using ctpp data for passenger ferry demand forecasting
TRANSCRIPT

Using CTPP Data for Passenger Ferry Demand Forecasting
TRB: Applying Census Data for Transportation
Megan Brock, Mario Scott, Pierre Vilain
November 15, 2017

|
Agenda
Passenger ferry modeling and Steer Davies Gleave
Citywide Ferry Study and Kitsap Transit POF Long-Range Strategy
Project context & methodology
Why we use CTPP data
How we use CTPP data
Decisions made regarding CTPP data
Project outcome
Lessons learned
November 15, 2017 Using CTPP Data for Passenger Ferry Demand Forecasting 2

|
Citywide Ferry Study | New York, NY
Kitsap Transit Passenger-Only Ferry Modeling | Seattle, WA
Stamford High Speed Ferry | Stamford, CT
Staten Island Ferry Overnight Service Expansion | New York, NY
Staten Island Ferry to Midtown | New York, NY
Boston Harbor Now | Boston, MA
Advisory for Maritime Transportation Services | Puerto Rico
Casco Bay Transit Schedule Analysis | Portland, ME
November 15, 2017 Using CTPP Data for Passenger Ferry Demand Forecasting 3

|
Citywide Ferry Study – 2013
New York City Economic Development Corporation
CFS2013
50+ locations
Six potential routes
Revenues, costs, and subsidy levels
Fare levels and headways
Economics benefits
Environmental impacts
Resiliency impacts
Outcome: New York City Ferry System
November 15, 2017 Using CTPP Data for Passenger Ferry Demand Forecasting 4
East River Ferry Service
Ridership
Potential JTW and Leisure
Demand
Service and
Operating Costs
Net Revenues
Capital Costs
CFS2013 Ridership Approach
Source: NYCEDC, East River Ferry (top)

|
CFS2013: Methodology Tr
ip D
eman
d P
ote
nti
al
- 2000 CTPP
- 2010 Census
- 2007-12 ACS
- Planned City Development
- Survey data
- GIS buffer analysis
Ferr
y M
od
e Sp
lit
- 2009 SP Survey
- Level of service characteristics: headways, transfers, travel and wait times, access times Mo
del
Cal
ibra
tio
n
- Detailed East River Ferry Ridership data
- User surveys for on-off patterns
- Seasonal and weekly variations, annual totals
Estimation of Ferry Ridership Potential
November 15, 2017 Using CTPP Data for Passenger Ferry Demand Forecasting 5
|
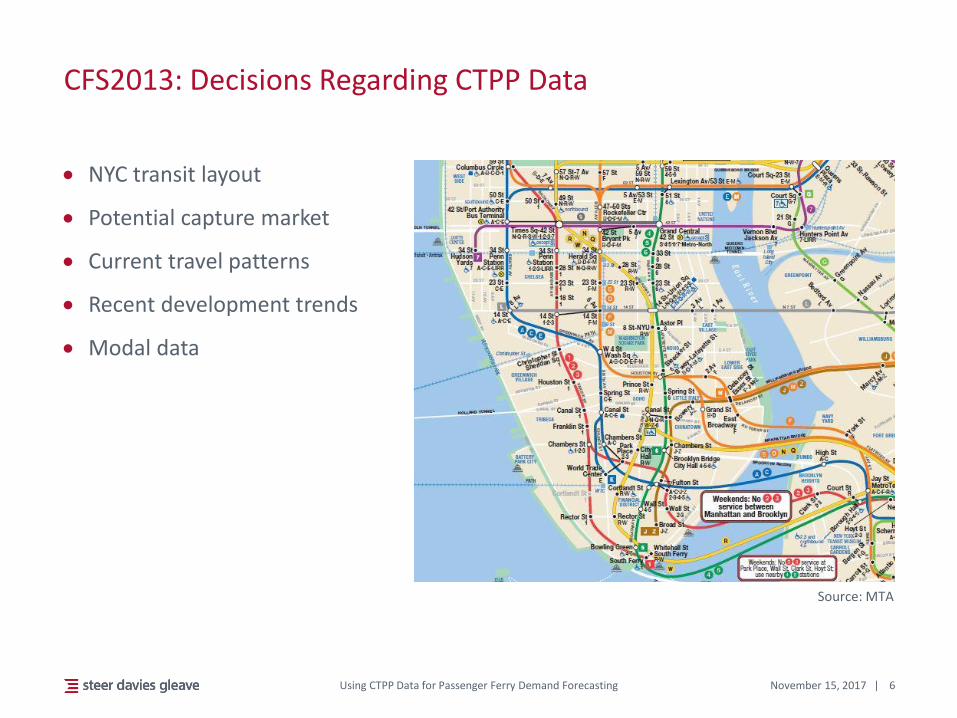
CFS2013: Decisions Regarding CTPP Data
NYC transit layout
Potential capture market
Current travel patterns
Recent development trends
Modal data
November 15, 2017 Using CTPP Data for Passenger Ferry Demand Forecasting 6
Source: MTA

|
CFS2013: Site Profiles
Demographic data
Additional development
Journey-to-Work data
Ferry vs other transit times comparison
Existing infrastructure
Primary and Secondary Market Areas
PMA: 8 minute walk
SMA: 12 minute walk
November 15, 2017 Using CTPP Data for Passenger Ferry Demand Forecasting 7
Source: SDG, OpenStreetMap
|
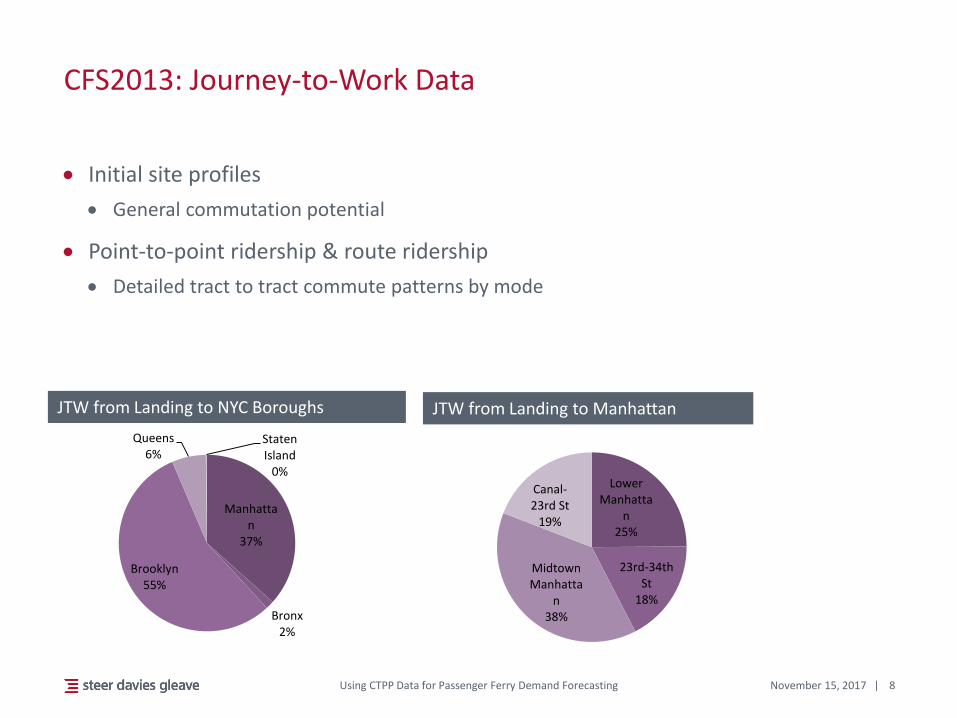
CFS2013: Journey-to-Work Data
Initial site profiles
General commutation potential
Point-to-point ridership & route ridership
Detailed tract to tract commute patterns by mode
November 15, 2017 Using CTPP Data for Passenger Ferry Demand Forecasting 8
Manhattan
37%
Bronx 2%
Brooklyn 55%
Queens 6%
Staten Island
0% Lower
Manhattan
25%
23rd-34th St
18%
Midtown Manhatta
n 38%
Canal-23rd St
19%
JTW from Landing to Manhattan JTW from Landing to NYC Boroughs
|
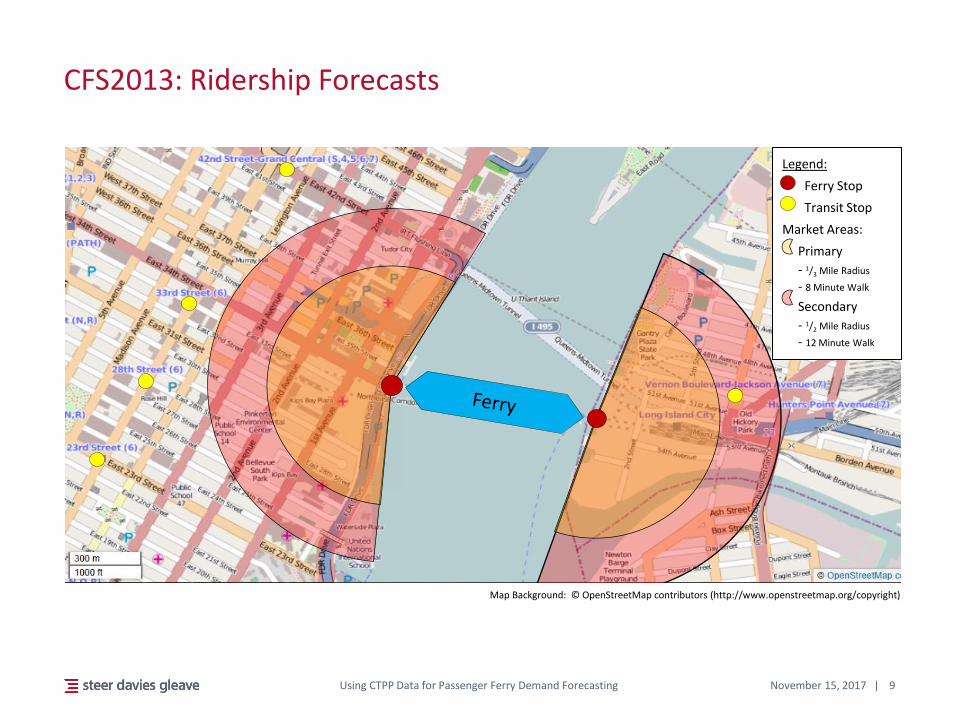
CFS2013: Ridership Forecasts
November 15, 2017 Using CTPP Data for Passenger Ferry Demand Forecasting 9
Legend:
Ferry Stop
Transit Stop
Market Areas:
Primary
- 1/3 Mile Radius
- 8 Minute Walk
Secondary
- 1/2 Mile Radius
- 12 Minute Walk
Map Background: © OpenStreetMap contributors (http://www.openstreetmap.org/copyright)

| November 15, 2017 Using CTPP Data for Passenger Ferry Demand Forecasting 10
Source: NYCEDC, NYC Ferry

|
Kitsap Transit Passenger Only Ferry Strategy Development
Team led by KPFF to develop a strategy and business plan for Kitsap Transit POF
SDG: ridership and revenue forecasts
Background
Early 1900s: first POF service in the region
1981: Kitsap Transit formed
2011: Kingston – Seattle service introduced
2012: Kingston – Seattle service cancelled
2013 Status
Historic data for calibration, but still need a mode choice model
November 15, 2017 Using CTPP Data for Passenger Ferry Demand Forecasting 11
• Seattle

|
Kitsap Transit: Proposed Routes
November 15, 2017 Using CTPP Data for Passenger Ferry Demand Forecasting 12

|
Kitsap Transit: Methodology
November 15, 2017 Using CTPP Data for Passenger Ferry Demand Forecasting 13
Determine Divertible Market
• Pre-existing foot passenger service
• No pre-existing foot passenger service
Calculate Route Shares
• Multinomial logit model
• Calibration of route choice model
Ridership Forecasts
• Diversion
• Breakdown into daily, hourly profiles
• Frequency scenarios
• Growth

|
Kitsap Transit: Decisions Regarding CTPP Data
Current travel patterns
Pre-existing foot ferry service
Seattle region transit layout
Potential capture market: aggregation to zones
November 15, 2017 Using CTPP Data for Passenger Ferry Demand Forecasting 14

|
Kitsap Transit: Commuter Growth
November 15, 2017 Using CTPP Data for Passenger Ferry Demand Forecasting 15
Volumes Percentages

|
Kitsap Transit: Outcomes
November 15, 2017 Using CTPP Data for Passenger Ferry Demand Forecasting 16
Long-range strategy and business plan: approved by election in November 2016
Bremerton – Seattle: active as of July 10, 2017
Southworth and Kingston – Seattle: vessel procurement
Kingston: Summer 2018
Southworth: Summer 2020
|
CTPP Data in Passenger Ferry Modeling
Level of detail matters
Consideration of recent and planned development
Potential growth
Available data for calibration
Non-commuter demand
November 15, 2017 Using CTPP Data for Passenger Ferry Demand Forecasting 17

DISCLAIMER: This work may only be used within the context and scope of work for which Steer Davies Gleave was commissioned and may not be relied upon in part or whole by any third party or be used for any other purpose. Any person choosing to use any part of this work without the express and written permission of Steer Davies Gleave shall be deemed to confirm their agreement to indemnify Steer Davies Gleave for all loss or damage resulting therefrom.
Questions
Megan Brock