cement industry - amazon s3 · is higher due to cpec and other government related infrastructure...
TRANSCRIPT

SECTOR UPDATE
Structure of the IndustryGeographically the cement industry in Pakistan is divided into two divisions; namely Southern & Northern region. Province of Punjab, Khyber Pakhtunkhwa, Azad Kashmir, Gilgit Baltistan and parts of Balochistan fall in North region while Province of Sindh and a few parts of Balochistan fall under South region. In the North Zone there are 14 listed companies whereas the Southern region has 5 listed companies. North region has an annual cement manufacturing capacity of 39.6m MT and South region has a total capacity of 13.89m MT.
Both regions (North & South) have their own demand & supply dynamics. Players of the southern region benefit from greater export market availability given their geographical proximity to the sea; providing room for revenue diversification. Reliance of companies in the North on export sales remains low; however local demand in North Zone is higher due to CPEC and other government related infrastructure projects. Key export markets for players operating in the North Zone remains Afghanistan and India. For players operating in the South Zone, Sri Lanka, Nigeria, Tanzania, Mozambique, Iraq, Ethiopia and DR Congo are major export markets.
Locally the industry operates under a marketing arrangement which helps industry players in maintaining prices and margins. As per the arrangement, a quota is assigned to each player based on installed capacity. Given the market arrangement and demand and supply dynamics, local retention prices and margins compare favorably to export sales. In the absence of a marketing arrangement, players with higher efficiencies, wider outreach and better access to export market will enjoy competitive advantage over peers.
Figure 2: Existing North Capacities
September, 2018Cement Industry
JCR-VIS Credit Rating Company Limited
Figure 1: Top 10 Players in the Cement Industry in terms of installed capacity
Figure 3: Final North Capacities

Capacity UtilizationProduction capacity of cement sector has more than doubled over the last decade to 46.94m MT/Year (FY06; 20.8m MT/Year). Top 5 players in terms of installed capacities are Bestway Cement (BWCL), Lucky Cement (LUCK), D.G. Khan Cement (DGKC), Fauji Cement (FCCL) and Maple Leaf Cement (MLCF). These top 5 players represent 58% of total installed capacity. Average capacity utilization was around 93% for FY18. Capacity utilization of South was 90.0%1 as compared to 93.6% in North region.
Table 1: Capacity utilization (In Million Metric Tons)Year Capacity Total Dispatches Capacity UtilizationFY18 49.5 45.9 93% FY17 46.4 40.3 87%FY16 45.6 38.9 85%FY15 45.6 35.4 78%FY14 44.6 34.3 77%FY13 44.6 33.4 75%FY12 44.6 32.5 73%
*Annualized
Table 2: Capacity utilization – North (In Million Metric Tons)Year Capacity Total Dispatches Capacity UtilizationFY18 39.62 37.0 93.6%FY17 39.3 32.3 82.2%FY16 38.0 30.9 81.4%FY15 38.0 27.9 73.5%FY14 37.0 27.1 73.2%FY13 37.0 26.4 71.5%FY12 37.0 25.6 69.3%
*Annualized
1 Adjusted capacity utilization; taking into account 50% of incremental capacities of ACPL and LUCK2 New capacity of Bestway is not included since it came online post FY18.
2
JCR-VIS Credit Rating Company Limited
Figure 4: Existing South Capacities Figure 5: Final South Capacities

3
JCR-VIS Credit Rating Company Limited
Table 3: Capacity utilization – South (In Million Metric Tons)
Year Capacity Total Dispatches Capacity UtilizationFY18 13.9 8.8 90.0%FY17 8.6 8.0 92.8%FY16 7.7 5.9 77.6%FY15 7.7 7.5 97.8%FY14 7.7 7.8 101.7%FY13 7.7 7.0 91.2%FY12 7.7 6.9 89.9%
*Annualized
Sales
Table 4: Industry DispatchesIndustry Dispatches (m MT) FY15 FY16 FY17 FY18
NorthLocal 23.44 27.05 29.14 33.96
Exports 4.47 3.85 3.15 3.08Total North Dispatches 27.91 30.91 32.29 37.04
SouthLocal 4.76 5.95 6.51 7.17
Exports 2.73 2.02 1.51 1.66Total South Dispatches 7.49 7.97 8.02 8.83
Total IndustryLocal 28.20 33.00 35.65 41.13
Exports 7.20 5.87 4.66 4.74Total Industry Dispatches 35.40 38.87 40.32 45.87
The rise in cement dispatches is attributable to rising local volumes with major contribution coming from the North Zone. Local dispatches recorded healthy growth of 15.1% while export sales after declining for the past 4 years recorded a meager increase of 1.69%. Resultantly, proportion of local dispatches has increased from 73.6% in FY12 to 89.7% during FY18 whereas proportion of export has declined from 26.4% in FY12 to 10.3% in FY18.
Table 5: Sales
YearDispatches In Tons Percentage
Local Exports Total Local ExportsFY12 23,947,165 8,567,826 32,514,991 73.6% 26.4%FY13 25,058,747 8,374,104 33,432,851 75.0% 25.0%FY14 26,145,355 8,136,528 34,281,883 76.3% 23.7%FY15 28,206,027 7,194,249 35,400,276 79.7% 20.3%FY16 33,001,296 3,851,615 36,852,911 89.5% 10.5%FY17 35,651,598 4,663,569 40,315,167 88.4% 11.6%FY18 41,147,391 4,746,028 45,893,419 89.7% 10.3%
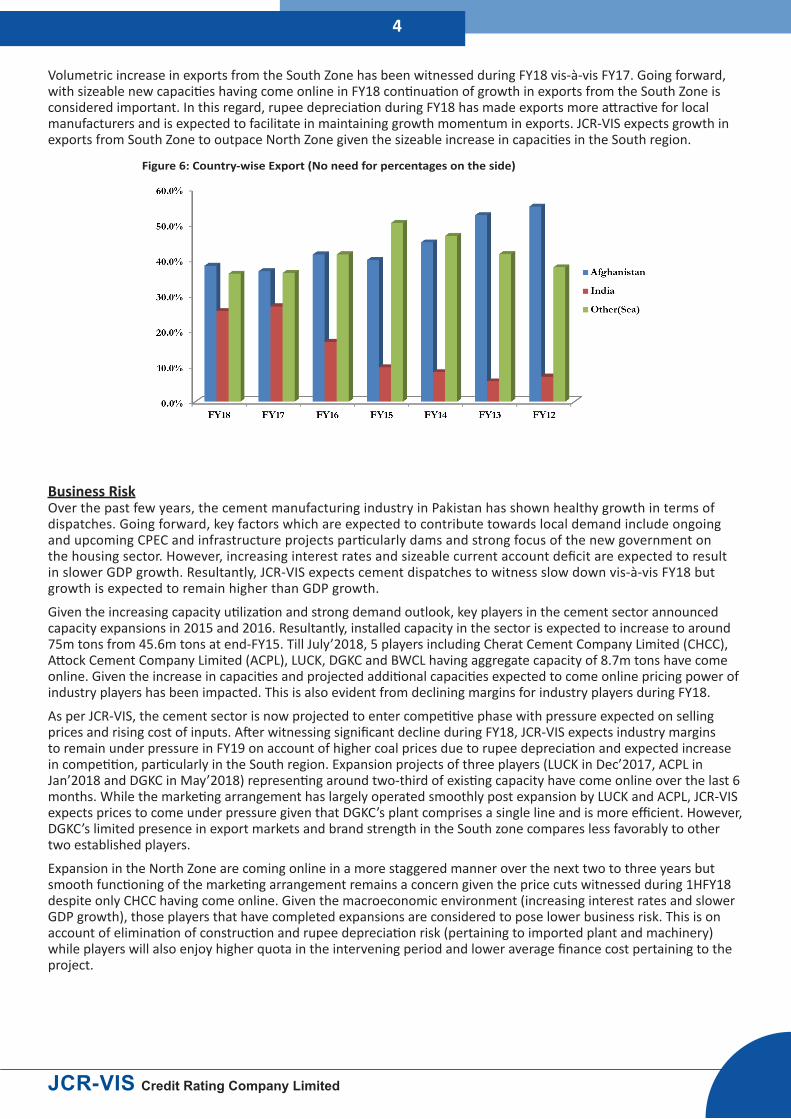
Volumetric increase in exports from the South Zone has been witnessed during FY18 vis-à-vis FY17. Going forward, with sizeable new capacities having come online in FY18 continuation of growth in exports from the South Zone is considered important. In this regard, rupee depreciation during FY18 has made exports more attractive for local manufacturers and is expected to facilitate in maintaining growth momentum in exports. JCR-VIS expects growth in exports from South Zone to outpace North Zone given the sizeable increase in capacities in the South region.
Business RiskOver the past few years, the cement manufacturing industry in Pakistan has shown healthy growth in terms of dispatches. Going forward, key factors which are expected to contribute towards local demand include ongoing and upcoming CPEC and infrastructure projects particularly dams and strong focus of the new government on the housing sector. However, increasing interest rates and sizeable current account deficit are expected to result in slower GDP growth. Resultantly, JCR-VIS expects cement dispatches to witness slow down vis-à-vis FY18 but growth is expected to remain higher than GDP growth.
Given the increasing capacity utilization and strong demand outlook, key players in the cement sector announced capacity expansions in 2015 and 2016. Resultantly, installed capacity in the sector is expected to increase to around 75m tons from 45.6m tons at end-FY15. Till July’2018, 5 players including Cherat Cement Company Limited (CHCC), Attock Cement Company Limited (ACPL), LUCK, DGKC and BWCL having aggregate capacity of 8.7m tons have come online. Given the increase in capacities and projected additional capacities expected to come online pricing power of industry players has been impacted. This is also evident from declining margins for industry players during FY18.
As per JCR-VIS, the cement sector is now projected to enter competitive phase with pressure expected on selling prices and rising cost of inputs. After witnessing significant decline during FY18, JCR-VIS expects industry margins to remain under pressure in FY19 on account of higher coal prices due to rupee depreciation and expected increase in competition, particularly in the South region. Expansion projects of three players (LUCK in Dec’2017, ACPL in Jan’2018 and DGKC in May’2018) representing around two-third of existing capacity have come online over the last 6 months. While the marketing arrangement has largely operated smoothly post expansion by LUCK and ACPL, JCR-VIS expects prices to come under pressure given that DGKC’s plant comprises a single line and is more efficient. However, DGKC’s limited presence in export markets and brand strength in the South zone compares less favorably to other two established players.
Expansion in the North Zone are coming online in a more staggered manner over the next two to three years but smooth functioning of the marketing arrangement remains a concern given the price cuts witnessed during 1HFY18 despite only CHCC having come online. Given the macroeconomic environment (increasing interest rates and slower GDP growth), those players that have completed expansions are considered to pose lower business risk. This is on account of elimination of construction and rupee depreciation risk (pertaining to imported plant and machinery) while players will also enjoy higher quota in the intervening period and lower average finance cost pertaining to the project.
JCR-VIS Credit Rating Company Limited
4
Figure 6: Country-wise Export (No need for percentages on the side)

Profitability:
Lucky Cement BWCLRs. In m FY16 FY17 9M18 9M17 FY16 FY17 9M18 9M17Net sales 45,135 45,687 35,671 35,241 45,721 51,623 40,249 39,133
Gross Profit 21,746 21,298 13,093 16,951 21,148 22,533 14,462 17,285Gross margin 48% 47% 37% 48% 46% 44% 36% 44%
PBT 18,400 18,778 11,979 14,669 17,078 18,664 11,698 14,463PAT 12,944 13,692 9,802 10,422 11,880 13,293 8,712 10,568
Net Margin 29% 30% 27% 30% 26% 26% 22% 27%
MLCF DGKC
Rs. In m FY16 FY17 9M18 9M17 FY16 FY17 9M18 9M17
Net sales 23,433 23,992 19,317 18,294 29,704 30,136 23,375 22,633
Gross Profit 10,022 9,482 7,624 7,624 12,668 11,845 7,169 9,215
Gross margin 43% 40% 32% 42% 43% 39% 31% 41%
PBT 7,118 6,870 3,886 5,697 12,481 11,158 6.688 8,722
PAT 4,885 4,777 2,854 4,052 8,790 7,975 4,970 6,454
Net Margin 21% 20% 15% 22% 30% 26% 21% 29%
Fauji Cement Askari
Rs. In m FY16 FY17 9M18 9M17 FY16 FY17 9M18 9M17
Net sales 20,044 20,423 15,814 15,760 15,600 15,953 11,468 12,192
Gross Profit 9,165 4,438 3,728 3,462 5,463 5,118 2,839 4,149
Gross margin 46% 22% 24% 22% 35% 32% 25% 34%
PBT 7,831 3,930 2,987 2,828 4,234 3,955 2,023 3,267
PAT 5,367 2,613 2,122 1,972 2,983 2,694 1,434 2,349
Net Margin 26.8% 12.8% 13% 13% 19% 17% 13% 19%
ACPL Kohat Cement
Rs. In m FY16 FY17 9M18 9M17 FY16 FY17 9M18 9M17
Net sales 13,918 14,736 12,142 11,242 14,020 13,540 10,385 10,658
Gross Profit 5,587 5,892 3,980 4,574 6,497 5,827 3,515 4,816
Gross margin 40% 40% 33% 41% 46% 43% 34% 45%
PBT 4,236 4,444 2,606 3,347 6,252 5,520 3,232 4,491
PAT 2,890 3,034 1,827 2,238 4,408 3,545 2,296 3,121
Net Margin 21% 21% 15% 20% 31% 26% 22% 29%
CHCC Gharibwal
Rs. In m FY16 FY17 9M18 9M17 FY16 FY17 9M18 9M17
Net sales 7,079 9,645 11,148 6,714 10,522 11,223 8,513 8,370
Gross Profit 2,634 3,213 2,569 2,515 4,172 3,854 2,061 2,886
Gross margin 37% 33% 23% 37% 40% 34% 24% 34%
PBT 2,051 2,510 1,821 2,006 3,707 3,045 1,387 2,327
PAT 1,405 1,957 1,795 1,567 2,694 2,284 1,000 1,701
Net Margin 20% 20% 16% 23% 26% 20% 12% 20%
JCR-VIS Credit Rating Company Limited
5
Figure 7: Profitability Indicators

JCR-VIS Credit Rating Company Limited
6
PIOC Thatta CementRs. In m FY16 FY17 9M18 9M17 FY16 FY17 9M18 9M17Net sales 9,367 10,631 7,505 8,089 2,846 3,657 2,174 2,852
Gross Profit 4,005 4,428 2,062 3,325 914 1,163 629 917Gross margin 43% 42% 27% 41% 32% 32% 29% 32%
PBT 3,846 4,070 1,654 3,164 666 855 430 748PAT 2,519 2,918 1,149 2,399 614 582 308 550
Net Margin 27% 27% 15% 30% 22% 16% 14% 19%
FECTO Cement Power Cement
Rs. In m FY16 FY17 9M18 9M17 FY16 FY17 9M18 9M17
Net sales 5,032 5,131 3,841 4,006 4,144 4,481 3,310 3,327
Gross Profit 1,623 1,557 784 1,235 947 981 618 682
Gross margin 32% 30% 20% 31% 23% 22% 19% 21%
PBT 1,159 1,091 446 865 765 565 402 420
PAT 814 761 330 607 486 467 289 324
Net Margin 16% 15% 9% 15% 12% 10% 9% 10%
• Despite slight decline in retention prices during FY18, net sales of industry players depicted increase due to growth in dispatches. In terms of growth in dispatches, players whose capacities have online (CHCC, LUCK, and ACPL) have showcased the highest increase in net sales.
• Gross margins have depicted a sharp decline due to inability to pass on increase in coal prices, decline in retention prices and higher proportion of clinker exports for some players. Variation in gross margins across industry players is a function of differences in plant efficiencies in terms of Kcal and KWH con-sumption, cost of fuel being used, proportion of local and export sales in sales mix and differences in retention prices being charged. MLCF reported the highest gross margin amongst industry players dur-ing 9MFY18.
• Overall profitability witnessed decline due to pressure on margins with most players recording double digit decline in profit before tax. Only CHCC (due to higher dispatches on account of full year impact of increase in capacity) and FCCL recorded an increase in profitability. Going forward, profitability is ex-pected to remain under pressure given sizeable capacities coming online.

JCR-VIS Credit Rating Company Limited
Liquidity:Figure 8: Liquidity Indicators
Lucky Cement BWCLRs. In m FY16 FY17 9M18 9M17 FY16 FY17 9M18 9M17FFO 16,029 16,493 10,607 13,215 14,743 15,845 10,299 12,624FFO/Total Debt NA NA NA NA 0.77 1.06 0.69 1.40Current Ratio 4.1 4.48 3.44 4.29 1.2 1.1 0.7 1.4
MLCF ACPLRs. In m FY16 FY17 9M18 9M17 FY16 FY17 9M18 9M17FFO 8,902 7,189 4,158 6,028 2,616 3,061 2,785 2,465FFO/Total Debt 2.93 1.07 0.41 1.44 328.81 0.85 0.74 1.05Current Ratio 1.7 1.3 1.1 1.4 2.6 0.5 0.7 0.7
Fauji Cement AskariRs. In m FY16 FY17 9M18 9M17 FY16 FY17 9M18FFO 8,067 3,365 2,873 2,527 3,562 3,434 1,781FFO/Total Debt 1.97 1.87 2.44 1.47 0.48 0.42 0.22Current Ratio 1.5 2.1 1.8 1.7 1.1 0.9 0.6
CHCC Kohat CementRs. In m FY16 FY17 9M18 9M17 FY16 FY17 9M18 9M17FFO 1,704 2,894 2,491 2,284 3,758 4,181 2,292 3,549FFO/Total Debt 0.40 0.45 0.28 0.59 2.4 4.6 4.6 3.6Current Ratio 1.1 1.8 1.4 1.4 2.8 3.2 3.2 2.4
DGKC GharibwalRs. In m FY16 FY17 9M18 9M17 FY16 FY17 9M18 9M17FFO 9,983 7,755 6,434 6,705 3,455 3,116 1,545 2,483FFO/Total Debt 1.43 0.36 0.29 1.14 1.10 0.69 0.48 1.02Current Ratio 3.1 1.8 1.7 2.5 0.8 0.7 0.7 0.6
PIOC Thatta CementRs. In m FY16 FY17 9M18 9M17 FY16 FY17 9M18 9M17FFO 2,641 2,915 1,405 2,739 566 771 409 603FFO/Total Debt 4.1 1.3 0.2 2.2 0.44 1.04 0.95 1.13Current Ratio 2.4 3.1 1.7 2.7 2.0 1.8 1.6 1.7
FECTO Cement Power CementRs. In m FY16 FY17 9M18 9M17 FY16 FY17 9M18 9M17FFO 1,046 721 430 686 385 179 155 287FFO/Total Debt NA NA 29.64 NA 0.24 0.12 0.04 0.32Current Ratio 5.0 5.4 5.0 4.8 0.9 2.6 3.1 1.4
• In line with decline in profitability, cash flows from operations for most industry players have witnessed a decline.
• Debt servicing ability for most industry players remains strong with high FFO/Total Debt ratios. • LUCK has the strongest liquidity profile amongst industry players given the healthy cash flows, sizeable
liquid investments, debt free balance sheet and highest current ratio.
7

JCR-VIS Credit Rating Company Limited
Capitalization:Figure 9: Capitalization Indicators
Lucky Cement BWCLRs. In m FY16 FY17 9M18 9M17 FY16 FY17 9M18 9M17
Total debt 0 0 0 0 19,187 14,888 19,836 11,985Total Liabilities 16,586 17,552 21,976 18,401 35,837 33,996 40,345 31,952
Total Equity 69,323 79,785 84,090 76,511 41,983 47,769 50,282 47,069Leverage 0.2 0.2 0.3 0.2 0.9 0.7 0.8 0.7Gearing 0 0 0 0 0.5 0.3 0.4 0.3
MLCF DGKCRs. In m FY16 FY17 9M18 9M17 FY16 FY17 9M18 9M17
Total debt 3,036 6,723 13,423 5,558 7,002 21,615 29,083 7,849Total Liabilities 10,685 19,433 24,165 15,465 17,635 33,503 42,197 29,028
Total Equity 16,750 19,384 28,958 18,605 65,783 74,869 77,313 72,747Leverage 0.6 1.0 0.8 0.8 0.3 0.5 0.5 0.4Gearing 0.2 0.4 0.5 0.3 0.1 0.3 0.4 0.3
Fauji Cement AskariRs. In m FY16 FY17 9M18 9M17 FY16 FY17 9M18
Total debt 4,090 1,801 1,565 2,286 7,324 8,185 10,856Total Liabilities 10,930 8,072 8,269 9,186 13,342 13,833 16,217
Total Equity 18,428 19,681 20,561 19,039 4,808 4,559 12,794Leverage 0.6 0.4 0.4 0.5 2.8 3.0 2.8Gearing 0.2 0.1 0.1 0.1 1.5 1.8 1.9
ACPL Kohat CementRs. In m FY16 FY17 9M18 9M17 FY16 FY17 9M18 9M17
Total debt 8 3,585 5,002 3,120 1,593 910 497 982Total Liabilities 3,980 5,954 12,713 6,981 5,575 4,886 5,120 6,287
Total Equity 10,447 11,948 12,228 11,254 13,770 15,307 17,293 14,883Leverage 0.4 0.5 1.0 0.6 0.4 0.32 0.3 0.42Gearing 0 0.3 0.4 0.3 0.12 0.06 0.03 0.07
CHCC GharibwalRs. In m FY16 FY17 9M18 9M17 FY16 FY17 9M18 9M17
Total debt 4,231 6,401 11,779 5,128 3,148 4,506 4,242 3,239Total Liabilities 6,322 8,345 14,744 7,252 8,224 10,234 10,612 9,916
Total Equity 9,140 10,462 11,329 10,034 6,562 8,007 8,534 7,148Leverage 0.7 0.8 1.3 0.7 1.3 1.3 1.2 1.4Gearing 0.5 0.6 1.0 0.5 0.5 0.6 0.5 0.5
PIOC Thatta CementRs. In m FY16 FY17 9M18 9M17 FY16 FY17 9M18 9M17
Total debt 645 2,307 7,360 1,269 1,278 743 573 713Total Liabilities 4,098 5,513 11,672 5,475 1,870 1,455 1,265 1,574
Total Equity 7,821 9,519 9,994 8,974 2,075 2,441 2,514 2,413Leverage 0.5 0.6 1.2 0.6 0.9 0.6 0.5 0.7Gearing 0.1 0.2 0.7 0.1 0.6 0.3 0.2 0.3
8

FECTO Cement Power CementRs. In m FY16 FY17 9M18 9M17 FY16 FY17 9M18 9M17
Total debt 0 0 19 0 1,576 1,468 5,856 1,180Total Liabilities 843 926 1,020 982 3,895 2,993 7,223 3,441
Total Equity 3,233 3,894 4,098 3,740 2,348 8,394 11,276 3,684Leverage 0.3 0.2 0.3 0.3 1.7 0.4 0.6 0.9Gearing 0 0 0 0 0.7 0.2 0.5 0.3
• Equity base of a number of players have increased owing to internal capital generation and rights issue by select players to fund expansion.
• Leveraging profile of the sector has witnessed noticeable increase given the higher debt drawdown to fund expansion.
• Apart from two players, gearing ratio (interest bearing debt to equity) of all players was reported below 1(x).
• Despite expansion plans and announced expansions, Kohat Cement (KOHC), FCCL and Gharibwal Ce-ment have witnessed a limited increase in debt levels. Leveraging profile will increase once debt draw down for the expansion happens.
JCR-VIS Credit Rating Company Limited
9
Analysts Contacts
Talha IqbalSenior [email protected]
Sidra Ahsan QureshiAssistant [email protected]