cellular/molecular propertiesofribbonandnon
TRANSCRIPT

Cellular/Molecular
Properties of Ribbon and Non-Ribbon Release from RodPhotoreceptors Revealed by Visualizing Individual SynapticVesicles
Minghui Chen,1,2 Matthew J. Van Hook,2 David Zenisek,3 and Wallace B. Thoreson1,2
Departments of 1Pharmacology and Experimental Neuroscience and 2Ophthalmology and Visual Sciences, University of Nebraska Medical Center, Omaha,Nebraska 68198, and 3Department of Cellular and Molecular Physiology, Yale University School of Medicine, New Haven, Connecticut 06520
Vesicle release from rod photoreceptors is regulated by Ca 2� entry through L-type channels located near synaptic ribbons. We charac-terized sites and kinetics of vesicle release in salamander rods by using total internal reflection fluorescence microscopy to visualizefusion of individual synaptic vesicles. A small number of vesicles were loaded by brief incubation with FM1– 43 or a dextran-conjugated,pH-sensitive form of rhodamine, pHrodo. Labeled organelles matched the diffraction-limited size of fluorescent microspheres anddisappeared rapidly during stimulation. Consistent with fusion, depolarization-evoked vesicle disappearance paralleled electrophysio-logical release kinetics and was blocked by inhibiting Ca 2� influx. Rods maintained tonic release at resting membrane potentials nearthose in darkness, causing depletion of membrane-associated vesicles unless Ca 2� entry was inhibited. This depletion of release sitesimplies that sustained release may be rate limited by vesicle delivery. During depolarizing stimulation, newly appearing vesicles ap-proached the membrane at �800 nm/s, where they paused for �60 ms before fusion. With fusion, vesicles advanced �18 nm closer to themembrane. Release events were concentrated near ribbons, but lengthy depolarization also triggered release from more distant non-ribbon sites. Consistent with greater contributions from non-ribbon sites during lengthier depolarization, damaging the ribbon byfluorophore-assisted laser inactivation (FALI) of Ribeye caused only weak inhibition of exocytotic capacitance increases evoked by200-ms depolarizing test steps, whereas FALI more strongly inhibited capacitance increases evoked by 25 ms steps. Amplifying releaseby use of non-ribbon sites when rods are depolarized in darkness may improve detection of decrements in release when they hyperpo-larize to light.
IntroductionChanges in illumination are transduced by rod photoreceptorsinto membrane potential changes and encoded by altering theongoing rate of synaptic vesicle release. Like cones, retinal bipolarcells, and hair cells, rods possess synaptic ribbons: electron-densestructures that assist in delivery, priming, and clustering of vesi-cles near L-type Ca 2� channels (Schmitz, 2009; Matthews andFuchs, 2010). At these other ribbon synapses, both fast and slowcomponents of vesicle release involve the ribbon (Khimich et al.,2005; Zenisek, 2008; Frank et al., 2010; Snellman et al., 2011).However, asynchronous release from bipolar cells can also occurat non-ribbon sites (Midorikawa et al., 2007; Zenisek, 2008). Mir-roring their light response kinetics (Korenbrot and Rebrik, 2002),synaptic transmission is slower in rods than cones (Schnapf and
Copenhagen, 1982; Copenhagen et al., 1983; Rabl et al., 2005;Sheng et al., 2007). Slow, asynchronous release is often associatedwith larger distances between Ca 2� channels and release sitesthan fast, synchronous release (Eggermann et al., 2012), suggest-ing that slow release from rods might involve distant, non-ribbonsites. Consistent with contributions from non-ribbon sites to rodrelease, loss of anchored ribbons failed to completely abolish syn-aptic transmission (Dick et al., 2003), and electron tomographystudies revealed exocytotic omega figures in non-ribbon regionsof rod synapses (Zampighi et al., 2011). Furthermore, slow re-lease from rods is amplified by Ca 2�-induced Ca 2� release(CICR) involving endoplasmic reticulum located some distancefrom ribbons (Krizaj et al., 1999; Cadetti et al., 2006; Suryanaray-anan and Slaughter, 2006; Babai et al., 2010).
We used total internal reflection fluorescence microscopy(TIRFM) to examine sites and kinetic properties of release fromrods by visualizing individual vesicles loaded with FM1– 43(Cochilla et al., 1999) or a dextran-conjugated, pH-sensitive formof rhodamine (pHrodo). TIRFM has been used to study vesiclefusion in retinal bipolar cells (Zenisek et al., 2000, 2002; Holtet al., 2004; Midorikawa et al., 2007; Zenisek, 2008), synapto-somes (Serulle et al., 2007), and various non-neuronal cells(Steyer et al., 1997; Oheim et al., 1999; Schmoranzer et al.,2000; Toomre et al., 2000; Tsuboi et al., 2000; Becherer et al.,2003; Bezzi et al., 2004).
Received July 17, 2012; revised Nov. 6, 2012; accepted Dec. 5, 2012.Author contributions: M.C., D.Z., and W.B.T. designed research; M.C., M.J.V.H., and W.B.T. performed research;
M.C., M.J.V.H., D.Z., and W.B.T. analyzed data; M.C. and W.B.T. wrote the paper.This research was supported by National Institutes of Health Grants EY010542 (W.B.T.), EY010542S1 (W.B.T.),
and EY018111 (D.Z.), Research to Prevent Blindness (W.B.T.), and the Chinese Scholarship Council (M.C.).The authors declare no competing financial interests.Correspondence should be addressed to Wallace B. Thoreson, Department of Ophthalmology and Visual Sciences,
University of Nebraska Medical Center, 4050 Durham Research Center I, Omaha, NE 68198-5840. E-mail:[email protected].
DOI:10.1523/JNEUROSCI.3426-12.2013Copyright © 2013 the authors 0270-6474/13/332071-16$15.00/0
The Journal of Neuroscience, January 30, 2013 • 33(5):2071–2086 • 2071

Our results showed that, at membrane potentials near those indarkness, rods released vesicles continuously, primarily by full-collapse fusion. Release sites were depleted by this slow ongoingrelease, implying that sustained release rates are governed by ves-icle delivery, similar to cones (Jackman et al., 2009). Vesicle ki-netics in rods exhibited both similarities and differences to othercell types. Newly arriving vesicles approached the membrane at�800 nm/s and then paused for �60 ms before fusion. Withexocytosis, vesicles advanced �18 nm closer to the membrane.Like other ribbon synapses, both fast and slow release occurredprincipally near the ribbon. However, contributions from non-ribbon sites increased during lengthier stimulation. Diffusionalspreading of glutamate released at distant non-ribbon sites maycontribute to slow rod synaptic kinetics, but the amplification ofrelease provided by use of ectopic sites may improve detection ofdecrements in release that accompany rod light responses.
Materials and MethodsAnimal care and use. Male and female aquatic tiger salamanders (Amby-stoma tigrinum, 18 –25 cm in length; The Sullivan Company) were usedfor experiments. Protocols were approved by the University of NebraskaMedical Center Institutional Animal Care and Use Committee. Animalswere maintained on a 12 h light/dark cycle and killed 1–2 h after thebeginning of subjective night. Maintained illumination promotes disas-sembly of rod synaptic ribbons in some, although not all, animals (Abeand Yamamoto, 1984; Balkema et al., 2001; Spiwoks-Becker et al., 2004;Fuchs et al., 2013). Under dim room lights, salamanders were rapidlydecapitated with heavy shears and immediately pithed.
Photoreceptor isolation and individual synaptic vesicle visualization. Us-ing infrared illumination and night-vision goggles (Nitemate NAV3; Lit-ton Industries) to maintain a dark-adapted state in the retina, the eye wasenucleated, the front of the eye was removed, and the retina was isolatedin an amphibian saline solution consisting of the following (in mM): 116NaCl, 2.5 KCl, 1.8 CaCl2, 0.5 MgCl2, 10 HEPES, and 5 glucose, pH 7.8.Unless otherwise specified, reagents were obtained from Sigma-AldrichChemicals.
Synaptic vesicles in rod terminals were loaded by incubating retinaswith FM1– 43 (30 �M; Biotium) or a 10 kDa dextran-conjugated, pH-sensitive form of rhodamine (pHrodo, 500 �g/ml; Invitrogen) at 20°C.FM1– 43 is incorporated into vesicles during endocytosis after the dye hasbeen inserted into the plasma membrane. Vesicles then exhibit greenfluorescence until the dye is released back into solution during exocytosis(Betz and Bewick, 1992; Cochilla et al., 1999). Dextran-conjugatedpHrodo is water soluble and exhibits red fluorescence after endocytosisinto the acidic interior of synaptic vesicles. Fluorescence of pHrodo isdiminished considerably, but not completely quenched, at the extracel-lular pH of 7.8.
Intact, dark-adapted rods in the retina have a relatively depolarizedmembrane potential in darkness of approximately �45 mV (Thoreson etal., 2000). Maintaining retinas in a dark-adapted state during the incu-bation period therefore stimulates the release of vesicles from rods ac-companied by compensatory endocytosis and uptake of FM1– 43 orpHrodo. After loading vesicles with dye, the retina was exposed to light tohyperpolarize rods and placed in a Ca 2�-free saline solution to inhibitadditional exocytosis. For most experiments, we used a short incubationtime designed to load only a small fraction of the vesicle pool and therebyvisualize individual vesicles. Measurements of FM1– 43 uptake rates indarkness (Rea et al., 2004; Sheng et al., 2007) suggest that incubation for1 min should load �10% of the releasable vesicles in salamander rodterminals. An incubation period of 3 min was needed to load similarnumbers of vesicles with the larger dextran-conjugated pHrodo. Afterplating rods onto glass coverslips, the number of dye-loaded vesiclesslowly diminished as a result of the ongoing release of vesicles in Ca 2�-containing amphibian saline solution. As described in Results, measure-ments of the tonic rate of release events in the absence of stimulation andthe area of synaptic terminal membrane in contact with the glass suggestthat �1–3% of vesicles were loaded with dye by the time experiments
were conducted. In some experiments, we used longer 30 min incubationtimes to load a much larger percentage of the vesicle population.
After loading rods with dye, the retina was digested by incubationwith papain (30 U/ml; Worthington) plus cysteine (0.2 mg/ml) inCa 2�-free amphibian saline for 35 min at 20°C. After papain treat-ment, the tissue was washed in ice-cold, Ca 2�-free amphibian salinecontaining 1% bovine serum albumin and DNase (1 mg/ml; Worthing-ton), followed by two additional washes in ice-cold, Ca 2�-free saline. Toisolate photoreceptors, a piece of retina was carefully triturated using afire-polished Pasteur pipette and the cell suspension transferred onto1.78 refractive index glass coverslips (Olympus) coated with Cell-Tak(3.5 �g/cm 2; BD Biosciences). After letting cells settle and adhere for 30min, they were superfused with oxygenated amphibian saline solution atroom temperature.
Solid-state lasers at 488 and 561 nm wavelengths (Melles Griot) wereused to illuminate FM1– 43- and pHrodo-loaded vesicles, respectively.The beam was focused off-axis onto the back focal plane of a 1.65 numer-ical aperture (NA) objective (Apo 100� oil; Olympus). After leaving theobjective, light traveled through a high refractive index (1.78) immersionfluid (Cargille Laboratories) and entered the coverslip, undergoing totalinternal reflection at the interface between the glass and the lower refrac-tive index of the cell membrane or overlying aqueous solution. Fluores-cence emission was filtered by 525 nm (45 nm wide) or 609 nm (54 nmwide) bandpass filters (Semrock) and collected by an electron-multiplying CCD camera at 30 – 40 ms/frame (Hamamatsu ImageEM)with a pixel size of 80 nm/pixel. Data were acquired and analyzed usingMetaMorph software (Molecular Devices).
We calculated the critical angle for total internal reflection (�c) fromthe following:
�c � sin�1�n2/n1�, (1)
where n1 and n2 are the indices of refraction for the glass coverslip (n1 �1.78) and cytoplasm (n2 � 1.38; Bereiter-Hahn et al., 1979; Allersma etal., 2004). The incident angle of the laser (�) was measured using Snell’slaw and a triangular (45-45-90) glass prism (Mattheyses and Axelrod,2006). The length constant of the evanescent field depth (d) was calcu-lated as follows:
d ��
4�n1�sin2 � � sin2 �c�
�1/ 2. (2)
These measurements yielded length constants (d) of 57 and 64 nm with� � 488 and 561 nm lasers, respectively.
Depolarizing stimulation. Depolarizing voltage steps or 50 mM KCl puffapplication were used to stimulate rods and evoke synaptic vesicle re-lease. For puff application, patch pipettes were filled with an amphibiansaline solution containing 50 mM KCl and connected to a pressure valvesystem (Toohey) to control the duration and strength of the puff. The tipof the puffer pipette was positioned 10 –20 �m away from rod terminals.For application of depolarizing steps by voltage clamp (�70 to �10 mV,50 or 500 ms), pipettes were pulled using a PP-830 vertical puller (Na-rishige International) from borosilicate glass pipettes (1.2 mm outer di-ameter, 0.9 mm inner diameter, with an internal filament; WorldPrecision Instruments). Patch pipettes had tips of �2 �m outer diameterand resistance values between 10 and 18 M. Each pipette was carefullypositioned with an MP225 motorized micromanipulator (Sutter Instru-ments) so that the tip contacted the cell body. Rod membrane potentialwas voltage clamped using an A-M Systems model 2400 patch-clampamplifier. Currents were acquired and analyzed using pClamp 8 softwarewith a Digidata 1200 interface (Molecular Devices). Cells with holdingcurrents 300 pA at �70 mV were rejected from analysis. The patchpipette solution contained the following (in mM): 40 cesium glutamate,50 cesium gluconate, 9.4 tetraethylammonium-Cl, 3.5 NaCl, 1 CaCl2,1 MgCl2, 9.4 ATP, 0.5 GTP, 5 EGTA, and 10 HEPES acid, pH 7.2. Bothpuff application and voltage steps were triggered by transistor–tran-sistor logic (TTL) signals sent from the imaging computer. By mea-suring output from an LED placed on the microscope stage, weobserved that the timing of the TTL trigger pulse sent by the imagingsoftware jittered between two frames, often occurring with the image
2072 • J. Neurosci., January 30, 2013 • 33(5):2071–2086 Chen et al. • Rod Synaptic Vesicle Release Imaged by TIRFM

acquired 330 ms into the trial but sometimes occurring at 370 ms(average time point, 342 ms).
Localization of ribbons. Two methods were used to localize ribbons.One was to label ribbons by introducing a fluorescently labeled pep-tide that binds to Ribeye, the major protein in the ribbon (Schmitz,2009), into rods through a patch pipette. For these experiments, weused a high-affinity Ribeye-binding peptide constructed from tan-dem peptide dimers separated by a 12-polyethylene glycol linker andconjugated to Hylite 488 ([Hylite 488]-EQTVPVDLSARPR-PEG[12]-EQTVPVDLSARPK-[Hylite 488], 250 nM; Francis et al., 2011). The sec-ond approach was to use sites of focal Ca 2� entry as an indication ofribbon location based on evidence that Ca 2� channels are clusteredtightly beneath ribbons (Nachman-Clewner et al., 1999; Morgans, 2001;tom Dieck et al., 2005; Jackman et al., 2009; Mercer et al., 2011). To imageCa 2� entry sites, 100 �M Fluo5F (Kd � 2.3 �M; Invitrogen) was added tothe patch pipette solution. For Fluo5F experiments, images were ob-tained at 21 ms/frame by TIRFM. Ca 2� entry sites were identifiedfrom fluorescence increases evoked by 50 ms depolarizing steps from�70 to �10 mV. Sites of focal Ca 2� entry were defined as locationsshowing the largest local depolarization-evoked Ca 2� change with�F/F of at least 0.5. We distinguished different ribbons if focal Ca 2�
entry sites were separated by 500 nm. Ribbons visualized with thefluorescently labeled, Ribeye-binding peptide were also separated by500 nm.
Capacitance measurements of release. To measure release from rodselectrophysiologically, we used a slice preparation from tiger salamanderretina. Details of slice preparation and electrophysiological recordingshave been described previously (Van Hook and Thoreson, 2013). Briefly,a section of eyecup was placed vitreal surface down on a piece of nitro-cellulose filter paper (5 � 10 mm, 0.8 �m pores; Millipore), and theretina was isolated under chilled amphibian saline. The retina and filterpaper were cut into 125 �m slices using a razor blade (#121-6; Ted Pella)tissue chopper (Stoelting). Retinal slices were rotated 90 o to view theretinal layers under a long-working-distance, water-immersion objective(60�, 1.0 NA) on an upright fixed-stage microscope (Nikon E600FN).Slices were superfused at �1 ml/min with the oxygenated amphibiansaline solution described above.
We used capacitance measurement techniques to measure the increasein membrane capacitance accompanying vesicle fusion. Recording pi-pettes were coated with dental wax to reduce stray capacitance. Rods werevoltage clamped at �70 mV with a pipette attached to the cell body usingan OptoPatch amplifier (Cairn Research). Capacitance measurementswere made using the “track-in” mode of the Optopatch amplifier byvarying the membrane potential sinusoidally (500 Hz, 30 mV peak-to-peak) about the mean holding potential. The amplitude of the capaci-tance change was measured in a 5 ms window 30 ms after the end of thetest step to avoid effects of conductance changes and gating chargesduring the step and allow time for the phase angle feedback circuitry ofthe amplifier to settle. Membrane current, capacitance, and series resis-tance were acquired using a Digidata 1322 interface and pClamp 9.2software (Molecular Devices). We excluded recordings in which the ac-cess resistance was 50 M and those that exhibited pronounced post-stimulus changes in resistance.
Acute damage ribbon by fluorophore-assisted laser inactivation. To dam-age the ribbon by fluorophore-assisted laser inactivation (FALI), we used afluorescein-conjugated Ribeye-binding peptide (EQTVPVDLSVARPR, 40�M) containing a PXDLS peptide sequence that binds to the C-terminalbinding protein domain of Ribeye (Zenisek et al., 2004; Snellman et al.,2011). With FALI, excitation of the fluorescein moiety by 488 nm laserlight generates singlet oxygen that causes highly localized damage, withhalf-maximal damage occurring within �40 Å of the fluorophore(Hoffman-Kim et al., 2007). Either the Ribeye-binding peptide or ascrambled control peptide was added to the pipette solution togetherwith the antioxidants, reduced glutathione (1 mM), and 6-hydroxy-2,5,7,8-tetramethylchroman-2-carboxylic acid (Trolox, 1 mM). Bleach-ing was done by 1 min exposure to 488 nm light from an argon/kryptonlaser delivered through a laser confocal scan head (Ultraview LCI;PerkinElmer Life and Analytical Sciences) mounted to an upright, fixed-stage microscope (Nikon E600FN).
Statistical analyses. Data were analyzed using GraphPad Prism 4. Un-less otherwise stated, results are presented as mean � SEM, and statisticalsignificance between experimental conditions was determined usingStudent’s t test. The criterion for statistical significance was chosen tobe p � 0.05.
ResultsFluorescent organelles are single synaptic vesiclesIn the synaptic terminals of isolated rods loaded with FM1– 43 ordextran-conjugated pHrodo, small fluorescent organelles couldbe observed by TIRFM in the narrow evanescent field generatedat the interface between the cell membrane and cover glass (illus-trated diagramatically in Fig. 1A). With the 1.65 NA, 100� ob-jective used for these experiments, the evanescent field declinedexponentially with length constants of 57 and 64 nm for 488 and561 nm lasers, respectively, not much larger than the 40 – 45 nmdiameter of individual synaptic vesicles in rods (Lasansky,1973; Thoreson et al., 2004).
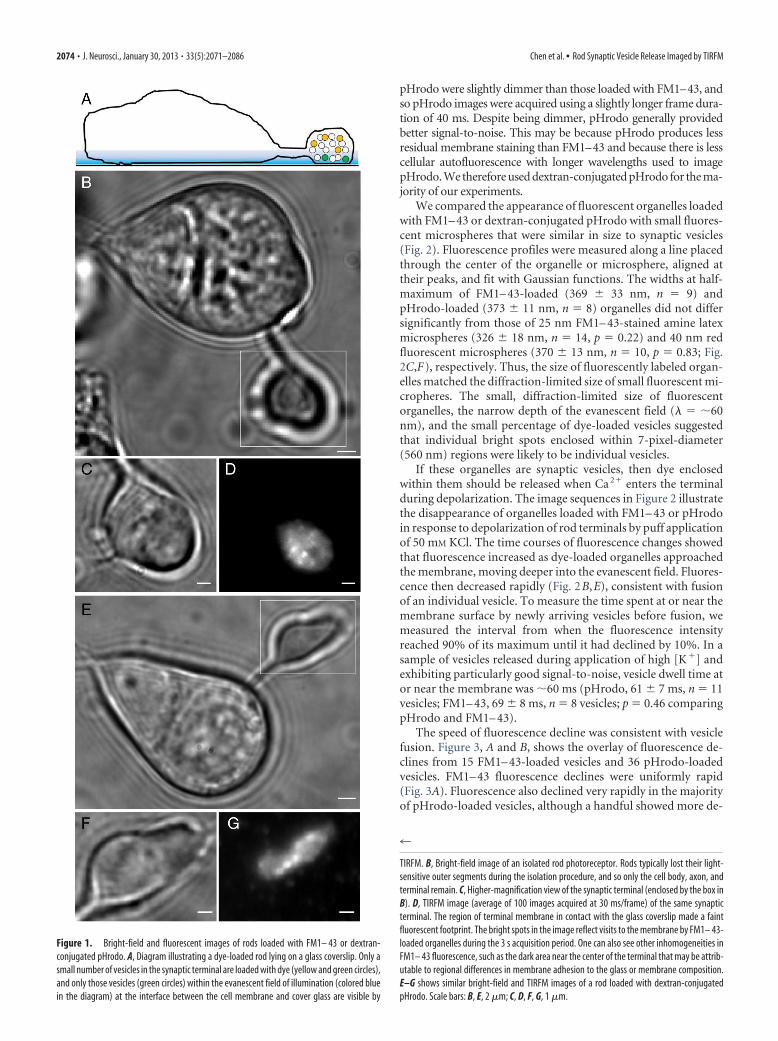
To load only a small fraction of the �100,000 vesicles in therod terminal (Sheng et al., 2007), we incubated dark-adapted,whole retina for a short time (1 min for FM1– 43, 3 min forpHrodo) in darkness. The relatively depolarized membranepotential of intact rods in darkness (approximately �45 mV)stimulates synaptic release and compensatory endocytosis, pro-moting uptake of the dye. After this brief incubation, retinas wereexposed to light and placed in Ca 2�-free medium to inhibit ad-ditional exocytosis. As illustrated by the bright-field images inFigure 1, rods typically lost their outer segments, and thus lostlight sensitivity, during the isolation procedure. Figure 1C showsa higher-magnification view of the synaptic terminal of a rod thathad been loaded with FM1– 43 (enclosed by the box in Fig. 1B).The region of terminal membrane in contact with the glass cov-erslip created a faint fluorescent footprint that can be seen in theTIRFM image in Figure 1D (average of 100 images acquired at 30ms/frame). The bright spots in this average image reflect visits tothe membrane by FM1– 43-loaded organelles during the 3 s ac-quisition period.
Mammalian rods have one to two ribbons per terminal,whereas isolated salamander rods have approximately seven rib-bons per terminal, although only approximately 5 ribbons re-main in contact with the plasma membrane after enzymaticisolation (Townes-Anderson et al., 1985). The two-dimensionalarea of terminals visualized in bright field averaged 39.7 � 2.5�m 2 (n � 11), suggesting a total terminal surface area (Aterminal)that is at least twice as great. The footprint of membrane (Afootprint)in contact with the coverslip in TIRFM in these same terminalsaveraged 28 � 2 �m 2 or �36 � 2% of the terminal surface area.The number of ribbons, N, predicted within the membrane foot-
print should be approximately N �Afootprint
Aterminal� 5 � 2.3 � 0.2 (n �
11). To determine the number of ribbons empirically, we obtainedwhole-cell patch-clamp recordings and introduced a high-affinity,HyLite488-conjugated Ribeye-binding peptide (250 nM; Francis etal., 2011) into the cell. Fluorescently labeled ribbons were not visiblein TIRFM, perhaps because their position atop the arciform densityplaces them outside the evanescent field of illumination. However,we were able to see ribbons by angling the laser more steeply toilluminate the cell more deeply. Although visualized at a slightlydeeper plane, we observed an average of 2.3 � 0.3 (n � 31) ribbonsin the terminal area enclosed by the membrane footprint, matchingthe predicted number (p � 0.92).
Figure 1E–G shows bright-field and TIRFM images of a rodloaded with dextran-conjugated pHrodo. Vesicles loaded with
Chen et al. • Rod Synaptic Vesicle Release Imaged by TIRFM J. Neurosci., January 30, 2013 • 33(5):2071–2086 • 2073
pHrodo were slightly dimmer than those loaded with FM1–43, andso pHrodo images were acquired using a slightly longer frame dura-tion of 40 ms. Despite being dimmer, pHrodo generally providedbetter signal-to-noise. This may be because pHrodo produces lessresidual membrane staining than FM1–43 and because there is lesscellular autofluorescence with longer wavelengths used to imagepHrodo. We therefore used dextran-conjugated pHrodo for the ma-jority of our experiments.
We compared the appearance of fluorescent organelles loadedwith FM1– 43 or dextran-conjugated pHrodo with small fluores-cent microspheres that were similar in size to synaptic vesicles(Fig. 2). Fluorescence profiles were measured along a line placedthrough the center of the organelle or microsphere, aligned attheir peaks, and fit with Gaussian functions. The widths at half-maximum of FM1– 43-loaded (369 � 33 nm, n � 9) andpHrodo-loaded (373 � 11 nm, n � 8) organelles did not differsignificantly from those of 25 nm FM1– 43-stained amine latexmicrospheres (326 � 18 nm, n � 14, p � 0.22) and 40 nm redfluorescent microspheres (370 � 13 nm, n � 10, p � 0.83; Fig.2C,F), respectively. Thus, the size of fluorescently labeled organ-elles matched the diffraction-limited size of small fluorescent mi-cropheres. The small, diffraction-limited size of fluorescentorganelles, the narrow depth of the evanescent field (� � �60nm), and the small percentage of dye-loaded vesicles suggestedthat individual bright spots enclosed within 7-pixel-diameter(560 nm) regions were likely to be individual vesicles.
If these organelles are synaptic vesicles, then dye enclosedwithin them should be released when Ca 2� enters the terminalduring depolarization. The image sequences in Figure 2 illustratethe disappearance of organelles loaded with FM1– 43 or pHrodoin response to depolarization of rod terminals by puff applicationof 50 mM KCl. The time courses of fluorescence changes showedthat fluorescence increased as dye-loaded organelles approachedthe membrane, moving deeper into the evanescent field. Fluores-cence then decreased rapidly (Fig. 2B,E), consistent with fusionof an individual vesicle. To measure the time spent at or near themembrane surface by newly arriving vesicles before fusion, wemeasured the interval from when the fluorescence intensityreached 90% of its maximum until it had declined by 10%. In asample of vesicles released during application of high [K�] andexhibiting particularly good signal-to-noise, vesicle dwell time ator near the membrane was �60 ms (pHrodo, 61 � 7 ms, n � 11vesicles; FM1– 43, 69 � 8 ms, n � 8 vesicles; p � 0.46 comparingpHrodo and FM1– 43).
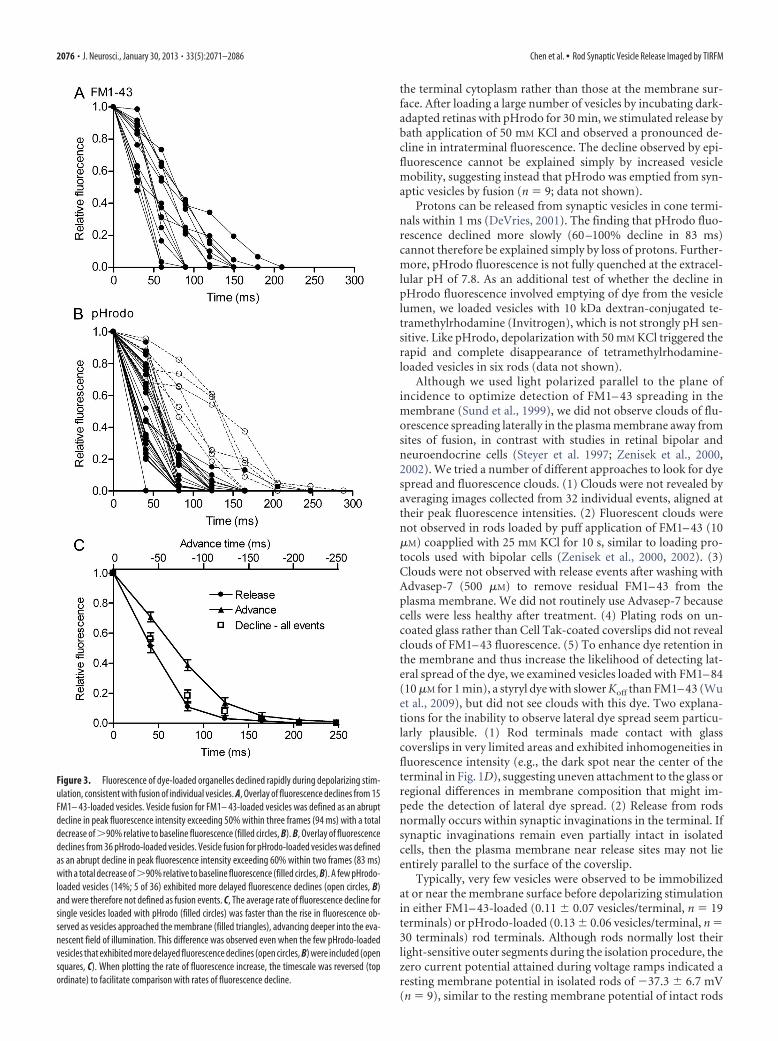
The speed of fluorescence decline was consistent with vesiclefusion. Figure 3, A and B, shows the overlay of fluorescence de-clines from 15 FM1– 43-loaded vesicles and 36 pHrodo-loadedvesicles. FM1– 43 fluorescence declines were uniformly rapid(Fig. 3A). Fluorescence also declined very rapidly in the majorityof pHrodo-loaded vesicles, although a handful showed more de-
Figure 1. Bright-field and fluorescent images of rods loaded with FM1– 43 or dextran-conjugated pHrodo. A, Diagram illustrating a dye-loaded rod lying on a glass coverslip. Only asmall number of vesicles in the synaptic terminal are loaded with dye (yellow and green circles),and only those vesicles (green circles) within the evanescent field of illumination (colored bluein the diagram) at the interface between the cell membrane and cover glass are visible by
4
TIRFM. B, Bright-field image of an isolated rod photoreceptor. Rods typically lost their light-sensitive outer segments during the isolation procedure, and so only the cell body, axon, andterminal remain. C, Higher-magnification view of the synaptic terminal (enclosed by the box inB). D, TIRFM image (average of 100 images acquired at 30 ms/frame) of the same synapticterminal. The region of terminal membrane in contact with the glass coverslip made a faintfluorescent footprint. The bright spots in the image reflect visits to the membrane by FM1– 43-loaded organelles during the 3 s acquisition period. One can also see other inhomogeneities inFM1– 43 fluorescence, such as the dark area near the center of the terminal that may be attrib-utable to regional differences in membrane adhesion to the glass or membrane composition.E–G shows similar bright-field and TIRFM images of a rod loaded with dextran-conjugatedpHrodo. Scale bars: B, E, 2 �m; C, D, F, G, 1 �m.
2074 • J. Neurosci., January 30, 2013 • 33(5):2071–2086 Chen et al. • Rod Synaptic Vesicle Release Imaged by TIRFM

layed fluorescence decreases (Fig. 3B). As illustrated for pHrodo-loaded vesicles (Fig. 3C), the average rate of fluorescence declineobserved with single vesicles (filled circles) was faster than therate at which fluorescence intensity increased as vesicles ap-proached the membrane (triangles). During membrane ap-proach with pHrodo-loaded vesicles, fluorescence rose to 38.7 �3.63% (n � 27) of the maximum fluorescence two frames (82.6ms) before the peak intensity was attained. For pHrodo-loadedvesicles, fusion was defined as an abrupt decline in peak fluores-cence intensity exceeding 60% within two frames with a totaldecrease of 90% relative to baseline fluorescence. This defini-
tion excluded a small number of slowerfluorescence declines (Fig. 3B, open sym-bols; 5 of 36 or 14%). Even when we in-cluded these few vesicles, the average rateof fluorescence decline was still morerapid than the rate of fluorescence in-crease caused by vesicle approach to themembrane (Fig. 3C, open squares). Fornewly arriving vesicles, baseline fluores-cence was measured in the same area be-fore vesicle appearance. For vesicles thatwere present at or near the membrane atthe beginning of a trial, we used fluores-cence in the surrounding membrane as ameasure of baseline intensity. Duringmembrane approach by FM1– 43-loadedvesicles, fluorescence attained 47.3 �0.60% (n � 11) of the maximum fluores-cence three frames (93.9 ms) before thepeak. For FM1– 43-loaded vesicles, wetherefore defined vesicle fusion as a de-cline in fluorescence intensity of 50% inthree frames with a total decrease of90% relative to baseline fluorescence.
Fusion of a large group of vesiclesshould cause a slower reduction in fluo-rescence than fusion of an individual ves-icle (Steyer et al., 1997). Fluorescence ofpHrodo-loaded vesicles declined by 60%in 53 ms (Fig. 3C) and fluorescence ofFM1– 43-loaded vesicles declined by 60%in 63 ms (Fig. 3A), similar to kinetics ofindividual release events observed byTIRFM in bipolar cells (Zenisek et al.,2002; Midorikawa et al., 2007). In con-trast, after loading a large number ofvesicles by 30 min incubation withpHrodo, it took 615 � 16 ms (n � 6) toachieve 60% fluorescence decline after adepolarization-evoked increase in near-membrane fluorescence. Multiquantal re-lease occurs less frequently in rods(Cadetti et al., 2005) than in hair cells orbipolar cells (Glowatzki and Fuchs, 2002;Singer et al., 2004), although the likeli-hood is increased in rods by activation ofCICR (Suryanarayanan and Slaughter,2006). Although the synchronous fusionof a few closely spaced vesicles might po-tentially generate a fluorescence declinewith a rapid time course similar to fusionof an individual vesicle, the small percent-
age of dye-loaded vesicles suggests that most of the rapid disap-pearance events were attributable to the fusion of single vesicles.
Elevation of Ca 2� does not increase vesicle mobility at ribbonsynapses (Holt et al., 2004; Rea et al., 2004). Together with ourfinding that fluorescence declines were more rapid than fluores-cence increases caused by vesicle approach, this suggests that theincrease in vesicle disappearance events was unlikely to be attrib-utable to increased mobility and accelerated vesicle departurefrom the evanescent field. For additional confirmation that fluo-rescence declines involved exocytotic loss of pHrodo from vesi-cles, we used epifluorescence to look at dye-filled vesicles within
Figure 2. FM1– 43- or pHrodo-labeled organelles had a diffraction-limited appearance that matched small fluorescent micro-spheres similar in size to synaptic vesicles. A, D, Consecutive images showing the disappearance of fluorescent organelles from rodterminals loaded with FM1– 43 (A) or dextran-conjugated pHrodo (D) during 50 mM KCl puff. B, E, Changes in fluorescence plottedas a function of time for regions of interest enclosing FM1– 43-stained (B) or pHrodo-stained (E) organelles. C, F, Fluorescenceintensities measured along lines placed through the centers of FM1– 43-stained (C, solid line) or pHrodo-stained (F, solid line)organelles, aligned at their peaks, and fit with Gaussian functions. Overlaid are fluorescence intensity profiles for 25 nm FM1– 43-stained amine latex microspheres (C, dashed line; Invitrogen) or 40 nm red microspheres (F, dashed line; FluoSpheres; Invitrogen).Scale bar, 0.5 �m.
Chen et al. • Rod Synaptic Vesicle Release Imaged by TIRFM J. Neurosci., January 30, 2013 • 33(5):2071–2086 • 2075
the terminal cytoplasm rather than those at the membrane sur-face. After loading a large number of vesicles by incubating dark-adapted retinas with pHrodo for 30 min, we stimulated release bybath application of 50 mM KCl and observed a pronounced de-cline in intraterminal fluorescence. The decline observed by epi-fluorescence cannot be explained simply by increased vesiclemobility, suggesting instead that pHrodo was emptied from syn-aptic vesicles by fusion (n � 9; data not shown).
Protons can be released from synaptic vesicles in cone termi-nals within 1 ms (DeVries, 2001). The finding that pHrodo fluo-rescence declined more slowly (60 –100% decline in 83 ms)cannot therefore be explained simply by loss of protons. Further-more, pHrodo fluorescence is not fully quenched at the extracel-lular pH of 7.8. As an additional test of whether the decline inpHrodo fluorescence involved emptying of dye from the vesiclelumen, we loaded vesicles with 10 kDa dextran-conjugated te-tramethylrhodamine (Invitrogen), which is not strongly pH sen-sitive. Like pHrodo, depolarization with 50 mM KCl triggered therapid and complete disappearance of tetramethylrhodamine-loaded vesicles in six rods (data not shown).
Although we used light polarized parallel to the plane ofincidence to optimize detection of FM1– 43 spreading in themembrane (Sund et al., 1999), we did not observe clouds of flu-orescence spreading laterally in the plasma membrane away fromsites of fusion, in contrast with studies in retinal bipolar andneuroendocrine cells (Steyer et al. 1997; Zenisek et al., 2000,2002). We tried a number of different approaches to look for dyespread and fluorescence clouds. (1) Clouds were not revealed byaveraging images collected from 32 individual events, aligned attheir peak fluorescence intensities. (2) Fluorescent clouds werenot observed in rods loaded by puff application of FM1– 43 (10�M) coapplied with 25 mM KCl for 10 s, similar to loading pro-tocols used with bipolar cells (Zenisek et al., 2000, 2002). (3)Clouds were not observed with release events after washing withAdvasep-7 (500 �M) to remove residual FM1– 43 from theplasma membrane. We did not routinely use Advasep-7 becausecells were less healthy after treatment. (4) Plating rods on un-coated glass rather than Cell Tak-coated coverslips did not revealclouds of FM1– 43 fluorescence. (5) To enhance dye retention inthe membrane and thus increase the likelihood of detecting lat-eral spread of the dye, we examined vesicles loaded with FM1– 84(10 �M for 1 min), a styryl dye with slower Koff than FM1– 43 (Wuet al., 2009), but did not see clouds with this dye. Two explana-tions for the inability to observe lateral dye spread seem particu-larly plausible. (1) Rod terminals made contact with glasscoverslips in very limited areas and exhibited inhomogeneities influorescence intensity (e.g., the dark spot near the center of theterminal in Fig. 1D), suggesting uneven attachment to the glass orregional differences in membrane composition that might im-pede the detection of lateral dye spread. (2) Release from rodsnormally occurs within synaptic invaginations in the terminal. Ifsynaptic invaginations remain even partially intact in isolatedcells, then the plasma membrane near release sites may not lieentirely parallel to the surface of the coverslip.
Typically, very few vesicles were observed to be immobilizedat or near the membrane surface before depolarizing stimulationin either FM1– 43-loaded (0.11 � 0.07 vesicles/terminal, n � 19terminals) or pHrodo-loaded (0.13 � 0.06 vesicles/terminal, n �30 terminals) rod terminals. Although rods normally lost theirlight-sensitive outer segments during the isolation procedure, thezero current potential attained during voltage ramps indicated aresting membrane potential in isolated rods of �37.3 � 6.7 mV(n � 9), similar to the resting membrane potential of intact rods
Figure 3. Fluorescence of dye-loaded organelles declined rapidly during depolarizing stim-ulation, consistent with fusion of individual vesicles. A, Overlay of fluorescence declines from 15FM1– 43-loaded vesicles. Vesicle fusion for FM1– 43-loaded vesicles was defined as an abruptdecline in peak fluorescence intensity exceeding 50% within three frames (94 ms) with a totaldecrease of 90% relative to baseline fluorescence (filled circles, B). B, Overlay of fluorescencedeclines from 36 pHrodo-loaded vesicles. Vesicle fusion for pHrodo-loaded vesicles was definedas an abrupt decline in peak fluorescence intensity exceeding 60% within two frames (83 ms)with a total decrease of90% relative to baseline fluorescence (filled circles, B). A few pHrodo-loaded vesicles (14%; 5 of 36) exhibited more delayed fluorescence declines (open circles, B)and were therefore not defined as fusion events. C, The average rate of fluorescence decline forsingle vesicles loaded with pHrodo (filled circles) was faster than the rise in fluorescence ob-served as vesicles approached the membrane (filled triangles), advancing deeper into the eva-nescent field of illumination. This difference was observed even when the few pHrodo-loadedvesicles that exhibited more delayed fluorescence declines (open circles, B) were included (opensquares, C). When plotting the rate of fluorescence increase, the timescale was reversed (topordinate) to facilitate comparison with rates of fluorescence decline.
2076 • J. Neurosci., January 30, 2013 • 33(5):2071–2086 Chen et al. • Rod Synaptic Vesicle Release Imaged by TIRFM

in darkness. Because of the high sensitivity of the release mecha-nism in rods to low levels of intracellular Ca 2� (Rieke andSchwartz, 1996; Thoreson et al., 2004; Sheng et al., 2007), wehypothesized that resting submembrane [Ca 2�] at these rela-
Figure 4. Simultaneous incubation with both FM1– 43 and pHrodo loaded the same organ-elles. For this experiment, vesicle release was inhibited by use of 1 mM Co 2� in nominallyCa 2�-free medium. A, FM1– 43-loaded organelles illuminated by 488 nm laser. B, pHrodo-loaded organelles illuminated with 561 nm laser. C, Overlaid image shows colocalization of bothfluorescent labels in the same presumptive synaptic vesicles. Scale bar, 1 �m.
Figure 5. Depolarization-evoked disappearance of fluorescent organelles was blocked by aCa 2� channel blocker, Co 2�. Rod terminals loaded with dextran-conjugated pHrodo weredepolarized by puff application of 50 mM KCl. The number of release events per rod terminal pertrial was binned in 80 ms increments. A, Release from unstimulated rod terminals without KClpuff (n � 8 rods). B, Release from rod terminals stimulated by 50 mM KCl puff (n � 15 rods). C,Release from rods stimulated by KCl puff in the presence of 1 mM Co 2� and nominally Ca 2�-free medium (n � 6 rods).
Chen et al. • Rod Synaptic Vesicle Release Imaged by TIRFM J. Neurosci., January 30, 2013 • 33(5):2071–2086 • 2077

tively depolarized membrane potentials (Szikra and Krizaj, 2006)might be capable of sustaining tonic release and thereby depletevesicles from membrane docking sites. In support of the hypoth-esis that rod release sites were depleted of vesicles at the resting
membrane potential in isolated rods, more vesicles were immo-bilized near the membrane surface when Ca 2� entry intopHrodo-loaded cells was inhibited by application of 1 mM Co 2�
in nominally Ca 2�-free Ringer’s solution (2.3 � 0.4 vesicles/terminal, n � 7 terminals; Fig. 4) or by voltage clamping rods at�70 mV (1.9 � 0.5 vesicles/terminal, n � 9 terminals).
Although the ability of FM1– 43 to label synaptic vesicles iswell established (Betz and Bewick, 1992; Cochilla et al., 1999; Reaet al., 2004), dextran-conjugated pHrodo has not to our knowl-
Figure 6. Kinetics of exocytosis measured optically was similar to that measured by electro-physiological techniques. Rods loaded with dextran-conjugated pHrodo were depolarized from�70 to �10 mV for 50 ms (A) or 500 ms (B). The timing of the TTL trigger pulse sent from theimaging computer jittered between two frames, occurring during images acquired either 330 or370 ms into the trial. To accommodate this frame-to-frame jitter, the number of release eventswas binned in 80 ms increments. The rate of release rose and declined rapidly during the 50 mstest step (A; n � 70 trials in 32 rods). Release also increased rapidly with the 500 ms test stepand declined after the end of the step (B; n � 55 trials in 20 rods). C, A comparison of thecumulative increase in fusion events measured optically with cumulative fusion measured elec-trophysiologically from changes in rod membrane capacitance. Membrane capacitance in-creases were evoked by depolarizing test steps to �10 mV for durations of 5, 10, 25, 50, 100,and 200 ms applied to rods in a retinal slice preparation (n � 7, circles). The amplitude of thecapacitance jump was measured over a 5 ms window beginning 30 ms after termination of thetest step. For optical measurements of release, the cumulative histogram of release eventsevoked by 500 ms test steps to �10 mV (data in B) was binned at 40 ms intervals (bars).
Figure 7. Stimulus-triggered release events clustered close to one another in rod terminals.A, Illustration of the spatial distribution of individual release events evoked by two 500 msdepolarizing steps (�70 to �10 mV) applied to a rod terminal loaded with pHrodo. B, Histo-gram of the distances from the nearest neighboring release event for release events triggeredby 50 mM KCl puff application after brief incubation of rods with either FM1– 43 (black bars; n �14 puffs in 9 rods) or pHrodo (gray bars; n � 28 puffs in 14 rods). C, Histogram of distance fromthe nearest neighboring events for simulated random events. The x and y coordinates for ran-dom events were generated using a random-number generator and superimposed onto thefootprints of FM1– 43-loaded cells (n � 9 cells).
2078 • J. Neurosci., January 30, 2013 • 33(5):2071–2086 Chen et al. • Rod Synaptic Vesicle Release Imaged by TIRFM

edge been used previously to visualize synaptic vesicle exocytosis.We therefore tested whether pHrodo labeled the same organellesas FM1– 43 by loading rods simultaneously with both dyes.When cells were superfused with 1 mM Co 2� in a nominallyCa 2�-free Ringer’s solution to promote the retention of vesi-cles at or near the membrane surface, we observed that pre-sumptive synaptic vesicles loaded with FM1– 43 were alsolabeled with pHrodo (Fig. 4).
As expected for Ca 2�-dependent exocytosis, disappearance ofpHrodo-loaded vesicles was stimulated by depolarization andblocked by inhibiting Ca 2� entry. Figure 5A shows a histogram ofputative release events in pHrodo-loaded rod terminals in theabsence of stimulation (n � 8 rods). The timing of fusion for eachevent was defined as the beginning of the fluorescence decline.Figure 5B shows that depolarization by puff application of 50 mM
KCl stimulated a large increase in disappearance events (n � 15rods). This depolarization-evoked increase in release was blockedin the presence of 1 mM Co 2� and nominally Ca 2�-free solution(Fig. 5C, n � 6 rods). The KCl-evoked increase in release was alsoblocked by bath application of Cd 2� (0.1 mM, n � 17 rods; datanot shown).
The rate at which vesicles disappear from unstimulated termi-nals (1.3 vesicles/s; Fig. 5A) depends in part on the number ofvesicles that were labeled by the dye. Given estimated tonic re-lease rates of 127– 400 vesicles/s in rods (Rieke and Schwartz,1996; Sheng et al., 2007), an average spontaneous rate of �1.3vesicles/s involving membrane footprints containing 36% of therelease sites in the terminal is consistent with loading of �1–3%of the vesicle pool. Even in the presence of Ca 2� channel block-ers, we observed slow tonic disappearance of vesicles at a rate of0.8 vesicles/s. This rate might be even lower except that the pres-
ence of Ca 2� channel blockers probably increased the retentionof dye-loaded vesicles in these experiments. Disappearanceevents observed in the presence of Ca 2� channel blockers mayrepresent spontaneous Ca 2�-independent fusion but might alsobe caused by dye-loaded organelles retreating away from the ev-anescent field. To minimize the contribution of occasional spon-taneous events to the analysis, we confined analysis of theproperties of release to events that occurred during depolarizingstimulation.
As another test of whether the disappearance of pHrodo-loaded spots represented vesicle fusion, we stimulated voltage-clamped rods with depolarizing test steps (�70 to �10 mV) toactivate L-type Ca 2� channels and thereby trigger release. Toaccommodate a small frame-to-frame jitter in the timing of theTTL trigger output from the imaging computer (see Materialsand Methods), optical measurements of release events usingpHrodo were binned in 80 ms intervals to encompass two frames.Figure 6A shows that release rose immediately during stimulationwith a brief 50 ms test step (n � 25 rods) and declined rapidlyafterward. With a longer test step (500 ms; n � 20 rods), releaserose quickly at the beginning of the step and declined a bit moreslowly (Fig. 6B). This slow decline may reflect maintained eleva-tion of intraterminal [Ca 2�] after the step involving CICR (Ca-detti et al., 2006). Simultaneous whole-cell recordings from rodsand postsynaptic horizontal or OFF bipolar cells showed that,when cyclothiazide is used to block glutamate receptor desen-sitization, postsynaptic currents persisted for 100 ms aftertermination of a 500 ms test step (Rabl et al., 2005; W.B.T.,unpublished observations).
We compared the cumulative increase in the number of fu-sion events measured optically with cumulative fusion measured
Figure 8. Release sites cluster close to the ribbon. To observe release of a large number of vesicles, rods were incubated with pHrodo for 30 min. Release was then stimulated by puff applicationof 50 mM KCl for 1 s. A, Vesicle recruitment map generated by subtracting the average of six images before the puff (filled black circles in B) from the average of nine images (red circles in B) duringthe puff. The two terminal footprints of a rod attached to the coverslip are outlined in white. B, Time course of fluorescence changes measured in a region of interest placed over the area with thelargest fluorescence change (white circle). C, Vesicle recruitment map of a rod terminal loaded with pHrodo by 30 min incubation. The rod was voltage clamped and stimulated by sustaineddepolarization to �15 mV. The vesicle recruitment map was generated by subtracting the average of seven images before stimulation from the average of 19 images obtained during stimulation.D, Ribbons were labeled by introducing a HyLite488-conjugated, high-affinity Ribeye-binding peptide (250 nM) through the patch pipette and visualized by using a 488 nm laser angled to produceepifluorescent illumination. E, Overlay of images in C and D. Scale bar, 1 �m.
Chen et al. • Rod Synaptic Vesicle Release Imaged by TIRFM J. Neurosci., January 30, 2013 • 33(5):2071–2086 • 2079

electrophysiologically from exocytotic increases in rod mem-brane capacitance (Fig. 6C). Membrane capacitance increaseswere evoked by depolarizing test steps of increasing duration (5,10, 25, 50, 100, 200 ms) applied to intact rods in the retinal slice.Release kinetics measured in these experiments was similar tothat of previous studies (Rabl et al., 2005). For optical releasemeasurements, we determined the cumulative increase in fusionevents during 500 ms depolarizing steps binned at 40 ms intervals(bars). As illustrated in Figure 6C, there was generally good agree-ment between the kinetics of release measured by optical andelectrophysiological techniques. Together, the data in Figures 2-6indicate that the disappearance of pHrodo-loaded vesicles wasprimarily attributable to fusion of individual synaptic vesicles.
Vesicles are released primarily at synaptic ribbons but also atnon-ribbon sitesIndividual release events evoked by depolarizing stimulationtended to cluster together in rod terminals. This is illustrated inFigure 7A, which shows a representative map of the location ofdepolarization-evoked individual release events in a single rodterminal evoked in two trials by depolarizing stimulation with500 ms steps to �10 mV. The base of the ribbon terminals is �1�m long in rods (Townes-Anderson et al., 1985), and we foundthat ribbons labeled by HyLite488-conjugated Ribeye-bindingpeptide were separated by an average of 2.4 � 0.2 �m (n � 63).Figure 7B shows a histogram of the number of release events(evoked by puff application of 50 mM KCl) as a function of thedistance from the center of each fusion event to its nearest neigh-bor. With both FM1– 43 (27 of 52 events in nine rods) andpHrodo (62 of 122 events in 14 rods), 50% of release eventsoccurred within 180 nm of the nearest neighboring fusion event(Fig. 7B). We also simulated randomly distributed events usingthe same synaptic terminal footprints and numbers of eventsobserved in trials with FM1– 43. In contrast with actual release,half of the randomly placed events occurred within 1.4 �m of thenearest neighboring event (Fig. 7C). Thus, release from rods wasclustered much more tightly than predicted by a simply randomdistribution of fusion events.
To examine clustering of release in a larger number of vesicles,we labeled a larger fraction of the vesicle pool by loading photo-receptors with pHrodo for 30 min. In terminals in which a largepopulation of vesicles was loaded, depolarization by puff appli-cation of 50 mM KCl stimulated a rise in pHrodo fluorescence asvesicles approached the membrane, followed by a slow decline asthey fused and emptied their contents (Fig. 8B). As discussedpreviously, the decline of fluorescence in this large population ofvesicles was much slower than the fluorescence declines observedwith individual vesicles (Fig. 3). To map the sites in which vesicleswere recruited to the membrane, we subtracted the average of siximages obtained before stimulation (Fig. 8B, filled black circles)from the average of nine images obtained during thedepolarization-evoked increase in brightness (Fig. 8B, red cir-cles). The resulting difference image shows a highly localized in-crease in fluorescence reflecting the increase in vesicles awaitingfusion at the membrane clustered in three areas of the two termi-nals (Fig. 8A). We observed similar clustering of vesicle recruit-ment sites in all eight rod terminals that we tested in this way.
To test whether these clusters of vesicle recruitment sites wereclose to synaptic ribbons, we labeled ribbons using a high-affinity, HyLite488-conjugated Ribeye-binding peptide (250 nM;Francis et al., 2011) introduced through a patch pipette. Al-though ribbons labeled by the Ribeye-binding peptide could notbe observed in the thin evanescent field using TIRFM, they could
Figure 9. Long depolarizing steps triggered a spread of Ca 2� through the terminal andincreased release farther away from ribbons. Synaptic vesicles were loaded with dextran-conjugated pHrodo, and then rods were voltage clamped to introduce Fluo5F (100 �M) throughthe patch pipette. Voltage-clamped rods were stimulated with 50 ms (A–C) or 500 ms (D) stepsfrom �70 to �10 mV. Changes in [Ca 2�] were monitored with TIRFM using a 488 nm laser.The difference image (C) was generated by subtracting the average of 39 control images beforestimulation (A) from the test image obtained during stimulation with a 50 ms step (B). D showsthe difference image for Fluo5F fluorescence obtained at the end of a 500 ms step in the samerod terminal. The fluorescence intensities within regions 1 and 2 were plotted against time for50 ms (E) and 500 ms (F) steps. In G, the relative cumulative frequency of pHrodo release eventstriggered by 50 ms (open circles, n � 50 events from 7 rods) or 500 ms (filled circles, n � 65events from 5 rods) steps were plotted against distance from the nearest Ca 2� entry site. Thesetwo distributions differed significantly (Kolmogorov–Smirnov test, p�0.019). We also plottedthe cumulative frequency of simulated fusion events that were distributed randomly through-out the footprint (triangles, n � 91 events from 7 rods; Kolmogorov–Smirnov test, p � 0.002compared with 500 ms steps). Scale bar, 1 �m.
2080 • J. Neurosci., January 30, 2013 • 33(5):2071–2086 Chen et al. • Rod Synaptic Vesicle Release Imaged by TIRFM

be seen by angling the laser more steeply to illuminate the cellmore deeply (Fig. 8D). As illustrated in Figure 8, sustained depo-larization to �15 mV in a voltage-clamped rod stimulated in-creases in pHrodo-fluorescence (C) that were confined primarilyto regions close to fluorescently labeled ribbons (D). Althoughthe ribbons were visualized at a slightly deeper plane than vesi-cles, the merged image (Fig. 8E) showed that the clusters of ves-icles recruited to release sites overlapped closely with ribbons.
Ca 2� channels are concentrated near synaptic ribbons in rods(Nachman-Clewner et al., 1999; Morgans 2001; tom Dieck et al.,2005; Mercer and Thoreson, 2011). Consistent with this, wefound that stimulating rods with 50 ms depolarizing test steps(�70 to �10 mV) evoked focal hotspots of Ca 2� entry in rodterminals loaded with the Ca 2� indicator Fluo5F. The number ofCa 2� hot spots per terminal (2.8 � 0.4, n � 9) was similar to thenumber of ribbons labeled with a high-affinity Ribeye-bindingpeptide (2.3 � 0.3, n � 31, p � 0.42). Figure 9A shows a rod
terminal loaded with Fluo5F before stim-ulation. Application of the 50 ms depolar-izing test step stimulated focal Ca 2� entryat three sites in this terminal (Fig. 9B, ar-rows). These focal Ca 2� entry sites canalso be seen in the difference image in Fig-ure 9C. The time course for Ca 2� changesin two regions of interest, one placed overa focal Ca 2� entry site (region 1) and an-other placed some distance from focalCa 2� entry sites (region 2), are shown inFigure 9E for a 50 ms step and Figure 9Ffor a 500 ms step. Depolarization with a 50ms step evoked a localized Ca 2� increasein region 1 near the presumed location ofa ribbon but no change in region 2. Incontrast, depolarization with a 500 msstep stimulated spread of Ca 2� through-out the terminal, elevating Ca 2� in bothregions 1 and 2. The spread of Ca 2� trig-gered by long depolarizing test steps (to�10 mV for 200 ms) in rod terminalshas been shown to involve CICR (Krizaj etal., 1999; Cadetti et al., 2006; Suryanaray-anan and Slaughter, 2006; Babai et al.,2010).
Because ribbons could not be observeddirectly by TIRFM, we used sites of focalCa 2� entry evoked by 50 ms depolarizingtest steps as indicators for ribbon location.Most release events triggered by 50 mssteps occurred within 1 �m of the nearestCa 2� entry site, suggesting that most re-lease occurs close to ribbons. However,vesicles were also released farther awayfrom ribbons (Fig. 9G). With 50 ms teststeps, 18% of release events (9 of 50) oc-curred 1.0 �m from the nearest Ca 2�
entry site. Application of longer test steps(500 ms) stimulated spread of Ca 2�
throughout the terminal (Fig. 9D) and en-hanced release far from the ribbon, with45% of release events (29 of 65) occurring1.0 �m from the nearest Ca 2� entrysite. The cumulative histogram in Figure9G shows that release events triggered by
50 ms steps (open circles; mean of 0.80 � 0.08 �m, n � 50 releaseevents from 7 rods) occurred closer to Ca 2� entry sites than 500ms steps (filled circles; mean of 1.15 � 0.10 �m, n � 65 releaseevents from 5 rods; Kolmogorov–Smirnov test comparing cumu-lative frequency curves, p � 0.019). Simulating a random distri-bution of vesicle fusion events throughout the footprints yieldeda significantly greater distance from the nearest Ca 2� entry sitethan actual fusion evoked by 500 ms steps (Fig. 9G, triangles;mean of 1.33 � 0.11 �m, n � 91 events from 7 rods; Kolmogo-rov–Smirnov test, p � 0.002). Thus, 500 ms steps stimulatedgreater non-ribbon release than 50 ms steps but less non-ribbon release than predicted by a purely random distribution.
To further analyze which kinetic components of release in-volve the ribbon, we measured release from voltage-clampedrods and used FALI (Hoffman-Kim et al., 2007) to selectivelydamage the ribbon by targeting it with a fluorescein-conjugatedpeptide that binds to Ribeye (40 �M; Zenisek et al., 2004; Zenisek,
Figure 10. Effects of acute ribbon damage by FALI on rod exocytosis. A rod loaded with fluorescein-conjugated Ribeye-bindingpeptide (40 �M) was bleached with a 488 nm laser for 1 min. Damaging the ribbon by FALI inhibited the capacitance jump evokedby a 25 ms test step from �70 to �10 mV (A) more strongly than it inhibited the capacitance jump evoked by a 200 ms step (B).Control responses before bleach are averaged from two trials in the same cell. Responses after bleach are averaged from three trials.C, Bar graph showing that capacitance changes evoked by short 25 ms test steps (�70 to �10 mV) were significantly inhibited bydamaging the ribbon with FALI using the Ribeye-binding peptide (�38.3 � 7.5%, n � 10; **paired t test, p � 0.0017).Damaging the ribbon by FALI caused a smaller percentage inhibition of capacitance jumps evoked by 200 ms steps that did notattain statistical significance (�8.7 � 22.1%, n � 9; paired t test, p � 0.43). D, Capacitance jumps evoked by 25 or 200 ms stepswere not significantly reduced by FALI with a scrambled control peptide (25 ms, n � 7, paired t test, p � 0.76; 200 ms, n � 7, p �0.67). The amplitudes of depolarization-evoked capacitance increases were measured 30 ms after the end of the test pulse.
Chen et al. • Rod Synaptic Vesicle Release Imaged by TIRFM J. Neurosci., January 30, 2013 • 33(5):2071–2086 • 2081

2008). We measured the amount of exo-cytosis from the increase in membrane ca-pacitance evoked by depolarizing teststeps applied to rods in a retinal slice prep-aration. The amount of release evoked bythe first stimulus (25 ms, �70 to �10mV) immediately after FALI was dimin-ished only slightly (Snellman et al., 2011),and so we omitted the first post-bleachresponse from analysis. Comparing sub-sequent responses to pre-bleach controlresponses, we found that capacitance in-creases evoked by 25 ms test steps (�70 to�10 mV) were significantly inhibited(�38.3 � 7.5%, n � 10; paired t test, p �0.0017) after damaging the ribbon byFALI (Fig. 10A,C). Partial inhibition ofrelease by FALI is consistent with bindingto approximately half of the availablebinding sites by the Ribeye-binding pep-tide, which has a Kd of �30 �M (Zenisek etal., 2004; Snellman et al., 2011). Damag-ing the ribbon by FALI caused a smallerpercentage reduction in the capacitancejump evoked by 200 ms steps (�8.7 �22.1%, n � 9; paired t test, p � 0.43; Fig.10B,C), consistent with the recruitment ofadditional non-ribbon release sites withmore sustained stimulation. FALI with ascrambled version of the fluorescein-conjugated peptide did not significantly al-ter capacitance responses to either 25 or 200ms steps (Fig. 10D). These data are consis-tent with the imaging results suggesting thatthe initial fast component of release involvesthe ribbon and that additional non-ribbonrelease sites are recruited during sustaineddepolarization.
Vesicle approach to the membraneDuring depolarizing stimulation withhigh [K�] puffs or depolarizing steps, ves-icles approached the membrane and remained visible for a shorttime before disappearing (Fig. 11A). To calculate the velocity ofvesicle approach, we converted the increase in vesicle fluores-cence to distance (z; Fig. 11B) by assuming that the evanescentfield intensity declined exponentially with length constants (d) of64 nm for the 561 nm laser used for exciting pHrodo or 57 nm forthe 488 nm laser used for exciting FM1– 43:
z � �d � ln(I(z)/I(0)). (3)
I(z) is the average fluorescence intensity within a region of inter-est enclosing the bright spot, and I(0) is the maximum fluores-cence intensity attained by the vesicle just before fusion (Axelrod,2001). The linear slope of the resulting relationship between ves-icle distance and approach time (Fig. 11C) yielded similar ap-proach velocities for vesicles loaded with pHrodo (843 � 65nm/s, n � 14 vesicles) or FM1– 43 (688 � 74 nm/s, n � 10vesicles, p � 0.13). These values are similar to the approach ve-locity found for FM1– 43-loaded synaptic vesicles in bipolar cells(Zenisek et al., 2000). Using sites of focal Ca 2� entry as indicatorsof ribbon location and 50 ms steps to evoke release, we found no
difference in the approach velocity for pHrodo-loaded vesiclesthat fused within 0.5 �m of the nearest focal site of Ca 2� entry(857 � 86 nm/s, n � 7 vesicles) or those that fused 1.0 �m fromfocal sites of Ca 2� entry (828 � 104 nm/s, n � 7 vesicles, p �0.84). It is worth noting that these velocity measurements wereunlikely to report movement on the ribbon itself because fluores-cently labeled ribbons were not visible in TIRFM.
As presented previously, vesicles sometimes remained immo-bilized at or near the membrane for long periods when Ca 2�
entry was inhibited. In rods voltage clamped at �70 mV andloaded with pHrodo, previously immobilized vesicles showed asmall fluorescence increase just before their stimulation-evokeddisappearance. Figure 12A shows an example of the fluorescencechanges accompanying fusion of a previously immobilized vesi-cle. The time course of fluorescence changes in this experiment isplotted in Figure 12B with the corresponding images indicated byletters adjacent to the open circles. The fluorescence intensitiesaveraged from five release events in three rods are plotted againsttime in Figure 12C. These data were normalized to the peak in-tensity values for each vesicle. Because pHrodo is not insertedinto the membrane, this brightening was not caused by changes
Figure 11. Velocity of approach for newly arriving vesicles. A, A series of images illustrating the increase in fluorescenceintensity as a pHrodo-loaded vesicle approached the membrane before fusion. B, Relative fluorescence intensity [I(z)/I(0)] plottedagainst time. The right ordinate shows the vertical distance from the membrane at each time point calculated using Equation 3. Theline shows a fit to the data with a Boltzmann function. C, Approach velocity was determined from the linear slope of the relationshipbetween vesicle distance from the membrane and time. In this example, the slope was �838 nm/s. Scale bar, 0.5 �m.
2082 • J. Neurosci., January 30, 2013 • 33(5):2071–2086 Chen et al. • Rod Synaptic Vesicle Release Imaged by TIRFM
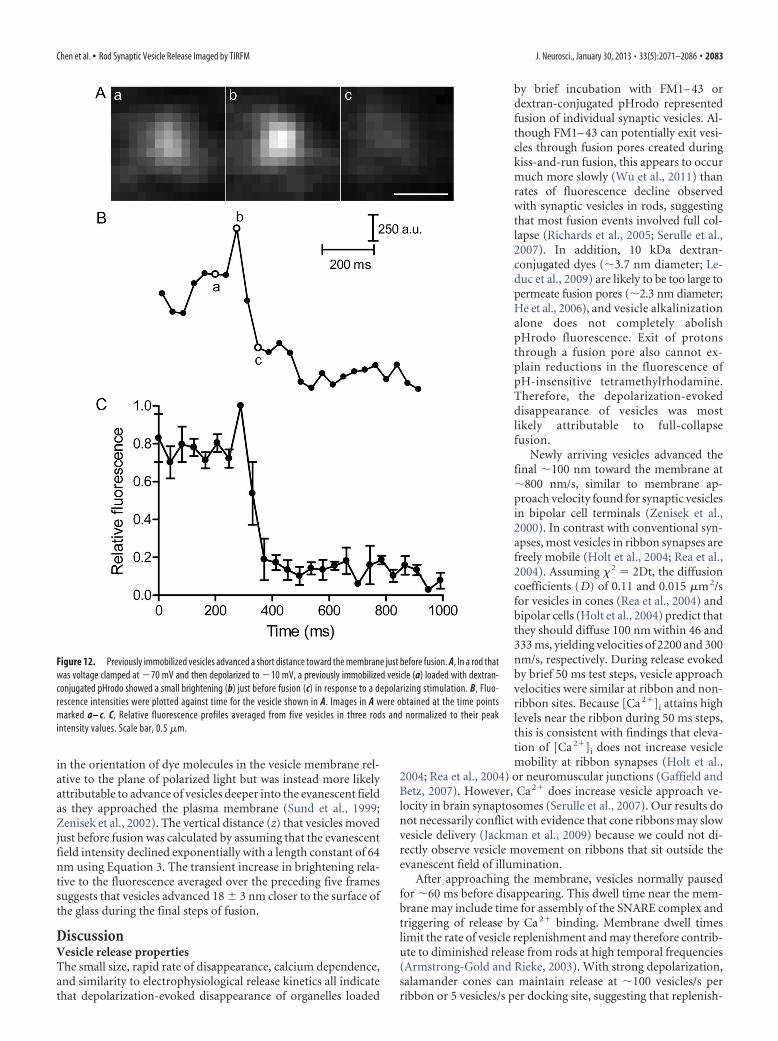
in the orientation of dye molecules in the vesicle membrane rel-ative to the plane of polarized light but was instead more likelyattributable to advance of vesicles deeper into the evanescent fieldas they approached the plasma membrane (Sund et al., 1999;Zenisek et al., 2002). The vertical distance (z) that vesicles movedjust before fusion was calculated by assuming that the evanescentfield intensity declined exponentially with a length constant of 64nm using Equation 3. The transient increase in brightening rela-tive to the fluorescence averaged over the preceding five framessuggests that vesicles advanced 18 � 3 nm closer to the surface ofthe glass during the final steps of fusion.
DiscussionVesicle release propertiesThe small size, rapid rate of disappearance, calcium dependence,and similarity to electrophysiological release kinetics all indicatethat depolarization-evoked disappearance of organelles loaded
by brief incubation with FM1– 43 ordextran-conjugated pHrodo representedfusion of individual synaptic vesicles. Al-though FM1– 43 can potentially exit vesi-cles through fusion pores created duringkiss-and-run fusion, this appears to occurmuch more slowly (Wu et al., 2011) thanrates of fluorescence decline observedwith synaptic vesicles in rods, suggestingthat most fusion events involved full col-lapse (Richards et al., 2005; Serulle et al.,2007). In addition, 10 kDa dextran-conjugated dyes (�3.7 nm diameter; Le-duc et al., 2009) are likely to be too large topermeate fusion pores (�2.3 nm diameter;He et al., 2006), and vesicle alkalinizationalone does not completely abolishpHrodo fluorescence. Exit of protonsthrough a fusion pore also cannot ex-plain reductions in the fluorescence ofpH-insensitive tetramethylrhodamine.Therefore, the depolarization-evokeddisappearance of vesicles was mostlikely attributable to full-collapsefusion.
Newly arriving vesicles advanced thefinal �100 nm toward the membrane at�800 nm/s, similar to membrane ap-proach velocity found for synaptic vesiclesin bipolar cell terminals (Zenisek et al.,2000). In contrast with conventional syn-apses, most vesicles in ribbon synapses arefreely mobile (Holt et al., 2004; Rea et al.,2004). Assuming 2 � 2Dt, the diffusioncoefficients (D) of 0.11 and 0.015 �m 2/sfor vesicles in cones (Rea et al., 2004) andbipolar cells (Holt et al., 2004) predict thatthey should diffuse 100 nm within 46 and333 ms, yielding velocities of 2200 and 300nm/s, respectively. During release evokedby brief 50 ms test steps, vesicle approachvelocities were similar at ribbon and non-ribbon sites. Because [Ca 2�]i attains highlevels near the ribbon during 50 ms steps,this is consistent with findings that eleva-tion of [Ca 2�]i does not increase vesiclemobility at ribbon synapses (Holt et al.,
2004; Rea et al., 2004) or neuromuscular junctions (Gaffield andBetz, 2007). However, Ca 2� does increase vesicle approach ve-locity in brain synaptosomes (Serulle et al., 2007). Our results donot necessarily conflict with evidence that cone ribbons may slowvesicle delivery (Jackman et al., 2009) because we could not di-rectly observe vesicle movement on ribbons that sit outside theevanescent field of illumination.
After approaching the membrane, vesicles normally pausedfor �60 ms before disappearing. This dwell time near the mem-brane may include time for assembly of the SNARE complex andtriggering of release by Ca 2� binding. Membrane dwell timeslimit the rate of vesicle replenishment and may therefore contrib-ute to diminished release from rods at high temporal frequencies(Armstrong-Gold and Rieke, 2003). With strong depolarization,salamander cones can maintain release at �100 vesicles/s perribbon or 5 vesicles/s per docking site, suggesting that replenish-
Figure 12. Previously immobilized vesicles advanced a short distance toward the membrane just before fusion. A, In a rod thatwas voltage clamped at �70 mV and then depolarized to �10 mV, a previously immobilized vesicle (a) loaded with dextran-conjugated pHrodo showed a small brightening (b) just before fusion (c) in response to a depolarizing stimulation. B, Fluo-rescence intensities were plotted against time for the vesicle shown in A. Images in A were obtained at the time pointsmarked a– c. C, Relative fluorescence profiles averaged from five vesicles in three rods and normalized to their peakintensity values. Scale bar, 0.5 �m.
Chen et al. • Rod Synaptic Vesicle Release Imaged by TIRFM J. Neurosci., January 30, 2013 • 33(5):2071–2086 • 2083

ment requires �200 ms/docking site (Bartoletti et al., 2010). Thisis longer than membrane dwell times in rods, suggesting thatperhaps earlier steps (e.g., attachment to the ribbon) also regulatereplenishment rates. Bullfrog saccular hair cells can maintain re-lease at �500 vesicles/s per ribbon or 12.5 vesicles/s per dockingsite (Parsons et al., 1994; Lenzi et al., 2002), suggesting that re-plenishment requires �80 ms/docking site. For this cell type, 60ms dwell times would be essentially sufficient to explain replen-ishment. Dwell times can be influenced by the properties of exo-cytotic proteins (Ohara-Imaizumi et al., 2007), and these varyamong cell types. Thus, dwell times of �200 ms were seen inbipolar cells (Zenisek et al., 2000), kiss-and-run fusion events inastrocytes are associated with dwell times of �1 s (Malarkey andParpura, 2011), and dwell times for large dense-core vesicles inneuroendocrine cells are typically 1 s, although dwell times of�300 ms have also been observed (Allersma et al., 2004).
Voltage clamping rods at �70 mV increased the number ofimmobilized vesicles near the membrane. During depolarizingstimulation, membrane-associated vesicles advanced deeper intothe evanescent field of illumination, causing a transient brighten-ing just before the abrupt fluorescence decline accompanyingexocytosis. The magnitude of brightening suggests a final ad-vance of �18 nm. Membranes are �7.5 nm thick (Robertson,1959; Yamamoto, 1963), and the SNARE complex is �12 nmlong � 3 nm wide (Sutton et al., 1998). An advance of 18 nm istherefore consistent with SNARE-mediated merger of vesicle andplasma membranes. Bipolar cell vesicles (Zenisek et al., 2000) andlarge dense-core vesicles (Karatekin et al., 2008) also advanced�20 nm toward the membrane before fusion, but these move-ments occurred much earlier, preceding final fusion by �250 msand �1 s, respectively.
Implications for rod neurotransmissionThe exocytotic Ca 2� sensor in rods and cones shows an unusuallyhigh Ca 2� sensitivity (Rieke and Schwartz, 1996; Thoreson et al.,2004; Sheng et al., 2007; Duncan et al., 2010). In cones, [Ca 2�]i atthe base of the ribbon in darkness is therefore sufficient to stim-ulate release of a vesicle as soon as it is available for fusion (Jack-man et al., 2009). This leads to a depletion of release sites at thebase of the ribbon in darkness. The findings that rod release siteswere depleted at membrane potentials near the dark resting po-tential and vesicles were immobilized at the membrane onlywhen Ca 2� entry was inhibited (e.g., by holding rods at �70 mVor blocking Ca 2� channels) are consistent with a similar scenarioin rods.
After depleting vesicles from the base of the ribbon, the rate ofsustained release is limited by the rate at which vesicles can re-populate available release sites (Jackman et al., 2009; Oesch andDiamond, 2011). It has been proposed that this might reducesynaptic noise by uncoupling release events from the stochasticoccurrence of individual Ca 2� channel openings (Jackman et al.,2009). However, if sustained release rates are governed by vesicledelivery, then variability in vesicle membrane dwell times couldalso introduce noise. Dwell times of pHrodo-loaded vesicles ex-hibited a relatively large SD of 23 ms, but this may be primarilyattributable to the image acquisition rate of 40 ms/frame. Highertemporal resolution measurements are needed to test whetherribbons regularize vesicle delivery.
Ribbons facilitate clustering of vesicles near Ca 2� channelsand induce a maturation process to help vesicles become fusioncompetent (Heidelberger et al., 2002; Frank et al., 2010; Snellmanet al., 2011). Similar to bipolar cells (Midorikawa et al., 2007;Zenisek, 2008), most release events triggered by depolarizing
steps in rods occurred �1 �m from the nearest focal Ca 2� entrysite (i.e., close to the ribbon). Sustained depolarization with 500ms steps caused Ca 2� to spread throughout rod terminals andincreased the frequency of release at ectopic, non-ribbon sites.However, even with sustained depolarization, release occurredmore frequently near the ribbon than predicted by a randomdistribution of release events, consistent with results from otherribbon synapses showing that release-competent vesicles are con-centrated near the ribbon (Zenisek, 2008; Frank et al., 2010;Snellman et al., 2011).
The increase in non-ribbon release accompanying sustaineddepolarization suggests that non-ribbon sites make a greater con-tribution to postsynaptic responses when rods are maintained ina continuously depolarized state as occurs in darkness. Main-tained depolarization triggers the spread of Ca 2� throughout rodterminals by activating CICR (Krizaj et al., 1999, 2003; Cadetti etal., 2006; Suryanarayanan and Slaughter, 2006; Babai et al., 2010).Thus, non-ribbon release may be amplified by Ca 2� release fromintracellular stores. Rod ribbons sit in a ridge-shaped projectionthat protrudes into a deep invagination within the terminal. In-tracellular Ca 2� is released from endoplasmic reticulum that isfound near the plasma membrane along the flanks of the invagi-nation (Ungar et al., 1981; Mercurio and Holtzman, 1982; Babaiet al., 2010), in the same regions of the synapse in which exocy-totic omega figures were observed by electron microscopy(Zampighi et al., 2011). Non-ribbon release might also poten-tially occur at basal contacts between rods and bipolar cells out-side of the invagination, although basal contacts are primarilydevoid of vesicles (Lasansky, 1973). Whether located along theflanks of the invagination or at basal contacts, non-ribbon releasesites would be farther than ribbon release sites from glutamatereceptors found at the tips of horizontal and bipolar cell processesin the center of the invagination (Morigiwa and Vardi, 1999;Klooster et al., 2009). Although glutamate can diffuse throughoutthe photoreceptor synaptic cleft and reach quite distant recep-tors, the diffusional spreading of glutamate slows the kinetics ofpostsynaptic currents (Rao-Mirotznik et al., 1998; DeVries et al.,2006) and may also contribute to an elevation of basal glutamatelevels in the cleft during maintained depolarization (Cadetti et al.,2008). Diffusional spreading of glutamate might therefore con-tribute to slow synaptic kinetics in rods (Schnapf and Copenha-gen, 1982; Copenhagen et al., 1983; Rabl et al., 2005). However,amplifying release rates in darkness by recruiting additional non-ribbon release sites might make it easier for postsynaptic neuronsto detect decrements in release when rods hyperpolarize to light.
ReferencesAbe H, Yamamoto TY (1984) Diurnal changes in synaptic ribbons of rod
cells of the turtle. J Ultrastruct Res 86:246 –251. MedlineAllersma MW, Wang L, Axelrod D, Holz RW (2004) Visualization of regu-
lated exocytosis with a granule-membrane probe using total internal re-flection microscopy. Mol Biol Cell 15:4658 – 4668. CrossRef Medline
Armstrong-Gold CE, Rieke F (2003) Bandpass filtering at the rod to second-order cell synapse in salamander (Ambystoma tigrinum) retina. J Neurosci23:3796 –3806. Medline
Axelrod D (2001) Selective imaging of surface fluorescence with very highaperture microscope objectives. J Biomed Opt 6:6 –13. CrossRef Medline
Babai N, Morgans CW, Thoreson WB (2010) Calcium-induced calcium re-lease contributes to synaptic release from mouse rod photoreceptors.Neuroscience 165:1447–1456. CrossRef Medline
Balkema GW, Cusick K, Nguyen TH (2001) Diurnal variation in synapticribbon length and visual threshold. Vis Neurosci 18:789 –797. CrossRefMedline
Bartoletti TM, Babai N, Thoreson WB (2010) Vesicle pool size at the sala-mander cone ribbon synapse. J Neurophysiol 103:419 – 423. CrossRefMedline
2084 • J. Neurosci., January 30, 2013 • 33(5):2071–2086 Chen et al. • Rod Synaptic Vesicle Release Imaged by TIRFM

Becherer U, Moser T, Stuhmer W, Oheim M (2003) Calcium regulates ex-ocytosis at the level of single vesicles. Nat Neurosci 6:846 – 853. CrossRefMedline
Bereiter-Hahn J, Fox CH, Thorell B (1979) Quantitative reflection contrastmicroscopy of living cells. J Cell Biol 82:767–779. CrossRef Medline
Betz WJ, Bewick GS (1992) Optical analysis of synaptic vesicle recycling atthe frog neuromuscular junction. Science 255:200 –203. CrossRefMedline
Bezzi P, Gundersen V, Galbete JL, Seifert G, Steinhauser C, Pilati E, VolterraA (2004) Astrocytes contain a vesicular compartment that is competentfor regulated exocytosis of glutamate. Nat Neurosci 7:613– 620. CrossRefMedline
Cadetti L, Tranchina D, Thoreson WB (2005) A comparison of release ki-netics and glutamate receptor properties in shaping rod-cone differencesin EPSC kinetics in the salamander retina. J Physiol 569:773–788.CrossRef Medline
Cadetti L, Bryson EJ, Ciccone CA, Rabl K, Thoreson WB (2006) Calcium-induced calcium release in rod photoreceptor terminals boosts synaptictransmission during maintained depolarization. Eur J Neurosci 23:2983–2990. CrossRef Medline
Cadetti L, Bartoletti TM, Thoreson WB (2008) Quantal mEPSCs and resid-ual glutamate: how horizontal cell responses are shaped at the photore-ceptor ribbon synapse. Eur J Neurosci 27:2575–2586. CrossRef Medline
Cochilla AJ, Angleson JK, Betz WJ (1999) Monitoring secretory membranewith FM1– 43 fluorescence. Annu Rev Neurosci 22:1–10. CrossRefMedline
Copenhagen DR, Ashmore JF, Schnapf JK (1983) Kinetics of synaptic trans-mission from photoreceptors to horizontal and bipolar cells in turtleretina. Vision Res 23:363–369. CrossRef Medline
DeVries SH (2001) Exocytosed protons feedback to suppress the Ca 2� cur-rent in mammalian cone photoreceptors. Neuron 32:1107–1117.CrossRef Medline
DeVries SH, Li W, Saszik S (2006) Parallel processing in two transmittermicroenvironments at the cone photoreceptor synapse. Neuron 50:735–748. CrossRef Medline
Dick O, tom Dieck S, Altrock WD, Ammermuller J, Weiler R, Garner CC,Gundelfinger ED, Brandstatter JH (2003) The presynaptic active zoneprotein bassoon is essential for photoreceptor ribbon synapse formationin the retina. Neuron 37:775–786. CrossRef Medline
Duncan G, Rabl K, Gemp I, Heidelberger R, Thoreson WB (2010) Quanti-tative analysis of synaptic release at the photoreceptor synapse. Biophys J98:2102–2110. CrossRef Medline
Eggermann E, Bucurenciu I, Goswami SP, Jonas P (2012) Nanodomaincoupling between Ca 2� channels and sensors of exocytosis at fast mam-malian synapses. Nat Rev Neurosci 13:7–21. CrossRef Medline
Francis AA, Mehta B, Zenisek D (2011) Development of new peptide-basedtools for studying synaptic ribbon function. J Neurophysiol 106:1028 –1037. CrossRef Medline
Frank T, Rutherford MA, Strenzke N, Neef A, Pangrsic T, Khimich D, FetjovaA, Gundelfinger ED, Liberman MC, Harke B, Bryan KE, Lee A, Egner A,Riedel D, Moser T (2010) Bassoon and the synaptic ribbon organizeCa 2� channels and vesicles to add release sites and promote refilling.Neuron 68:724 –738. CrossRef Medline
Fuchs M, Sendelbeck A, Atorf J, Kremers J, Brandstatter JH (2013) Straindifferences in illumination-dependent structural changes at mouse pho-toreceptor ribbon synapses. J Comp Neurol 521:69 –78. CrossRef Medline
Gaffield MA, Betz WJ (2007) Synaptic vesicle mobility in mouse motornerve terminals with and without synapsin. J Neurosci 27:13691–13700.CrossRef Medline
Glowatzki E, Fuchs PA (2002) Transmitter release at the hair cell ribbonsynapse. Nat Neurosci 5:147–154. CrossRef Medline
He L, Wu XS, Mohan R, Wu LG (2006) Two modes of fusion pore openingrevealed by cell-attached recordings at a synapse. Nature 444:102–105.CrossRef Medline
Heidelberger R, Sterling P, Matthews G (2002) Roles of ATP in depletionand replenishment of the releasable pool of synaptic vesicles. J Neuro-physiol 88:98 –106. Medline
Hoffman-Kim D, Diefenbach TJ, Eustace BK, Jay DG (2007)Chromophore-assisted laser inactivation. Methods Cell Biol 82:335–354.CrossRef Medline
Holt M, Cooke A, Neef A, Lagnado L (2004) High mobility of vesicles sup-
ports continuous exocytosis at a ribbon synapse. Curr Biol 14:173–183.CrossRef Medline
Jackman SL, Choi SY, Thoreson WB, Rabl K, Bartoletti TM, Kramer RH(2009) Role of the synaptic ribbon in transmitting the cone light re-sponse. Nat Neurosci 12:303–310. CrossRef Medline
Karatekin E, Tran VS, Huet S, Fanget I, Cribier S, Henry JP (2008) A 20-nmstep toward the cell membrane preceding exocytosis may correspond todocking of tethered granules. Biophys J 94:2891–2905. CrossRef Medline
Khimich D, Nouvian R, Pujol R, Tom Dieck S, Egner A, Gundelfinger ED,Moser T (2005) Hair cell synaptic ribbons are essential for synchronousauditory signalling. Nature 434:889 – 894. CrossRef Medline
Klooster J, Yazulla S, Kamermans M (2009) Ultrastructural analysis of theglutamatergic system in the outer plexiform layer of zebrafish retina.J Chem Neuroanat 37:254 –265. CrossRef Medline
Korenbrot JI, Rebrik TI (2002) Tuning outer segment Ca 2� homeostasis tophototransduction in rods and cones. Adv Exp Med Biol 514:179 –203.CrossRef Medline
Krizaj D, Bao JX, Schmitz Y, Witkovsky P, Copenhagen DR (1999)Caffeine-sensitive calcium stores regulate synaptic transmission from ret-inal rod photoreceptors. J Neurosci 19:7249 –7261. Medline
Krizaj D, Lai FA, Copenhagen DR (2003) Ryanodine stores and calciumregulation in the inner segments of salamander rods and cones. J Physiol547:761–774. CrossRef Medline
Lasansky A (1973) Organization of the outer synaptic layer in the retina ofthe larval tiger salamander. Philos Trans R Soc Lond B Biol Sci 265:471–489. CrossRef Medline
Leduc M, Guay D, Leask RL, Coulombe S (2009) Cell permeabilization us-ing a non-thermal plasma. New J Physics 11:115021. CrossRef
Lenzi D, Crum J, Ellisman MH, Roberts WM (2002) Depolarization redis-tributes synaptic membrane and creates a gradient of vesicles on the syn-aptic body at a ribbon synapse. Neuron 36:649 – 659. CrossRef
Malarkey EB, Parpura V (2011) Temporal characteristics of vesicular fusionin astrocytes: examination of synaptobrevin 2-laden vesicles at single ves-icle resolution. J Physiol 589:4271– 4300. CrossRef Medline
Matthews G, Fuchs P (2010) The diverse roles of ribbon synapses in sensoryneurotransmission. Nat Rev Neurosci 11:812– 822. CrossRef Medline
Mattheyses AL, Axelrod D (2006) Direct measurement of the evanescentfield profile produced by objective-based total internal reflection fluores-cence. J Biomed Opt 11:014006. CrossRef Medline
Mercer AJ, Thoreson WB (2011) The dynamic architecture of photoreceptorribbon synapses: cytoskeletal, extracellular matrix, and intramembraneproteins. Vis Neurosci 28:453– 471. CrossRef Medline
Mercer AJ, Rabl K, Riccardi GE, Brecha NC, Stella SL Jr, Thoreson WB(2011) Location of release sites and calcium-activated chloride channelsrelative to calcium channels at the photoreceptor ribbon synapse. J Neu-rophysiol 105:321–335. CrossRef Medline
Mercurio AM, Holtzman E (1982) Smooth endoplasmic reticulum andother agranular reticulum in frog retinal photoreceptors. J Neurocytol11:263–293. CrossRef Medline
Midorikawa M, Tsukamoto Y, Berglund K, Ishii M, Tachibana M (2007)Different roles of ribbon-associated and ribbon-free active zones in reti-nal bipolar cells. Nat Neurosci 10:1268 –1276. CrossRef Medline
Morgans CW (2001) Localization of the alpha(1F) calcium channel subunitin the rat retina. Invest Ophthalmol Vis Sci 42:2414 –2418. Medline
Morigiwa K, Vardi N (1999) Differential expression of ionotropic gluta-mate receptor subunits in the outer retina. J Comp Neurol 405:173–184.CrossRef Medline
Nachman-Clewner M, St Jules R, Townes-Anderson E (1999) L-type cal-cium channels in the photoreceptor ribbon synapse: localization and rolein plasticity. J Comp Neurol 415:1–16. CrossRef Medline
Oesch NW, Diamond JS (2011) Ribbon synapses compute temporal con-trast and encode luminance in retinal rod bipolar cells. Nat Neurosci14:1555–1561. CrossRef Medline
Ohara-Imaizumi M, Fujiwara T, Nakamichi Y, Okamura T, Akimoto Y,Kawai J, Matsushima S, Kawakami H, Watanabe T, Akagawa K, Nagam-atsu S (2007) Imaging analysis reveals mechanistic differences betweenfirst- and second-phase insulin exocytosis. J Cell Biol 177:695–705.CrossRef Medline
Oheim M, Loerke D, Stuhmer W, Chow RH (1999) Multiple stimulation-dependent processes regulate the size of the releasable pool of vesicles. EurBiophys J 28:91–101. CrossRef Medline
Parsons TD, Lenzi D, Almers W, Roberts WM (1994) Calcium-triggered
Chen et al. • Rod Synaptic Vesicle Release Imaged by TIRFM J. Neurosci., January 30, 2013 • 33(5):2071–2086 • 2085

exocytosis and endocytosis in an isolated presynaptic cell: capacitancemeasurements in saccular hair cells. Neuron 13:875– 883. CrossRefMedline
Rabl K, Cadetti L, Thoreson WB (2005) Kinetics of exocytosis is faster incones than in rods. J Neurosci 25:4633– 4640. CrossRef Medline
Rao-Mirotznik R, Buchsbaum G, Sterling P (1998) Transmitter concentra-tion at a three-dimensional synapse. J Neurophysiol 80:3163–3172.Medline
Rea R, Li J, Dharia A, Levitan ES, Sterling P, Kramer RH (2004) Streamlinedsynaptic vesicle cycle in cone photoreceptor terminals. Neuron 41:755–766. CrossRef Medline
Richards DA, Bai J, Chapman ER (2005) Two modes of exocytosis at hip-pocampal synapses revealed by rate of FM1– 43 efflux from individualvesicles. J Cell Biol 168:929 –939. CrossRef Medline
Rieke F, Schwartz EA (1996) Asynchronous transmitter release: control ofexocytosis and endocytosis at the salamander rod synapse. J Physiol 493:1– 8. Medline
Robertson JD (1959) The ultrastructure of cell membranes and their deriv-atives. Biochem Soc Symp 16:3– 43. Medline
Schmitz F (2009) The making of synaptic ribbons: how they are built andwhat they do. Neuroscientist 15:611– 624. CrossRef Medline
Schmoranzer J, Goulian M, Axelrod D, Simon SM (2000) Imaging consti-tutive exocytosis with total internal reflection fluorescence microscopy.J Cell Biol 149:23–32. CrossRef Medline
Schnapf JL, Copenhagen DR (1982) Differences in the kinetics of rod andcone synaptic transmission. Nature 296:862– 864. CrossRef Medline
Serulle Y, Sugimori M, Llinas RR (2007) Imaging synaptosomal calcium con-centration microdomains and vesicle fusion by using total internal reflectionfluorescent microscopy. Proc Natl Acad Sci U S A 104:1697–1702. CrossRefMedline
Sheng Z, Choi SY, Dharia A, Li J, Sterling P, Kramer RH (2007) SynapticCa 2� in darkness is lower in rods than cones, causing slower tonic releaseof vesicles. J Neurosci 27:5033–5042. CrossRef Medline
Singer JH, Lassova L, Vardi N, Diamond JS (2004) Coordinated multive-sicular release at a mammalian ribbon synapse. Nat Neurosci 7:826 – 833.CrossRef Medline
Snellman J, Mehta B, Babai N, Bartoletti TM, Akmentin W, Francis A, Mat-thews G, Thoreson W, Zenisek D (2011) Acute destruction of the syn-aptic ribbon reveals a role for the ribbon in vesicle priming. Nat Neurosci14:1135–1141. CrossRef Medline
Spiwoks-Becker I, Glas M, Lasarzik I, Vollrath L (2004) Mouse photorecep-tor synaptic ribbons lose and regain material in response to illuminationchanges. Eur J Neurosci 19:1559 –1571. CrossRef Medline
Steyer JA, Horstmann H, Almers W (1997) Transport, docking and exocy-tosis of single secretory granules in live chromaffin cells. Nature 388:474 –478. CrossRef Medline
Sund SE, Swanson JA, Axelrod D (1999) Cell membrane orientation visual-ized by polarized total internal reflection fluorescence. Biophys J 77:2266 –2283. CrossRef Medline
Suryanarayanan A, Slaughter MM (2006) Synaptic transmission mediatedby internal calcium stores in rod photoreceptors. J Neurosci 26:1759 –1766. CrossRef Medline
Sutton RB, Fasshauer D, Jahn R, Brunger AT (1998) Crystal structure of aSNARE complex involved in synaptic exocytosis at 2.4 A resolution. Na-ture 395:347–353. CrossRef Medline
Szikra T, Krizaj D (2006) The dynamic range and domain-specific signals ofintracellular calcium in photoreceptors. Neuroscience 141:143–155.CrossRef Medline
Thoreson WB, Nitzan R, Miller RF (2000) Chloride efflux inhibits singlecalcium channel open probability in vertebrate photoreceptors: chlorideimaging and cell-attached patch-clamp recordings. Vis Neurosci 17:197–206. Medline
Thoreson WB, Rabl K, Townes-Anderson E, Heidelberger R (2004) A highlyCa 2�-sensitive pool of vesicles contributes to linearity at the rod photo-receptor ribbon synapse. Neuron 42:595– 605. CrossRef Medline
tom Dieck S, Altrock WD, Kessels MM, Qualmann B, Regus H, Brauner D,Fejtova A, Bracko O, Gundelfinger ED, Brandstatter JH (2005) Molec-ular dissection of the photoreceptor ribbon synapse: physical interactionof Bassoon and RIBEYE is essential for the assembly of the ribbon com-plex. J Cell Biol 168:825– 836. CrossRef Medline
Toomre D, Steyer JA, Keller P, Almers W, Simons K (2000) Fusion of con-stitutive membrane traffic with the cell surface observed by evanescentwave microscopy. J Cell Biol 149:33– 40. CrossRef Medline
Townes-Anderson E, MacLeish PR, Raviola E (1985) Rod cells dissociatedfrom mature salamander retina: ultrastructure and uptake of horseradishperoxidase. J Cell Biol 100:175–188. CrossRef Medline
Tsuboi T, Zhao C, Terakawa S, Rutter GA (2000) Simultaneous evanescentwave imaging of insulin vesicle membrane and cargo during a singleexocytotic event. Curr Biol 10:1307–1310. CrossRef Medline
Ungar F, Piscopo I, Holtzman E (1981) Calcium accumulation in intracel-lular compartments of frog retinal rod photoreceptors. Brain Res 205:200 –206. CrossRef Medline
Van Hook MJ, Thoreson WB (2013) Simultaneous whole cell recordingsfrom photoreceptors and second-order neurons in an amphibian retinalslice preparation. J Vis Exp e50007.
Wu Y, Yeh FL, Mao F, Chapman ER (2009) Biophysical characterization ofstyryl dye-membrane interactions. Biophys J 97:101–109. CrossRefMedline
Wu Y, Ma L, Cheley S, Bayley H, Cui Q, Chapman ER (2011) Permeation ofstyryl dyes through nanometer-scale pores in membranes. Biochemistry50:7493–7502. CrossRef Medline
Yamamoto T (1963) On the thickness of the unit membrane. J Cell Biol17:413– 421. CrossRef Medline
Zampighi GA, Schietroma C, Zampighi LM, Woodruff M, Wright EM, Bre-cha NC (2011) Conical tomography of a ribbon synapse: structural evi-dence for vesicle fusion. PLoS One 6:e16944. CrossRef Medline
Zenisek D (2008) Vesicle association and exocytosis at ribbon and extrarib-bon sites in retinal bipolar cell presynaptic terminals. Proc Natl Acad SciU S A 105:4922– 4927. CrossRef Medline
Zenisek D, Steyer JA, Almers W (2000) Transport, capture and exocytosis ofsingle synaptic vesicles at active zones. Nature 406:849 – 854. CrossRefMedline
Zenisek D, Steyer JA, Feldman ME, Almers W (2002) A membrane markerleaves synaptic vesicles in milliseconds after exocytosis in retinal bipolarcells. Neuron 35:1085–1097. CrossRef Medline
Zenisek D, Horst NK, Merrifield C, Sterling P, Matthews G (2004) Visual-izing synaptic ribbons in the living cell. J Neurosci 24:9752–9759.CrossRef Medline
2086 • J. Neurosci., January 30, 2013 • 33(5):2071–2086 Chen et al. • Rod Synaptic Vesicle Release Imaged by TIRFM