ce6404 surveying ii l t p c 3 0 0 3 objectives: unit i ... · accessories –corrections...
TRANSCRIPT
CE6404 SURVEYING II L T P C3 0 0 3
OBJECTIVES: This subject deals with geodetic measurements and Control Survey methodology and
its adjustments. The student is also exposed to the Modern Surveying.
UNIT I CONTROL SURVEYING 9Horizontal and vertical control – Methods – specifications – triangulation- baseline – instruments andaccessories – corrections – satellite stations – reduction to centre- trigonometrical levelling – singleand reciprocal observations – traversing – Gale‟s table.
UNIT II SURVEY ADJUSTMENT 9Errors Sources- precautions and corrections – classification of errors – true and most probableValues- weighed observations – method of equal shifts –principle of least squares -0 normalEquation – correlates- level nets- adjustment of simple triangulation networks.
UNIT III TOTAL STATION SURVEYING 9Basic Principle – Classifications -Electro-optical system: Measuring principle, WorkingPrinciple, Sources of Error, Infrared and Laser Total Station instruments, Microwave system:Measuring principle, working principle, Sources of Error, Microwave Total Station instruments.Comparis on between Electro-optical and Microwave system. Care and maintenance of TotalStation instruments. Modern positioning systems – Traversing and Trilateration.
UNIT IV GPS SURVEYING 9Basic Concepts - Different segments - space, control and user segments - satellite configuration -signal structure - Orbit determination and representation - Anti Spoofing and Selective Availability- Task of control segment – Hand Held and Geodetic receivers –data processing - Traversing andTriangulation.UNIT V ADVANCED TOPICS IN SURVEYING 9Route Surveying - Reconnaissance - Route surveys for highways, railways and waterways -Simple curves – Compound and reverse curves - Setting out Methods – Transition curves –Functions and requirements - Setting out by offsets and angles - Vertical curves - Sight distances-hydrographic surveying – Tides - MSL - Sounding methods - Three-point problem - Strength of fix- Sextants and station pointer- Astronomical Surveying – field observations and determination ofAzimuth by altitude and hour angle methods – fundamentals of Photogrammetry andRemote Sensing TOTAL: 45 PERIODS
OUTCOMES:
On completion of this course students shall be able to understand the advantages of electronicsurveying over conventional surveying methods Understand the working principle of GPS, its components, signal structure, and error
sources Understand various GPS surveying methods and processing techniques used in GPS observationsTEXT BOOKS:
1. James M. Anderson and Edward M. Mikhail, "Surveying, Theory and Practice",7th Edition, McGraw Hill, 2001.
2. Bannister and S. Raymond, "Surveying", 7th Edition, Longman 2004.3. Laurila, S.H. "Electronic Surveying in Practice", John Wiley and Sons Inc, 1993
REFERENCES:
1. Alfred Leick, "GPS satellite surveying", John Wiley & Sons Inc., 3rd Edition, 2004.2. Guocheng Xu, " GPS Theory, Algorithmsand Applications", Springer - Berlin, 2003.3. Satheesh Gopi, rasathishkumar, N. madhu,“Advanced Surveying, Total Station GPS and
Remote Sensing" Pearson education , 2007

TABLE OF CONTENTS
S.NO TOPICS PAGENO
1 CHAPTER 1(CONTROL SURVEYING)1.1 HORIZONTAL CONTROLS & ITS METHODS 11.2 VERTICAL CONTROL & ITS METHODS 11.3 CLASSIFICATION OF TRIANGULATION SYSTEM 5
1.3.1 FIRST ORDER OR PRIMARY TRIANGULATION 51.3.2 SECONDARY ORDER OR SECONDARY TRIANGULATION 61.3.3 THIRD ORDER OR TERTIARY TRIANGULATION 7
2 CHAPTER 2
SURVEY ADJUSTMENTS2.1 TYPES OF ERROR 92.2 THE LAW OF ACCIDENTAL ERRORS 102.3 PRINCIPLES OF LEAST SQUARES 102.4 LAW OF WEIGHTS 102.5 DISTRIBUTION OF ERROR OF THE FIELD MEASUREMENT 123 CHAPTER 3
TOTAL STATION
3.1BASIC PRINCIPLE 13
3.2 CLASSIFICATION OF TOTAL STATIONS 14
3.2.1 LASER DISTANCE MEASUREMENT 163.2.2 ELECTRO- OPTICAL SYSTEM3.3 FEATURES OF TOTAL STATIONS 22
3.5 SOFTWARE APPLICATIONS 27
3.6 SOURCES OF ERROR FOR TOTAL STATIONS 31
CHAPTER 4GPS SURVEYING
4.1 INTRODUCTION 40
4.2 SEGMENTS OF GPS 40
4.3 SPACE SEGMENT 41
4.4 OBSERVATION PRINCIPLE AND SIGNALSTRUCTURE
43

4.5 STRUCTURE OF THE GPS NAVIGATION DATA 45
4.6 CONTROL SEGMENT 46
4.7 GROUND CONTROL SEGMENT 48
4.8 USER SEGMENT 484.9 BASIC CONCEPT OF GPS RECEIVER AND ITS
COMPONENTS48
4.10 CLASSIFICATION OF GPS RECEIVERS 52
4.11 ACCURACY 60
4.12 DIFFERENTIAL THEORY 61
4.13 DIFFERENTIAL GPS 62
CHAPTER 5
ADVANCED TOPICS IN SURVEYING
5.1 INTRODUCTION 63
5.2 PHOTOGRAMMETRIC SURVEYING 635.3 PRINCIPLES BEHIND TERRESTRIAL PHOTOGRAMMETRY 645.4 MEAN SEA LEVEL? EXPLAIN WHY IT IS USED AS
DATUM.83
5.5 5.5 ASTRONOMICAL SURVEYING 83
5.5.1 CO-ALTITUDE OR ZENITH DISTANCE (Z) AND AZIMUTH (A). 84
CE6404 SURVEYING II
SCE 1 Department of Civil Engineering
CHAPTER 1CONTROL SURVEYING
1.1 HORIZONTAL CONTROLS & ITS METHODSThe horizontal control consists of reference marks of known plan position, from
which salient points of designed structures may be set out. For large structures primary andsecondary control points are used. The primary control points are triangulation stations. Thesecondary control points are reference to the primary control stations.Reference Grid
Reference grids are used for accurate setting out of works of large magnitude. Thefollowing types of reference grids are used:
1. Survey Grid
2. Site Grid
3. tructural Grid
4. Secondary Grid
Survey grid is one which is drawn on a survey plan, from the original traverse.Original traverse stations form the control points of the grid. The site grid used by thedesigner is the one with the help of which actual setting out is done. As far aspossible the site grid should be actually the survey grid. All the design points are related interms of site grid coordinates. The structural grid is used when the structural components ofthe building are large in numbers and are so positioned that these components cannot be setout from the site grid with sufficient accuracy. The structural grid is set out from the sitegrid points. The secondary grid is established inside the structure, to establish internaldetails of the building, which are otherwise not visible directly from the structural grid.
1.2 VERTICAL CONTROL & ITS METHODS:
The vertical control consists of establishment of reference marks of known heightrelative to some special datum. All levels at the site are normally reduced to the nearbybench mark, usually known as master bench mark.
The setting of points in the vertical direction is usually done with the help offollowing rods:
1. Boning rods and travelers
2. Sight Rails
3. Slope rails or batter boards
4. Profile boards

CE6404 SURVEYING II
SCE 2 Department of Civil Engineering
A boning rod consist of an upright pole having a horizontal board at its top, forming a
‘T ‘shaped rod. Boning rods are made in set of three, and many consist of three ‘T’ shapedrods, each of equal size and shape, or two rods identical to each other and a third oneconsisting of longer rod with a detachable or movable ‘T’ piece. The third one is calledtraveling rod or traveler.Sight Rails:
A sight rail consist of horizontal cross piece nailed to a single upright or pair ofuprights driven into the ground. The upper edge of the cross piece is set to aconvenient height above the required plane of the structure, and should be above the groundto enable a man to conveniently align his eyes with the upper edge. A stepped sightrail or double sight rail is used in highly undulating or falling ground. Slope rails or Batterboards:hese are used for controlling the side slopes in embankment and in cuttings. These consist oftwo vertical poles with a sloping board nailed near their top. The slope rails define a planeparallel to the proposed slope of the embankment, but at suitable vertical distance above it.Travelers are used to control the slope during filling operation.
Profile boards:
These are similar to sight rails, but are used to define the corners, or sides of a building. Aprofile board is erected near each corner peg. Each unit of profile board consists of twoverticals, one horizontal board and two cross boards. Nails or saw cuts are placed at thetop of the profile boards to define the width of foundation and the line of the outside of thewallAn instrument was set up at P and the angle of elevation to a vane 4 m above the foot of the
staff held at Q was 9° 30′. The horizontal distance between P and Q was known to be 2000metres. Determine the R.L. of the staff station Q given that the R.L. of the instrument axiswas 2650.38.
Solution:
Height of vane above the instrument axis
= D tan α = 2000 tan 9° 30′
= 334.68 m
Correction for curvature and refraction
C = 0.06735 D² m, when D is in km
= 0.2694 ≈ 0.27 m (+ ve)

CE6404 SURVEYING II
SCE 3 Department of Civil Engineering
Height of vane above the instrument axis
= 334.68 + 0.27 = 334.95
R.L. fo vane = 334.95 + 2650.38 = 2985.33 m
R.L. of Q = 2985.33 – 4 = 2981.33 m
An instrument was set up at P and the angle of depression to a vane 2 m above thefoot of the staff held at Q was 5° 36′. The horizontal distance between P and Q wasknown to be 3000 metres. Determine the R.L. of the staff station Q given that staff reading ona B.M. of elevation 436.050 was 2.865 metres.
Solution:
The difference in elevation between the vane and the instrument axis
= D tan α
= 3000 tan 5° 36′ = 294.153
Combined correction due to cuvature and refraction
C = 0.06735 D² metres , when D is in km
= 0.606 m.
Since the observed angle is negative, the combined correction due tocurvature and refraction is subtractive.
Difference in elevation between the vane and the instrument axis
= 294.153 – 0.606 = 293.547 = h.R.L. of instrument axis = 436.050 + 2.865 = 438.915 R.L. of the vane = R.L. of instrument aixs – h
= 438.915 – 293.547 = 145.368
R.L. of Q = 145.368 – 2
= 143.368 m.
In order to ascertain the elevation of the top (Q) of the signal on a hill, observations weremade from two instrument stations P and R at a horizontal distance 100 metres apart, the

CE6404 SURVEYING II
SCE 4 Department of Civil Engineering
station P and R being in the line with Q. The angles of elevation of Q at P and R were 28°42′ and 18° 6′ respectively. The staff reading upon the bench mark of elevation 287.28 wererespectively 2.870 and 3.750 when the instrument was at P and at R, the telescope beinghorizontal. Determine the elevation of the foot of the signal if the height of the signal aboveits base is 3 metres.
Solution:
Elevation of instrument axis at P = R.L. of B.M. + Staff reading
= 287.28 + 2.870 = 290.15 m
Elevation of instrument axis at R = R.L. of B.M. + staff reading
= 287.28 + 3.750 = 291.03 m
Difference in level of the instrument axes at the two stations
S =291.03 – 290.15 = 0.88 m.
α -- = 28° 42 and α ---- = 18° 6′
s cot α--- = 0.88 cot 18° 6′ = 2.69 m
= 152.1 m.
h-- = D tan α-- = 152.1 tan 28° 42′ = 83.272 m
R.L. of foot of signal = R.L. of inst. aixs at P + h-- - ht. of signal
= 290.15 + 83.272 – 3 = 370.422 m.Check : (b + D) = 100 + 152.1 m = 252.1 m
h-- = (b + D) tan α-- = 252.1 x tan 18° 6′
= 82.399 m
R.L. of foot of signal = R.L. of inst. axis at R + h--+ ht. of signal
= 291.03 + 82.399 – 3 = 370.429 m.

CE6404 SURVEYING II
SCE 5 Department of Civil Engineering
1.3 CLASSIFICATION OF TRIANGULATION SYSTEM:
The basis of the classification of triangulation figures is the accuracy with whichthe length and azimuth of a line of the triangulation are determined. Triangulation systems ofdifferent accuracies depend on the extent and the purpose of the survey. The accepted gradesof triangulation are:
1. First order or Primary Triangulation
2. Second order or Secondary Triangulation
3. Third order or Tertiary Triangulation
1.3.1 FIRST ORDER OR PRIMARY TRIANGULATION:
The first order triangulation is of the highest order and is employed either to determinethe earth’s figure or to furnish the most precise control points to which secondarytriangulation may be connected. The primary triangulation system embraces the vast area(usually the whole of the country). Every precaution is taken in making linear and angularmeasurements and in performing the reductions. The following are the generalspecifications of the primary triangulation:
1. Average triangle closure : Less than 1 second
2. Maximum triangle closure : Not more than 3 seconds
3. Length of base line : 5 to 15 kilometers
4. Length of the sides of triangles : 30 to 150 kilometers
5. Actual error of base : 1 in 300,000
6. Probable error of base : 1 in 1,000,000
7. Discrepancy between two
measures of a section : 10 mm kilometers
8. Probable error or computed distance : 1 in 60,000 to 1 in 250,000
9. Probable error in astronomic azimuth : 0.5 seconds
1.3.2 SECONDARY ORDER OR SECONDARY TRIANGULATION
The secondary triangulation consists of a number of points fixed within the frameworkof primary triangulation. The stations are fixed at close intervals so that the sizes of the

CE6404 SURVEYING II
SCE 6 Department of Civil Engineering
triangles formed are smaller than the primary triangulation. The instruments and methodsused are not of the same utmost refinement. The general specifications of the secondarytriangulation are:
1. Average triangle closure : 3 sec
2. Maximum triangle closure : 8 sec
3. Length of base line : 1.5 to 5 km
4. Length of sides of triangles : 8 to 65 km
5. Actual error of base : 1 in 150,000
6. Probable error of base : 1 in 500,000
7. Discrepancy between two
measures of a section : 20 mm kilometers
8. Probable error or computed distance : 1 in 20,000 to 1 in 50,000
9. Probable error in astronomic azimuth : 2.0 sec

CE6404 SURVEYING II
SCE 7 Department of Civil Engineering
1.3.3 THIRD ORDER OR TERTIARY TRIANGULATION:
The third-order triangulation consists of a number of points fixed within theframework of secondary triangulation, and forms the immediate control for detailedengineering and other surveys. The sizes of the triangles are small and instrument withmoderate precision may be used. The specifications for a third-order triangulation are asfollows:1. Average triangle closure : 6 sec
2. Maximum triangle closure : 12 sec
3. Length of base line : 0.5 to 3 km
4. Length of sides of triangles : 1.5 to 10 km
5. Actual error of base : 1 in 75, 0000
6. Probable error of base : 1 in 250,000
7. Discrepancy between two
Measures of a section : 25 mm kilometers
8. Probable error or computed distance : 1 in 5,000 to 1 in 20,000
9. Probable error in astronomic Azimuth: 5 sec.
Explain the factors to be considered while selecting base line.
The measurement of base line forms the most important part of the triangulationoperations. The base line is laid down with great accuracy of measurement and alignment asit forms the basis for the computations of triangulation system. The length of the base linedepends upon the grades of the triangulation. Apart from main base line, several othercheck bases are also measured at some suitable intervals. In India, ten bases were used,the lengths of the nine bases vary from 6.4 to 7.8 miles and that of the tenth base is 1.7 miles.
Selection of Site for Base Line. Since the accuracy in the measurement of the base linedepends upon the site conditions, the following points should be taken into considerationwhile selecting the site:
1. The site should be fairly level. If, however, the ground is sloping, the slope shouldbe uniform and gentle. Undulating ground should, if possible be avoided.
2. The site should be free from obstructions throughout the whole of thelength. The line clearing should be cheap in both labour and compensation.
CE6404 SURVEYING II
SCE 8 Department of Civil Engineering
3. The extremities of the base should be intervisible at ground level.
4. The ground should be reasonably firm and smooth. Water gaps should be few, andif possible not wider than the length of the long wire or tape.
5. The site should suit extension to primary triangulation. This is an important factorsince the error in extension is likely to exceed the error in measurement.
In a flat and open country, there is ample choice in the selection of the site and thebase may be so selected that it suits the triangulation stations. In rough country, however, thechoice is limited and it may sometimes be necessary to select some of the triangulationstations that at suitable for the base line site.
Standards of Length. The ultimate standard to which all modern national standards arereferred is the international meter established by the Bureau International der Poids atMeasures and kept at the Pavilion de Breteuil, Sevres, with copies allotted to various nationalsurveys. The meter is marked on three platinum- iridium bars kept under standard conditions.One great disadvantage of the standard of length that are made of metal are that they aresubject to very small secular change in their dimensions. Accordingly, the meter has nowbeen standardized in terms of wavelength of cadmium light.
CE6404 SURVEYING II
SCE 9 Department of Civil Engineering
CHAPTER 2
SURVEY ADJUSTMENTS
2.1 TYPES OF ERROR
Errors of measurement are of three kinds: (i) mistakes, (ii) systematic errors, and (iii)accidental errors.
(i) Mistakes. Mistakes are errors that arise from inattention, inexperience, carelessnessand poor judgment or confusion in the mind of the observer. If mistake is undetected, itproduces a serious effect on the final result. Hence every value to be recorded in the fieldmust be checked by some independent field observation.
(ii) Systematic Error. A systematic error is an error that under the same conditions willalways be of the same size and sign. A systematic error always follows some definitemathematical or physical law, and a correction can be determined and applied. Such errorsare of constant character and are regarded as positive or negative according as they makethe result too great or too small. Their effect is therefore, cumulative.
If undetected, systematic errors are very serious. Therefore:
(1) All the surveying equipments must be designed and used so that whenever possiblesystematic errors will be automatically eliminated and (2) all systematic errors thatcannot be surely eliminated by this means must be evaluated and their relationship to theconditions that cause them must be determined. For example, in ordinary levelling, thelevelling instrument must first be adjusted so that the line of sight is as nearly horizontal aspossible when bubble is centered. Also the horizontal lengths for back sight and foresightfrom each instrument position should be kept as nearly equal as possible. In precise levelling,every day, the actual error of the instrument must be determined by careful peg test, thelength of each sight is measured by stadia and a correction to the result is applied.
(iii) Accidental Error. Accidental errors are those which remain after mistakes andsystematic errors have been eliminated and are caused by a combination of reasons beyondthe ability of the observer to control. They tend sometimes in one direction and some timesin the other, i.e., they are equally likely to make the apparent result too large or too small.
An accidental error of a single determination is the difference between (1) the truevalue of the quantity and (2) a determination that is free from mistakes and systematic errors.Accidental error represents limit of precision in the determination of a value. They obey thelaws of chance and therefore, must be handled according to the mathematical laws ofprobability.
The theory of errors that is discussed in this chapter deals only with the accidentalerrors after all the known errors are eliminated and accounted for.

CE6404 SURVEYING II
SCE 10 Department of Civil Engineering
2.2 THE LAW OF ACCIDENTAL ERRORS
Investigations of observations of various types show that accidental errors follow adefinite law, the law of probability. This law defines the occurrence of errors and can beexpressed in the form of equation which is used to compute the probable value or the probableprecision of a quantity. The most important features of accidental errors which usually occurare:
(i) Small errors tend to be more frequent than the large ones; that is they are themost probable.
(ii) Positive and negative errors of the same size happen with equalfrequency ; that is, they are equally probable.
(iii) Large errors occur infrequently and are impossible.
2.3 PRINCIPLES OF LEAST SQUARES
It is found from the probability equation that the most probable values of a series oferrors arising from observations of equal weight are those for which the sum of the squares isa minimum. The fundamental law of least squares is derived from this. According to theprinciple of least squares, the most probable value of an observed quantity available from agiven set of observations is the one for which the sum of the squares of the residual errors is aminimum. When a quantity is being deduced from a series of observations, the residualerrors will be the difference between the adopted value and the several observed values,
Let V1, V2, V3 etc. be the observed values x =most probable value
2.4 LAW OF WEIGHTS
From the method of least squares the following laws of weights areestablished:
(i) The weight of the arithmetic mean of the measurements of unit weight is equalto the number of observations.
For example, let an angle A be measured six times, the following being the values:A Weight A Weight
30° 20′ 8” 1 30° 20′ 10” 1
30° 20′ 10” 1 30° 20′ 9” 1
30° 20′ 7” 1 30° 20′ 10” 1
Arithmetic mean
= 30° 20′ + 1/6 (8” + 10” + 7” + 10” + 9” + 10”)
CE6404 SURVEYING II
SCE 11 Department of Civil Engineering
= 30° 20′ 9”.
Weight of arithmetic mean = number of observations = 6.
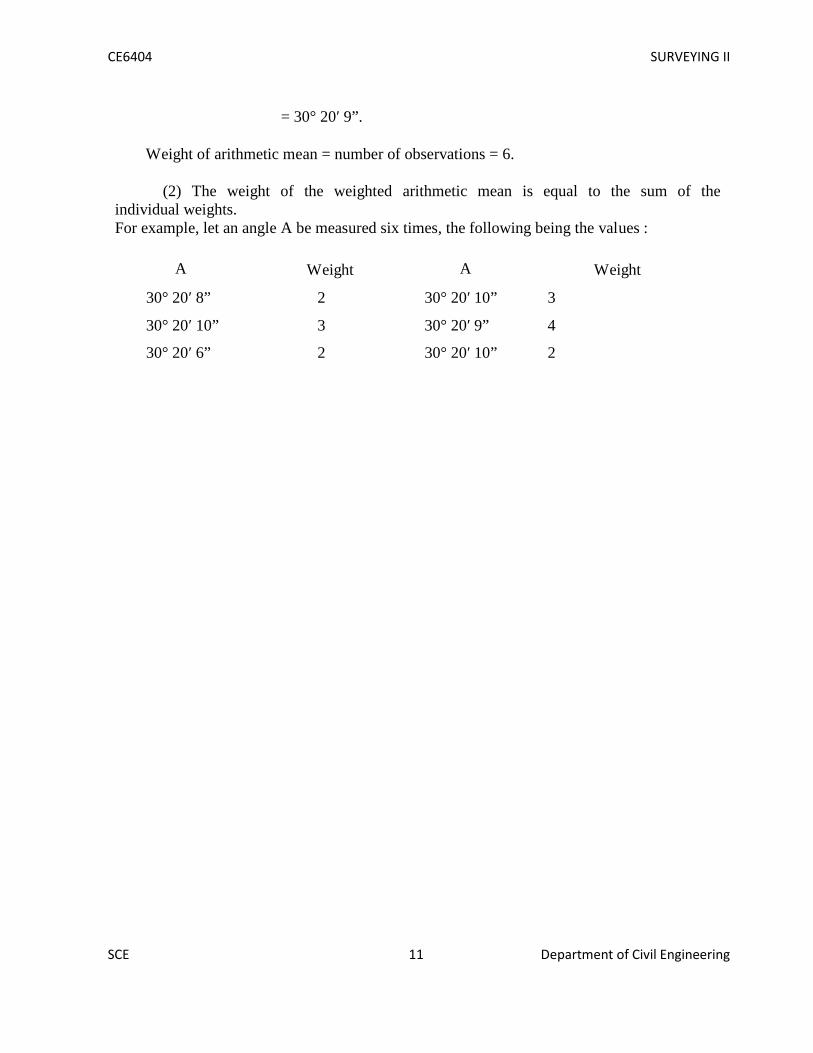
(2) The weight of the weighted arithmetic mean is equal to the sum of theindividual weights.For example, let an angle A be measured six times, the following being the values :
A Weight A Weight
30° 20′ 8” 2 30° 20′ 10” 3
30° 20′ 10” 3 30° 20′ 9” 4
30° 20′ 6” 2 30° 20′ 10” 2

CE6404 SURVEYING II
SCE 12 Department of Civil Engineering
Sum of weights = 2 + 3 + 2 + 3 + 4 + 2 =16
Arithmetic mean = 30° 20′ + 1/16 (8”X2 + 10” X3+ 7”X2 + 10”X3 + 9” X4+ 10”X2)
= 30° 20′ 9”.
Weight of arithmetic mean = 16.
(3) The weight of algebric sum of two or more quantities is equal to thereciprocals of the individual weights.
For Example angle A = 30° 20′ 8”, Weight 2
B = 15° 20′ 8”, Weight 3
Weight of A + B =
(4) If a quantity of given weight is multiplied by a factor, the weight of theresult is obtained by dividing its given weight by the square of the factor.
(5) If a quantity of given weight is divided by a factor, the weight of the result isobtained by multiplying its given weight by the square of the factor.
(6) If a equation is multiplied by its own weight, the weight of the resulting equationis equal to the reciprocal of the weight of the equation.
(7) The weight of the equation remains unchanged, if all the signs of the equation arechanged or if the equation is added or subtracted from a constant.
2.5 DISTRIBUTION OF ERROR OF THE FIELD MEASUREMENT.
Whenever observations are made in the field, it is always necessary to check for theclosing error, if any. The closing error should be distributed to the observed quantities. Forexamples, the sum of the angles measured at a central angle should be 360°, the error shouldbe distributed to the observed angles after giving proper weight age to the observations. Thefollowing rules should be applied for the distribution of errors:
(1) The correction to be applied to an observation is inversely proportional to theweight of the observation.

CE6404 SURVEYING II
SCE 13 Department of Civil Engineering
(2) The correction to be applied to an observation is directly proportional to the squareof the probable error.
(3) In case of line of levels, the correction to be applied is proportional to thelength.The following are the three angles α, β and y observed at a station P closingthe horizon, along with their probable errors of measurement. Determine their correctedvalues.
Solution.α = 78° 12′ 12” ± 2”
β = 136° 48′ 30” ± 4”
y = 144° 59′ 08” ± 5”
Sum of the three angles = 359° 59′ 50”
Discrepancy = 10”
Hence each angle is to be increased, and the error of 10” is to be distributed in
proportion to the square of the probable error.
Let c1, c2 and c3 be the correction to be applied to the angles α, β and y
respectively.
c1 : c2 : c3 = (2)² : (4)² : (5)² = 4 : 16 : 25 … (1)Also, c1 + c2 + c3 = 10” … (2)From (1), c2 = 16 /4 c1 = 4c1And c3 = 25/4 c1
Substituting these values of c2 and c3 in (2), we get c1 +4c1 + 25/4 c1 = 10”
or c1 ( 1 + 4 + 25/4 ) = 10”
c1 = 10 x 4/45 = 0”.89
c2 = 4c1 = 3”.36
And c3 = 25 /4 c1 = 5”.55

CE6404 SURVEYING II
SCE 14 Department of Civil Engineering
Check: c1 + c2 + c3 = 0.”89 + 3”.56 + 5”.55 = 10”
Hence the corrected angles are
CE6404 SURVEYING II
SCE 15 Department of Civil Engineering
α = 78° 12′ 12” + 0”.89 = 78° 12′ 12”.89
β = 136° 48′ 30” + 3”.56 = 136° 48′ 33”.56
and y = 144° 59′ 08” + 5”.55 = 144° 59′ 13”.55
-------------------------Sum = 360° 00′ 00”+ 00
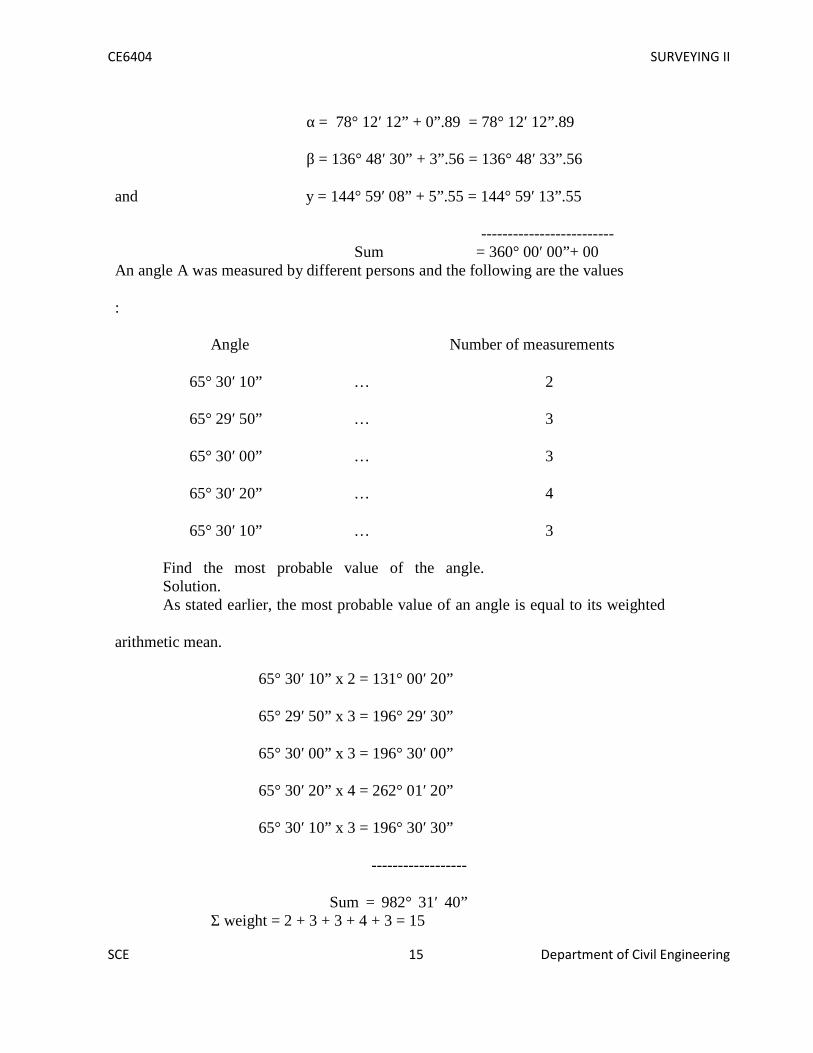
An angle A was measured by different persons and the following are the values
:
Angle Number of measurements
65° 30′ 10” … 2
65° 29′ 50” … 3
65° 30′ 00” … 3
65° 30′ 20” … 4
65° 30′ 10” … 3
Find the most probable value of the angle.Solution.As stated earlier, the most probable value of an angle is equal to its weighted
arithmetic mean.
65° 30′ 10” x 2 = 131° 00′ 20”
65° 29′ 50” x 3 = 196° 29′ 30”
65° 30′ 00” x 3 = 196° 30′ 00”
65° 30′ 20” x 4 = 262° 01′ 20”
65° 30′ 10” x 3 = 196° 30′ 30”
------------------
Sum = 982° 31′ 40”Σ weight = 2 + 3 + 3 + 4 + 3 = 15
CE6404 SURVEYING II
SCE 16 Department of Civil Engineering
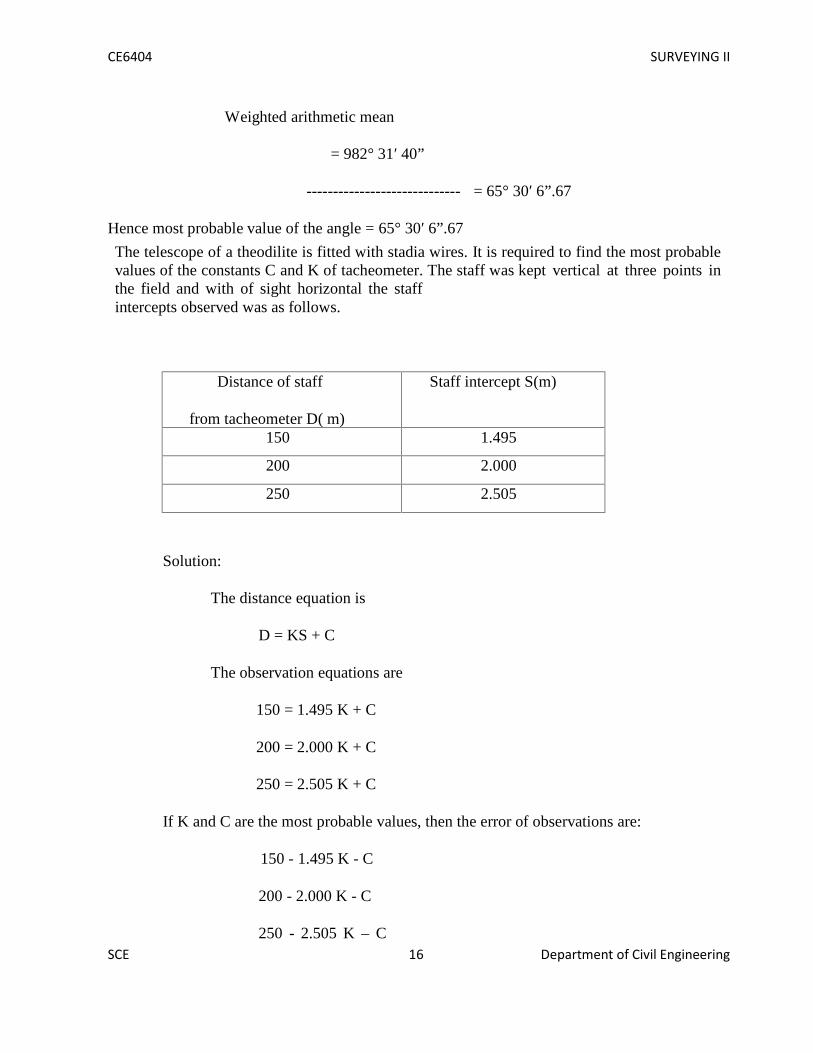
Weighted arithmetic mean
= 982° 31′ 40”
----------------------------- = 65° 30′ 6”.67
Hence most probable value of the angle = 65° 30′ 6”.67
The telescope of a theodilite is fitted with stadia wires. It is required to find the most probablevalues of the constants C and K of tacheometer. The staff was kept vertical at three points inthe field and with of sight horizontal the staffintercepts observed was as follows.
Distance of staff
from tacheometer D( m)
Staff intercept S(m)
150 1.495
200 2.000
250 2.505
Solution:
The distance equation is
D = KS + C
The observation equations are
150 = 1.495 K + C
200 = 2.000 K + C
250 = 2.505 K + C
If K and C are the most probable values, then the error of observations are:
150 - 1.495 K - C
200 - 2.000 K - C
250 - 2.505 K – C
CE6404 SURVEYING II
SCE 17 Department of Civil Engineering
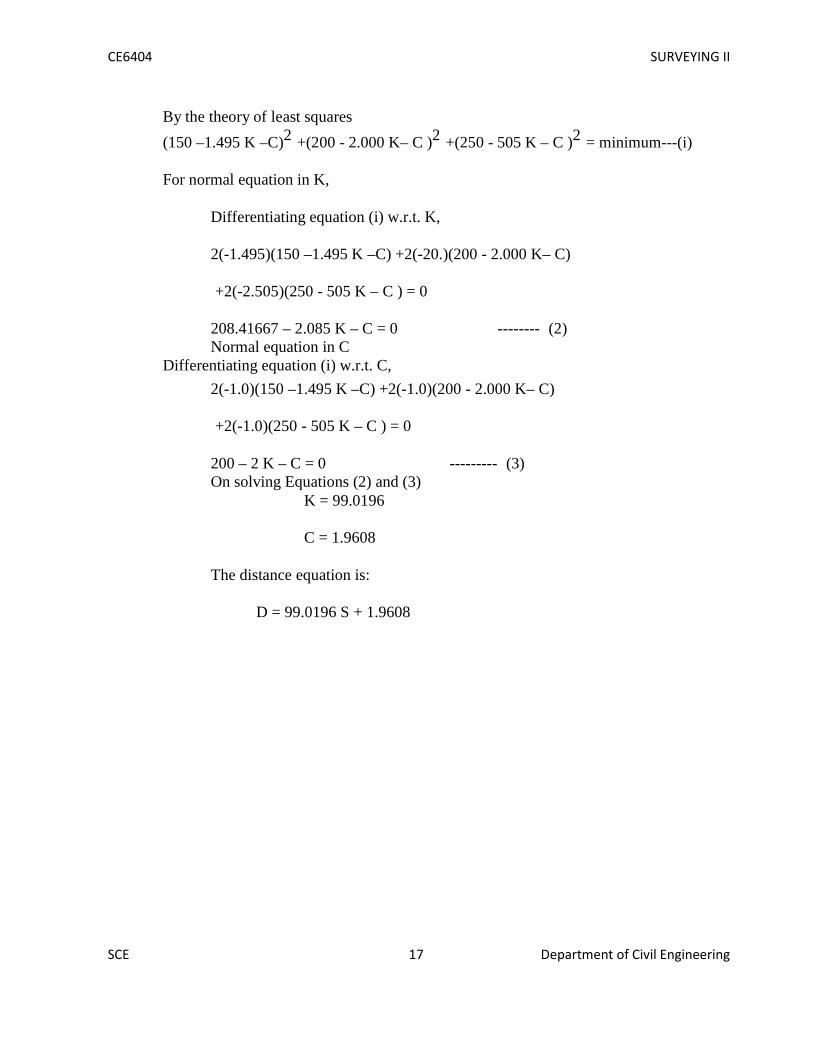
By the theory of least squares
(150 –1.495 K –C)2 +(200 - 2.000 K– C )2 +(250 - 505 K – C )2 = minimum---(i)
For normal equation in K,
Differentiating equation (i) w.r.t. K,
2(-1.495)(150 –1.495 K –C) +2(-20.)(200 - 2.000 K– C)
+2(-2.505)(250 - 505 K – C ) = 0
208.41667 – 2.085 K – C = 0 -------- (2)Normal equation in C
Differentiating equation (i) w.r.t. C,
2(-1.0)(150 –1.495 K –C) +2(-1.0)(200 - 2.000 K– C)
+2(-1.0)(250 - 505 K – C ) = 0
200 – 2 K – C = 0 --------- (3)On solving Equations (2) and (3)
K = 99.0196
C = 1.9608
The distance equation is:
D = 99.0196 S + 1.9608

CE6404 SURVEYING II
SCE 18 Department of Civil Engineering
CE6404 SURVEYING II
SCE 19 Department of Civil Engineering

CE6404 SURVEYING II
SCE 20 Department of Civil Engineering
CE6404 SURVEYING II
SCE 21 Department of Civil Engineering

CE6404 SURVEYING II
SCE 22 Department of Civil Engineering

CE6404 SURVEYING II
SCE 23 Department of Civil Engineering
CHAPTER 3
TOTAL STATION
3.1 BASIC PRINCIPLE
Although taping and theodolites are used regularly on site – total stations are also usedextensively in surveying, civil engineering and construction because they can measure bothdistances and angles.
A typical total station is shown in the figure below
Fig 3.1 Total Station
Because the instrument combines both angle and distance measurement in the same unit, it isknown as an integrated total station which can measure horizontal and vertical angles as wellas slope distances.

CE6404 SURVEYING II
SCE 24 Department of Civil Engineering
Using the vertical angle, the total station can calculate the horizontal and vertical distancecomponents of the measured slope distance.
As well as basic functions, total stations are able to perform a number of different survey tasksand associated calculations and can store large amounts of data.
As with the electronic theodolite, all the functions of a total station are controlled by itsmicroprocessor, which is accessed thought a keyboard and display.To use the total station, it is set over one end of the line to be measured and some reflector ispositioned at the other end such that the line of sight between the instrument and the reflectoris unobstructed (as seen in the figure below).
-The reflector is a prism attached to a detail pole
-The telescope is aligned and pointed at the prism
-The measuring sequence is initiated and a signal is sent to the reflector and a part of thissignal is returned to the total station
-This signal is then analysed to calculate the slope distance together with the horizontal andvertical angles.
-Total stations can also be used without reflectors and the telescope is pointed at the point thatneeds to be measured
-Some instruments have motorised drivers and can be use automatic target recognition tosearch and lock into a prism – this is a fully automated process and does not require anoperator.
-Some total stations can be controlled from the detail pole, enabling surveys to be conductedby one person

CE6404 SURVEYING II
SCE 25 Department of Civil Engineering
Fig 3.2 Measuring with a Total StationMost total stations have a distance measuring range of up to a few kilometres, when using aprism, and a range of at least 100m in reflector less mode and an accuracy of 2-3mm at shortranges, which will decrease to about 4-5mm at 1km.
Although angles and distances can be measured and used separately, the most commonapplications for total stations occur when these are combined to define position in controlsurveys.
As well as the total station, site surveying is increasingly being carried out using GPSequipment. Some predictions have been made that this trend will continue, and in the longrun GPS methods may replace other methods.
Although the use of GPS is increasing, total stations are one of the predominant instrumentsused on site for surveying and will be for some time.
Developments in both technologies will find a point where devices can be made thatcomplement both methods.
CE6404 SURVEYING II
SCE 26 Department of Civil Engineering
3.2 CLASSIFICATION OF TOTAL STATIONS
3.2.1 ELECTRO- OPTICAL SYSTEM
3.2.1.1 DISTANCE MEASUREMENT
When a distance is measured with a total station, am electromagnetic wave or pulse is used forthe measurement – this is propagated through the atmosphere from the instrument to reflectoror target and back during the measurement.
Distances are measured using two methods: the phase shift method, and the pulsed lasermethod.
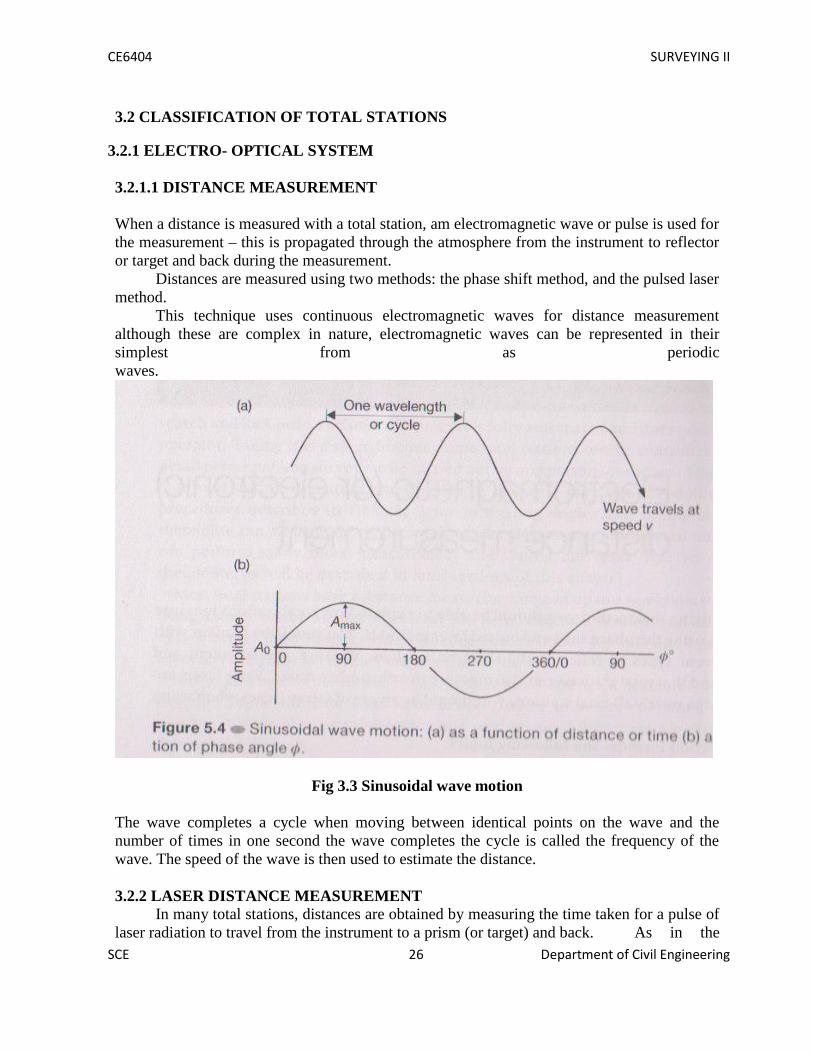
This technique uses continuous electromagnetic waves for distance measurementalthough these are complex in nature, electromagnetic waves can be represented in theirsimplest from as periodicwaves.
Fig 3.3 Sinusoidal wave motion
The wave completes a cycle when moving between identical points on the wave and thenumber of times in one second the wave completes the cycle is called the frequency of thewave. The speed of the wave is then used to estimate the distance.
3.2.2 LASER DISTANCE MEASUREMENTIn many total stations, distances are obtained by measuring the time taken for a pulse of
laser radiation to travel from the instrument to a prism (or target) and back. As in the

CE6404 SURVEYING II
SCE 27 Department of Civil Engineering
phase shift method, the pulses are derived an infrared or visible laser diode and they aretransmitted through the telescope towards the remote end of the distance being measured,where they are reflected and returned to the instrument.
Since the velocity v of the pulses can be accurately determined, the distance D can be obtainedusing 2D = vt, where t is the time taken for a single pulse to travel from instrument –target – instrument.
This is also known as the timed-pulse or time-of-flight measurement technique.
The transit time t is measured using electronic signal processing techniques. Although only asingle pulse is necessary to obtain a distance, the accuracy obtained would be poor. Toimprove this, a large number of pulses (typically20,000 every second) are analysed during each measurement to give a more accurate distance.
The pulse laser method is a much simpler approach to distance measurement than the phaseshift method, which was originally developed about 50 years ago.
SLOPE AND HORIZONTAL DISTANCES
Both the phase shift and pulsed laser methods will measure a slope distance L from the totalstation along the line of sight to a reflector or target. For most surveys the horizontaldistance D is required as well as the vertical component V of the slope distance.
Horizontal distance D = L cosα = L sin z
Vertical distance = V = L sinα = L cos z
Where α is the vertical angle and z is the is the zenith angle. As far as the user isconcerned, these calculations are seldom done because the total station willeither display D and V automatically or will dislplay L first and then D and V after pressingbuttons

CE6404 SURVEYING II
SCE 28 Department of Civil Engineering
Fig 3.4 Slope and Distance Measured
How accuracy of distance measurement is specified
All total stations have a linear accuracy quoted in the form
±(a mm + b ppm)
The constant a is independent of the length being measured and is made up of internalsources within the instrument that are normally beyond the control of the user. It is anestimate of the individual errors caused by such phenomena as unwanted phase shifts inelectronic components, errors in phase and transit time measurements.
The systematic error b is proportional to the distance being measured, where 1 ppm (partper million) is equivalent to an additional error of 1mm for every kilometre measured.
Typical specifications for a total station vary from ±(2mm + 2ppm) to ±(5mm + 5 pmm).
For example: ±(2mm + 2ppm), at 100m the error in distance measurement will be
±2mm but at 1.5km, the error will be ±(2mm + [2mm/km * 1.5km]) = ±5mm
Reflectors used in distance measurement
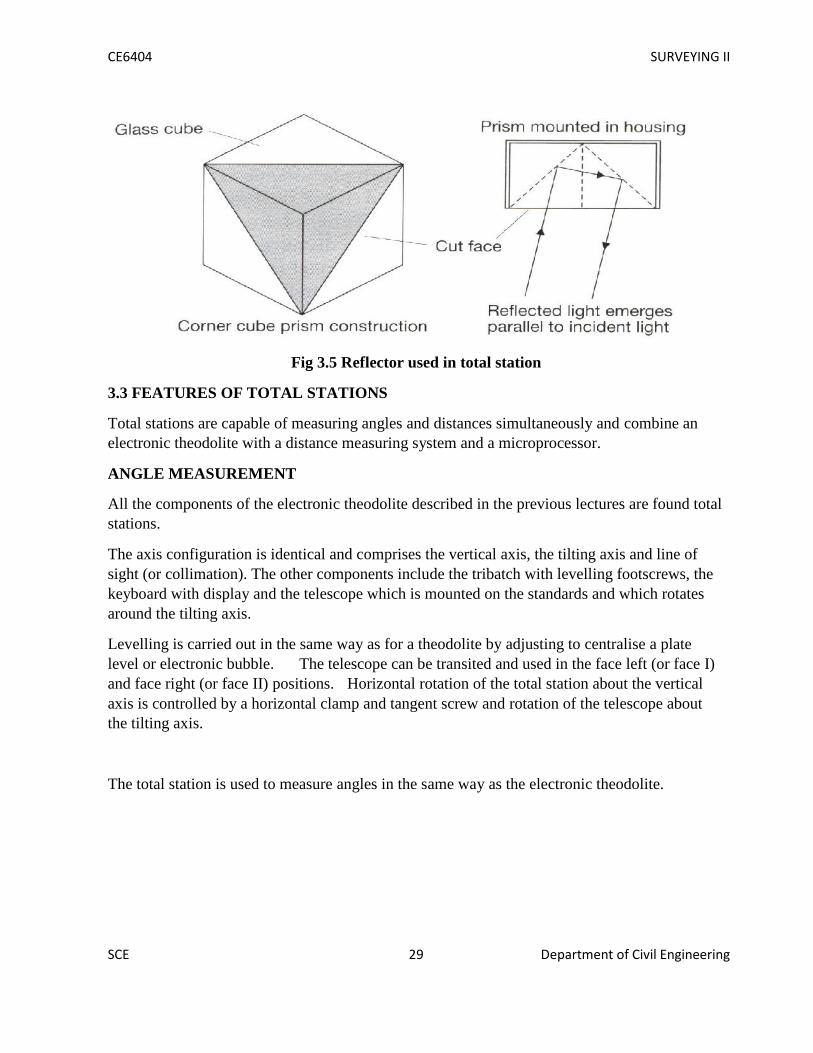
Since the waves or pulses transmitted by a total station are either visible or infrared, a planemirror could be used to reflect them. This would require a very accurate alignment of the mirror,because the transmitted wave or pulses have a narrow spread.
To get around this problem special mirror prisms are used as shown below.
CE6404 SURVEYING II
SCE 29 Department of Civil Engineering
Fig 3.5 Reflector used in total station
3.3 FEATURES OF TOTAL STATIONS
Total stations are capable of measuring angles and distances simultaneously and combine anelectronic theodolite with a distance measuring system and a microprocessor.
ANGLE MEASUREMENT
All the components of the electronic theodolite described in the previous lectures are found totalstations.
The axis configuration is identical and comprises the vertical axis, the tilting axis and line ofsight (or collimation). The other components include the tribatch with levelling footscrews, thekeyboard with display and the telescope which is mounted on the standards and which rotatesaround the tilting axis.
Levelling is carried out in the same way as for a theodolite by adjusting to centralise a platelevel or electronic bubble. The telescope can be transited and used in the face left (or face I)and face right (or face II) positions. Horizontal rotation of the total station about the verticalaxis is controlled by a horizontal clamp and tangent screw and rotation of the telescope aboutthe tilting axis.
The total station is used to measure angles in the same way as the electronic theodolite.
CE6404 SURVEYING II
SCE 30 Department of Civil Engineering
Distance measurement
All total stations will measure a slope distance which the onboard computer uses, together withthe zenith angle recorded by the line of sight to calculate the horizontal distance.
For distances taken to a prism or reflecting foil, the most accurate is precise measurement.For phase shift system, a typical specification for this is a measurement time of about 1-
2s, an accuracy of (2mm + 2ppm) and a range of
3-5km to a single prism.
Although all manufacturers quote ranges of several kilometres to a single prism.
For those construction projects where long distances are required to be measured, GPS methodsare used in preference to total stations. There is no standard difference at which the changefrom one to the other occurs, as this will depend on a number of factors, including the accuracyrequired and the site topography.
Rapid measurement reduces the measurement time to a prism to between 0.5 and 1’s for bothphase shift and pulsed systems, but the accuracy for both may degrade slightly.
Tracking measurements are taken extensively when setting out or for machine control, sincereadings are updated very quickly and vary in response to movements of the prism which isusually pole-mounted.In this mode, the distance measurement is repeated automatically atintervals of less than 0.5s.
For reflector less measurements taken with a phase shift system, the range that can be obtainedis about 100m, with a similar accuracy to that obtained when using a prism or foil.
3.4 KEYBOARD AND DISPLAY
A total station is activated through its control panel, which consists of a keyboard and multipleline LCD. A number of instruments have two control panels, one on each face, whichmakes them easier to use.
In addition to controlling the total station, the keyboard is often used to code data generated bythe instrument – this code will be used to identify the object being measured.
On some total stations it is possible to detach the keyboard and interchange them with othertotal stations and with GPS receivers.This is called integrated surveying

CE6404 SURVEYING II
SCE 31 Department of Civil Engineering
Fig 3.6 Key Board and Display
3.5 SOFTWARE APPLICATIONS
The microprocessor built into the total station is a small computer and its main function iscontrolling the measurement of angles and distances. The LCD screen guides the operator whiletaking these measurements.
The built in computer can be used for the operator to carry out calibration checks on theinstrument.
The software applications available on many total stations include the following:
Slope corrections and reduced levels
Horizontal circle orientation
Coordinate measurement
Traverse measurements
Resection (or free stationing)
Missing line measurement
Remote elevation measurement
areas
Setting out.
3.6 SOURCES OF ERROR FOR TOTAL STATIONS
3.6.1 CALIBRATION OF TOTAL STATIONS

CE6404 SURVEYING II
SCE 32 Department of Civil Engineering
To maintain the high level of accuracy offered by modern total stations, there is now much moreemphasis on monitoring instrumental errors, and with this in mind, some construction sitesrequire all instruments to be checked on a regular basis using procedures outlined in the qualitymanuals.
Some instrumental errors are eliminated by observing on two faces of the total station andaveraging, but because one face measurements are the preferred method on site, it is importantto determine the magnitude of instrumental errors and correct for them.
For total stations, instrumental errors are measured and corrected using electronic calibrationprocedures that are carried out at any time and can be applied to the instrument on site. Theseare preferred to the mechanical adjustments that used to be done in labs by technician.
Since calibration parameters can change because of mechanical shock, temperature changes andrough handling of what is a high-precision instrument, an electronic calibration should becarried our on a total station as follows:
Before using the instrument for the first time
After long storage periods
After rough or long transportation
After long periods of work
Following big changes in temperature
Regularly for precision surveys
Before each calibration, it is essential to allow the total station enough to reach the ambienttemperature.
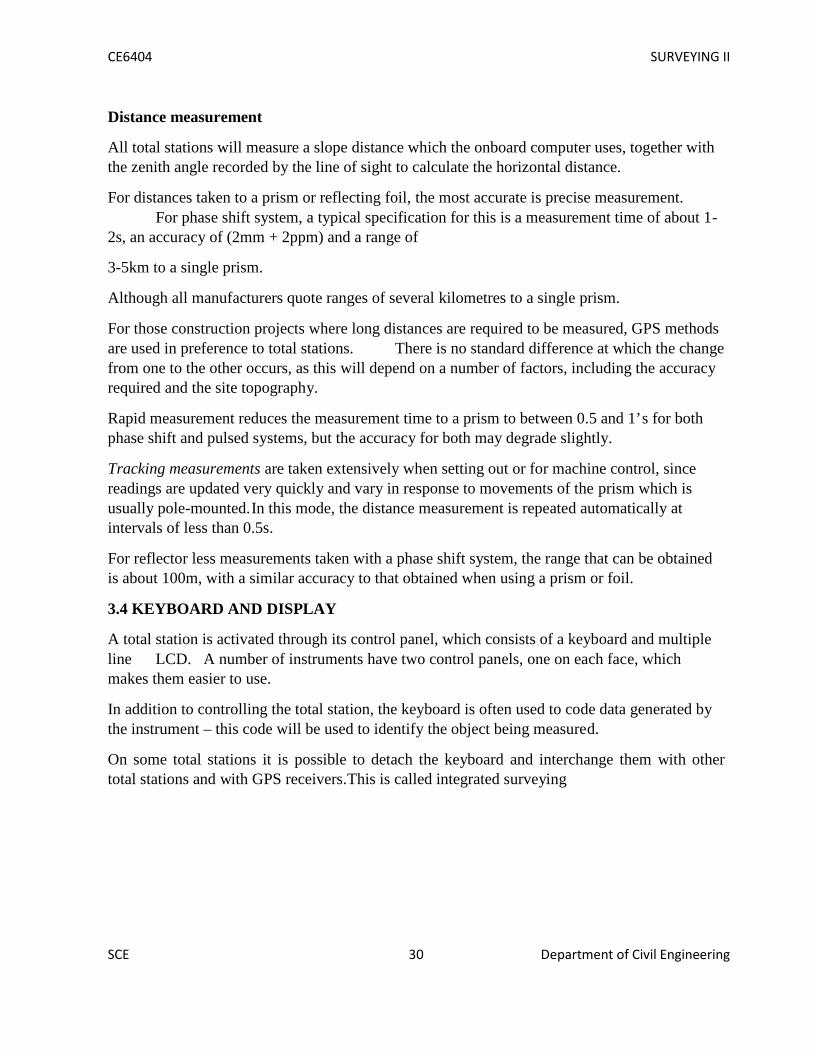
3.6.2 HORIZONTAL COLLIMATION (OR LINE OF SIGHT ERROR)
This axial error is caused when the line of sight is not perpendicular to the tilting axis. Itaffects all horizontal circle readings and increases with steep sightings, but this is eliminated byobserving on two faces. For single face measurements,
an on-board calibration function is used to determine c, the deviation between the actual line ofsight and a line perpendicular to the tilting axis. A correction is then applied automaticallyfor this to all horizontal circle readings.
CE6404 SURVEYING II
SCE 33 Department of Civil Engineering
Fig 3.7 Line of Sight error
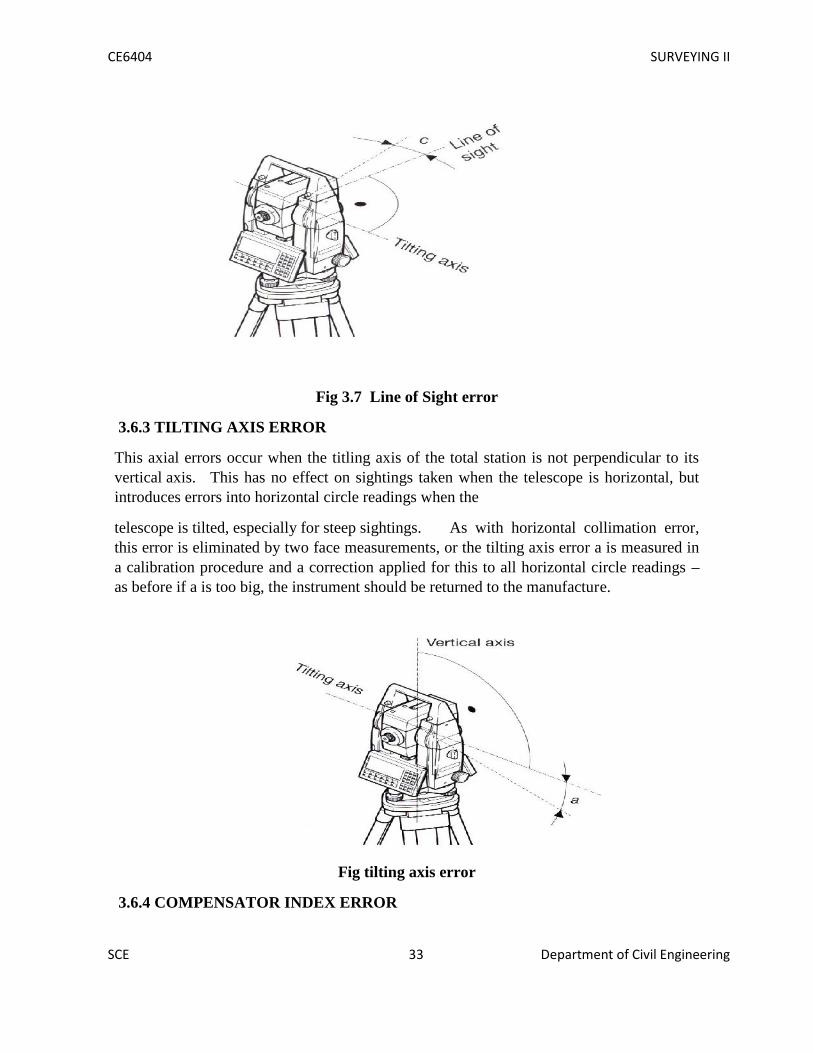
3.6.3 TILTING AXIS ERROR
This axial errors occur when the titling axis of the total station is not perpendicular to itsvertical axis. This has no effect on sightings taken when the telescope is horizontal, butintroduces errors into horizontal circle readings when the
telescope is tilted, especially for steep sightings. As with horizontal collimation error,this error is eliminated by two face measurements, or the tilting axis error a is measured ina calibration procedure and a correction applied for this to all horizontal circle readings –as before if a is too big, the instrument should be returned to the manufacture.
Fig tilting axis error
3.6.4 COMPENSATOR INDEX ERROR

SCE 35 Department of Civil Engineering
Errors caused by not levellinga theodolite or total station carefully cannot be eliminated bytaking face left and face right readings. If the total station is fitted with a compensator itwill measure residual tilts of the instrument and will apply corrections to the horizontal andvertical angles for these.
However all compensators will have a longitudinal error l and traverse error t known aszero point errors. These are averaged using face left and face right readings but for singleface readings must be determined by the calibration function of the total station.
Fig 3.8 Compensator Index Error
A vertical collimation error exists on a total station if the 0o to 180o line in thevertical circle does not coincide with its vertical axis. This zero point error is present in allvertical circle readings and like the horizontal collimation error, it is eliminated by takingFL and FR readings or by determining i
For all of the above total station errors (horizontal and vertical collimation, tiltingaxis and compensator) the total station is calibrated using an in built function. Here thefunction is activated and a measurement to a target is taken as shown below.

SCE 36 Department of Civil Engineering
Following the first measurement the total station and the telescope are each rotatedthrough 180o and the reading is repeated.
Any difference between the measured horizontal and vertical angles is thenquantified as an instrumental error and applied to all subsequent readings automatically.The total station is thus calibrated and the procedure is the same for all of the above errortype.
Fig 3.9 Compensator Index Error

SCE 37 Department of Civil Engineering
CHAPTER 4
GPS SURVEYING
4.1 INTRODUCTION
Traditional methods of surveying and navigation resort to tedious field andastronomical observation for deriving positional and directional information. Diversefield conditions, seasonal variation and many unavoidable circumstances always bias the traditionalfield approach. However, due to rapid advancement in electronic systems, every aspect of humanlife is affected to a great deal. Field of surveying and navigation is tremendously benefited throughelectronic devices. Many of the critical situations in surveying/navigation are now easily andprecisely solved in short time.
Astronomical observation of celestial bodies was one of the standard methods of obtainingcoordinates of a position. This method is prone to visibility and weather condition anddemands expert handling. Attempts have been made by USA since early 1960’s to use spacebased artificial satellites. System TRANSIT was widely used for establishing a network of controlpoints over large regions. Establishment of modern geocentric datum and its relation to localdatum was successfully achieved through TRANSI T. Rapid improvements in higherfrequently transmission and precise clock signals along with advanced stable satellite technologyhave been instrumental for the development of global positioning system.

SCE 38 Department of Civil Engineering
The NAVSTAR GPS (Navigation System with Time and Ranging Global Positioning System) isa satellite based radio navigation system providing precise three- dimensional position, courseand time information to suitably equipped user.
GPS has been under development in the USA since 1973. The US department ofDefence as a worldwide navigation and positioning resource for military as well as civilianuse for 24 hours and all weather conditions primarily developed it.
In its final configuration, NAVSTAR GPS consists of 21 satellites (plus 3 active spares) at analtitude of 20200 km above the earth’s surface (Fig. 1). These satellites are so arranged inorbits to have atleast four satellites visible above the horizon anywhere on the earth, at any timeof the day. GPS Satellites transmit at frequencies L1=1575.42 MHz and L2=1227.6 MHzmodulated with two types of code viz. P-code and C/A code and with navigation message. Mainlytwo types of observable are of interest to the user. In pseudo ranging the distance between thesatellite and the GPS receiver plus a small corrective
GPS Nominal Constellation24 Satellites in 6 Orbital Planes
4 Satellites in each Plane20,200 km Altitudes, 55 Degree Inclination
Fig 4.1 The Global Positioning System (GPS), 21-satellite configuration
term for receiver clock error is observed for positioning whereas in carrier phase techniques, thedifference between the phase of the carrier signal transmitted by the satellite and the phase of thereceiver oscillator at the epoch is observed to derive the precise information.
The GPS satellites act as reference points from which receivers on the ground detect theirposition. The fundamental navigation principle is based on the measurement of pseudorangesbetween the user and four satellites (Fig.

SCE 39 Department of Civil Engineering
2). Ground stations precisely monitor the orbit of every satellite and bymeasuring the travel time of the signals transmitted from the satellite four distances betweenreceiver and satellites will yield accurate position, direction and speed. Though three-rangemeasurements are sufficient, the fourth observation is essential for solving clocksynchronization error between receiver and satellite. Thus, the term “pseudoranges” is derived.The secret of GPS measurement is due to the ability of measuring carrier phases to about 1/100of a cycle equaling to 2 to 3 mm in linear distance. Moreover the high frequency L1 andL2 carrier signal can easily penetrate the ionosphere to reduce its effect. Dual frequency observationsare important for large station separation and for eliminating most of the error parameters.
R1
Figure 4.2: Basic principle of positioning with GPS
There has been significant progress in the design and miniaturization of stable clock. GPSsatellite orbits are stable because of the high altitudes and no atmosphere drag. However, theimpact of the sun and moon on GPS orbit though significant, can be computed completely andeffect of solar radiation pressure on the orbit and tropospheric delay of the signal

SCE 40 Department of Civil Engineering
have been now modeled to a great extent from past experience to obtain preciseinformation for various applications.
Comparison of main characteristics of TRANSIT and GPS re vealtechnological advancement in the field of space based positioning system(Table1).
Table 1. TRANSIT vs GPS
Details TRANSIT GPS
Orbit Altitude 1000 Km 20,200 Km
Orbital Period 105 Min 12 Hours
Frequencies 150 MHz400 MHz
1575 MHz1228 MHz
Navigation data 2D : X, Y 4D : X,Y,Z, t velocity
Availability 15-20 minute per pass Continuously
Accuracy ñ 30-40 meters(Depending on velocityerror)
ñ15m (Pcode/No. SA0.1 Knots
Repeatability — ñ1.3 meters relative
SatelliteConstellation
4-6 21-24
Geometry Variable Repeating
Satellite Clock Quartz Rubidium, Cesium
GPS has been designed to provide navigational accuracy of ±10 mto ±15 m. However, sub meter accuracy in differential mode has beenachieved and it has been proved that broad varieties of problems ingeodesy and geodynamics can be tackled through GPS.
Versatile use of GPS for a civilian need in following fields have beensuccessfully practiced viz. navigation on land, sea, air, space, high precision kinematicssurvey on the ground, cadastral surveying, geodetic control network densification, highprecision aircraft positioning, photogrammetry without ground control, monitoringdeformations, hydrographic surveys, active control survey and many other similar jobsrelated to navigation and positioning,. The outcome of a typical GPS survey includesgeocentric position accurate to 10 m and relative positions between receiver locations tocentimeter level or better.
4.2 SEGMENTS OF GPS
For better understanding of GPS, we normally consider three major segments viz.space segment, Control segment and User segment. Space segment deals with GPS

SCE 41 Department of Civil Engineering
satellites systems, Control segment describes ground based time and orbit controlprediction and in User segment various types of existing GPS receiver and itsapplication is dealt .
Table 2 gives a brief account of the function and of various segmentsalong with input and output information.
Table 2. Functions of various segments of GPS
Segment
Input Function Output
Space Navigationmessage
Generate andTransmit codeand carrierphases andnavigationmessage
P-CodeC/A CodeL1,L2carrierNavigationmessage
Control P-CodeObservationsTime
Produce GPStime predictephemerismanage spacevehicles
Navigationmessage
User Code observationCarrier phaseobservationNavigationmessage
NavigationsolutionSurveyingsolution
Position velocitytime
Space Segment
User Segment
Control Segment
Figure 4.3: The Space, Control and User segments of GPS
GLONASS (Global Navigation & Surveying System) a similar system to GPS is beingdeveloped by former Soviet Union and it is considered to be a valuable complementarysystem to GPS for future application.
4.3 SPACE SEGMENT
Space segment will consist 21 GPS satellites with an addition of 3 active spares. Thesesatellites are placed in almost six circular orbits with an inclination of 55 degree. Orbital
SCE 42 Department of Civil Engineering
height of these satellites is about 20,200 km corresponding to about 26,600 kmfrom the semi major axis. Orbital period is exactly 12 hours of sidereal time andthis provides repeated satellite configuration every day advanced by four minuteswith respect to universal time.
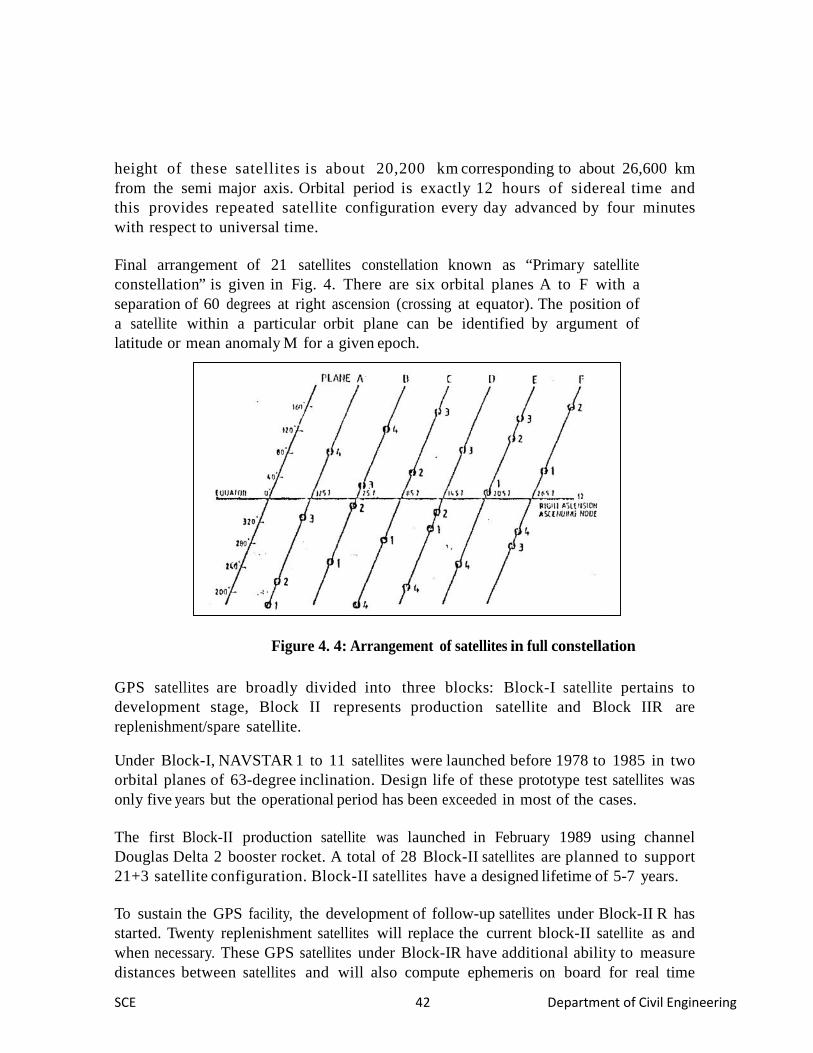
Final arrangement of 21 satellites constellation known as “Primary satelliteconstellation” is given in Fig. 4. There are six orbital planes A to F with aseparation of 60 degrees at right ascension (crossing at equator). The position ofa satellite within a particular orbit plane can be identified by argument oflatitude or mean anomaly M for a given epoch.
Figure 4. 4: Arrangement of satellites in full constellation
GPS satellites are broadly divided into three blocks: Block-I satellite pertains todevelopment stage, Block II represents production satellite and Block IIR arereplenishment/spare satellite.
Under Block-I, NAVSTAR 1 to 11 satellites were launched before 1978 to 1985 in twoorbital planes of 63-degree inclination. Design life of these prototype test satellites wasonly five years but the operational period has been exceeded in most of the cases.
The first Block-II production satellite was launched in February 1989 using channelDouglas Delta 2 booster rocket. A total of 28 Block-II satellites are planned to support21+3 satellite configuration. Block-II satellites have a designed lifetime of 5-7 years.
To sustain the GPS facility, the development of follow-up satellites under Block-II R hasstarted. Twenty replenishment satellites will replace the current block-II satellite as andwhen necessary. These GPS satellites under Block-IR have additional ability to measuredistances between satellites and will also compute ephemeris on board for real time

SCE 43 Department of Civil Engineering
information gives a schematic view of Block-II satellite. Electrical power is generatedthrough two solar panels covering a surface area of 7.2 square meter each. However,additional battery backup is provided to provide energy when the satellite moves intoearth’s shadow region. Each satellite weighs 845kg and has a propulsion system forpositional stabilization and orbit maneuvers.
Fig 4.5 Schematic view of a Block II GPS satelliteGPS satellites have a very high performance frequency standard with an accuracy of
between 1X10-12 to 1X10-13 and are thus capable of creating precise time base. Block-Isatellites were partly equipped with only quartz oscillators but Block-II satellites havetwo cesium frequency standards and two rubidium frequency standards. Usingfundamental frequency of 10.23 MHz, two carrier frequencies are generated to transmitsignal codes.
4.4 OBSERVATION PRINCIPLE AND SIGNAL STRUCTURE
NAVSTAR GPS is a one-way ranging system i.e. signals are onlytransmitted by the satellite. Signal travel time between the satellite and the receiver isobserved and the range distance is calculated through the knowledge of signalpropagation velocity. One way ranging means that a clock reading at the transmittedantenna is compared with a clock reading at the receiver antenna. But since the twoclocks are not strictly synchronized, the observed signal travel time is biased withsystematic synchronization error. Biased ranges are known as pseudoranges. Simultaneousobservations of four pseudoranges are necessary to determine X, Y, Z coordinates of userantenna and clock bias.
Real time positioning through GPS signals is possible by modulating carrier

SCE 44 Department of Civil Engineering
frequency with Pseudorandom Noise (PRN) codes. These are sequence of binary values(zeros and ones or +1 and -1) having random character but identifiable distinctly. Thuspseudoranges are derived from travel time of an identified PRN signal code. Twodifferent codes viz. P-code and C/A code are in use. P means precision or protected andC/A means clear/acquisition or coarse acquisition.
P- code has a frequency of 10.23 MHz. This refers to a sequence of 10.23 million binarydigits or chips per second. This frequency is also referred to as the chipping rate of P-code. Wavelength corresponding to one chip is 29.30m. The P-code sequence isextremely long and repeats only after 266 days. Portions of seven days each areassigned to the various satellites. As a consequence, all satellite can transmit on thesame frequency and can be identified by their unique one-week segment. This techniqueis also called as Code Division Multiple Access (CDMA). P-code is the primary codefor navigation and is available on carrier frequencies L1 and L2.
The C/A code has a length of only one millisecond; its chipping rate is 1.023 MHzwith corresponding wavelength of 300 meters. C/A code is only transmitted on L1carrier.
GPS receiver normally has a copy of the code sequence for determining thesignal propagation time. This code sequence is phase-shifted in time step- by-step andcorrelated with the received code signal until maximum correlation is achieved. Thenecessary phase-shift in the two sequences of codes is a measure of the signal travel timebetween the satellite and the receiver antennas. This technique can be explained as codephase observation.
For precise geodetic applications, the pseudoranges should be derived from phasemeasurements on the carrier signals because of much higher resolution. Problems ofambiguity determination are vital for such observations.
The third type of signal transmitted from a GPS satellite is the broadcast messagesent at a rather slow rate of 50 bits per second (50 bps) and repeated every 30 seconds.Chip sequence of P-code and C/A code are separately combined with the stream ofmessage bit by binary addition ie the same value for code and message chip gives 0 anddifferent values result in 1.
The main features of all three signal types used in GPS observation viz carrier,code and data signals are given in Table 3.
GPS Satellite Signals
Atomic Clock (G, Rb) fundamentalfrequency
10.23. MHz
L1 Carrier Signal 154 X 10.23 MHzL1 Frequency 1575.42 MHzL1 Wave length 19.05 CmL2 Carrier Signal 120 X 10.23 MHz

SCE 45 Department of Civil Engineering
L2 Frequency 1227.60 MHzL2 Wave Length 24.45 CmP-Code Frequency (Chipping Rate) 10.23 MHz (Mbps)P-Code Wavelength 29.31 MP-Code Period 267 days : 7
Days/SatelliteC/A-Code Frequency (Chipping Rate) 1.023 MHz (Mbps)C/A-Code Wavelength 293.1 MC/A-Code Cycle Length 1 MilisecondData Signal Frequency 50 bps
Data Signal Cycle Length 30 Seconds
The signal structure permits both the phase and the phase shift (Doppler effect) to bemeasured along with the direct signal propagation. The necessary bandwidth is achievedby phase modulation of the PRN code as illustrated in Fig. 6.
Time
Carrier
PRN +1Code -1
Fig 4.6 Generation of GPS Signals
4.5 STRUCTURE OF THE GPS NAVIGATION DATA
Structure of GPS navigation data (message) is shown in Fig. 7. The user has to decodethe data signal to get access to the navigation data. For on line navigation purposes, theinternal processor within the receiver does the decoding. Most of the manufacturers ofGPS receiver provide decoding software for post processing purposes. With a bit rate of50 bps and a cycle time of 30 seconds, the total information content of a navigation

SCE 46 Department of Civil Engineering
data set is 1500 bits. The complete data frame is subdivided into five subframes of six-second duration comprising 300 bits of information. Each subframe contains the datawords of 30 bits each. Six of these are control bits. The first two words of eachsubframe are the Telemetry Work (TLM) and the C/A-P-Code Hand over Work(HOW). The TLM work contains a synchronization pattern, which facilitates the accessto the navigation data. Since GPS is a military navigation system of US, a limited accessto the total system accuracy is made available to the civilian users. The serviceavailable to the civilians is called Standard Positioning System (SPS) while the serviceavailable to the authorized users is called the Precise Positioning Service (PPS). Undercurrent policy the accuracy available to SPS users is 100m, 2D- RMS and for PPS usersit is 10 to 20 meters in 3D. Additional limitation viz. Anti-Spoofing (AS), andSelective Availability (SA) was further imposed for civilian users. Under AS, onlyauthorized users will have the means to get access to the P-code. By imposing SAcondition, positional accuracy from Block-II satellite was randomly offset for SPSusers. Since May 1, 2000 according to declaration of US President, SA is switched offfor all users.
Fig 4.7 Data blockThe navigation data record is divided into three data blocks:
Data Block I appears in the first subframe and contains theclock coefficient/bias.
Data Block II appears in the second and third subframe andcontains all necessary parameters for the computationof the satellite coordinates.
Data Block III appears in the fourth and fifth subframes andcontains the almanac data with clock and ephemerisparameter for all available satellite of the GPS

SCE 47 Department of Civil Engineering
system. This data block includes alsoionospheric correction parameters and particularalphanumeric information for authorized users.
Unlike the first two blocks, the subframe four and five are notrepeated every 30 seconds.
International Limitation of the System AccuracyThe GPS system time is defined by the cesium oscillator at a selected monitor station.However, no clock parameter are derived for this station. GPS time is indicated by aweek number and the number of seconds since the beginning of the current week.GPS time thus varies between 0 at the beginning of a week to 6,04,800 at the endof the week. The initial GPS epoch is January 5, 1980 at 0 hours Universal Time.Hence, GPS week starts at Midnight (UT ) between Saturday and Sunday. TheGPS time is a continuous time scale and is defined by the main clock at the MasterControl Station (MCS). The leap seconds is UTC time scale and the drift in the MCSclock indicate that GPS time and UTC are not identical. The difference iscontinuously monitored by the control segment and is broadcast to the users in thenavigation message. Difference of about 7 seconds was observed in July,
1992.
Figure 4.8 Data Flow in the determination of the broadcast ephemeris
GPS satellite is identified by two different numbering schemes. Based on launchsequence, SVN (Space Vehicle Number) or NAVSTAR number is allocated. PRN(Pseudo Random Noise) or SVID (Space Vehicle Identification) number is related toorbit arrangement and the particular PRN segment allocated to the individualsatellite. Usually the GPS receiver displays PRN number.
4.6 CONTROL SEGMENT
Control segment is the vital link in GPS technology. Main functions of

SCE 48 Department of Civil Engineering
the control segment.
- Monitoring and controlling the satellite system continuously
- Determine GPS system time
- Predict the satellite ephemeris and the behavior of each satellite clock.
- Update periodically the navigation message for each particular satellite.
For continuos monitoring and controlling GPS satellites a mastercontrol stations (MCS), several monitor stations (MS) and groundantennas (GA) are located around the world (Fig. 9). The operationalcontrol segment (OCS) consists of MCS near Colorado springs (USA),three MS and GA in Kwajaleian Ascension and Diego Garcia and twomore MS at Colorado Spring and Hawai.
4.7 GROUND CONTROL SEGMENT
The monitor station receives all visible satellite signals and determines theirpseudorages and then transmits the range data along with the localmeteorologicaldata via data link to the master control stations. MCS then precomputes satelliteephemeris and the behaviour of the satellite clocks and formulates the navigation data.The navigation message data are transmitted to the ground antennas and via S-band itlinks to the satellites in view. Fig. 9 shows this process schematically. Due to systematicglobal distribution of upload antennas, it is possible to have atleast three contacts perday between the control segment and each satellite.
4.8 USER SEGMENT
Appropriate GPS receivers are required to receive signal from GPS satellites for thepurpose of navigation or positioning. Since, GPS is still in its development phase,many rapid advancements have completely eliminated bulky first generation userequipments and now miniature powerful models are frequently appearing in the market.
4.9 BASIC CONCEPT OF GPS RECEIVER AND ITS COMPONENTS
The main components of a GPS receiver are shown in Fig. 10. These are:
- Antenna with pre-amplifier
- RF section with signal identification and signal processing
- Micro-processor for receiver control, data sampling and data processing
- Precision oscillator

SCE 49 Department of Civil Engineering
- Power supply
- User interface, command and display panel
- Memory, data storage
Antennaand preamplifier
Signal processor
Code trackingloop
Carriertracking loop
Precisionoscillator
Microprocessor
Memory
External powersupply
Command &display unit
External datalogger
Fig 4.9 Major components of a GPS receiver

SCE 50 Department of Civil Engineering
ANTENNA
Sensitive antenna of the GPS receiver detects the electromagnetic wave signaltransmitted by GPS satellites and converts the wave energy to electric current] amplifiesthe signal strength and sends them to receiver electronics.
Several types of GPS antennas in use are mostly of following types (Fig.).
Mono pole Helix Spiral helix Microstrip Chokering
Types of GPS Antenna
- Mono pole or dipole
- Quadrifilar helix (Volute)
- Spiral helix
- Microstrip (patch)
- Choke ring
Microstrip antennas are most frequently used because of its added advantage forairborne application, materialization of GPS receiver and easy construction. However,for geodetic needs, antennas are designed to receive both carrier frequencies L1 and L2.Also they are protected against multipath by extra ground planes or by using choke rings.A choke ring consists of strips of conductor which are concentric with the vertical axisof the antenna and connected to the ground plate which in turns reduces the multipatheffect.
RF Section with Signal Identification and Processing
The incoming GPS signals are down converted to a lower frequency in the RS sectionand processed within one or more channels. Receiver channel is the primary electronicunit of a GPS receiver. A receiver may have one or more channels. In the parallelchannel concept each channel is continuouslymfranking one particular satellite. Aminimum of four parallel channels is required to determine position and time.Modern receivers contain upto 12 channels for each frequency.

SCE 51 Department of Civil Engineering
In the sequencing channel concept the channel switches from satellite to satelliteat regular interval. A single channel receiver takes atleast four times of 30 seconds toestablish first position fix, though some receiver types have a dedicated channel forreading the data signal. Now days in most of the cases fast sequencing channels with aswitching rate of about one-second per satellite are used.
In multiplexing channel, sequencing at a very high speed between different satellites isachieved using one or both frequencies. The switching rate is synchronous with thenavigation message of 50 bps or 20 milliseconds per bit. A complete sequence withfour satellites is completed by 20 millisecond or after 40 millisecond for dual frequencyreceivers. The navigation message is continuous, hence first fix is achieved after about 30seconds.
Though continuous tracking parallel channels are cheap and give good overallperformance, GPS receivers based on multiplexing technology will soon be available at acheaper price due to electronic boom.
Microprocessor` To control the operation of a GPS receiver, a microprocessor is essential foracquiring the signals, processing of the signal and the decoding of the broadcastmessage. Additional capabilities of computation of on-line position and velocity,conversion into a given local datum or the determination of waypoint information arealso required. In future more and more user relevant software will be resident onminiaturized memory chips.
Precision Oscillator
A reference frequency in the receiver is generated by the precision oscillator.Normally, less expensive, low performance quartz oscillator is used in receivers since theprecise clock information is obtained from the GPS satellites and the user clock errorcan be eliminated through double differencing technique when all participatingreceivers observe at exactly the same epoch. For navigation with two or three satellitesonly an external high precision oscillator is used.
SCE 52 Department of Civil Engineering
Power Supply
First generation GPS receivers consumed very high power, but modern receiversare designed to consume as little energy as possible. Most receivers have an internalrechargeable. Nickel-Cadmium battery in addition to an external power input. Cautionof low battery signal prompts the user to ensure adequate arrangement of power supply.
Memory Capacity
For port processing purposes all data have to be stored on internal or externalmemory devices. Post processing is essential for multi station techniques applicable togeodatic and surveying problems. GPS observation for pseudoranges, phase data,time and navigation message data have to be recorded. Based on sampling rate, itamount to about 1.5 Mbytes of data per hour for six satellites and 1 second data for dualfrequency receivers. Modern receivers have internal memories of 5 Mbytes or more.Some receivers store the data on magnetic tape or on a floppy disk or hard-disk usingexternal microcomputer connected through RS-232 port.
Most modern receivers have a keypad and a display for communication between theuser and the receivers. The keypad is used to enter commands, external data likestation number or antenna height or to select a menu operation. The displayindicates computed coordinates, visible satellites, data quality indices and other suitableinformation. Current operation software packages are menu driven and very userfriendly.
4.10 CLASSIFICATION OF GPS RECEIVERS
GPS receivers can be divided into various groups according to different criteria. In theearly stages two basic technologies were used as the classification criteria viz. Codecorrelation receiver technology and sequencing receiver technology, which wereequivalent to code dependent receivers and code free receivers. However, this kind ofdivision is no longer justifiable since both techniques are implemented in presentreceivers.
e.g.Another classification of GPS receivers is based on acquisition of data types
SCE 53 Department of Civil Engineering
- C/A code receiver
- C/A code + L1 Carrier phase
- C/A code + L1 Carrier phase + L2 Carrier phase
- C/A code + p_code + L1, L2 Carrier phase
- L1 Carrier phase (not very common)
- L1, L2 Carrier phase (rarely used)
as:Based on technical realization of channel, the GPS receivers can be classified
- Multi-channel receiver
- Sequential receiver
- Multiplexing receiver
GPS receivers are even classified on the purpose as:
- Military receiver
- Civilian receiver
- Navigation receiver
- Timing receiver
- Geodetic receiver
For geodetic application it is essential to use the carrier phase data asobservable. Use of L1 and L2 frequency is also essential along with P-code.
Examples of GPS Receiver
GPS receiver market is developing and expanding at a very high speed.Receivers are becoming powerful, cheap and smaller in size. It is not possible togive details of every make but description of some typical receivers given maybe regarded as a basis for the evaluation of future search and study of GPSreceivers.
Classical Receivers
Detailed description of code dependent T1 4100 GPS Navigator and code freeMacrometer V1000 is given here:
SCE 54 Department of Civil Engineering
T1 4100 GPS Navigator was manufactured by Texas Instrument in 1984. It was the firstGPS receiver to provide C/A and P code and L1 and L2 carrier phase observations. It is adual frequency multiplexing receiver and suitable for geodesist, surveyor and navigators.The observables through it are:
- P-Code pseudo ranges on L1 and L2
- C/A-Code pseudo ranges on L1
- Carrier phase on L1 and L2
The data are recorded by an external tape recorder on digital cassettes or are downloadeddirectly to an external microprocessor. A hand held control display unit (CDU) is usedfor communication between observer and the receiver. For navigational purposes thebuilt in microprocessor provides position and velocity in real time every three seconds. T14100 is a bulky instrument weighing about 33 kg and can be packed in twotransportation cases. It consumes 90 watts energy in operating mode of 22V - 32V.Generator use is recommended. The observation noise in P-Code is between 0.6 to 1 m,in C/ A code it ranges between 6 to 10 m and for carrier phase it is between 2 to 3 m.
T1 4100 has been widely used in numerous scientific andapplied GPS projects and is still in use. The main disadvantages of theT1 4100 compared to more modern GPS equipment’s are
- Bulky size of the equipment
- High power consumption
- Difficult operation procedure
- Limitation of tracking four satellites simultaneously
- High noise level in phase measurements
Sensitivity of its antenna for multipath and phase centre variation if two receivers areconnected to one antenna and tracking of seven satellites simultaneously ispossible. For long distances and in scientific projects, T1 4100 is still regarded useful.However, due to imposition of restriction on P- code for civilian, T1 4100 during AntiSpoofing (AS) activation can only be used as a single frequency C/A code receiver.
The MACROMETER V 1000, a code free GPS receiver was introduced in 1982 andwas the first receiver for geodetic applications. Precise results obtained through it hasdemonstrated the potential of highly accurate GPS phase observations. It is a singlefrequency receiver and tracks 6 satellites on

SCE 55 Department of Civil Engineering
6 parallel channels. The complete system consists of three units viz.
- Receiver and recorder with power supply
- Antenna with large ground plane
- P 1000 processor
The processor is essential for providing the almanac data because the Macrometer V1000 cannot decode the satellite messages and process the data. At pre determinedepoches the phase differences between the received carrier signal and a reference signalfrom receiver oscillator is measured. A typical baseline accuracy reported for upto 100km distance is about 1 to 2 ppm (Parts per million).
Macrometer II, a dual frequency version was introduced in 1985. Though it iscomparable to Macrometer V 1000, its power consumption and weight are much less.Both systems require external ephemeredes. Hence specialized operators of fewcompanies are capable of using it and it is required to synchronize the clock of all theinstruments proposed to be used for a particular observation session. To overcome abovedisadvantages, the dual frequency Macrometer II was further miniaturized andcombined with a single frequency C/A code receiver with a brand name MINIMAC in1986, thus becoming a code dependent receiver.
Examples of present Geodetic GPS Receivers
Few of the currently available GPS receivers that are used in geodesysurveying and precise navigation are described. Nearly all models started as singlefrequency C/A-Code receivers with four channels. Later L2 carrier phase was added andtracking capability was increased. Now a days all leading manufacturers have gone forcode-less, non- sequencing L2 technique. WILD/ LEITZ (Heerbrugg, Switzerland) andMAGNAVOX (Torrance, California) have jointly developed WM 101 geodetic receiverin 1986. It is a four channel L1 C/A code receiver. Three of the channels sequentially trackupto six satellites and the fourth channel, a house keeping channels, collects the satellitemessage and periodically calibrates the inter channel biases. C/A-code and reconstructed L1carrier phase data are observed once per second.
The dual frequency WM 102 was marketed in 1988 with following keyfeatures:
- L1 reception with seven C/A code channel tracking upto sixsatellites simultaneously.
- L2 reception of up to six satellites with one sequencing P- code channel
- Modified sequencing technique for receiving L2 when P-codesignals are encrypted.
SCE 56 Department of Civil Engineering
The observations can be recorded on built in data cassettes or can betransferred on line to an external data logger in RS 232 or RS 422 interface.Communication between operator and receiver is established by alpha numericalcontrol panel and display WM 101/102 has a large variety of receiver resident menu drivenoptions and it is accompanied by comprehensive post processing software.
In 1991, WILD GPS system 200 was introduced. Its hardware comprises the MagnavoxSR 299 dual frequency GPS sensor, the hand held CR 233 GPS controller and a Nicdbattery. Plug in memory cards provide the recording medium. It can track 9 satellitessimultaneously on L1 and L2. Reconstruction of carrier phase on L1 is through C/Acode and on L2 through P-code. The receiver automatically switches to codeless L2when P-code is encrypted. It consumes 8.5 watt through 12-volt power supply.
TRIMBLE NAVIGATION (Sunny vale, California) has been producing TRIMBLE4000 series since 1985. The first generation receiver was a L1 C/ A code receiver withfive parallel channels providing tracking of 5 satellites simultaneously. Furtherupgradation included increasing the number of channels upto tweleve, L2sequencing capability and P-code capability. TRIMBLE Geodatic Surveyor 4000SSE is the most advanced model. When P-Code is available, it can perform followingtypes of observations, viz.,
- Full cycle L1 and L2 phase measurements
- L1 and L2, P-Code measurements when AS is on and P-code is encrypted
- Full cycle L1 and L2 phase measurement
- Low noise L1, C/A code
- Cross-correlated Y-Code dataObservation noise of the carrier phase measurement when P-code is available isabout ñ 0-2mm and of the P-code pseudoranges as low as ñ 2cm. Therefore, it is verysuitable for fast ambiguity solution techniques with code/ carrier combinations.
ASHTECH (Sunnyvale, California) developed a GPS receiver with 12 parallelchannels and pioneered current multi-channel technology. ASHTECH XII GPS receiverwas introduced in 1988. It is capable of measuring pseudoranges, carrier phaseand integrated dopler of up to 12 satellites on L1. The pseudoranges measurement aresmoothed with integrated Doppler. Postion velociy, time and navigation informations aredisplayed on a keyboard with a 40-characters display. L2 option adds 12 physical L2squaring type channels.
ASHTECH XII GPS receiver is a most advanced system, easy to handle and does notrequire initialization procedures. Measurements of all satellites in view are carried out
SCE 57 Department of Civil Engineering
automatically. Data can be stored in the internal solid plate memory of 5 Mbytescapacity. The minimum sampling interval is 0.5 seconds. Like many other receivers ithas following additional options viz.
- 1 ppm timing signal output
- Photogrammetric camera input- Way point navigation
- Real time differential navigation and provision of portprocessing and vision planning software
In 1991, ASHTECH P-12 GPS receiver was marketed. It has 12 dedicated channels ofL1, P-code and carrier and 12 dedicated channels of L2, P-code and carrier. It also has12 L1, C/A code and carrier channels and 12 code less squaring L2 channels. Thus thereceiver contains 48 channels and provides all possibilities of observations to all visiblesatellites. The signal to noise level for phase measurement on L2 is only slightly less thanon L1 and significantly better than with code-less techniques. In cases of activated P-code encryption, the code less L2 option can be used.
TURBO ROGUE SNR-8000 is a portable receiver weighing around 4 kg, consumes15-watt energy and is suitable for field use. It has 8 parallel channels on L1 and L2.It provides code and phase data on both frequencies
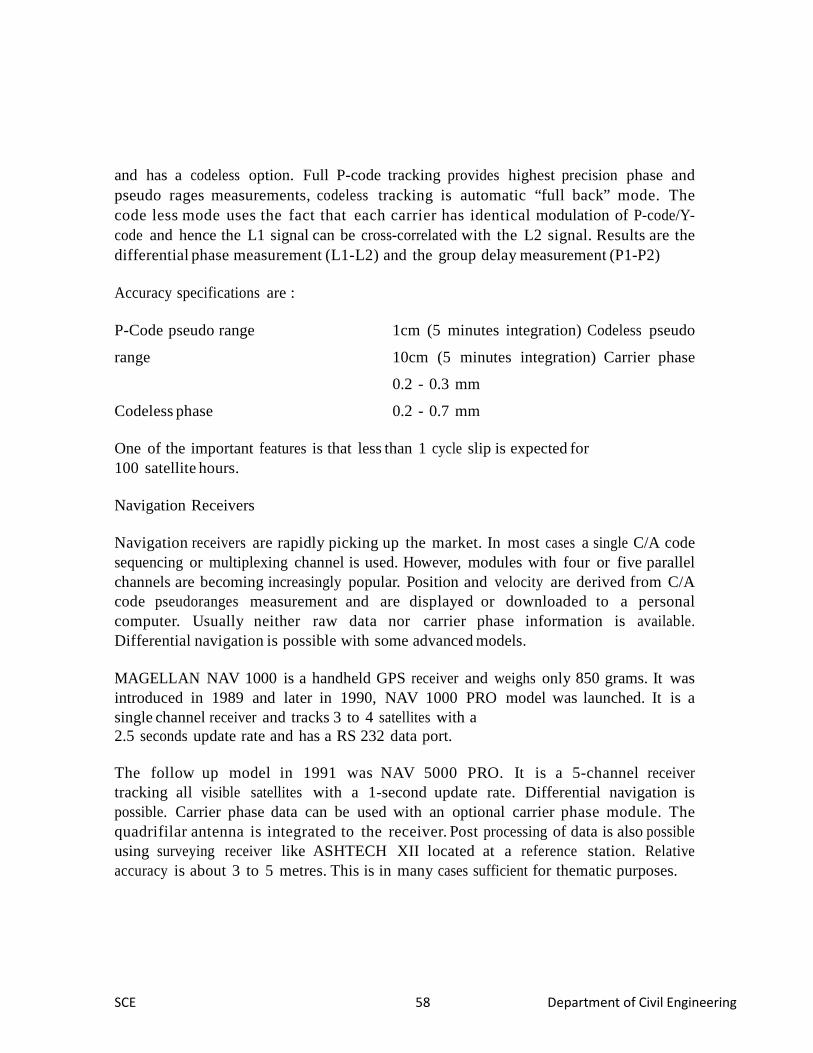
SCE 58 Department of Civil Engineering
and has a codeless option. Full P-code tracking provides highest precision phase andpseudo rages measurements, codeless tracking is automatic “full back” mode. Thecode less mode uses the fact that each carrier has identical modulation of P-code/Y-code and hence the L1 signal can be cross-correlated with the L2 signal. Results are thedifferential phase measurement (L1-L2) and the group delay measurement (P1-P2)
Accuracy specifications are :
P-Code pseudo range 1cm (5 minutes integration) Codeless pseudo
range 10cm (5 minutes integration) Carrier phase
0.2 - 0.3 mm
Codeless phase 0.2 - 0.7 mm
One of the important features is that less than 1 cycle slip is expected for100 satellite hours.
Navigation Receivers
Navigation receivers are rapidly picking up the market. In most cases a single C/A codesequencing or multiplexing channel is used. However, modules with four or five parallelchannels are becoming increasingly popular. Position and velocity are derived from C/Acode pseudoranges measurement and are displayed or downloaded to a personalcomputer. Usually neither raw data nor carrier phase information is available.Differential navigation is possible with some advanced models.
MAGELLAN NAV 1000 is a handheld GPS receiver and weighs only 850 grams. It wasintroduced in 1989 and later in 1990, NAV 1000 PRO model was launched. It is asingle channel receiver and tracks 3 to 4 satellites with a2.5 seconds update rate and has a RS 232 data port.
The follow up model in 1991 was NAV 5000 PRO. It is a 5-channel receivertracking all visible satellites with a 1-second update rate. Differential navigation ispossible. Carrier phase data can be used with an optional carrier phase module. Thequadrifilar antenna is integrated to the receiver. Post processing of data is also possibleusing surveying receiver like ASHTECH XII located at a reference station. Relativeaccuracy is about 3 to 5 metres. This is in many cases sufficient for thematic purposes.

SCE 59 Department of Civil Engineering
Many hand held navigation receivers are available with added features. Thelatest market situation can be obtained through journals like GPS world etc.
For most navigation purpose a single frequency C/A code receiver is sufficient. Foraccuracy requirements better than 50 to 100 meters, a differential option is essential.For requirement below 5 meters, the inclusion of carrier phase data is necessary. In highprecision navigation the use of a pair of receivers with full geodetic capability isadvisable. The main characteristics of multipurpose geodetic receiver are summarized inTable 4.
Table 4. Overview of geodetic dual-frequency GPS satellite receiver (1992)
Receiver Channel Code Wavelength
Anti-spoofingL1 L2 L1 L2 L1 L2
TI 4100 4 4 P P SinglefrequencyMACROMET
ER6 6 - - /2 No influence
ASHTECHXII
12 12 C/A - /2 No influenceASHTECH P12
12 12 C/A,P
P SquaringTRIMBLESST
8-12 8-12 C/A - /2 No influenceTRIMBLE4000
9-12 9-12 C/A,P
P Codeless SSEWM 102 7
par1seq
C/A P SquaringWILD GPS200
9 9 C/A p Codeless
TURBOROGUE
8 8 C/A,P
P Codeless
Some of the important features for selecting a geodetic receiver are :
- Tracking of all satellites
- Both frequencies
- Full wavelength on L2
- Low phase noise-low code noise
- High sampling rate for L1 and L2
- High memory capacity

SCE 60 Department of Civil Engineering
- Low power consumption
- Full operational capability under anti spoofing condition
Further, it is recommended to use dual frequency receiver to minimize ion-spherical influences and take advantages in ambiguity solution.
4.11 ACCURACY
In general, an SPS receiver can provide position information with an error of less than 25meter and velocity information with an error less than 5 meters per second. Upto 2May 2000 U.S Government has activated Selective Availability (SA) to maintainoptimum militar y effectiveness. Selective Availability inserts random errors into theephemeris information broadcast by the satellites, which reduces the SPS accuracy toaround 100 meters.
For many applications, 100-meter accuracy is more than acceptable. For applicationsthat require much greater accuracy, the effects of SA and environmentally producederrors can be overcome by using a technique called Differential GPS (DGPS), whichincreases overall accuracy.
4.12 DIFFERENTIAL THEORY
Differential positioning is technique that allows overcoming the effects of environmentalerrors and SA on the GPS signals to produce a highly accurate position fix. This is doneby determining the amount of the positioning error and applying it to position fixes thatwere computed from collected data.
Typically, the horizontal accuracy of a single position fix from a GPS receiver is 15meter RMS (root-mean Square) or better. If the distribution of fixes about the trueposition is circular normal with zero mean, an accuracy of 15 meters RMS impliesthat about 63% of the fixes obtained during a session are within 15 meters of the trueposition.
TYPES OF ERRORS
There are two types of positioning errors: correctable and non-correctable. Correctableerrors are the errors that are essentially the same for two GPS receivers in the samearea. Non-correctable errors cannot be correlated between two GPS receivers in the samearea.

SCE 61 Department of Civil Engineering
4.13 CORRECTABLE ERRORS
Sources of correctable errors include satellite clock, ephemeris data and ionosphere andtropospheric delay. If implemented, SA may also cause a correctable positioning error. Clockerrors and ephemeris errors originate with the GPS satellite. A clock error is a slowly changingerror that appears as a bias on the pseudorange measurement made by a receiver. An ephemeriserror is a residual error in the data used by a receiver to locate a satellite in space.
Ionosphere delay errors and tropospheric delay errors are caused by atmospheric conditions.Ionospheric delay is caused by the density of electrons in the ionosphere along the signal path.A tropspheric delay is related to humidity, temperature, and altitude along the signalpath. Usually, a tropospheric error is smaller than an ionospheric error.
Another correctable error is caused by SA which is used by U.SDepartment of Defenceto introduce errors into Standard Positioning Service (SPS) GPS signals to degrade fix accuracy.
The amount of error and direction of the error at any given time does not change rapidly.Therefore, two GPS receivers that are sufficiently close together will observe the same fixerror, and the size of the fix error can be determined.
NON-CORRECTABLE ERRORS
Non-correctable errors cannot be correlated between two GPS receivers that arelocated in the same general area. Sources of non-correctable errors include receivernoise, which is unavoidably inherent in any receiver, and multipath errors, which areenvironmental. Multi-path errors are caused by the receiver “seeing” reflections of signalsthat have bounced off of surrounding objects. The sub-meter antenna is multipath-resistant; its use is required when logging carrier phase data. Neither error can beeliminated with differential, but they can be reduced substantially with position fixaveraging. The error sources and the approximate RMS error range are given in the Table.
Error Sources
Error Source Approx. Equivalent RangeError (RMS) in meters
Correctable with Differential
Clock (Space Segment) 3.0
Ephemeris (Control Segment) 2.7
Ionospheric Delay (Atmosphere) 8.2
Tropospheric Delay (Atmosphere) 1.8
Selective Availability (if implemented) 27.4
Total 28.9
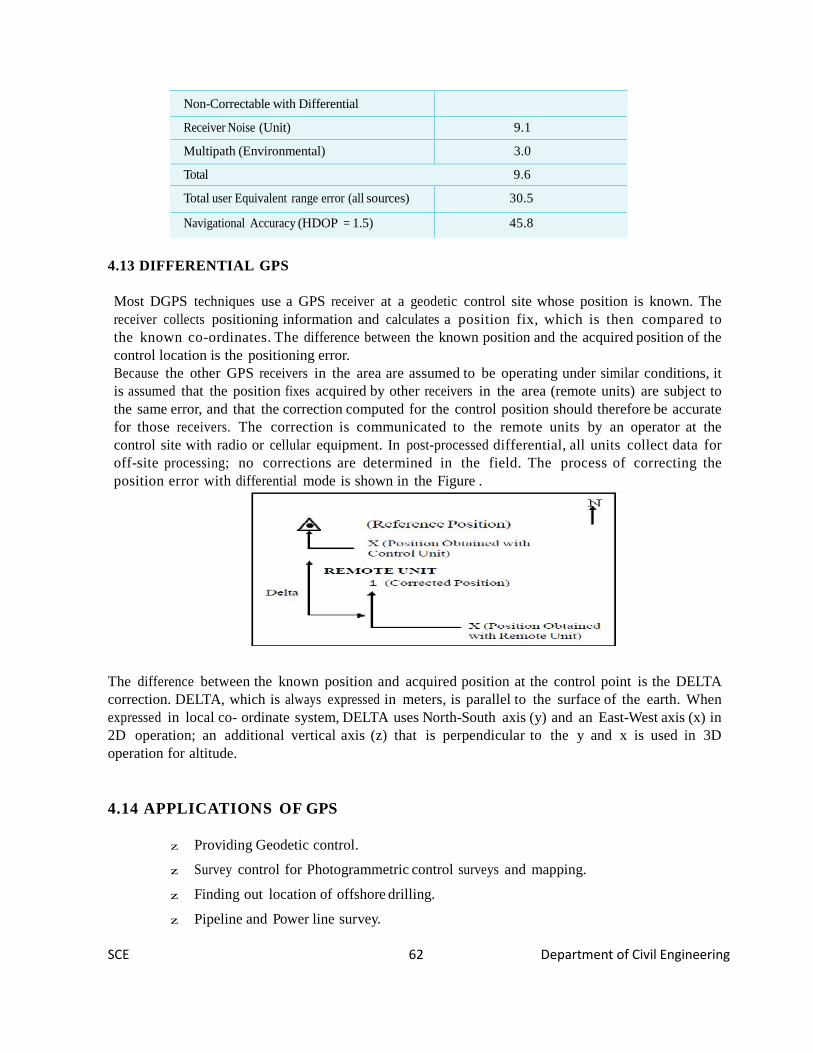
SCE 62 Department of Civil Engineering
Non-Correctable with Differential
Receiver Noise (Unit) 9.1
Multipath (Environmental) 3.0
Total 9.6
Total user Equivalent range error (all sources) 30.5
Navigational Accuracy (HDOP = 1.5) 45.8
4.13 DIFFERENTIAL GPS
Most DGPS techniques use a GPS receiver at a geodetic control site whose position is known. Thereceiver collects positioning information and calculates a position fix, which is then compared tothe known co-ordinates. The difference between the known position and the acquired position of thecontrol location is the positioning error.Because the other GPS receivers in the area are assumed to be operating under similar conditions, itis assumed that the position fixes acquired by other receivers in the area (remote units) are subject tothe same error, and that the correction computed for the control position should therefore be accuratefor those receivers. The correction is communicated to the remote units by an operator at thecontrol site with radio or cellular equipment. In post-processed differential, all units collect data foroff-site processing; no corrections are determined in the field. The process of correcting theposition error with differential mode is shown in the Figure .
The difference between the known position and acquired position at the control point is the DELTAcorrection. DELTA, which is always expressed in meters, is parallel to the surface of the earth. Whenexpressed in local co- ordinate system, DELTA uses North-South axis (y) and an East-West axis (x) in2D operation; an additional vertical axis (z) that is perpendicular to the y and x is used in 3Doperation for altitude.
4.14 APPLICATIONS OF GPS
z Providing Geodetic control.
z Survey control for Photogrammetric control surveys and mapping.
z Finding out location of offshore drilling.
z Pipeline and Power line survey.

SCE 63 Department of Civil Engineering
z Navigation of civilian ships and planes.
z Crustal movement studies.
z Geophysical positioning, mineral exploration and mining.
z Determination of a precise geoid using GPS data.
z Estimating gravity anomalies using GPS.
z Offshore positioning: shiping, offshore platforms, fishing boats etc.
CHAPTER 5ADVANCED TOPICS IN SURVEYING
5.1 INTRODUCTIONPhotogrammetry - Introduction
- Terrestial and aerial Photographs- Stereoscopy- Parallax- Electromagnetic distance measurement- Carrier waves
- Principles - Instruments- Trilateration
Hydrographic Surveying- Tides- MSL- Sounding methods- Location of soundings and methods- Three point problem- Strength of fix- Sextants and station pointer- River surveys- Measurement of current and discharge
Cartography- Cartographic concepts and techniques- Cadastral surveying
- Definition- Uses- Legal values
- Scales and accuracies.5.2 PHOTOGRAMMETRIC SURVEYING?
Photogram metric surveying or photogrammetry is the science and art of obtainingaccurate measurements by use of photographs, for various purposes such as the constructionof planimetric and topographic maps, classification of soils, interpretation of geology,acquisition of military intelligence and the preparation of composite pictures of the ground.The photographs are taken either from the air or from station on the ground. Terrestrialphotogrammetry is that Brach of photogrammetry wherein photographs are taken from a fixedposition on or near the ground. Aerial photogrammetry is that branch of photogrammetrywherein the photographs are taken by a camera mounted in an aircraft flying over the area.

SCE 64 Department of Civil Engineering
Mapping from aerial photographs is the best mapping procedures yet developed for largeprojects, and are invaluable for military intelligence. The major users of aerial mappingmethods are the civilian and military mapping agencies of the Government.
The conception of using photographs for purposes of measurement appears to haveoriginated with the experiments of Aime Laussedat of the Corps of the French Army, who in1851 produced the first measuring camera. He developed the mathematical analysis ofphotographs as perspective projections, thereby increasing their application to topography.Aerial photography from balloons probably began about 1858. Almost concurrently (1858),but independently of Laussedat, Meydenbauer in Germany carried out the first experiments inmaking critical measurements of architectural details by the intersection method in the basisof two photographs of the building. The ground photography was perfected in Canada byCapt. Deville, then Surveyor General of Canada in 1888. In Germany, most of the progress onthe theoretical side was due to Hauck.
In 1901, Pulfrich in Jena introduced the stereoscopic principle of measurement anddesigned the stereo comparator. The stereoaitograph was designed (1909) at the Zeissworkshops in Jena, and this opened a wide field of practical application. Scheimpflug, anAustralian captain, developed the idea of double projector in 1898. He originated the theoryof perspective transformation and incorporated its principles in the photoperspecto graph. Healso gave the idea of radial triangulation. His work paved the way for the development ofaerial surveying and aerial photogrammetry.
In 1875, Oscar Messter built the first aerial camera in Germany and J.W.Bagloy andA.Brock produced the first aerial cameras in U.S.A. In 1923, Bauersfeld designed the Zeissstereoplanigraph. The optical industries of Germany, Switzerland, Italy and France, and lateralso those of the U.S.A and U.S.S.R. took up the manufacture and constant furtherdevelopment of the cameras and plotting instruments. In World War II, both the sides madeextensive use of aerial photographs for their military operations. World War II gave rise tonew developments of aerial photography techniques, such as the application of radio controlto photoflight navigation, the new wide-angle lenses and devices to achieve true verticalphotographs.
5.3 PRINCIPLES BEHIND TERRESTRIAL PHOTOGRAMMETRY.
The principle of terrestrial photogrammetry was improved upon and perfected byCapt. Deville, then Surveyor General of Canada in 1888. In terrestrial photogrammetry,photographs are taken with the camera supported on the ground. The photographs are takenby means of a photo theodolite which is a combination of a camera and a theodolite. Maps arethen compiled from the photographs.
The principle underlying the method of terrestrial photogrammetry is exactly similarto that of plane table surveying, i.e. if the directions of same objects photographed from twoextremities of measured base are known, their position can be located by the intersection oftwo rays to the same object. However, the difference between this and plane tabling is thatmore details are at once obtained from the photographs and their subsequent plotting etc. isdone by the office while in plane tabling all the detailing is done in the field itself.
Thus in Fig , A and B are the two stations at the ends of base AB. The arrows indicatethe directions of horizontal pointing (in plan) of the camera. For each pair of pictures taken
SCE 65 Department of Civil Engineering
from the two ends, the camera axis is kept parallel to each other. From economy and speedpoint of view, minimum number of photographs should be used to cover the whole area and toachieve this, it is essential to select the best positions of the camera stations. A thorough studyof the area should be done from the existing maps, and a ground reconnaissance should bemade. The selection of actual stations depends upon the size and ruggedness of the area to be
SCE 66 Department of Civil Engineering
Surveyed. The camera should be directed downward rather than upward, and thestations should be at the higher points on the area.
The terrestrial photogrammetry can be divided into two branches:(i) Plane-table photogrammetry.(ii) Terrestrial stereo photogrammetry
The plane table photogrammetry consists essentially in taking a photograph of the areato be mapped from each of the two or three stations. The photograph perpendiculars may beoriented at any angle to the base, but usually from an acute angle with the latter. The maindifficulty arises in the identifications of image points in a pair of photographs. In the case ofhomogeneous areas of sand or grass, identification becomes impossible. The principles ofstereo photogrammetry, however, produced the remedy.
In terrestrial stereo photogrammetry, due to considerable improvement of accuracyobtained by the stereoscopic measurement of pairs of photographs, the camera base and theangles of intersection of the datum rays to the points to be measured can be considerablyreduced since the camera axes at the two stations exhibit great similarity to each other. Theimage points which are parallactically displaced relative to each other in the two photographsare fused to a single spatial image by the stereoscopic measurement.shore line survey?
The shore line surveys consist of:
(i) Determination or delineation of shore lines,
(ii) Location of shore details and prominent features to which soundings may beconnected,
(iii) Determination of low and high water lines for average spring tides,
The determination or delineation of shore lines is done by traversing along the shoreand taking offsets to the water edge by tape, or stadia or plane table. If the river is narrow,both the banks may be located by running a single line of traverse on one bank. For widerivers, however, transverse may be run along both the banks. The traverse should be

SCE 67 Department of Civil Engineering
Connected at convenient intervals to check the work. Thus, the Fig. two traverses XY and X
– Y-- along the two opposite shores may be checked by taking observations from A and B tothe points C and D. When the instrument is at B, angles ABC and ABD can be measured.From the measured length of AB and the four angles, the length CD can be calculated. If thisagrees with the measured length of CD, the work is checked. Sometimes, a triangulation net isrun along a wide river. In sea shore survey, buoys anchored off the shore and light houses areused as reference points and are located by triangulation.
In the case of tidal water, it is necessary to locate the high and low water lines. Theposition of high water line may be determined roughly from shore deposits and marks onrocks. To determine the high water line accurately, the elevation of mean high water ofordinary spring tide is determined and the points are located on the shore at that elevation asin direct method of contouring. The low water line can also be determined similarly.However, since the limited time is available for the survey of low water line, it is usuallylocated by interpolation from soundings.
Sounding and the methods employed in sounding.
The measurement of depth below the water surface is called sounding. Thiscorresponds to the ordinary spirit leveling in land surveying where depths are measured belowa horizontal line established by a level. Here, the horizontal line or the datum is the surface ofwater, the level of which continuously goes on changing with time. The object of makingsoundings is thus to determine the configuration of the sub aqueous source. As stated earlier,soundings are required for:
(i) Making nautical charts for navigation;
(ii) Measurement of areas subject to scour or silting and to ascertain the quantities ofdredged material;
(iii) Making sub-aqueous investigations to secure information needed for theconstruction, development and improvement of port facilities.
For most of the engineering works, soundings are taken form a small boat. Theequipment needed for soundings are:
(i) Sounding boat (ii) Sounding rods or poles
(iii) Lead lines (iv) Sounding machine
SCE 68 Department of Civil Engineering
(v) Fathometer.
Sounding boat
A row-boat for sounding should be sufficiently roomy and stable. For quiet water, aflat bottom boat is more suitable, but for rough water round-bottomed boat is more suitable.For regular soundings, a row boat may be provided with a well through which sounds aretaken. A sounding platform should be built for use in smaller boat. It should be extended farenough over the side to prevent the line from striking the boat. If the currents are strong, amotor or stream launch may be used with advantage.Sounding rods or poles
A sounding rod is a pole of a sound straight-grained well seasoned tough timberusually 5 to 8 cm in diameter and 5 to 8 metres long. They are suitable for shallow and quietwaters. An arrow or lead shoe of sufficient weights fitted at the end. This helps in holdingthem upright in water. The lead or weight should be of sufficient area so that it may not sinkin mud or sand. Between soundings it is turned end for end without removing it from thewater. A pole of 6 m can be used to depths unto 4 meters.
Lead lines
A lead line or a sounding line is usually a length of a cord, or tiller rope of Indianhemp or braided flax or a brass chain with a sounding lead attached to the end. Due toprolonged use, a line of hemp or cotton is liable to get stretched. To graduate such a line, it isnecessary to stretch it thoroughly when wet before it is graduated. The line should be kept drywhen not in use. It should be soaked in water for about one hour before it is used for takingsoundings. The length of the line should be tested frequently with a tape. For regularsounding, a chain of brass, steel or iron is preferred. Lead lines are usually used for depthsover about 6 meters.
Sounding lead is a weight (made of lead) attached to the line. The weight is conical inshape and varies from 4 to 12 kg depending upon the depth of water and the strength of thecurrent. The weight should be somewhat streamlined and should have an eye at the top forattaching the cord. It often has cup-shaped cavity at the bottom so that it may be armed withland or tallow to pick up samples from the bottom. Where the bottom surface is soft, lead-
filled pipe with a board at the top is used with the lead weight. The weight penetrates in themud and stops where the board strikes the mud surface.
Suggested system of marking poles and lead lines
The U.S. Coast and Geodetic survey recommends the following system of marking thepoles and the lead lines :
Poles : Make a small permanent notch at each half foot. Paint the entire pole whiteand the spaces between the 2- and 3-, the 7- and 8-and the 12- and 13-ft marks black. Point½’’ red bands at the 5- and 10-ft marks, a ½’’ in black band at each of the other foot marksand ¼’’ bands at the half foot marks. These bands are black where the pole is white and vice
SCE 69 Department of Civil Engineering
versa.
Lead Lines : A lead line is marked in feet as follow :Feet Marks
2, 12, 22 etc Red bunting
4, 14, 24 etc White bunting
6, 16, 26 etc Blue bunting
8, 18, 28 etc Yellow bunting
10, 60, 110 etc One strip of leather
20, 70, 120 etc Two strips of leather
30, 80, 130 etc Leather with two holes
40, 90, 140 etc Leather with one holes
50 Star-shaped leather
100 Star-shaped leather with one hole
The intermediate odd feet (1,3,5,7,9 etc.) are marked by white seizing.
Sounding Machine
Where much of sounding is to done, a sounding machine as very useful. The soundingmachine may either be hand driven or automatic. Fig.4.3. show a typical hand drivenWeddele’s sounding machine.
The lead weight is carried at the end of a flexible wire cord attached to the barrel andcan lowered at any desired rate, the speed of the drum being controlled by means of a break.
The readings are indicated in two dials—the outer dial showing the depth in feet and the innershowing tenths of a foot. A handle is used to raise the level which can be suspended at anyheight by means of a paul and ratchet. The sounding machine is mounted in a sounding boatand can be used up to a maximum depth of 100 ft.
Fathometer: Echo-sounding

SCE 70 Department of Civil Engineering
A Fathometer is used in ocean sounding where the depth of water is too much, and tomake a continuous and accurate record of the depth of water below the boat or ship at which itis installed. It is an echo-sounding instrument in which water depths are obtained bedetermining the time required for the sound waves to travel from a point near the surface ofthe water to the bottom and back. It is adjusted to read depth on accordance with the velocityof sound in the type of water in which it is being used. A fathometer may indicate the depthvisually or indicate graphically on a roll which continuously goes on revolving and provide avirtual profile of the lake or sea.
What are the components of echo sounding instrument? Briefly explain the advantages ofecho sounding.
The main parts of an echo-sounding apparatus are:
1. Transmitting and receiving oscillators.
2. Recorder unit.
3. Transmitter / Power unit.
Figure illustrates the principal of echo-sounding. It consists in recording the interval oftime between the emission of a sound impulse direct to the bottom of the sea and the receptionof the wave or echo, reflected from the bottom. If the speed of sound in that water is v and thetime interval between the transmitter and receiver is t, the depth h is given by
h = ½ vt …
Due to the small distance between the receiver and the transmitter, a slight correctionis necessary in shallow waters. The error between the true depth and the recorded depth canbe calculated very easily by simple geometry. If the error is plotted against the recordeddepth, the true depth can be easily known. The recording of the sounding is produced by theaction of a small current passing through chemically impregnated paper from a rotating stylus
to an anode plate. The stylus is fixed at one end of a radial arm which revolves at constantspeed. The stylus makes a record on the paper at the instants when the sound impulse istransmitted and when the echo returns to the receiver.
Advantage of echo-soundingEcho-sounding has the following advantages over the older method of lead line and
rod:1. It is more accurate as a truly vertical sounding is obtained. The speed of the vessel

SCE 71 Department of Civil Engineering
does deviate it appreciably from the vertical. Under normal water conditions, in ports andharbors an accuracy of 7.5 cm may be obtained.
2. It can be used when a strong current is running and when the weather is unsuitablefor the soundings to be taken with the lead line.
3. It is more sensitive than the lead line.
4. A record of the depth is plotted immediately and provides a continuous record ofthe bottom as the vessel moves forward.
5. The speed of sounding and plotting is increased.
6. The error due to estimation of water level in a choppy sea is reduced owing to theinstability of the boat.
7. Rock underlying softer material is recorded and this valuable information isobtained more cheaply than would be the case where sub-marine borings are taken.Making the soundings
If the depth is less than 25 m, the soundings can be taken when the boat is in motion.In the case of soundings with rod the leadsman stands in the bow and plunges the rod at aforward angle, depending on the speed o the boat, such that the rod is vertical when the boatreaches the point at which soundings is being recorded. The rod should be read very quickly.The nature of the bottom should also be recorded at intervals in the note-book.
If the sounding is taken with a lead, the leadsman stands in the bow of the boat andcasts the lead forward at such a distances that the line will become vertical and will reach thebottom at a point where sounding is required. The lead is withdrawn from the water after thereading is taken. If the depth is great, the lead is not withdrawn from the water, but is liftedbetween the soundings.
The water surface, which is also the reference datum, changes continuously. It is,therefore, essential to take the readings of the tide gauges at regular interval so that thesoundings can be reduced to a fixed datum. To co-relate each sounding with the gaugereading, it is essential to record the time at which each sounding is made.
What are the methods employed in locating soundings?
The soundings are located with reference to the shore traverse by observations made
(i) entirely from the boat, (ii) entirely from the shore or (iii) from both.
The following are the methods of location
1. By cross rope.
SCE 72 Department of Civil Engineering
2. By range and time intervals.
3. By range and one angle from the shore.
4. By range and one angle from the boat.
5. By two angles from the shore.
6. By two angles from the boat.
7. By one angle from shore and one from boat.
8. By intersecting ranges.
9. By tacheometry.
Range.A range or range line is the line on which soundings are taken. They are, in general,
laid perpendicular to the shore line and parallel to each other if the shore is straight or arearranged radiating from a prominent object when the shore line is very irregular.
Shore signals.Each range line is marked by means of signals erected at two points on it at a
considerable distance apart. Signals can be constructed in a variety of ways. They should be
readily seen and easily distinguished from each other. The most satisfactory and economictype of signal is a wooden tripod structure dressed with white and coloured signal of cloth.The position of the signals should be located very accurately since all the soundings are to belocated with reference to these signals.Location by Cross-Rope
This is the most accurate method of locating the soundings and may be used for rivers,narrow lakes and for harbours. It is also used to determine the quantity of materials removedby dredging the soundings being taken before and after the dredging work is done. A singlewire or rope is stretched across the channel etc. as shown in Fig.4.6 and is marked by metaltags at appropriate known distance along the wire from a reference point or zero station onshore. The soundings are then taken by a weighted pole. The position of the pole during asounding is given by the graduated rope or line.
In another method, specially used for harbours etc., a reel boat is used to stretch therope. The zero end of the rope is attached to a spike or any other attachment on one shore. Therope is would on a drum on the reel boat. The reel boat is then rowed across the line ofsounding, thus unwinding the rope as it proceeds. When the reel boat reaches the other shore,its anchor is taken ashore and the rope is wound as tightly as possible. If anchoring is notpossible, the reel is taken ashore and spiked down. Another boat, known as the sounding boat,then starts from the previous shore and soundings are taken against each tag of the rope. Atthe end of the soundings along that line, the reel boat is rowed back along the line thuswinding in the rope. The work thus proceeds.

SCE 73 Department of Civil Engineering
Location by Range and Time IntervalsIn this method, the boat is kept in range with the two signals on the shore and is rowed alongit at constant speed. Soundings are taken at different time intervals. Knowing the constantspeed and the total time elapsed at the instant of sounding, the distance of the total point canbe known along the range. The method is used when the width of channel is small and whengreat degree of accuracy is not required. However, the method is used in conjunction withother methods, in which case the first and the last soundings along a range are located by

SCE 74 Department of Civil Engineering
angles from the shore and the intermediate soundings are located by interpolation according totime intervals.Location by Range and One Angle from the Shore
In this method, the boat is ranged in line with the two shore signals and rowed alongthe ranges. The point where sounding is taken is fixed on the range by observation of theangle from the shore. As the boat proceeds along the shore, other soundings are also fixed bythe observations of angles from the shore. Thus B is the instrument station, A1 A2 is the rangealong which the boat is rowed and α1, α2, α3 etc., are the angles measured at B from points 1,2, 3 etc. The method is very accurate and very convenient for plotting. However, if the angleat the sounding point (say angle β) is less than 30°, the fix becomes poor. The nearer theintersection angle (β) is to a right angle, the better. If the angle diminishes to about 30° a newinstrument station must be chosen. The only defect of the method is that the surveyor does nothave an immediate control in all the observation. If all the points are to be fixed by angularobservations from the shore, a note-keeper will also be required along with the instrumentman at shore since the observations and the recordings are to be done rapidly. Generally, thefirst and last soundings and every tenth sounding are fixed by angular observations and theintermediate points are fixed by time intervals. Thus the points with round mark are fixed byangular observations from the shore and the points with cross marks are fixed by timeintervals. The arrows show the course of the boat, seaward and shoreward on alternatesections.
To fix a point by observations from the shore, the instrument man at B orients his lineof sight towards a shore signal or any other prominent point (known on the plan) when thereading is zero. He then directs the telescope towards the leadsman or the bow of the boat, andis kept continually pointing towards the boat as it moves. The surveyor on the boat holds aflag for a few seconds and on the fall of the flag, the sounding and the angle are observedsimultaneously.
The angles are generally observed to the nearest 5 minutes. The time at which the flagfalls is also recorded both by the instrument man as well as on the boat. In order to avoidacute intersections, the lines of soundings are previously drawn on the plan and suitableinstrument stations are selected.Location by Range and One Angle from the Boat.
The method is exactly similar to the previous one except that the angular fix is madeby angular observation from the boat. The boat is kept in range with the two shore signals andis rowed along it. At the instant the sounding is taken, the angle, subtended at the pointbetween the range and some prominent point B on the sore is measured with the help ofsextant. The telescope is directed on the range signals, and the side object is brought intocoincidence at the instant the sounding is taken. The accuracy and ease of plotting is thesame as obtained in the previous method. Generally, the first and the last soundings, and someof the intermediate soundings are located by angular observations and the rest of thesoundings are located by time intervals.
As compared to the previous methods, this method has the following advantages :
1. Since all the observations are taken from the boat, the surveyor has better controlover the operations.
2. The mistakes in booking are reduced since the recorder books the readings directlyas they are measured.

SCE 75 Department of Civil Engineering
3. On important fixes, check may be obtained by measuring a second angle towardssome other signal on the shore.
4. The obtain good intersections throughout, different shore objects may be used forreference to measure the angles.Location by Two Angles from the Shore
In this method, a point is fixed independent of the range by angular observations fromtwo points on the shore. The method is generally used to locate some isolated points. If thismethod is used on an extensive survey, the boat should be run on a series of approximateranges. Two instruments and two instrument men are required. The position of instrument isselected in such a way that a strong fix is obtained. New instrument stations should be chosenwhen the intersection angle (θ) falls below 30°. Thus A and B are the two instrument stations.The distance d between them is very accurately measured. The instrument stations A and Bare precisely connected to the ground traverse or triangulation, and their positions on plan areknown. With both the plates clamped to zero, the instrument man at A bisects B ; similarlywith both the plates clamped to zero, the instrument man at B bisects A. Both the instrumentmen then direct the line of sight of the telescope towards the leadsman and continuouslyfollow it as the boat moves. The surveyor on the boat holds a flag for a few seconds, and onthe fall of the flag the sounding and the angles are observed simultaneously. The co-ordinatesof the position P of the sounding may be computed from the relations:
The method has got the following advantages:
1. The preliminary work of setting out and erecting range signals is eliminated.
2. It is useful when there are strong currents due to which it is difficult to row the boatalong the range line.
The method is, however, laborious and requires two instruments and two instrument.
Location by Two Angles from the BoatIn this method, the position of the boat can be located by the solution of the three-
point problem by observing the two angles subtended at the boat by three suitable shoreobjects of known position. The three-shore points should be well-defined and clearly visible.Prominent natural objects such as church spire, lighthouse, flagstaff, buoys etc., are selectedfor this purpose. If such points are not available, range poles or shore signals may be taken.Thus A, B and C are the shore objects and P is the position of the boat from which the anglesα and β are measured. Both the angles should be observed simultaneously with the help oftwo sextants, at the instant the sounding is taken. If both the angles are observed by surveyoralone, very little time should be lost in taking the observation. The angles on the circle areread afterwards. The method is used to take the soundings at isolated points. The surveyor hasbetter control on the operations since the survey party is concentrated in one boat. If sufficientnumber of prominent points are available on the shore, preliminary work o setting out anderecting range signals is eliminated. The position of the boat is located by the solution of thethree point problem either analytically or graphically.Location by One Angle from the Shore and the other from the Boat

SCE 76 Department of Civil Engineering
This method is the combination of methods 5 and 6 described above and is used tolocate the isolated points where soundings are taken. Two points A and B are chosen on the

SCE 77 Department of Civil Engineering
shore, one of the points (say A) is the instrument station where a theodolite is set up, and theother (say B) is a shore signal or any other prominent object. At the instant the sounding istaken at P, the angle α at A is measured with the help of a sextant. Knowing the distance dbetween the two points A and B by ground survey, the position of P can be located bycalculating the two co-ordinates x and y.Location by Intersecting Ranges
This method is used when it is required to determine by periodical sounding at thesame points, the rate at which silting or scouring is taking place. This is very essential on theharbors and reservoirs. The position of sounding is located by the intersection of two ranges,thus completely avoiding the angular observations. Suitable signals are erected at the shore.The boat is rowed along a range perpendicular to the shore and soundings are taken at thepoints in which inclined ranges intersect the range, as illustrated in Fig. 4.12. However, inorder to avoid the confusion, a definite system of flagging the range poles is necessary. Theposition of the range poles is determined very accurately by ground survey.Location by Tacheometric Observations
The method is very much useful in smooth waters. The position of the boat is locatedby tacheometric observations from the shore on a staff kept vertically on the boat. Observingthe staff intercept s at the instant the sounding is taken, the horizontal distance between theinstrument stations and the boat is calculated by
The direction of the boat (P) is established by observing the angle (α) at the instrumentstation B with reference to any prominent object A The transit station should be near thewater level so that there will be no need to read vertical angles. The method is unsuitablewhen soundings are taken far from shore.
Explain reduction of soundings with a example.
The reduced soundings are the reduced levels of the sub-marine surface interms of the adopted datum. When the soundings are taken, the depth of water is measuredwith reference to the existing water level at that time. If the gauge readings are also taken atthe same time, the soundings can be reduced to a common unvarying datum. The datum mostcommonly adopted is the ‘mean level of low water of spring tides’ and is written either as
L.W.O.S.T. (low water, ordinary spring tides) or
M.L.W.S. (mean low water springs). For reducing the soundings, a correction equalto the difference of level between the actual water level (read by gauges) and thedatum is applied to the observed soundings, as illustrated in the table given below :
Gauge Reading at L.W.O.S.T. = 3.0 m.
Time Gauge
(m)
Distance Soluction
(m)
Correction Reducedsounding(m)
Remarks

SCE 78 Department of Civil Engineering
8.00
A.M.
3.5 10 2.5 -0.5 2.00
20 3.2 2.7
30 3.9 3.4
40 4.6 4.1
8.10
A.M.
3.5 50 5.3 -0.5 4.8
60 5.4 4.9
70 5.1 4.6
80 4.7 4.2
90 3.6 3.1
8.10
A.M.
3.5 100 2.1 -0.5 1.6
What is three point problem ?How it can be solved ?
Given the three shore signals A, B and C, and the angles α and β subtended by AP, BP
and CP at the boat P, it is required to plot the position of P
1. Mechanical Solution
(i) By Tracing Paper
Protract angles α and β between three radiating lines from any point on a piece oftracing paper. Plot the positions of signals A, B, C on the plan. Applying the tracing paper tothe plan, move it about until all the three rays simultaneously pass through A, B and C. Theapex of the angles is then the position of P which can be pricked through.
(ii) By Station Pointer :
The station pointer is a three-armed protractor and consists of a graduated circle withfixed arm and two movable arms to the either side of the fixed arm. All the three arms havebeveled or fiducial edges. The fiducial edge of the central fixed arm corresponds to the zero ofthe circle. The fiducial edges of the two moving arms can be set to any desired reading andcan be clamped in position. They are also provided with verniers and slow motion screws to
SCE 79 Department of Civil Engineering
set the angle very precisely. To plot position of P, the movable arms are clamped to read theangles α and β very precisely. The station pointer is then moved on the plan till the threefiducial edges simultaneously touch A, B and C. The centre of the pointer then represents theposition of P which can be recorded by a prick mark.2. Graphical Solutions
(a) First Method :
Let a, b and c be the plotted positions of the shore signals A, B and C respectively andlet α and β be the angles subtended at the boat. The point p of the boat position p can beobtained as under :
1. Join a and c.
2. At a, draw ad making an angle β with ac. At c, draw cd making an angle α with ca. Let
both these lines meet at d.
3. Draw a circle passing through the points a, d and c.
4. Join d and b, and prolong it to meet the circle at the point p which is the requiredposition of the boat.
Proof. From the properties of a circle,apd = acd = α and cpd = cad = β
which is the required condition for the solution.
(b) Second Method :
Join ab and bc.
1. From a and b, draw lines ao1 and bo1 each making an angle (90° - α) with ab on the
side towards p. Let them intersect at 01.
2. Similarly, from b and c, draw lines ================ each making an angle (90° -
β) with ab on the side towards p. Let them intersect at --.
3. With – as the centre, draw a circle to pass through a and b. Similarly, with – as thecentre draw a circle to pass through b and c. Let both the circles intersect each other ata point p. p is then the required position of the boat.

SCE 80 Department of Civil Engineering
Proof. ao1b = 180° - 2 (90° - α) = 2α
apb = ½ao1b = α
Similarly, bo2c = 180° - 2 (90° - β) = 2β
And bpc = ½bo2c = β.
The above method is sometimes known as the method of two intersecting circles.
(c) Third Method :
1. Join ab and bc.
2. At a and c, erect perpendiculars ad and ce.
3. At b, draw a line bd subtending angle (90° - α) with ba, to meet the perpendicular
through a in d.
4. Similarly, draw a line be subtending an angle (90° - β) with bc, to meet the
perpendicular through c in e.
5. Join d and e.
6. Drop a perpendicular on de from b. The foot of the perpendicular (i.e. p) is then therequired position of the boat.
9. What are tides? Explain its types and formation.
All celestial bodies exert a gravitational force on each other. These forces of attractionbetween earth and other celestial bodies (mainly moon and sun) cause periodical variations inthe level of a water surface, commonly known as tides. There are several theories about thetides but none adequately explains all the phenomenon of tides. However, the commonly usedtheory is after Newton, and is known as the equilibrium theory. According to this theory, aforce of attraction exists between two celestial bodies, acting in the straight line joining thecentre of masses of the two bodies, and the magnitude of this force is proportional to theproduct of the masses of the bodies and is inversely proportional to the square of the distancebetween them. We shall apply this theory to the tides produced on earth due to the force ofattraction between earth and moon. However, the following assumptions are made in theequilibrium theory :
1. The earth is covered all round by an ocean of uniform depth.
2. The ocean is capable of assuming instantaneously the equilibrium , required by the tideproducing forces. This is possible if we neglect (i) inertia of water, (ii) viscosity of water,and (iii) force of attraction between parts of itself.

SCE 81 Department of Civil Engineering
1. The Lunar Tides
(a) shows the earth and the moon, with their centres of masses O1 and O2 respectively.Since moon is very near to the earth, it is the major tide producing force. To start with, wewill ignore the daily rotation of the earth on its axis. Both earth and moon attract each other,and the force of attraction would act along O1O2. Let O be the common centre of gravity ofearth and moon. The earth and moon revolve monthly about O, and due to this revolutiontheir separate positions are maintained. The distribution of force is not uniform, but it is morefor the points facing the moon and less for remote points. Due to the revolution of earth aboutthe common centre of gravity O, centrifugal force of uniform intensity is exerted on all theparticles of the earth. The direction of this centrifugal force is parallel to O1O2 and actsoutward. Thus, the total force of attraction due to moon is counter-balanced by the totalcentrifugal force, and the earth maintains its position relative to the moon. However, sincethe fore of attraction is not uniform, the resultant force will very all along. The resultantforces are the tide producing forces. Assuming that water has no inertia and viscosity, theocean enveloping the earth’s surface will adjust itself to the unbalanced resultant forces,giving rise to the equilibrium. Thus, there are two lunar tides at A and B, and two low wate
positions at C and D. The tide at A is called the superior lunar tide or tide of moon’s uppertransit, While tide at B is called inferior or antilunar tide.
Now let us consider the earth’s rotation on its axis. Assuming the moon to remainstationary, the major axis of lunar tidal equilibrium figure would maintain a constant position.Due to rotation of earth about its axis from west to east, once in 24 hours, point A wouldoccupy successive position C, B and D at intervals of 6 h. Thus, point A would experienceregular variation in the level of water. It will experience high water (tide) at intervals of 12 hand low water midway between. This interval of 6 h variation is true only if moon is assumedstationary. However, in a lunation of 29.53 days the moon makes one revolution relative tosun from the new moon to new moon. This revolution is in the same direction as the diurnalrotation of earth, and hence there are 29.53 transits of moon across a meridian in 29.53 meansolar days. This is on the assumption that the moon does this revolution in a plane passingthrough the equator. Thus, the interval between successive transits of moon or any meridianwill be 24 h, 50.5 m. Thus, the average interval between successive high waters would beabout 12 h 25 m. The interval of 24 h 50.5 m between two successive transits of moon over ameridian is called the tidal day.2. The Solar Tides
The phenomenon of production of tides due to force of attraction between earth and sun issimilar to the lunar tides. Thus, there will be superior solar tide and an inferior or anti-solartide. However, sun is at a large distance from the earth and hence the tide producing force dueto sun is much less.
Solar tide = 0.458 Lunar tide.
Combined effect : Spring and neap tides
SCE 82 Department of Civil Engineering
Solar tide = 0.458 Lunar tide.
Above equation shows that the solar tide force is less than half the lunar tide force.However, their combined effect is important, specially at the new moon when both the sunand moon have the same celestial longitude, they cross a meridian at the same instant.
Assuming that both the sun and moon lie in the same horizontal plane passing through theequator, the effects of both the tides are added, giving rise to maximum or spring tide of newmoon. The term ‘spring’ does not refer to the season, but to the springing or waxing of themoon. After the new moon, the moon falls behind the sun and crosses each meridian 50minutes later each day. In after 7 ½ days, the difference between longitude of the moon andthat of sun becomes 90°, and the moon is in quadrature. The crest of moon tide coincideswith the trough of the solar tide, giving rise to the neap tide of the first quarter. During theneap tide, the high water level is below the average while the low water level is above theaverage. After about 15 days of the start of lunation, when full moon occurs, the differencebetween moon’s longitude and of sun’s longitude is 180°, and the moon is in opposition.However, the crests of both the tides coincide, giving rise to spring tide of full moon. In about22 days after the start of lunation, the difference in longitudes of the moon and the sunbecomes 270° and neap tide of third quarter is formed. Finally, when the moon reaches to itsnew moon position, after about 29 ½ days of the previous new moon, both of them have thesame celestial longitude and the spring tide of new moon is again formed making thebeginning of another cycle of spring and neap tides.
4. Other Effects
The length of the tidal day, assumed to be 24 hours and 50.5 minutes is not constantbecause of (i) varying relative positions of the sun and moon, (ii) relative attraction of the sunand moon, (iii) ellipticity of the orbit of the moon (assumed circular earlier) and earth, (v)declination (or deviation from the plane of equator) of the sun and the moon, (v) effects of theland masses and (vi) deviation of the shape of the earth from the spheroid. Due to these, thehigh water at a place may not occur exactly at the moon’s upper or lower transit. The effect ofvarying relative positions of the sun and moon gives rise to what are known as priming of tideand lagging of tide.
At the new moon position, the crest of the composite tide is under the moon andnormal tide is formed. For the positions of the moon between new moon and first quarter, thehigh water at any place occurs before the moon’s transit, the interval between successive high
Water is less than the average of 12 hours 25 minutes and the tide is said to prime.For positions of moon between the first quarter and the full moon, the high water at any placeoccurs after the moon transits, the interval between successive high water is more than theaverage, and tide is said to lag. Similarly, between full moon and 3rd quarter position, thetide primes while between the 3rd quarter and full moon position, the tide lags. At firstquarter, full moon and third quarter position of moon, normal tide occurs.
Due to the several assumptions made in the equilibrium theory, and due to severalother factors affecting the magnitude and period of tides, close agreement between the resultsof the theory, and the actual field observations is not available. Due to obstruction of landmasses, tide may be heaped up at some places. Due to inertia and viscosity of sea water,

SCE 83 Department of Civil Engineering
equilibrium figure is not achieved instantaneously. Hence prediction of the tides at a placemust be based largely on observations.
5.4 MEAN SEA LEVEL? EXPLAIN WHY IT IS USED AS DATUM.
For all important surveys, the datum selected is the mean sea level at a certain place.The mean sea level may be defined as the mean level of the sea, obtained by taking the meanof all the height of the tide, as measured at hourly intervals over some stated period covering awhole number of complete tides, The mean sea level, defined above shows appreciablevariations from day to day, from month to month and from year to year. Hence the period forwhich observations should be taken depends upon the purpose for which levels are required.The daily changes in the level of sea may be more. The monthly changes are more or lessperiodic. The mean sea level in particular month may be low while it may be high in someother moths. Mean sea level may also show appreciable variations in its annual values. Due tovariations in the annual values and due to greater accuracy needed in modern geodeticlevelling, it is essential to base the mean sea level on observations extending over a period ofabout 19 years. During this period, the moon’s nodes complete one entire revolution. Theheight of mean sea level so determined is referred to the datum of tide gauge at which theobservations are taken. The point or place at which these observations are taken is known as atidal station. If the observations are taken on two stations, situated say at a distance of 200 to500 kms on an open coast, one of the station is called primary tidal station while the other iscalled secondary tidal station. Both the stations may then be connected by a line of levels.
5.5 ASTRONOMICAL SURVEYING
Celestial Sphere.
The millions of stars that we see in the sky on a clear cloudless night are all at varying distancesfrom us. Since we are concerned with their relative distance rather than their actual distancefrom the observer. It is exceedingly convenient to picture the stars as distributed over thesurface of an imaginary spherical sky having its center at the position of the observer. Thisimaginary sphere on which the star appear to lie or to be studded is known as the celestialsphere. The radius of the celestial sphere may be of any value – from a few thousandmetres to a few thousand kilometers. Since the stars are very distant from us, the center of theearth may be taken as the center of the celestial sphere.
Zenith, Nadir and Celestial Horizon.
The Zenith (Z) is the point on the upper portion of the celestial sphere marked by plumb lineabove the observer. It is thus the point on the celestial sphere immediately above the observer’sstation.The Nadir (Z’) is the point on the lower portion of the celestial sphere marked by the plum linebelow the observer. It is thus the point on the celestial sphere vertically below the observer’sstation.Celestial Horizon. (True or Rational horizon or geocentric horizon): It is the great circle tracedupon the celestial sphere by that plane which is perpendicular to the Zenith-Nadir line, and

SCE 84 Department of Civil Engineering
which passes through the center of the earth. (Great circle is a section of a sphere when thecutting plane passes through the center of the sphere).
Terrestrial Poles and Equator, Celestial Poles and Equator.The terrestrial poles are the two points in which the earth’s axis of rotation meets the
earth’s sphere. The terrestrial equator is the great circle of the earth, the plane of which isat right angles to the axis of rotation. The two poles are equidistant from it.If the earth’s axis of rotation is produced indefinitely, it will meet the celestial sphere intwo points called the north and south celestial poles (P and P’). The celestial equator is thegreat circle of the celestial sphere in which it is intersected by the plane of terrestrialequator.
5.5.1 CO-ALTITUDE OR ZENITH DISTANCE (Z) AND AZIMUTH (A).
It is the angular distance of heavenly body from the zenith. It is the complementor the altitude, i.e z = (90° - α).The azimuth of a heavenly body is the angle between the observer’s meridian and thevertical circle passing through the body.
Determine the hour angle and declination of a star from the following data:
(i) Altitude of the star = 22° 36’
(ii)
(iii)
Azimuth of the star
Latitude of the place of observation
= 42° W
= 40° N.
Solution.
Since the azimuth of the star is 42° W, the star is in the western hemi-sphere.
In the astronomical PZM, we have
PZ = co-latitude = 90° - 40° = 50° ;
ZM = co-altitude = 90° - 22° 36° = 67 24’ ;
angle A = 42°
Knowing the two sides and the included angle, the third side can be calculated from
the cosine formula
Thus, cos PM = cos PZ . cos ZM + sin PZ. Sin ZM. cos A
= cos 50°. cos 67° 24’ + sin 50°. sin 67° 24’. cos 42°
= 0.24702 + 0.52556 = 0.77258
PM = 39° 25’
Declination of the star = = 90° - PM = 90° - 39° 25’ = 50° 35’ N.

SCE 85 Department of Civil Engineering
Similarly, knowing all the three sides, the hour angle H can be calculated from Eq.
1.2
cos H cos ZM cos PZ.cos PM
sin PZ.sin PM
cos 6724'cos 50.cos3925'sin 50.sin 3925'
= 0.38430 0.49659
0.230860.48640
cos ( 180° - H ) = 0.23086 180° - H = 76° 39’
H = 103° 21’.

UNIT-I2-Marks
1. Define Tacheometry:
i. Tacheometry is a branch of angular surveying in which the horizontal andvertical distances (or) points are obtained by optional means as opposed tothe ordinary slower process of measurements by chain (or) tape.
2. Define Tacheometer:
i. It is an ordinary transit theodolite fitted with an extra lens called analyticlens. The purpose of fitting the analytic lens is to reduce the additive constantto zero.
3. Define Analytic lens:
a. Analytic lens is an additional lens placed between the diaphragm and the objectiveat a
4. fixed distance from the objective. This lens will be fitted in ordinary transit theodolite. Afterfitting this additional lens the telescope is called as external focusing analytic telescope. Thepurpose of fitting the analytic lens is to reduce the additive constant to zero.
5. Define Substance bar:
a. A Substance bar is manufactured by Mr. Kern. The length of the substance bar is 2m(6ft)
6. for measurement of comparatively short distance in a traverse. A Substance bar may beused as a substance base. The length of the bar is made equal to the distance between thetwo targets.
7. What are the merits and demerits of movable hair method?Merits:
i. Long sights can be taken with greater accuracy than stadiamethod The error obtained is minimum
b. Demerits:
i. The computations are notquicker Careful observationis essential

8. Fixed hair method:
a. In this method, the stadia wires are fixed (or) fitted at constant distance apart.
9. Staff intercept:
a. The difference of the reading corresponding to the top and bottom stadia wires.
10. Stadia intercept:
a. The difference of the distance between the top and bottom cross hairs. In this methodstadia interval is variable. The staff intercept is kept fixed
while the stadia
b. interval is variable.
11. The tangential method:
a. In this method, the stadia hairs are not for taking readings. The readings being takenagainst the horizontal cross hair.
12. What are the systems of tacheometry measurements?
a. The stadiasystem Thetangentialsystem
b. Measurement by means of special instrument.
13. What are the types of stadia system?
a. Fixed hair method, Movable hair method
14. What is the principle of stadia method?
a. The method is based on the principle that the ratio of the perpendicular to the base isconstant to similar isosceles triangle.
1. Permanent Bench mark:UNIT - II
These are established by different government departments like PWD, Railways, Irrigation etc., The RL ofthese points are determined with reference to G.T.S Benchmarks. Points on rocks, culvert, gate, pillars etc.
2. Temporary Bench mark:
These are established temporarily whenever required. These are generally chosen to close the day’s workand to start the next days. Points on roofs, walls, basements etc
3. Arbitrary Bench Mark:
When the RL of some fixed Points are assumed, they are termed a arbitrary Bench mark
4. Extension of baseline:
The length of baseline is usually not greater than 10 to 20 km. As it is not a often possible to sewed afavorable sight for a longer base. They usually practice is therefore to use short base & Extend it by means.Of forming well conditioned triangles.
5. Trigonometrical levelling:
Trigonometrical levelling is the process of determining the differences of elevation of the given station fromobserved vertical angles and known distance.
6. Axis Signal correction :
If the height of the signed is not the same as that of height of the instrument axis above the station, acorrection known as the axis signal correction or eye & objective correction is to be applied.
7. Geodetic Surveying :
In this surveying, the shape of the earth is taken into account and all the lines lying in the surface are curvedlines. It is used for area greater than 250km2. It is accurate. It is conducted by great geometrical survey ofIndia.
8. Baseline :
The Base line is laid down with great accuracy of measurement & alignment as it forms the basis for thecomputations of triangulation system the lengthof the base line depends upon the grades of the triangulation.
9. Laplace Station :At certain station, astronomical observations for azimuth & longitude are also made on the station is calledLaplace station

10. Triangulation :
Triangulation is nothing but the system consists of not of interconnected triangles. In this method, knowingthe length of one side and three angles, the length of other two sides of each triangle can be computed.
11. Signals :
A Signal any object such as a pole target erected at a station upon which a sight is taken by a observer atanother station.
12. Satellite Station :
A subsidiary station is established as near the true or principal station as possible, the station so establishedis called a satellite station or eccentric station or false station.
13. Reduction to centre:
If the true station were occupied by computing the corrections and apply them algebraically to the observedvalues is generally known as reduction of centre.
14. Base net:
A series of triangles connecting the baseline to the main triangulation is called base net.
15. Bench marking :
It is a fined reference point of known elevation.
16. Types of Bench Mark:
Great Trigonometric survey Bench mark
Permanent Bench mark
Arbitrary Bench mark
Temporary Bench mark17. Equipments used for base line measurement:
Marking stakes or tripodStraining deviceSupporting stakes or tripodSteel tape
Six number of thermometer.
18. Methods used to measure baseline
Rigid bar method
Wheeler’s method
Jaderin’s method
Hunter’s short base methodTacheometric method
19. Two types of Trigonometrically leveling:
Plane Trigonometrical levelling
Geodetic Trigonometrical levelling
20. Apparatus used in Baseline:
Rigid Bars
Flexible apparatus
21. Corrections made while calculation of true length
Correction for absolute length
Correction for temperature
Correction for pull or tension
Correction for Sag
Correction for Slope
UNIT-III2-Marks
1. Errors:
Mistakes (or) gross ErrorsSystematic (or) Cumulative ErrorsAccidental (or) Random Errors
2. Mistakes (or) Gauss Errors:
Depends upon the observer, a mistake cannot be corrected unless the observer gettraining. The mistakes are errors that arise from inattention, inexperience, carelessnessand poor judgement of confusion in the mind of observer.
3. Systematic Errors:
The systematic error is an error that under the same conditions will always be of the samesize and sign. It is simply due to the error in instrument. These errors may be regarded aspositive or negative according with whether they make the result too small (or) too great.This effect is cumulative.
4. Accidental Errors:
The Accidental Errors are those which remain after mistakes and systematical errors havebeen eliminated and are caused by the combination of reasons beyond the ability of theobserver to control.
5. Classification of Observer Quantity:
An observer quantity may be classifiedas Independent QuantityConditioned Quantity
6. Independent Quantity:
It is the one whose value is independent of the values of other quantities. It bears norelation with any other quantity and hence change in the other quantities does not affect
the value of this quantity. eg. R.L of B.M
7. Conditioned Quantity:
It is the one whose value is dependent upon the values of one (or) morequantities. Its values bear a rigid relation to some other quantities. It is also called“dependent quantities”.

8. Conditioned Equation:
The conditioned equation is the equation expressing the relation existing b/w theseveral dependent quantities. eg. In a ABC A+B+C= 180 . It is a conditionedequation.
9. Observation:
An observation is a numerical value of the measured quantity and may be either direct(or) indirect.
10. Direct Observation:
A direct observation is the one made directly on the quantity beingdetermined. Eg: Measurement of base line.
11. Indirect Observation:
An indirect observation is one in which the observed value is deduced from themeasurement of some related quantities.
Eg: Measurement of Angle by repetition method.
12. Weight of an Observation:
The weight of an observation is a number giving an indication of its precision andtrust worthiness, when making a comparison between several quantities of differentworth.
If a certain observation of weight 4 it means that it is 4 times as much reliable as anobservation of weight 1.
When two quantities (or) observations are assumed to be equally reliable, theobserved values are said to be of equal weight (or) of unit weight.
13. Weighted Observations:
Observations are weighted when different weights are assigned tothem. Eg: A=30040’- wt 3It means A is measured 3 times.
14. Observed value of a Quantity:
An observed value of a quantity is a value obtained when it is corrected for all theknown errors. Observed value = Measured value ± errors (or) corrections.
15. True value of Quantity:
It is the value which is obsolute free from all the errors.

16. True Error:
A true error is the difference b/w the true value of the quantity and its observedvalue. True value = True value – observed value
The most probable value of the quantity is the value which is more likely to be thetrue value then any other value.
17. Most probable Errors:
It is defined as the quantity which added to and subtracted from the most probablevalue, fixes the limit within which it is an even chance the true value of the measuredquantity must lie.
18. Residual Error:
It is diff b/w the most probable value of the quantity and its observedvalue. Residual Errors = most probable value – observed value
19. Observation Equation:
It is the relation b/w the observed quantity and its numerical value.
20. Normal Equation:
It is the education which is formed by the multiplying each equation by the co-efficient of the unknown, whose normal equation is to be formed out by adding theequation thus formed.
UNIT- IV2-Marks
1. Celestial sphere :
It is an imaginary sphere on which the stars appear to lie or to be studded is known as theCelestial sphere.
2. Zenith (z) :
It is the point on the upper portion of the celestial sphere marked by plumb line above theobserver. It is the point on the celestial sphere immediately above the observer’s station.
3. Nadir (Z’, or, N):
It is the point on the lower portion of the celestial sphere marked by plumb line below theobserver. It is the point on the celestial sphere vertically below the observer’s station.

4. Celestial Horizon:
It is also called true or Rational horizon or geocentric horizon. It is the great circle tracedupon the celestial sphere by that plane which is perpendicular to the zenith –Nadir lineand which passes through the centre of the earth.
5. The terrestrial poles and equator :
The terrestrial poles are the two points in which the earth’s axis of notation meets theearth’s sphere.The terrestrial equator is the greet circle of the earth, the plane of which is at right anglesto the axis of notation. The two poles are equidistant from it.
6. The celestial poles and equator :
If the earth’s axis of rotation is produced indefinitely, it will meet the celestial sphere intwo points called the North & South celestial poles (P and
P’).
The celestial equator is the great circle of the celestial sphere in which it is intersected byhe plane or terrestrial equator.
7. Sensible horizon:
It is a circle in which a plane passing through the point of observation and tangential tothe earth’s surface intersects with celestial sphere. The line of sight of an accuratelyleveled telescope lies in this plane.
8. Visible horizon :
It is a circle of contact, with the earth, of the cone of visual rays passing through the pointof observation.
9. Vertical circle :
A vertical circle of the celestial sphere is great circle passing through the zenith andnadir. They all cut the celestial horizon at right angles.
10. The Observers Meridian:
The meridian of any particular point is that circle which passes through the zenith andnadir of the point as well as through the poles.
11. Prime vertical:It is the particular vertical circle which is at right angles to the meridian and whichtherefore passes through the east & west points of horizon.
12. Latitude (θ ):It is the angular distance of any place on the earth’s surface north or south of the equator,and is measured on the meridian of the place. It is also defined as the angle between thezenith and the celestial equator.

13. The co-latitude :
The co-latitude of a place is the angular distance from the zenith to the pole. It is thecomplement of the latitude and equal to (900-θ ).
14. The longitude (Ф):
The longitude of a place is the angle between a fixed reference meridian called the primeor first meridian and the meridian of the place.
15. The altitude (α):
The altitude of celestial or heavenly body (i.e., a sun or star) is its angular distance abovethe horizon, measured on the vertical circle passing through the body.
16. The co-altitude or zenith distance (z):
It is the angular distance of heavenly body from the zenith. It is the complement of thealtitude.
17. The Azimuth:
The azimuth of a heavenly body is the angle between the observer’s meridian and thevertical circle passing through the body.
18. The Declination:The declination f a celestial body is angular distance from the plane of the equator,measured along the star’s meridian generally called the declination circle. Declinationvaries from 00 to 900, and is marked + or – according as the body is north or south of theequator.
19. Hour circle:
Hour circles are great circles passing through the north and south celestial poles. The
declination circle of a heavenly body is thus its hour circle.
20. The hour angle:
The hour angle of a heavenly body is the angle between the observer’s meridian and thedeclination circle passing through the body. The hour angle is always measuredwestwards.
UNIT – V (2-Marks)
1. Hydrographic Survey:
Hydrographic Survey is that branch of surveying which deals with the measurement ofbodies of water. It is the art of delineating the submarine levels, contours and features ofseas, gulfs, rivers and lakes.
2. Sounding :
The measurement of depth below the water surface is called sounding.
3. Tides:
All celestial bodies exert a gravitational force on each other. These forces of attractionbetween earth & other celestial bodies cause periodical variations in the level of watersurface, known as tides.
4. Equilibrium Theory :
The earth is covered all around by the ocean of uniform depth. The ocean is capable ofassuming the equilibrium.
5. Mean sea level :
Mean sea level may be defined as the mean level of the sea, obtained by taking the meanof all the height of the tide as measured at hourly intervals over some states periodcovering a whole number of complete tides.
6. Fathometer :
A fathometer is used for ocean sounding where the depth of water is too much and tomake a continuous and accurate record of depth of water below the boat or ship at whichit is installed.
7. Photographic Survey :
It is also called photogrametry. It is a method of surveying in which plant or maps are
prepared from photographs taken from Suitable camera station. It is divided into two.
Terrestrial photographyAerial photography
8. Photo theodolite:
It is the combination of photo with theodolite and is used for taking photographs &measuring the angles which the vertical plane of collimation makes with the base line.
9. Stereoscopic pairs:
It means two photos are obtained for a Single object from two point one at each.
10. Parallax:
In normal binocular vision the apparent movement of a point viewed first with one eye
and then the other is known a parallax.
11. Angle of Parallax:
It is the angle of convergence of the two rays of vision.
12. Stereoscopic fusion:
If a pair of photographs is taken of an object from two slightly different positions of thecamera and then viewed by an apparatus which ensures that the left eye sees only the left-hand picture & right eye is directed to the right hand picture, the two separate images ofthe object will fuse together is the brain to provide the observer with spatial impression.This is known as a Stereoscopic fusion.
13. Stereo pair:
The pair of two such photographs is known as stereo pair. The effect of distortions existin a single photograph may be eliminated through a large extend of stereo pairs.
14. Parallax bar:
A parallax bar used to measure difference of two points, consists of a bar which holds afixed plate of transparent material near the left end and a movable plate to the right end.
15. Floating mark:
In parallax bar, when the two dots are viewed properly under a stereoscope they fuse intoa single dot called floating mark.
16. Mosaics :
Such an assembly of getting series of overlapping photograph is called mosaic.17. Types of EDM instrument :
TellurimeterGeodimeterDistomats
18. Cartography :It is the marking and study of maps in all their aspects. It is an important branch ofgraphics, since it is an extremely efficient way of manipulating, analyzing, & expressingideas, forms & relationships that occur in two & three dimensional space.
19. Cadastral survey :
Cadastral means, “Registration concern Land Survey”. It is of one of based on nationalland survey based on land survey law.
20. Modulation :
AmplitudemodulationFrequencymodulation
In amplitude modulation, the carrier wave has constant frequency & the modulating wave(the measurement wave) in formation is conveyed by the amplitude of the carrier wave.In the frequency modulation the carrier wave has constant amplitude, while the frequencyvaries in proportion to the amplitude of the modulation wave.
21. Methods of Measuring Velocity flow:
Surface floatSub surface floatVelocity ropesPicot tube method &Current meter mean.

www.rejinpaul.com
www.rejinpaul.com
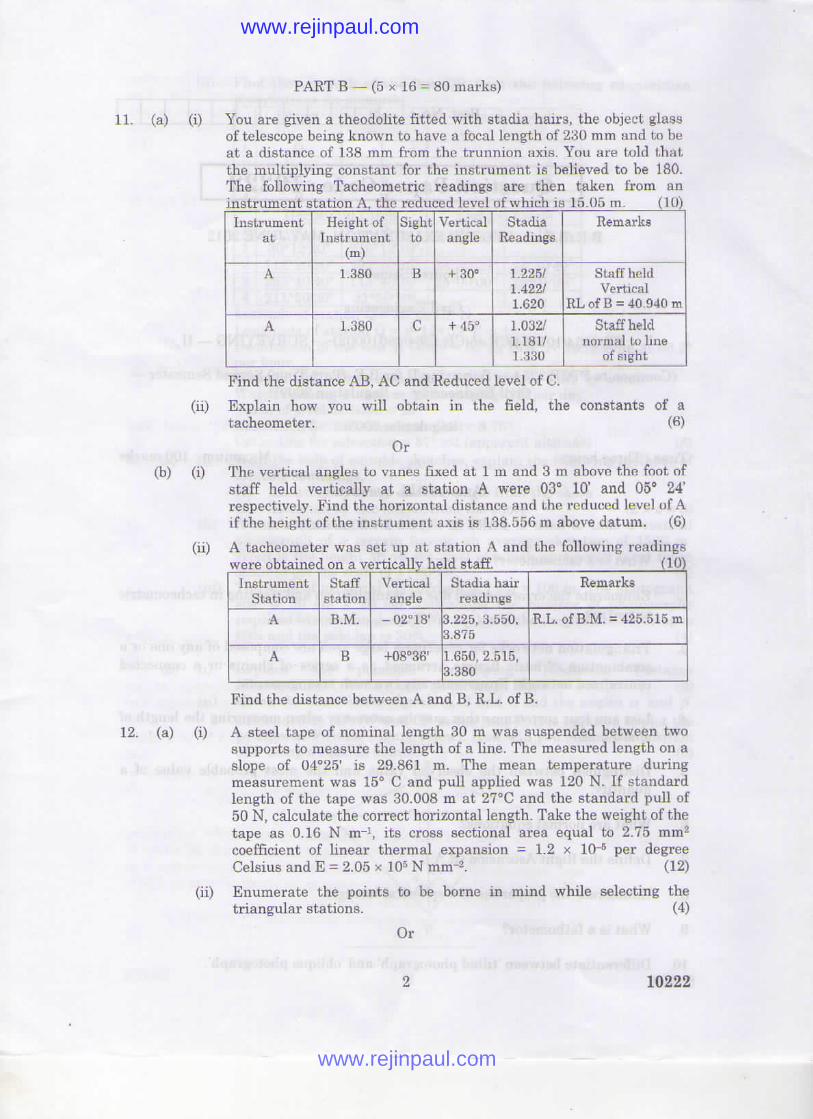
www.rejinpaul.com
www.rejinpaul.com
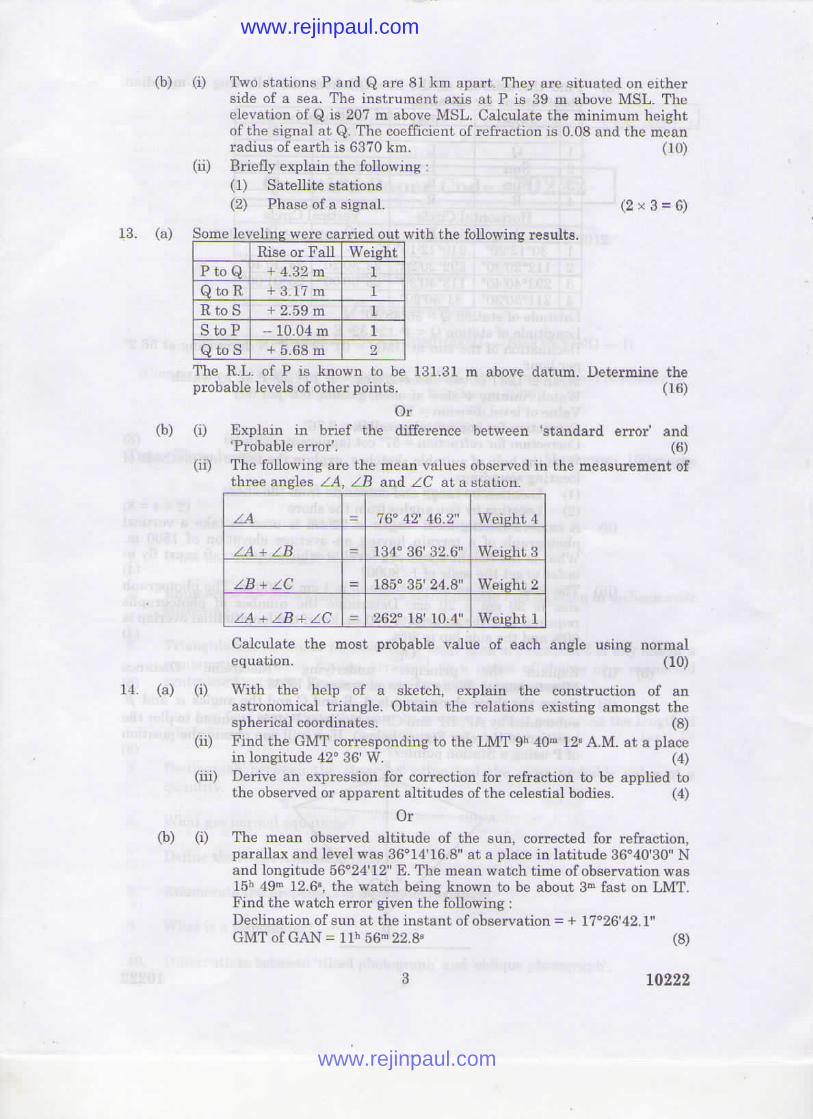
www.rejinpaul.com
www.rejinpaul.com

www.rejinpaul.com
www.rejinpaul.com
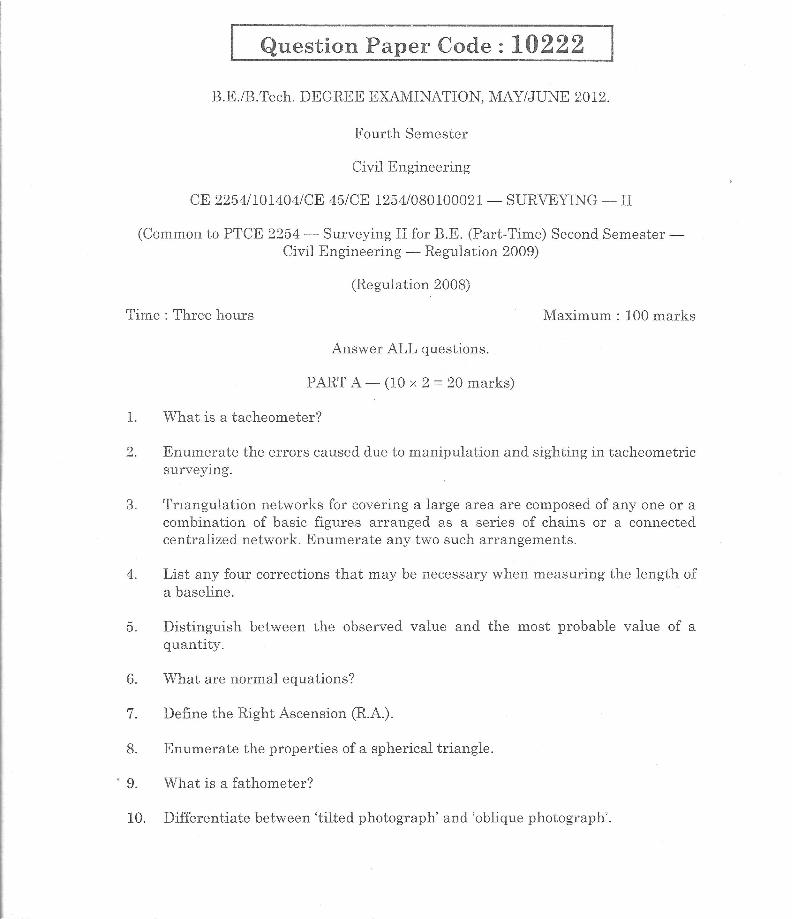
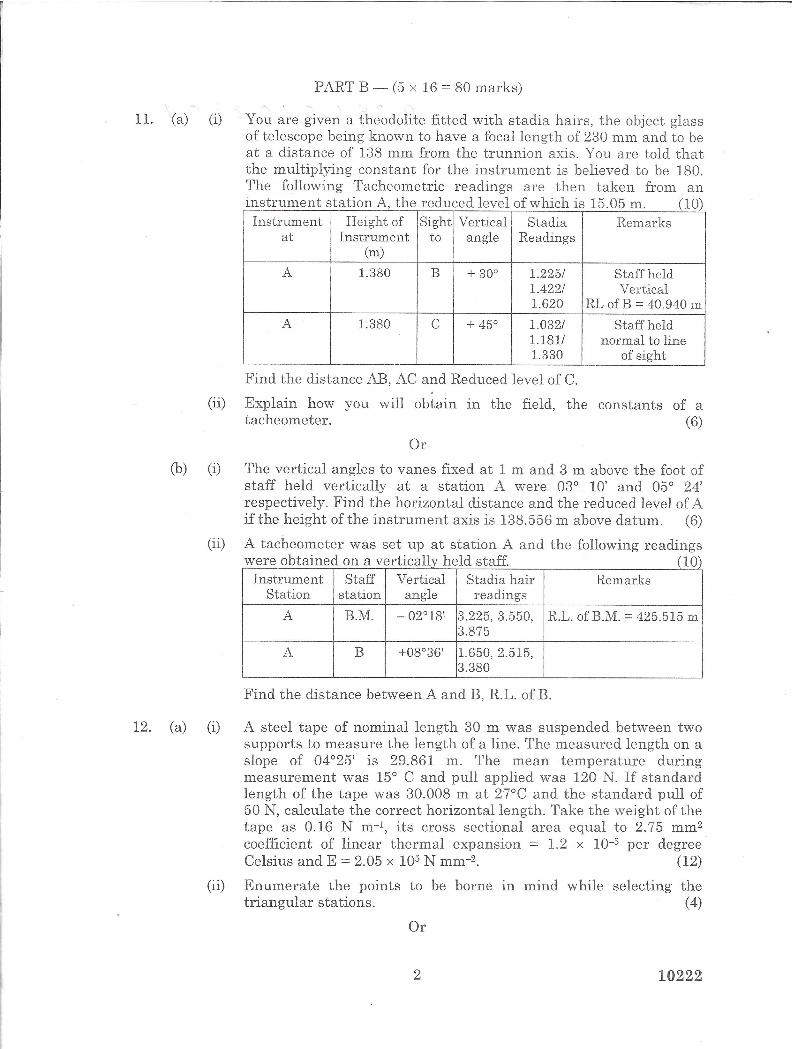

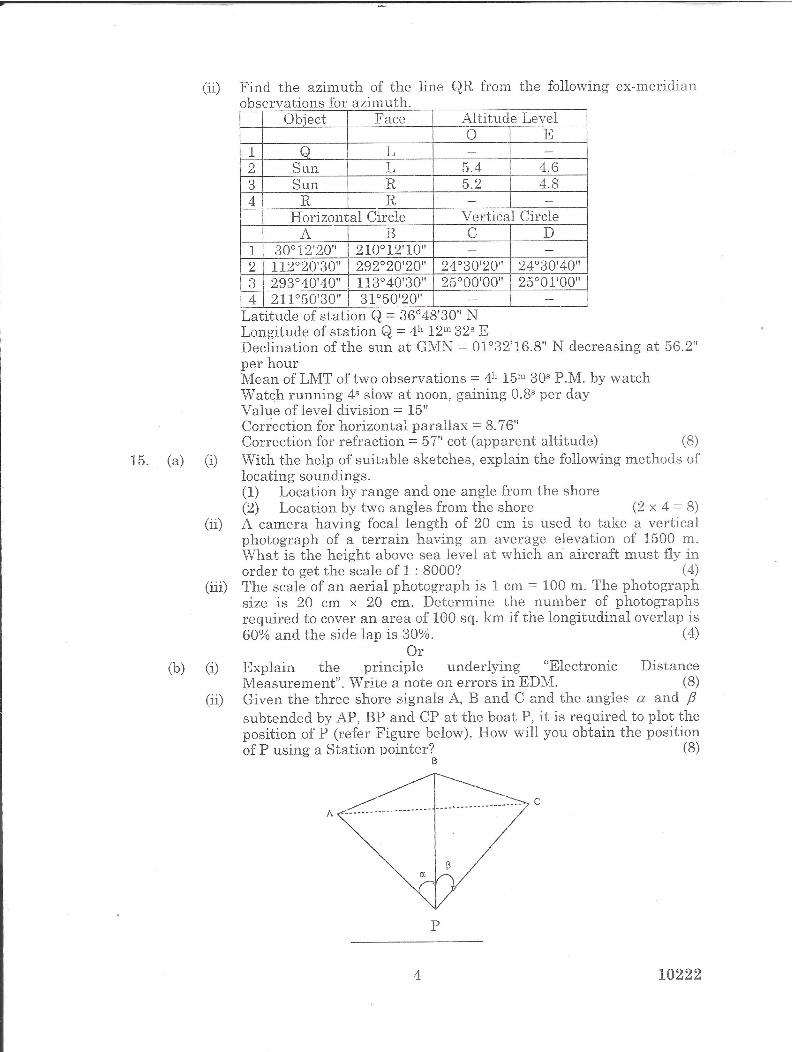
Reg. No. :
B.E./B.Tech. DEGREE EXAMINATION, APRIL/MAY 2010
Fourth Semester
Civil Engineering
CE2254 — SURVEYING – II
(Regulation 2008)
Time: Three hours Maximum: 100 Marks
Answer ALL Questions
PART A — (10 × 2 = 20 marks)
1. Why is an anallactic lens provided in tacheometer?
2. What are the multiplying constant and additive constant of a tacheometer?
3. What is meant by phase of a signal?
4. What do you understand by eccentricity of signal?
5. Define conditioned quantity.
6. What is meant by weight of an observation?
7. What is equation of time?
8. Distinguish between latitude and co-latitude.
9. What do you understand by parallax?
10. Distinguish between crab and drift.
Question Paper Code: E3049

E 3049 2
PART B — (5 × 16 = 80 Marks)
11. (a) (i) Derive the expressions for horizontal and vertical distance by fixed
hair method when the line of sight is inclined and staff is held
vertically. (8)
(ii) Determine the gradient from a point P to a point Q from the
following observations carried out with a tacheometer fitted with an
anallactic lens.
Instrument station Staff point Bearing Vertical angle Staff readings
O P 340º +17º 0.760, 1.455, 2.170
O Q 70º +12º 0.655, 1.845, 3.150
Assume that the staff is held vertical and that the multiplying
constant of the instrument is 100. (8)
Or
(b) (i) Explain the objectives and theory of the anallactic lens. (8)
(ii) The following are the observations taken by a theodolite.
Inst. station Staff station Target Vertical angle Staff reading Remarks
A BM Lower –12º 0.650 RL of the bench
mark = 500.500 m Upper –9º 2.550
A B Lower –6º 1.255
Upper +4º 3.100
Find out the R.L of B and the distance between the BM and
station B. (8)
12. (a) (i) What is meant by a satellite station and reduction to centre? Derive
the expression for reducing the angles measured at the satellite
station to centre. (8)
(ii) The following observations were made on a satellite station S to
determine angle BAC.
Line Length Line Bearing
SA 9.500 m SA 0º 00'00''
AB 2950 m SB 78º 46' 00''
AC 3525 m SC 100º 15' 00''
Calculate the angle BAC. (8)
Or
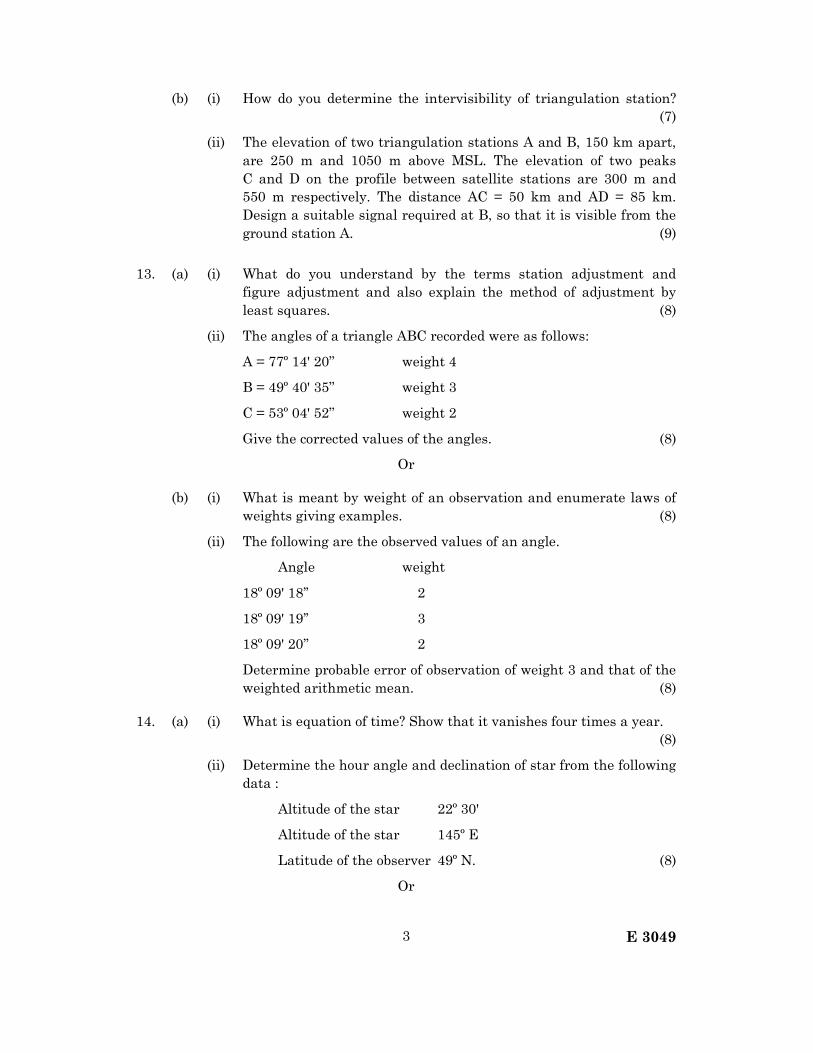
E 3049 3
(b) (i) How do you determine the intervisibility of triangulation station?
(7)
(ii) The elevation of two triangulation stations A and B, 150 km apart,
are 250 m and 1050 m above MSL. The elevation of two peaks
C and D on the profile between satellite stations are 300 m and
550 m respectively. The distance AC = 50 km and AD = 85 km.
Design a suitable signal required at B, so that it is visible from the
ground station A. (9)
13. (a) (i) What do you understand by the terms station adjustment and
figure adjustment and also explain the method of adjustment by
least squares. (8)
(ii) The angles of a triangle ABC recorded were as follows:
A = 77º 14' 20’’ weight 4
B = 49º 40' 35’’ weight 3
C = 53º 04' 52’’ weight 2
Give the corrected values of the angles. (8)
Or
(b) (i) What is meant by weight of an observation and enumerate laws of
weights giving examples. (8)
(ii) The following are the observed values of an angle.
Angle weight
18º 09' 18’’ 2
18º 09' 19’’ 3
18º 09' 20’’ 2
Determine probable error of observation of weight 3 and that of the
weighted arithmetic mean. (8)
14. (a) (i) What is equation of time? Show that it vanishes four times a year.
(8)
(ii) Determine the hour angle and declination of star from the following
data :
Altitude of the star 22º 30'
Altitude of the star 145º E
Latitude of the observer 49º N. (8)
Or

E 3049 4
(b) (i) What are parallax and refraction and how do they affect the
measurements of vertical angles in astronomical work? (8)
(ii) If the GST of GMN is 13h 29m 28s, what will be the HA of the star of
RA 22h 19m 20s at a place in longitude 120º 32' W at 2.10 A.M, GMT
the same day. (8)
15. (a) Write in detail about the methods of locating soundings. (16)
Or
(b) (i) Derive the parallax equation for determining the heights from a
pair of vertical photographs. (8)
(ii) Two ground points A and B appear on a pair of overlapping
photographs which have been taken from a height of 3600 m above
mean sea level. The base lines as measured on the two photographs
are 89.5 and 90.5 mm respectively. The mean parallax bar readings
for A and B are 29.32 and 30.82 mm. If the elevation of A above the
mean sea level is 230.35 m, compute the elevation of B. (8)
——————
Reg. No. :
B.E./B.Tech. DEGREE EXAMINATION, APRIL/MAY 2011
Fourth Semester
Civil Engineering
CE 2254 — SURVEYING — II
(Regulation 2008)
Time : Three hours Maximum : 100 marks
Answer ALL questions
PART A — (10 × 2 = 20 marks)
1. Consider the horizontal distance equation D = KS + C. What are represented by K, S and C?
2. What is parallax? How it can be eliminated?
3. What is the objective of geodetic surveying?
4. What do you mean by a well-conditioned triangle?
5. Define weight of an observation.
6. Differentiate ‘most probable error’ from ‘residual error’.
7. Distinguish between the ‘Zenith’ and the ‘Nadir’.
8. Differentiate ‘Tropic of Cancer’ from ‘Tropic of Capricorn’.
9. What do you mean by sounding?
10. Distinguish between ‘terrestrial photogrammetry’ and ‘aerial photogrammetry’.
PART B — (5 × 16 = 80 marks)
Question Paper Code : 11209
www.rejinpaul.com
www.rejinpaul.com

11209 2
11. (a) (i) A vane 3 m above the foot of a staff was sighted at a point 1200 m away from the instrument. The observed vertical angle was -
01°30’. The reduced level of the instrument station was 250.50 and the height of the instrument axis 1 .5 m. Find the reduced level of the staff station. Apply the combined correction for curvature and refraction in finding the R.L. of the station. (4)
(ii) Determine the gradient from a point A to a point B from the following observations made with a tacheometer fitted with an anallactic lens. The constant of the instrument was 100 and the staff was held vertically : (12)
Instrument station Staff station Bearing Vertical angle Staff readings
P A 134° +10°32' 1.360, 1.915, 2.470
B 224° +05° 06' 1.065, 1.885, 2.705
Or
(b) (i) Explain how you would compute the horizontal and vertical distances from the instrument station to the staff station in the tangential method of tacheometry. With the help of a schematic diagram, deduce the equations for the horizontal distance and the vertical distance when both the vertical angles measured are angles of elevation. (8)
(ii) A theodolite was set up at a distance of 150 m from a tower. The angle of elevation to the top of the tower was 10°08’, while the angle of depression to the foot of the tower was 03°12’. The staff reading on the B.M. of R.L. 50.217 with the telescope horizontal was 0.880. Find the height of the tower and the reduced level of the top and foot of the tower. (8)
12. (a) (i) After measuring the length of a baseline, the correct length of the line is computed by applying various applicable corrections. Discuss the following corrections and provide expressions for determining them.
(1) Correction for temperature
(2) Correction for pull
(3) Correction for sag (3 × 3 = 9)
(ii) From an eccentric station S, 12.25 m to the west of the main station B, the following angles were measured.
∠BSC = 76°25’32”
∠CSA = 54°32’20”
The stations S and C are to the opposite sides of the line AB. Calculate the correct angle ABC if the length AB and BC are 5286.5 m and 4932.2 m respectively. (7)
[email protected] www.rejinpaul.com
www.rejinpaul.com
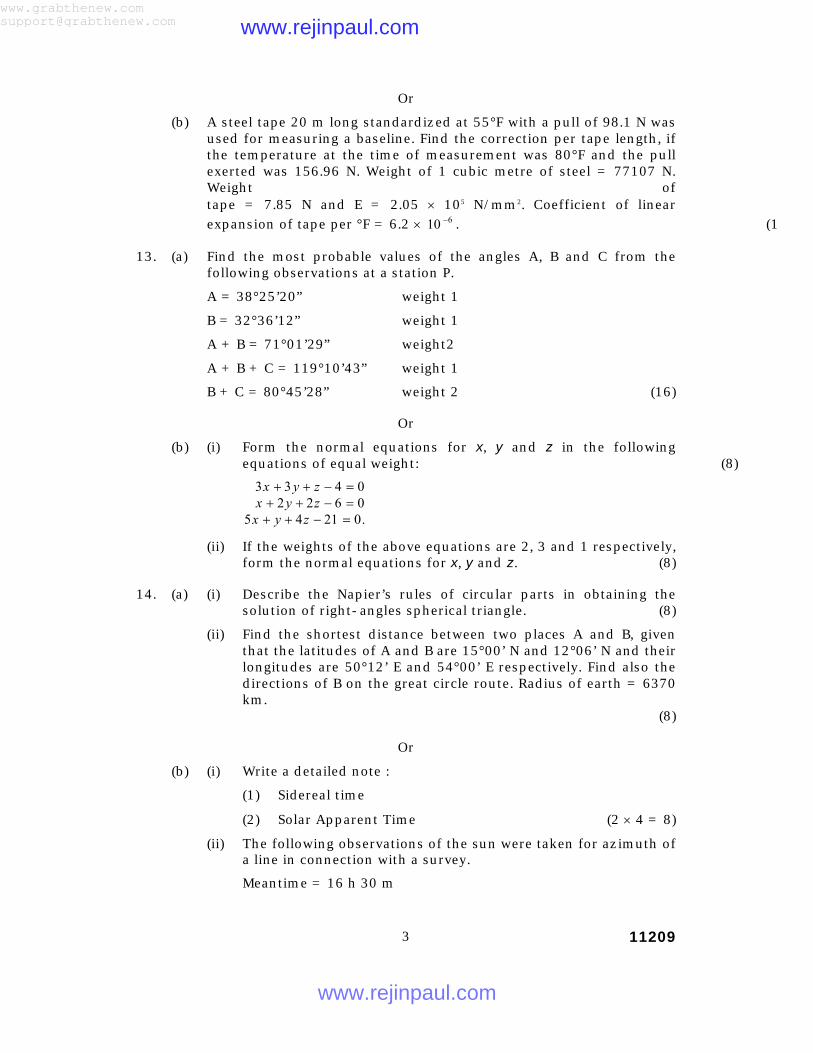
11209 3
Or
(b) A steel tape 20 m long standardized at 55°F with a pull of 98.1 N was used for measuring a baseline. Find the correction per tape length, if the temperature at the time of measurement was 80°F and the pull exerted was 156.96 N. Weight of 1 cubic metre of steel = 77107 N. Weight of
tape = 7.85 N and E = 2.05 × 10⁵ N/mm2. Coefficient of linear
expansion of tape per °F = 6.2 × 610
− . (16)
13. (a) Find the most probable values of the angles A, B and C from the following observations at a station P.
A = 38°25’20” weight 1
B = 32°36’12” weight 1
A + B = 71°01’29” weight2
A + B + C = 119°10’43” weight 1
B + C = 80°45’28” weight 2 (16)
Or
(b) (i) Form the normal equations for x, y and z in the following equations of equal weight: (8)
.02145
0622
0433
=−++
=−++
=−++
zyx
zyx
zyx
(ii) If the weights of the above equations are 2, 3 and 1 respectively, form the normal equations for x, y and z. (8)
14. (a) (i) Describe the Napier’s rules of circular parts in obtaining the solution of right-angles spherical triangle. (8)
(ii) Find the shortest distance between two places A and B, given that the latitudes of A and B are 15°00’ N and 12°06’ N and their longitudes are 50°12’ E and 54°00’ E respectively. Find also the directions of B on the great circle route. Radius of earth = 6370 km. (8)
Or
(b) (i) Write a detailed note :
(1) Sidereal time
(2) Solar Apparent Time (2 × 4 = 8)
(ii) The following observations of the sun were taken for azimuth of a line in connection with a survey.
Meantime = 16 h 30 m
[email protected] www.rejinpaul.com
www.rejinpaul.com
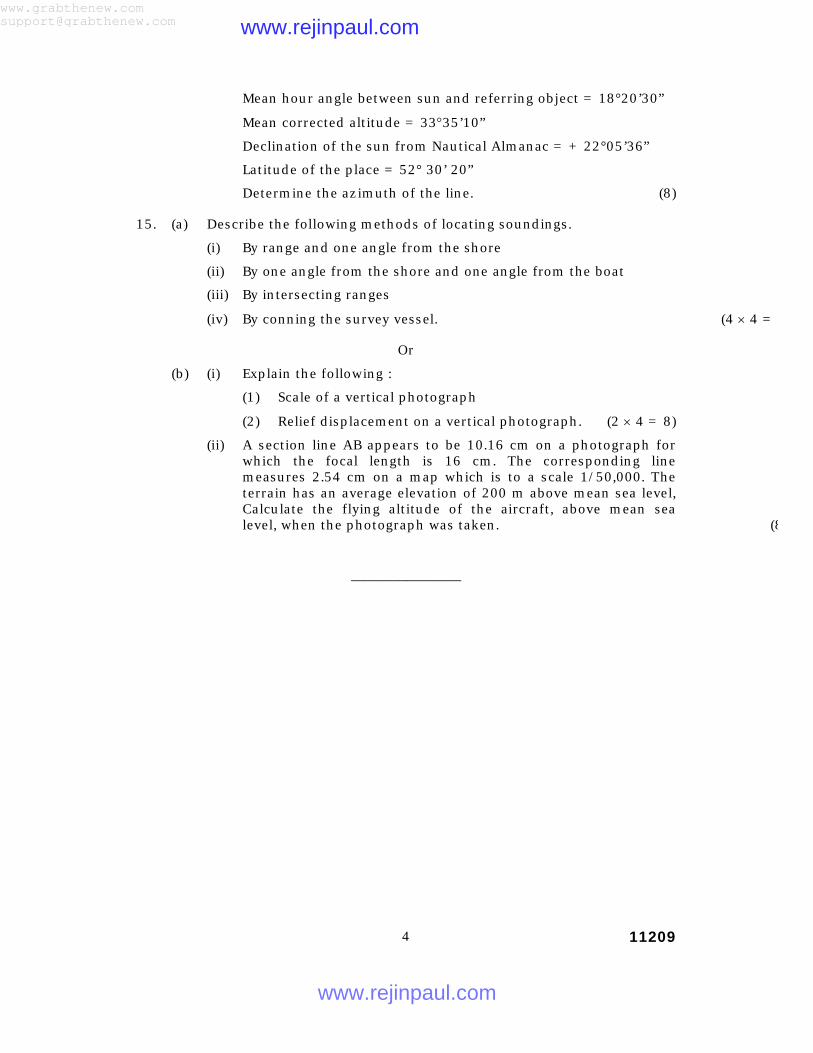
11209 4
Mean hour angle between sun and referring object = 18°20’30”
Mean corrected altitude = 33°35’10”
Declination of the sun from Nautical Almanac = + 22°05’36”
Latitude of the place = 52° 30’ 20”
Determine the azimuth of the line. (8)
15. (a) Describe the following methods of locating soundings.
(i) By range and one angle from the shore
(ii) By one angle from the shore and one angle from the boat
(iii) By intersecting ranges
(iv) By conning the survey vessel. (4 × 4 = 16)
Or
(b) (i) Explain the following :
(1) Scale of a vertical photograph
(2) Relief displacement on a vertical photograph. (2 × 4 = 8)
(ii) A section line AB appears to be 10.16 cm on a photograph for which the focal length is 16 cm. The corresponding line measures 2.54 cm on a map which is to a scale 1/50,000. The terrain has an average elevation of 200 m above mean sea level, Calculate the flying altitude of the aircraft, above mean sea level, when the photograph was taken. (8)
————————
[email protected] www.rejinpaul.com
www.rejinpaul.com