cbi - ministry of foreign affairs the natural ingredients for cosmetics market in europe
TRANSCRIPT

CBI - Ministry of Foreign Affairs
The Natural Ingredients for Cosmetics market in Europe

2
European market for natural ingredients for cosmetics
CBI - Ministry of Foreign Affairs
• Consumption• Segments• Imports and exports• Where is the market?
What’s new on the European market

3
European Consumption
Most consumer products are produced in Europe
Strong natural cosmetics industry
Large and increasing demand for natural ingredients
CBI - Ministry of Foreign Affairs

4
Cosmetics
€ 47 bn.
€ 72 bn.
€ 18 bn.
Major cosmetics markets in 2013
Source: Cosmetics Europe, 2014, ABIHPEC 2013
Extra-EU exports of € 16 bn.
CBI - Ministry of Foreign Affairs
€ 29 bn.
11 bn.
5
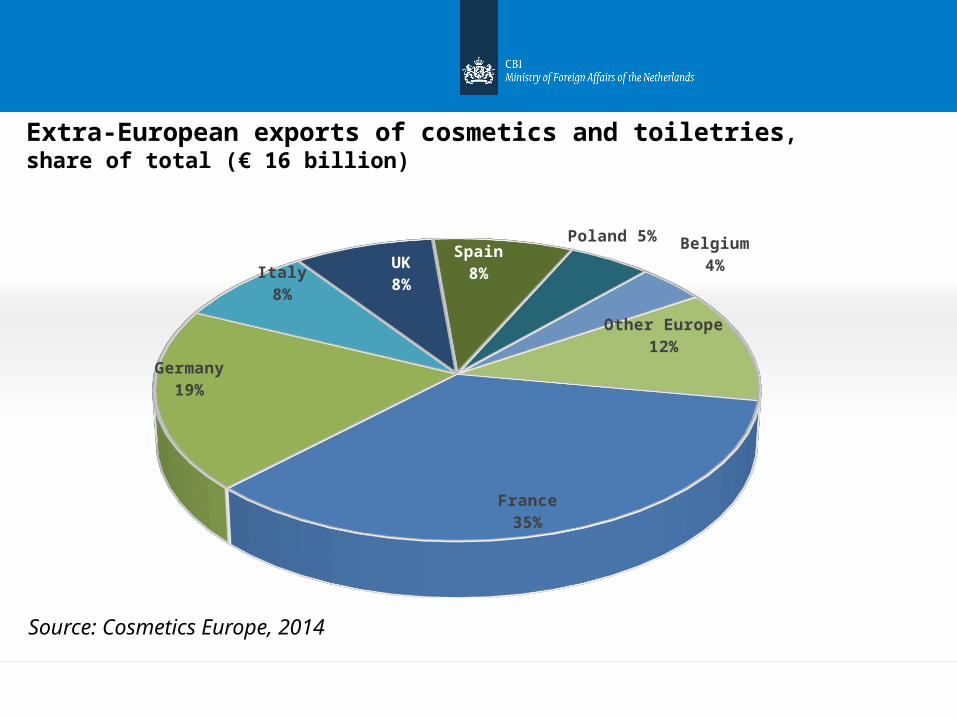
Extra-European exports of cosmetics and toiletries, share of total (€ 16 billion)
CBI - Ministry of Foreign Affairs
France35%
Germany19%
Italy8%
UK8%
Spain8%
Poland 5%Belgium
4%
Other Europe12%
Source: Cosmetics Europe, 2014

6
European market for cosmetic products, share of total € 72 billion in 2013
CBI - Ministry of Foreign Affairs
Source: Cosmetics Europe, 2014
Germany, +0.6%share: 18%
France, -0.3%share: 15%
UK, -2.5%share: 14%
Italy, -1.2%share: 13%
Spain, -3.6%share:
9%
Netherlands, -0.5% share: 4%
Poland, -0.4%share: 4%
Other Eu-
rope, -0.8%share: 24%
7
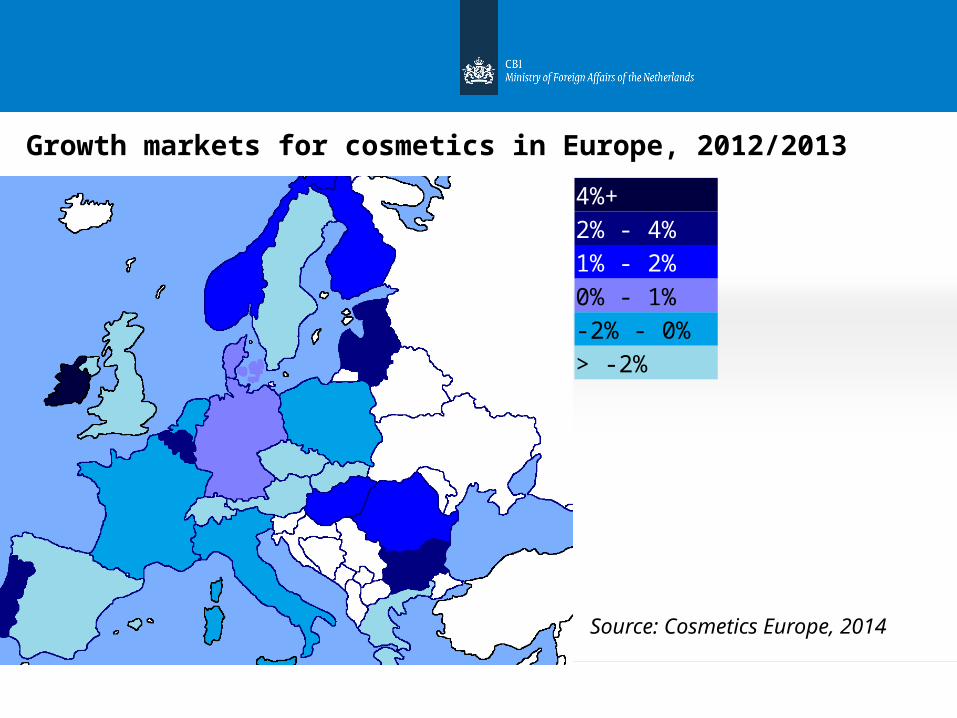
Growth markets for cosmetics in Europe, 2012/2013
CBI - Ministry of Foreign Affairs
4%+2% - 4%1% - 2% 0% - 1%-2% - 0%> -2%
Source: Cosmetics Europe, 2014

8
European market for cosmetic products, Per capita consumption in €
Source: Cosmetics Europe, 2014
CBI - Ministry of Foreign Affairs
Switzer
land
Norway
Denm
ark
Sweden
Belgi
um/L
ux
Finla
nd
Nethe
rland
s
Franc
e
Irela
nd
Germ
any
Italy
Unite
d Kin
gdom
Austri
a
Spain
Europ
e0
50
100
150
200
250
300
2011
2012
2013

9
Natural Cosmetics High growth market
Asia (13%), Europe (9%), and USA (8%)
Also during crisis!
2014: sales € 4.5 bn. in Western Europe, € 4.1 bn. in USA, € 10.6 bn. in Asia
2017: expected market share 4%. Up to 10% in USA, Germany and Switzerland
Cosmeceuticals – Cross-over sector worth € 3.6 billion
CBI - Ministry of Foreign Affairs
10
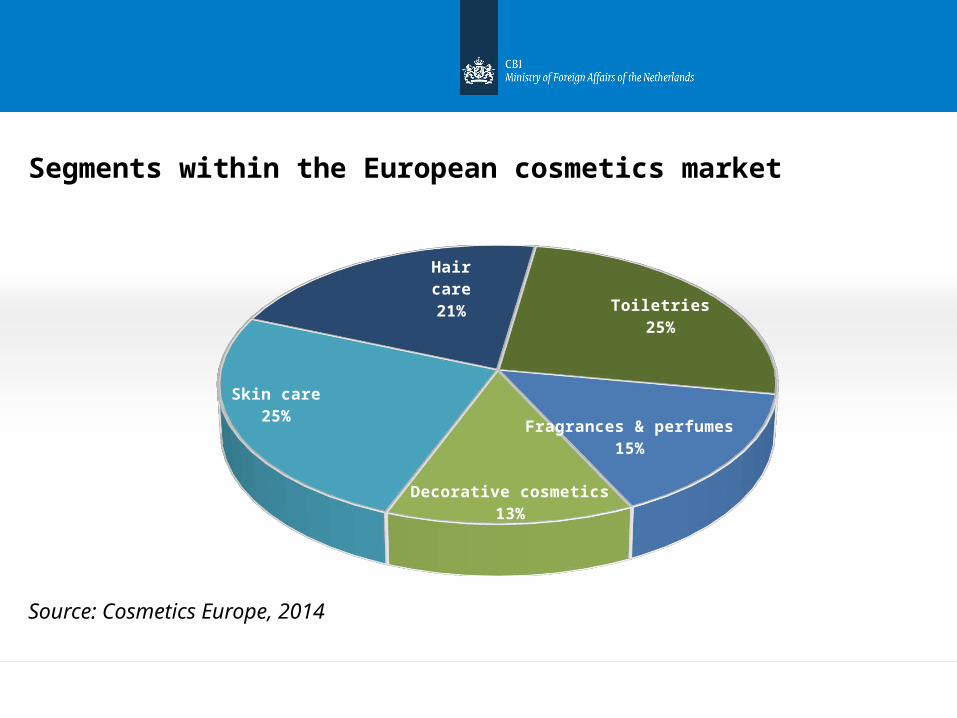
Segments within the European cosmetics market
CBI - Ministry of Foreign Affairs
Fragrances & perfumes15%
Decorative cosmetics13%
Skin care25%
Hair care21%
Toiletries25%
Source: Cosmetics Europe, 2014

11
Top 5 markets in Europe
CBI - Ministry of Foreign Affairs
Toiletries
Skin care
Hair care
Fragrances & perfumes
Decorative cosmetics
Source: Cosmetics Europe, 2014

12
Translation into ingredients
Examples of natural ingredients usedFunctional IngredientsEmollients Vegetable oils, fats and buttersThickeners Gums, waxes, resins, hydrocolloidsHumectants HoneyExfoliants Seed powders, nut shell powders, powdered seaweedFragrance Essential oils, aromatic plant (extracts)
Colours Only permitted (natural) colorants (Cosmetics Directive)Surfactants Soapnut, quillaia bark, vegetable oils etc.Active Ingredients Very broad range of properties Plant extracts with traditionally reported properties such
as anti-micobiol, anti-oxidant, anti-inflammatory, astringency, cooling, conditioning, toning, deodorising etc.
CBI - Ministry of Foreign Affairs

13
EU imports of essential oils, in € million
CBI - Ministry of Foreign Affairs
1
2
3
1
2
3
1
8.8
7.8
0.02
South Africa
Peru
Colombia
EU28 € 1,171 million
Top 3
France € 283 million
Germany € 226 million
United Kingdom € 201 million
Source: Eurostat, 2015

14
EU imports of specialty vegetable oils, in € million
CBI - Ministry of Foreign Affairs
1
2
3
12
1
2
3
4.1
6.8
0.01
South Africa
Peru
Colombia
EU28 € 668 million
Top 3
France € 138 million
Netherlands € 89 million
Belgium € 82 million
Source: Eurostat, 2015
15
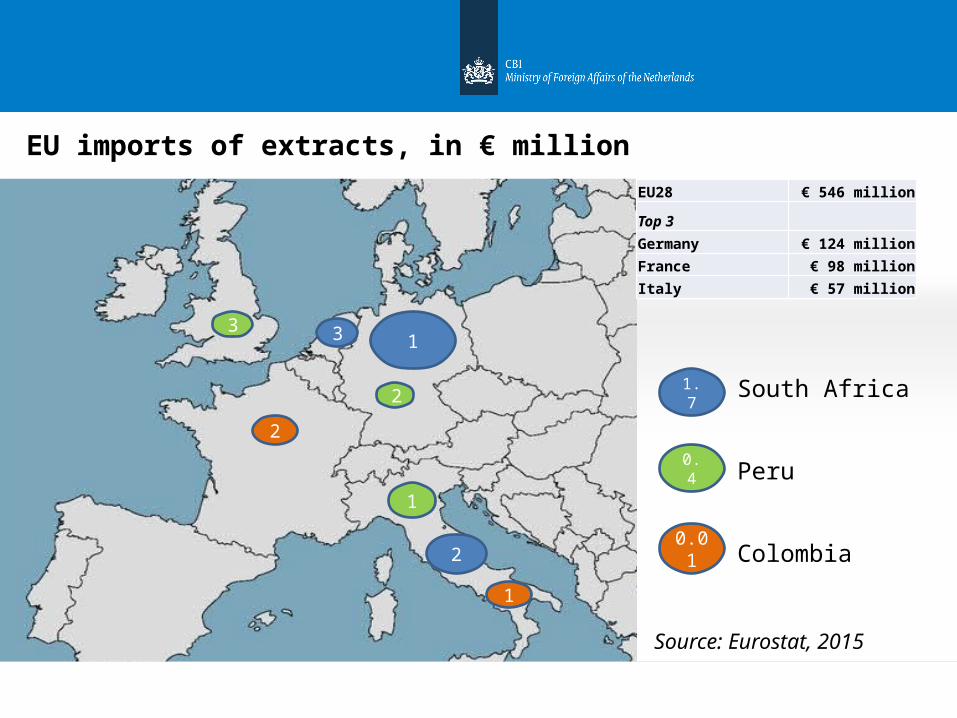
EU imports of extracts, in € million
CBI - Ministry of Foreign Affairs
1
2
3
1
2
1
2
3
1.7
0.4
0.01
South Africa
Peru
Colombia
EU28 € 546 million
Top 3
Germany € 124 million
France € 98 million
Italy € 57 million
Source: Eurostat, 2015

16
EU imports of MAPs
CBI - Ministry of Foreign Affairs
12
3
1
2
1
2
3
3.8
4.8
2.1
South Africa
Peru
Colombia
EU28 € 659 million
Top 3
Germany € 201 million
France € 78 million
Italy € 62 million
Source: Eurostat, 2015
17
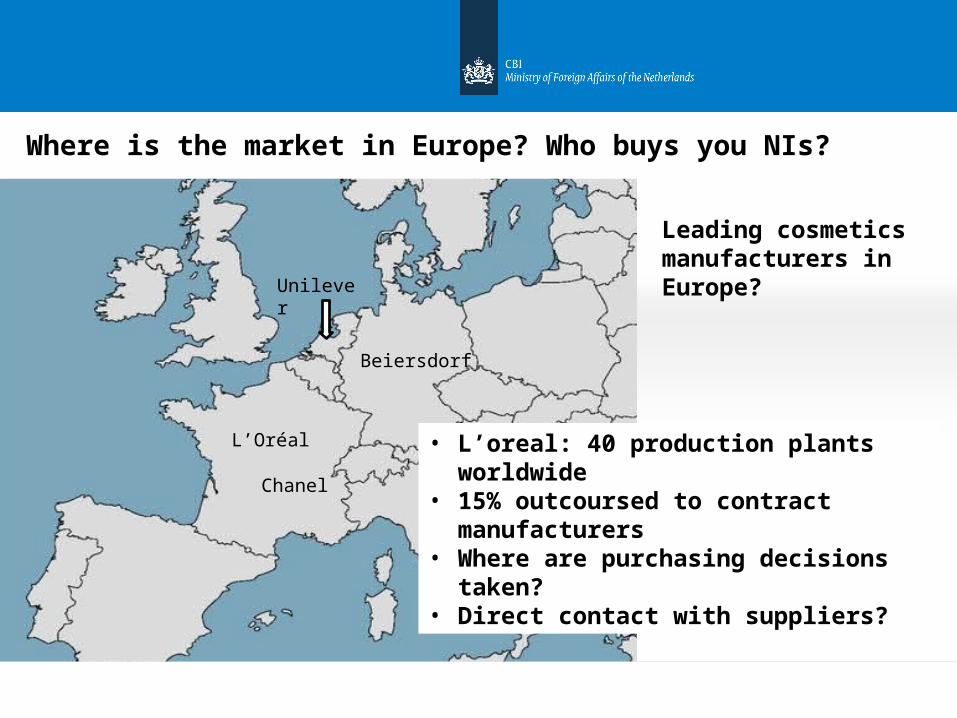
Where is the market in Europe? Who buys you NIs?
CBI - Ministry of Foreign Affairs
Beiersdorf
Unilever
L’Oréal
Leading cosmetics manufacturers in Europe?
• L’oreal: 40 production plants worldwide
• 15% outcoursed to contract manufacturers
• Where are purchasing decisions taken?
• Direct contact with suppliers?
Chanel

18
Cosmetic SMEs in Europe?
CBI - Ministry of Foreign Affairs
Source: Cosmetics Europe, 2014
Italy 673
France 588
Spain 403
Germany 401
Poland 349
United Kingdom 310
Sweden 180
Switzerland 150
Czech Republic 124
Hungary 124
Top 10 countries:
Do these buy direct?
19
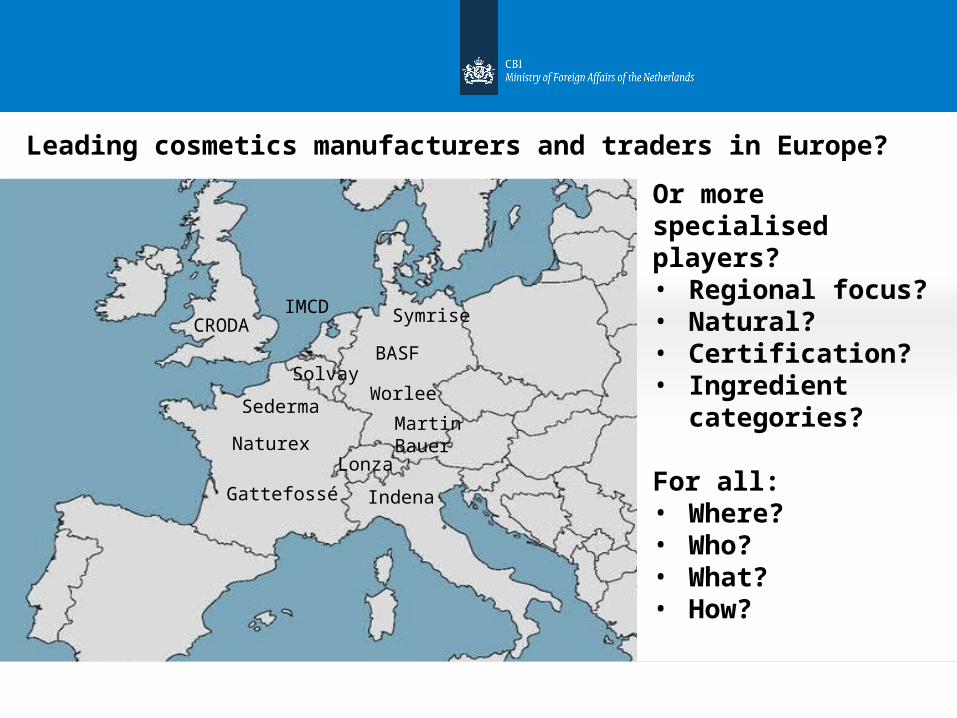
Leading cosmetics manufacturers and traders in Europe?
CBI - Ministry of Foreign Affairs
Naturex
BASF
Indena
IMCD
Worlee
Symrise
Solvay
CRODA
Martin Bauer
Gattefossé
Lonza
Sederma
Or more specialised players?• Regional focus?• Natural?• Certification?• Ingredient
categories?
For all:• Where?• Who?• What?• How?

20
European organic markets
Northern Europe
Developed & stable market Sustainability: requirement
from industry & consumers Large organic market share: High consumer purchasing
power
Southern Europe Developed organic production Developing market High growth rates
Eastern Europe
Promising market High growth rates Low consumer
purchasing power and awareness
CBI - Ministry of Foreign Affairs

21
European Fairtrade markets
Northern Europe
High growth rates
Sustainability: requirements from industry and consumers
High consumer purchasing power
Southern and Eastern Europe
Low development and awarenessPromising markets?
CBI - Ministry of Foreign Affairs