caustic soda recovery in a bottle …s3.amazonaws.com/zanran_storage/ soda recovery in a bottle...
TRANSCRIPT
CAUSTIC SODA RECOVERY IN A BOTTLE WASHING PLANT USING MEMBRANE TECHNOLOGY
by
Anna Marie M. Hufemia
A thesis submitted in partial fulfillment of the requirements for the degree of Master of Engineering.
Examination Committee Dr. C. Visvanathan (Chairman) Dr. Lars Baetz Reutergårdh Dr. Ajit P. Annachhatre
Nationality Filipino Previous Degree Bachelor of Science in Chemical Engineering
University of the Philippines Los Baños Los Baños, Laguna, Philippines
Scholarship Donor Government of Spain
Asian Institute of Technology School of Environment, Resources and Development
Bangkok, Thailand August 1996
Acknowledgment
i

I wish to thank the following who, in one way or the other, contributed in the completion of this research:
Dr. C. Visvanathan, my advisor, for his efforts in guiding me throughout my study. I was deeply challenged to give it my best because of his constant eagerness to help. Dr. Lars Baetz Reutergårdh and Dr. Ajit P. Annachhatre, my committee members, for their time and valuable suggestions. Mr. Arun Rattagool of the Thai Pure Drinks Ltd. (TPDL), for believing in the significance of the research. I consider it a great opportunity to have worked with such a prestigious company. Mr. Wanchai Kamolvit and his staff, especially Prakit and Jane, for spending so much of their time in providing me precious information about the TPDL, Pathumthani Plant. Mr. Prapan Ariyamethee of the Liquid Purification Engineering (LPE), for his generosity in lending his membrane pilot units and sharing his expertise in membrane technology. Mr. Sakda Thaijanya and staff of LPE, for their most valuable assistance. Classmates and staff of the AIT Environmental Engineering Program, for their support and cooperation. The government of Spain as my scholarship donor and DANIDA-AIT for granting me part of my needed research funds. Brethren in the AIT Christian Fellowship, family and friends for laboring with me in prayer. It was your Christ-like love that enabled me to endure even the most trying moments of my work. Edwin, my lifetime partner, for fully understanding the demands of my work. It was your unceasing love, support and encouragement that pulled me through. Jesus, my personal Lord and Friend, for His abiding wisdom and direction. I acknowledge that above everyone else, He deserves my sincerest thanksgiving.
Anna Marie M. Hufemia
“He who dwells in the shelter of the Most High will rest in the shadow of the Almighty. I will say of the Lord, “He is my refuge and my fortress, my God, in whom I trust”
The Holy Bible (Psalm 91:1-2)
ii
Abstract
The feasibility of recovering caustic soda from bottle washers of a softdrink plant was investigated at pilot-scale using microfiltration (MF) and nanofiltration (NF). This study revealed that the MF/NF system can purify the caustic soda to a certain extent and can be reused back to the bottle washing units. Within the studied pressure ranges, the optimum applied pressure was determined as 101 kPa for MF, and 1,414 kPa for NF with corresponding permeate fluxes of 235 and 15 L/m2-h respectively. Based on these figures, a large-scale installation for the Thai Pure Drinks Ltd., Pathumthani plant was designed and a financial analysis was conducted for the system. The MF/NF system using MEMCOR hollow fiber membranes and MPS-34 (MWCO=300) gave a payback period of seven years and an IRR of 13.7%, rendering the system not financially feasible. An overall water balance was drawn to find alternatives for water purification and reuse in the plant that would lead to reduction of raw water consumption and liquid discharge into the river. It was found that reuse of microfiltered wastewater treatment plant effluent can reduce groundwater input by 40% and liquid discharged to the receiving water by 65.5%. Two proposed options for reclaiming bottle washing rinse water are treatment by reverse osmosis (RO) or purification by ion-exchange (IE). Based on theoretical considerations, an MF/RO system will recover both pure water and concentrated caustic in the process. On the other hand, IE will recover water fit for reuse in the bottle washers. The two conceptual designs have a payback period of 3.2 and 3.4 years respectively, while the internal rate of return are 31.3% and 30.5%
iii

Table of Contents
Chapter Title Page Title Page i Acknowledgment ii Abstract iii Table of Contents iv List of Abbreviations vi List of Tables vii List of Figures viii 1 Introduction 1.1 Background of the Study 1 1.2 Objectives 2 1.3 Scope and Limitations 2 2 Literature Review 2.1 Bottle-Washing in the Softdrink Industry 3 2.1.1 Bottle Washing Requirements 3 2.1.2 Wastewater Generated from Bottle-Washing 4 2.2 Methods in Caustic Soda Recovery 5 2.3 Separation Processes in Membrane Technology 7 2.3.1 Microfiltration and Nanofiltration Membranes 8 2.3.2 Industrial Applications of MF and NF in Water and 9 Wastewater Treatment 2.4 Zero Liquid Discharge in Industries 13 3 Background Information on the Research Site 3.1 Plant Location and Layout 14 3.2 Softdrink Production 14 3.2.1 Process Description 14 3.2.2 Production Schedule and Capacity 17 3.3 Water and Wastewater Sources and Treatment 18 3.3.1 Water Source and Treatment Process 18 3.3.2 Wastewater Treatment System 20 3.4 Bottle-Washing Process 20 3.4.1 Bottle-Washer Operation 20 3.4.2 Caustic Cleaning Solution 23
iv
Chapter Title Page
4 Methodology 4.1 Caustic Solution Characterization 25 4.2 Pilot-scale Membrane Filtration of Caustic Waste 25 4.2.1 Microfiltration of Caustic Waste 25 4.2.2 Nanofiltration of Caustic Waste 27 4.2.3 Membrane System Design and Financial Analysis 27 4.3 Investigation on Water Consumption and Wastewater Generation 28 4.3.1 Analysis of Bottle Washer Effluent Streams 28 4.3.2 Water Quality Determination 28 4.3.3 Data Collection for Water Consumption and Wastewater
Generation 29
4.4 Proposals for Water Purification and Reuse in the Factory 29 5 Results and Discussion 5.1 Characterization of Caustic Solution 30 5.2 Microfiltration of Caustic Waste 33 5.3 Nanofiltration of Microfiltration Permeate 38 5.4 Membrane System Design for Caustic Recovery 42 5.4.1 Caustic Consumption in the Plant 42 5.4.2 Membrane Recovery System 45 5.5 Financial Analysis of the Membrane Installation 48 5.5.1 Projected Savings 48 5.5.2 Payback Period and Internal Rate of Return 48 5.6 Demand for Water in the Plant 49 5.6.1 Raw Water Consumption 50 5.6.2 Pre-treated Water Consumption 50 5.6.3 Soft Water Consumption 51 5.6.4 Treated Water Consumption 51 5.7 Rate of Wastewater Generation 53 5.8 Water Reuse Strategies in the Plant 56 5.8.1 Rationale of Recycling Water in the Plant 56 5.8.2 Microfiltration of Wastewater Treatment Plant Effluent 56 5.8.3 Purification and Reuse of Bottle Washer Rinse Water 57 6 Conclusions and Recommendations 64 References 66 Appendices 69
v
List of Abbreviations
CO2 carbon dioxide COD chemical oxygen demand DF dual-media filter EDR electrodialysis HCl hydrochloric acid HF hollow fiber IE ion exchange IRR internal rate of return MF microfiltration MPW Membrane Products Kiryat Weizmann, Ltd. MWCO molecular weight cutoff Na2CO3 sodium carbonate NaOH caustic soda or sodium hydroxide NF nanofiltration NPV net present value PET polyethylene terepthalate PLC programmable logic controller PP payback period R rejection rate RO reverse osmosis SW spiral wound TDS total dissolved solids TMP transmembrane pressure TPDL Thai Pure Drinks, Ltd UF ultrafiltration WWTP wastewater treatment plant
vi
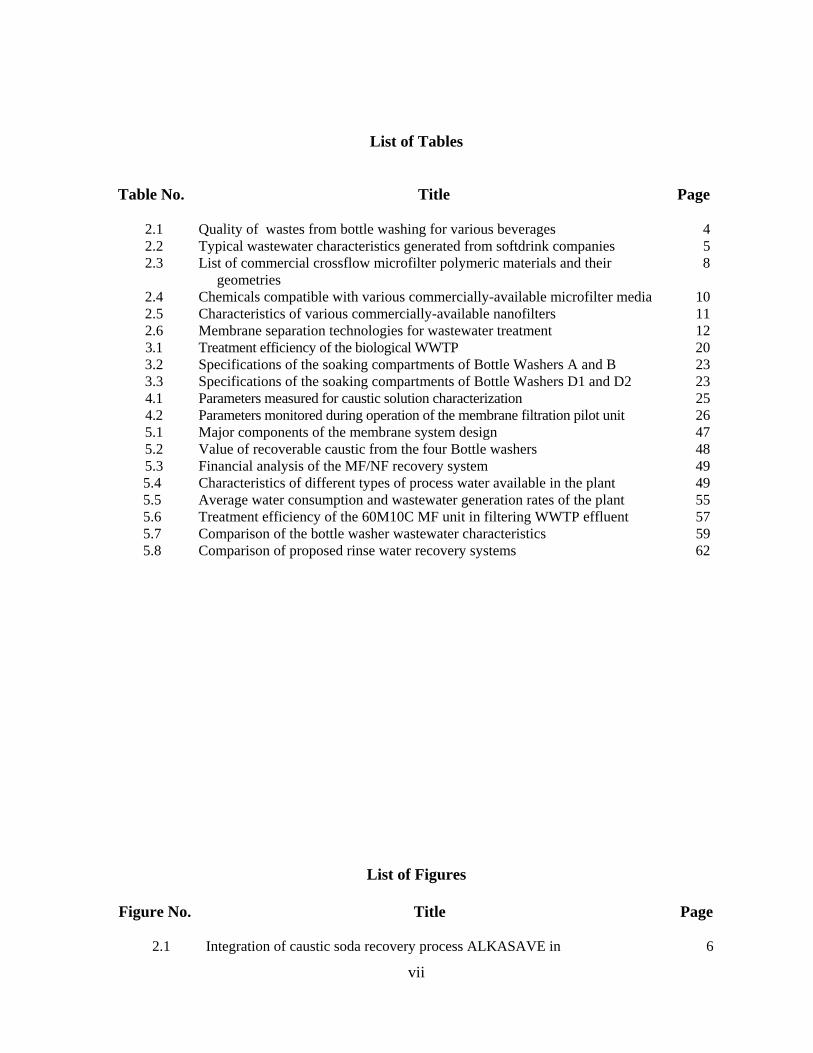
List of Tables
Table No. Title Page
2.1 Quality of wastes from bottle washing for various beverages 4 2.2 Typical wastewater characteristics generated from softdrink companies 5 2.3 List of commercial crossflow microfilter polymeric materials and their
geometries 8
2.4 Chemicals compatible with various commercially-available microfilter media 10 2.5 Characteristics of various commercially-available nanofilters 11 2.6 Membrane separation technologies for wastewater treatment 12 3.1 Treatment efficiency of the biological WWTP 20 3.2 Specifications of the soaking compartments of Bottle Washers A and B 23 3.3 Specifications of the soaking compartments of Bottle Washers D1 and D2 23 4.1 Parameters measured for caustic solution characterization 25 4.2 Parameters monitored during operation of the membrane filtration pilot unit 26 5.1 Major components of the membrane system design 47 5.2 Value of recoverable caustic from the four Bottle washers 48 5.3 Financial analysis of the MF/NF recovery system 495.4 Characteristics of different types of process water available in the plant 495.5 Average water consumption and wastewater generation rates of the plant 555.6 Treatment efficiency of the 60M10C MF unit in filtering WWTP effluent 575.7 Comparison of the bottle washer wastewater characteristics 595.8 Comparison of proposed rinse water recovery systems 62
List of Figures
Figure No. Title Page
2.1 Integration of caustic soda recovery process ALKASAVE in 6 vii
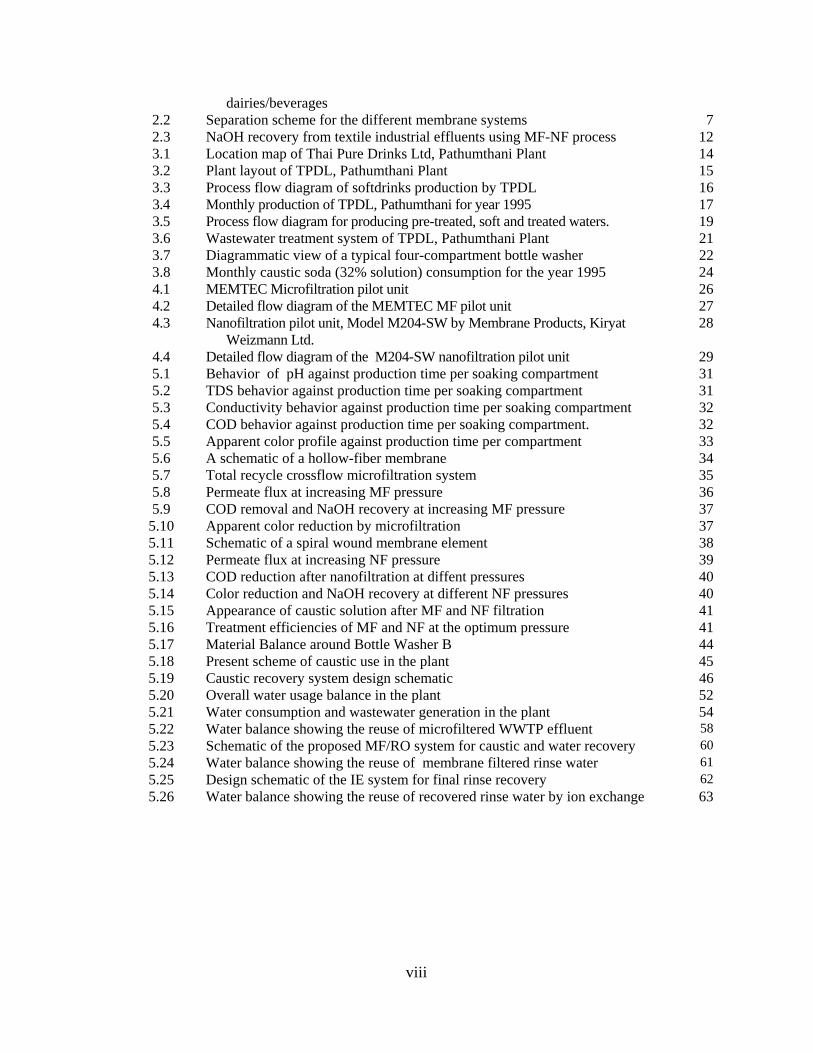
dairies/beverages 2.2 Separation scheme for the different membrane systems 7 2.3 NaOH recovery from textile industrial effluents using MF-NF process 12 3.1 Location map of Thai Pure Drinks Ltd, Pathumthani Plant 14 3.2 Plant layout of TPDL, Pathumthani Plant 15 3.3 Process flow diagram of softdrinks production by TPDL 16 3.4 Monthly production of TPDL, Pathumthani for year 1995 17 3.5 Process flow diagram for producing pre-treated, soft and treated waters. 19 3.6 Wastewater treatment system of TPDL, Pathumthani Plant 21 3.7 Diagrammatic view of a typical four-compartment bottle washer 22 3.8 Monthly caustic soda (32% solution) consumption for the year 1995 24 4.1 MEMTEC Microfiltration pilot unit 26 4.2 Detailed flow diagram of the MEMTEC MF pilot unit 27 4.3 Nanofiltration pilot unit, Model M204-SW by Membrane Products, Kiryat
Weizmann Ltd. 28
4.4 Detailed flow diagram of the M204-SW nanofiltration pilot unit 29 5.1 Behavior of pH against production time per soaking compartment 31 5.2 TDS behavior against production time per soaking compartment 31 5.3 Conductivity behavior against production time per soaking compartment 32 5.4 COD behavior against production time per soaking compartment. 32 5.5 Apparent color profile against production time per compartment 33 5.6 A schematic of a hollow-fiber membrane 34 5.7 Total recycle crossflow microfiltration system 35 5.8 Permeate flux at increasing MF pressure 36 5.9 COD removal and NaOH recovery at increasing MF pressure 37
5.10 Apparent color reduction by microfiltration 37 5.11 Schematic of a spiral wound membrane element 38 5.12 Permeate flux at increasing NF pressure 39 5.13 COD reduction after nanofiltration at diffent pressures 40 5.14 Color reduction and NaOH recovery at different NF pressures 40 5.15 Appearance of caustic solution after MF and NF filtration 41 5.16 Treatment efficiencies of MF and NF at the optimum pressure 41 5.17 Material Balance around Bottle Washer B 44 5.18 Present scheme of caustic use in the plant 45 5.19 Caustic recovery system design schematic 46 5.20 Overall water usage balance in the plant 52 5.21 Water consumption and wastewater generation in the plant 54 5.22 Water balance showing the reuse of microfiltered WWTP effluent 58 5.23 Schematic of the proposed MF/RO system for caustic and water recovery 60 5.24 Water balance showing the reuse of membrane filtered rinse water 61 5.25 Design schematic of the IE system for final rinse recovery 62 5.26 Water balance showing the reuse of recovered rinse water by ion exchange 63
viii

CHAPTER 1
Introduction 1.1 Background of the Study The advent of using light containers such as aluminum cans and polyethylene terepthalate (PET) bottles for beverage packaging has not at all phased-out the use of glass bottles. Today, glass bottles are still being reused widely by beer and softdrink companies. The reuse of such in the production process entails a thorough cleaning of these returnable bottles before refilling. During the bottle cleaning process, the beverage industry uses a large quantity of water (Tay and Jeyaseelan, 1994) and caustic soda (NaOH) solution (MPW, 1994) for washing and rinsing operations. For economic reasons, many factories recycle the caustic cleaning solutions several times in the process. Fresh caustic solution is just added to the recycled solution until the required concentration is reached. This technique results to significant reduction in the consumption of caustic soda and water. However, build-up of organic contaminants including sugars and color additives leads to the discharging of larger than necessary amounts of caustic solution during rinsing operations. Also, organic pollutants are hydrolyzed by the caustic soda, rendering the cleaning capacity of the solution less effective. Settling or sand filtration may also be used to clarify the spent caustic solution contaminated with straws, cigarette butts and various other kinds of solids (Jacobs, 1959) before it is reused in the process. However, these techniques can only remove suspended solids or particles, while other organic contaminants will remain dissolved with the filtrate. This means, the recovered caustic soda will not have the same caustic strength as before. When spent caustic soda is finally discharged, the usual practice is to treat it by neutralization using acidic waste streams. The problem with this process is that it produces a solution highly loaded with sodium that will eventually be detrimental to soil quality. Therefore, an effective way of minimizing the amount of caustic soda used and discharged from a processing plant must be found. Membrane filtration is one technique used in the practice of solid-liquid separation and is currently gaining popularity in water and wastewater treatment (Ben Aim and Vigneswaran, 1988). Membrane systems such as microfiltration (MF), ultrafiltration (UF), nanofiltration (NF) and reverse osmosis (RO) are now being used alone or with other treatment technologies in implementing pollution prevention programs. Plant operations that are now taking advantage of its benefits include reducing the chemical oxygen demand (COD) of wastewater before biological treatment by NF or RO; and fractionating and purifying materials for biotechnology applications by MF or UF (Cartwright, 1994). Membrane technology can also be applied for caustic soda recovery. This is done by passing the caustic solution through base-stable membranes which can remove some, if not all, types of dissolved and suspended organic contaminants. Particles and colloids with size greater
1
than 0.02 µm can be effectively rejected by MF. On the other hand, NF can separate molecules and ions with size less than 10o A (Vigneswaran et al., 1991). When membrane filtration is employed, the caustic solution may be recovered and the amount used in the process will consequently be reduced. Likewise, the total required volume of process water will be reduced. However, very little information is available on this kind of membrane system application. The few studies done on the feasibility of this membrane application were conducted by manufacturers of alkali-stable membrane themselves. In Thailand, growth in number and capacity of food manufacturing plants is constantly increasing. The beverage industry in particular, is also catching up with the rapid development of this newly industrialized country. It must be noted however, that this industry requires huge amounts of good quality water in their processes. This makes them one of the major contributors to the problem of depletion of industrial water resources in the country. Therefore, it is foreseen that a technology which can substantially reduce the amount of process water in bottle-washing plants will be of significant help to conserving the water resources of the country. 1.2 Objectives The main objective of this research was to study the feasibility of caustic soda recovery using membrane technology. Specifically it aimed to:
1. determine the performance of microfiltration and nanofiltration in caustic soda recovery at pilot-scale level in terms of rejection rate, optimum applied pressure and permeate quality;
2. make a financial analysis of membrane installation for caustic soda recovery in a large-
scale beverage plant; and 3. prepare a proposal for overall water reuse strategies to minimize liquid discharge in a
softdrink company. 1.3 Scope and Limitations The research site is the Pathumthani plant of the Thai Pure Drinks, Ltd. (TPDL) which manufactures among other beverage products, the Coca-Cola softdrink. The focus of the research was on the recovery of spent caustic soda used in the bottle-washer of this factory at pilot-scale level using microfiltration and nanofiltration systems. At the same time, the water consumption profile of the company was investigated with the aim of finding ways to reduce the raw water input demand using other viable membrane applications. Whenever possible, data available from the company were used for the analyses involved in the study. The outcome of this research is specifically beneficial to the Thai Pure Drinks, Ltd., Pathumthani plant. However, it can be also be applicable to other factories that discharge spent caustic soda and process water with similar characteristics to that of TPDL.
2
CHAPTER 2
Literature Review
The softdrink industry forms a large part of the food and beverage industry. Thus, it is important to study the nature and amount of wastewater generated by large-scale softdrink manufacturing plants. One specific source of wastewater in softdrink production is the bottle-washing operation. This is one of the operations which contributes to the major product losses of the bottling industry (Viraraghan, 1994). Hence, it is essential to look into how this type of wastewater is being generated, handled and treated. 2.1 Bottle Washing in the Softdrink Industry One of the most important processes in softdrink production is bottle-washing. The high quality of the product depends largely on how thoroughly the bottles are cleaned immediately before filling. The bottling process starts with the passing of the returnable bottles through a wash and rinse sequence. Then, the cleaned bottles are carefully inspected before they go automatically through consecutive steps of filling, crowning, mixing, labeling, packaging and shipping (Shukla and Pandey, 1979). During this phase of production, wastewater will be generated from bottle washing and rinsing, labeling, production line spillage, equipment lubrication and washdowns (Capobianco and Blanc, 1990). The wastewater could contain waste softdrink, syrup, detergents, lubricants and caustic. 2.1.1 Bottle Washing Requirements Bottle washing consists of soaking or flushing the bottles with caustic soda solution, sometimes combined with other cleansing agents such as soda ash, sodium aluminate, or trisodium phosphate. The bottles are then scrubbed both inside and out before they are rinsed with potable water. In order to have an efficient washing process, several factors must be controlled in the bottle-washing operation (Jacobs, 1959): • adequate concentration of sterilizing and detergent agents; • proper composition of the agents; • adequate temperature of the washing solution; • sufficient exposure time of the bottles to the washing and sterilizing agents;
3

• proper rinsing water; and • proper maintenance of the bottle-washing equipment.
The bottle-washing equipment may be classified into three types, namely: immersion or soaker washers; immersion with brushing washers; and Hydro washers using powerful jets. The bottles enter the washer through an automatic loader which handles the bottles separately from each other. Then, they get a pre-rinse before they enter a series of soaking compartments containing caustic solutions at a specific temperature. After the bottles go through final rinsing, they are discharged from the washer in a gentle motion and placed in an upright position for further visual inspection. The washing solutions will gradually lose its caustic strength as the washing process progresses. Reaction with impurities depletes the NaOH in solution therefore, there is a need to check the causticity periodically so that the caustic concentration may be adjusted as required. 2.1.2 Wastewater Generated from Bottle-Washing Wastes from the bottle washer are highly alkaline in nature, since the washer consists of a series of alkaline baths. It also often contains large amounts of suspended solids resulting from straws, cigarettes butts, paper and other refuse left in the bottles which lead to a high BOD concentration of the wastewater. A typical composition of wastes from bottle cleaning of different beverage industries was reported by Nemerow (1978) as shown in Table 2.1.
Table 2.1 Quality of wastes from bottle washing for various beverages
Types of product bottles
BOD5 (mg/L)
KMnO4 consumption
(mg/L)
pH
Settleable substances
(mg/L) Wine 4.5 - 15 12-16 8.1-8.4 0-0.15 Beer 185-705 290-1930 9.5-11.9 0.2 Milk 6.3-25 9.5-46 8.6-10.1 0.1 Sweetened clear lemonade 295-600 928-1196 8.4-8.5 1.5-3.8 Cola drinks 340 1370 10.1 0.2 Fruit juice drinks 450 1320 9.4 2.5
Fresnius et al. (1989) reported that in bottling industries, the amount of wastewater generated can range from 166-223 L/100 bottles, with 107-123 L/100 bottles coming from bottle washers alone. Organic contamination can be reduced by up to 70% by retention and filtering of sediment and yeast that may be present in the bottle-washer wastewater. Most bottling plants do not recover the caustic solution. They simply dispose of their spent caustic soda when it has become very dirty after several times of recycling. As previously mentioned, the caustic soda may be neutralized by available acidic waste streams. 4
Otherwise, new acidic solutions are added to it for neutralization. In most cases, the spent caustic solution goes to the wastewater treatment plant along with the other wastewater generated from other operations of the plant. One means of removing solids from the bottle washer is by screening. This is usually done to remove foreign matter left in bottles. To reduce the volume of waste, some plants reuse final rinse water for the bottle washer for pre-rinsing the dirty bottles or for other uses (Nemerow, 1978). Removal of waste drink and debris from the bottles and removal of labels before washing yields a pronounced reduction in BOD and suspended solids in the wastewater. Wastewater from the softdrink industry originates from syrup manufacturing and packaging, bottling production runs, process water purification and washdowns of equipment and conduits (Capobianco and Blanc, 1990). Wastewater characteristics generated from the whole production process by two leading softdrink manufacturers in the world, according to Nemerow (1978) are shown in Table 2.2.
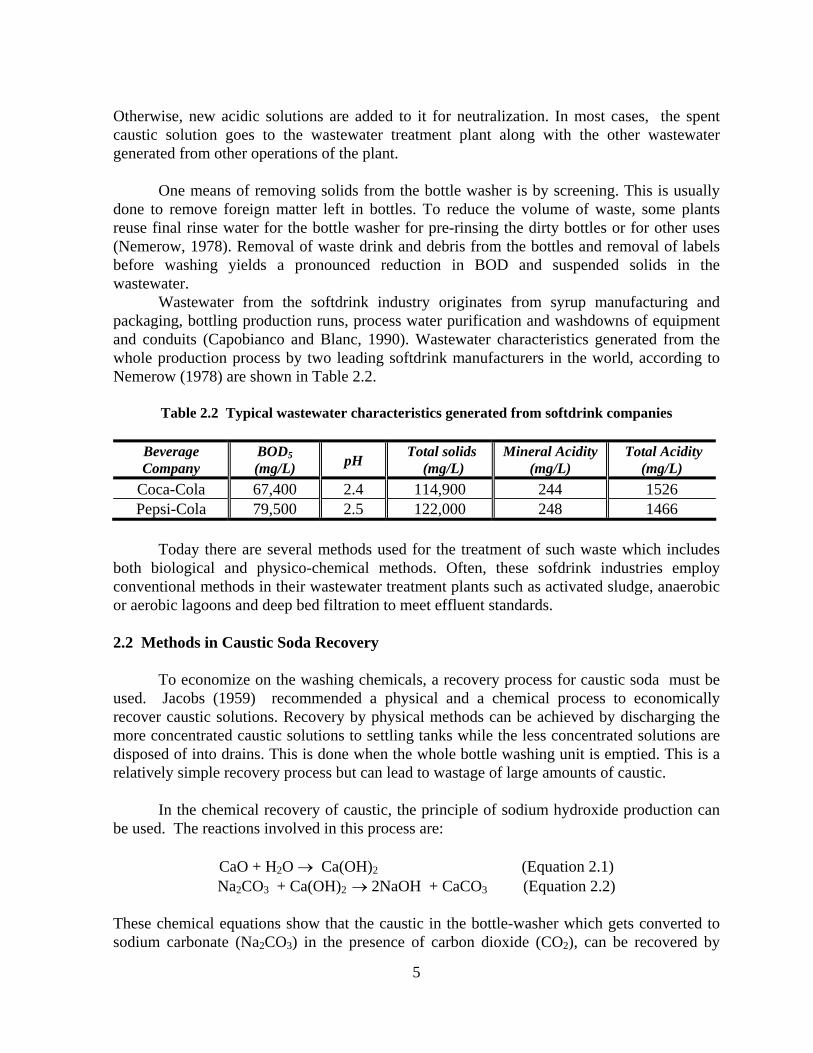
Table 2.2 Typical wastewater characteristics generated from softdrink companies
Beverage Company
BOD5(mg/L)
pH Total solids (mg/L)
Mineral Acidity (mg/L)
Total Acidity (mg/L)
Coca-Cola 67,400 2.4 114,900 244 1526 Pepsi-Cola 79,500 2.5 122,000 248 1466
Today there are several methods used for the treatment of such waste which includes both biological and physico-chemical methods. Often, these sofdrink industries employ conventional methods in their wastewater treatment plants such as activated sludge, anaerobic or aerobic lagoons and deep bed filtration to meet effluent standards. 2.2 Methods in Caustic Soda Recovery To economize on the washing chemicals, a recovery process for caustic soda must be used. Jacobs (1959) recommended a physical and a chemical process to economically recover caustic solutions. Recovery by physical methods can be achieved by discharging the more concentrated caustic solutions to settling tanks while the less concentrated solutions are disposed of into drains. This is done when the whole bottle washing unit is emptied. This is a relatively simple recovery process but can lead to wastage of large amounts of caustic. In the chemical recovery of caustic, the principle of sodium hydroxide production can be used. The reactions involved in this process are:
CaO + H2O → Ca(OH)2 (Equation 2.1) Na2CO3 + Ca(OH)2 → 2NaOH + CaCO3 (Equation 2.2)
These chemical equations show that the caustic in the bottle-washer which gets converted to sodium carbonate (Na2CO3) in the presence of carbon dioxide (CO2), can be recovered by
5

reacting it with lime. Thus, to recover the caustic, the spent washing solution is drawn off into a tank where it can undergo lime and heat treatment at around 93oC for 30 minutes. Then, the precipitates formed such as calcium carbonate, calcium citrate, calcium tartrate, calcium sulfate, etc., are allowed to settle for about 2 hours. After adjustment of the concentration, the clarified caustic solution can consequently be pumped back to the washer for reuse. The chemical recovery process may be more complicated because of the need for lime addition and heat generation (Jacobs, 1959). But, it also may prove to be economical as time and labor for frequent dumping of the spent caustic solution are reduced. Membrane technology developed in the recent years has likewise found its application in caustic soda recovery. A commercial product called SelRo membrane is claimed to be capable of recovery and concentration of NaOH and acids in industrial processes (Anonymous I, 1994). Another commercial product named Alkasave marketed by the same membrane-producing company, is also claimed to be successful in reclaiming strong alkaline cleaners from cleaning-in-place (CIP) streams in dairies and beverage plants (Anonymous II, 1995). It consists of small membrane plants equipped with tubular alkali-stable membranes that can be attached to the main NaOH tank (Figure 2.1). In this recovery system, caustic waste is collected in a feed tank and pumped to the membrane unit. The membrane will constantly remove dissolved and suspended organic contaminants from the caustic solution and the purified caustic obtained in the permeate can be sent back to the main NaOH tank. To maintain the flux, water is added to the recovery system feed tank in a diafiltration process. The recovery of caustic soda will therefore result to the reduction of input concentrated caustic solution in the industry. Experiments have proven that the Alkasave technology can be used to regenerate caustic from deacidification columns, debittering columns and evaporators of the juice industry.
Concentrate for discharge Dilute NaOH to wastes
NaOH Tank 2% NaOH
65°C 2-15 m3
Make up (48% NaOH) Make up water
Membrane recovery system
Diafiltration water
1.5 m3
Purified caustic (permeate)
CIP users
Concentrated NaOH to reuse
6
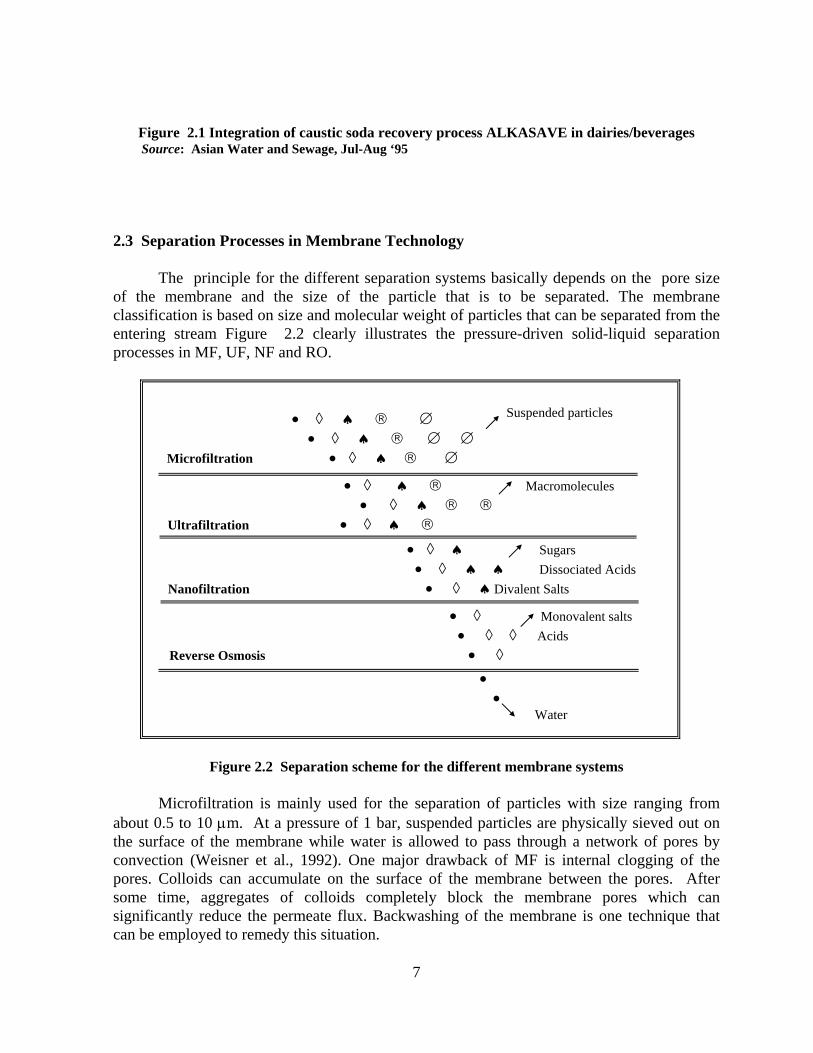
Figure 2.1 Integration of caustic soda recovery process ALKASAVE in dairies/beverages Source: Asian Water and Sewage, Jul-Aug ‘95
2.3 Separation Processes in Membrane Technology The principle for the different separation systems basically depends on the pore size of the membrane and the size of the particle that is to be separated. The membrane classification is based on size and molecular weight of particles that can be separated from the entering stream Figure 2.2 clearly illustrates the pressure-driven solid-liquid separation processes in MF, UF, NF and RO.
• ◊ ♠ Sugars • ◊ ♠ ♠ Dissociated Acids Nanofiltration • ◊ ♠ Divalent Salts
• ◊ Monovalent salts • ◊ ◊ Acids Reverse Osmosis • ◊
• ◊ ♠ ® Macromolecules • ◊ ♠ ® ® Ultrafiltration • ◊ ♠ ®
• • Water
Microfiltration
Suspended particles • ◊ ♠ ® ∅ • ◊ ♠ ® ∅ ∅ • ◊ ♠ ® ∅
Figure 2.2 Separation scheme for the different membrane systems
Microfiltration is mainly used for the separation of particles with size ranging from about 0.5 to 10 µm. At a pressure of 1 bar, suspended particles are physically sieved out on the surface of the membrane while water is allowed to pass through a network of pores by convection (Weisner et al., 1992). One major drawback of MF is internal clogging of the pores. Colloids can accumulate on the surface of the membrane between the pores. After some time, aggregates of colloids completely block the membrane pores which can significantly reduce the permeate flux. Backwashing of the membrane is one technique that can be employed to remedy this situation.
7

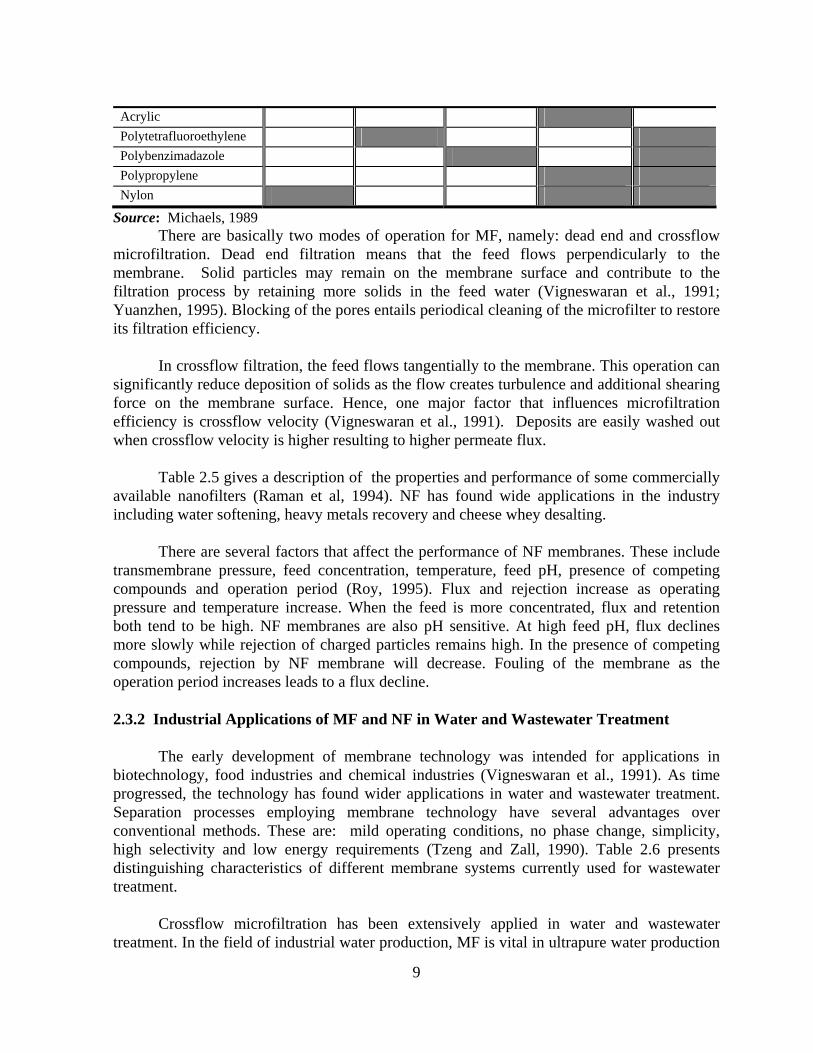
On the other hand, ultrafiltration and nanofiltration are often classified according to the smallest molecular weight of material that has been found to be rejected by the membrane. Typical UF membranes are made up of sheets of film which reject from water organics with a molecular weight range of 1,000 to 80,000 (Hauck and Masoomian, 1990). The transfer mechanism that UF employs are sieving and preferential adsorption through the membrane. Solutions of macromolecules have very small osmotic pressures thus UF membranes do not need to use high pressures to get a reasonable permeate flux (Pepper, 1981). Nanofiltration, with separation characteristics falling between RO and UF has a molecular weight cutoff (MWCO) range of 100-200 daltons. At pressures ranging between 6-20 bar, the separation process involves two mechanisms: sieving and electrostatic interaction (Roy, 1995). These multiple thin-film composites of polymers are porous and are capable of sieving compounds with size greater than 2 nm. At the same time, due to the negatively-charged active layer of most NF membranes (Raman et al., 1994) salt rejection can occur by electrostatic repulsion. The MWCO which characterizes the membrane should merely be considered as a rough indication of its ability to reject particular compounds because other factors such as molecular shape and polarity also affect its removal efficiency (Weisner et al., 1992). Reverse osmosis is used for the production of pure water for domestic or industrial uses. At pressures between 20-80 bar, the thin non-porous RO membrane with pore size ranging from 3-1000° A, allows water to pass by diffusion while rejecting all other solutes. 2.3.1 Microfiltration and Nanofiltration Membranes Commercially-available membranes have different configurations. It can be a flat sheet, tubular element, hollow fiber, spiral wound or a plate and frame element. Each configuration would cater to a different need in a particular process, depending on the feed water characteristics. Microfiltration has found much application in concentration of liquids, regeneration of valuable process liquids, recovery of valuable by-products, etc. Some commercially available microfilters made from organic polymers in various geometries are listed in Table 2.3 (Michaels, 1989). Table 2.4 also indicate the different microfilter materials and the characteristics of chemicals they are compatible with.
Table 2.3 List of commercial crossflow microfilter polymeric materials and their geometries
MATERIAL
GEOMETRIES Pleated
sheet Tubular Spiral
Wound Hollow fiber Flat sheet
Cellulosics Polysulfone Polyvinylidene flouride
8
Acrylic Polytetrafluoroethylene Polybenzimadazole Polypropylene Nylon
Source: Michaels, 1989 There are basically two modes of operation for MF, namely: dead end and crossflow microfiltration. Dead end filtration means that the feed flows perpendicularly to the membrane. Solid particles may remain on the membrane surface and contribute to the filtration process by retaining more solids in the feed water (Vigneswaran et al., 1991; Yuanzhen, 1995). Blocking of the pores entails periodical cleaning of the microfilter to restore its filtration efficiency. In crossflow filtration, the feed flows tangentially to the membrane. This operation can significantly reduce deposition of solids as the flow creates turbulence and additional shearing force on the membrane surface. Hence, one major factor that influences microfiltration efficiency is crossflow velocity (Vigneswaran et al., 1991). Deposits are easily washed out when crossflow velocity is higher resulting to higher permeate flux. Table 2.5 gives a description of the properties and performance of some commercially available nanofilters (Raman et al, 1994). NF has found wide applications in the industry including water softening, heavy metals recovery and cheese whey desalting. There are several factors that affect the performance of NF membranes. These include transmembrane pressure, feed concentration, temperature, feed pH, presence of competing compounds and operation period (Roy, 1995). Flux and rejection increase as operating pressure and temperature increase. When the feed is more concentrated, flux and retention both tend to be high. NF membranes are also pH sensitive. At high feed pH, flux declines more slowly while rejection of charged particles remains high. In the presence of competing compounds, rejection by NF membrane will decrease. Fouling of the membrane as the operation period increases leads to a flux decline. 2.3.2 Industrial Applications of MF and NF in Water and Wastewater Treatment The early development of membrane technology was intended for applications in biotechnology, food industries and chemical industries (Vigneswaran et al., 1991). As time progressed, the technology has found wider applications in water and wastewater treatment. Separation processes employing membrane technology have several advantages over conventional methods. These are: mild operating conditions, no phase change, simplicity, high selectivity and low energy requirements (Tzeng and Zall, 1990). Table 2.6 presents distinguishing characteristics of different membrane systems currently used for wastewater treatment. Crossflow microfiltration has been extensively applied in water and wastewater treatment. In the field of industrial water production, MF is vital in ultrapure water production
9

10
for the electronics industry, sterile water for pharmaceuticals, etc. (Vigneswaran et al., 1991). MF is also profitable for treatment of wastewater from various industries such as pulp and paper, textile and other biotechnological and agro-based industries.

11
Table 2.4 Chemicals compatible with various commercially-available microfilter media
CHEMICALS
COMPATIBLE MEDIA
Ceramics
Acrylics
Carbon
PBM
poly-S
PTFE
poly-P
PVF
other polymers
SHR alloys
S-316 SS
other metals
SCR alloys
Allkanes, alkenes and aromatic HCs, < 100oC
O2-containing organics, < 100oC
Chlorinated organics, < 100oC
Esters, < 100oC Organics, at 100-200oC Aquoeus solutions: pH= 3 - 7, no chlorides pH= 7-10, no chlorides pH= 0 - 3 (except HF) pH=3-10, with chlorides pH= 10-13 pH>13 Steam (>100oC) Oxidants (e.g. bleach)
Source: Michaels, 1989 Note:
PBM - polybenzimadazole PVF - polyvinylidene fluoride poly-S - polysulfone SHR - sintered halide-resistant PTFE - polytetrafluoroethylene S-312 ss - sintered 316- stainless steel poly-P - polypropylene SCR - sintered chloride-resistant
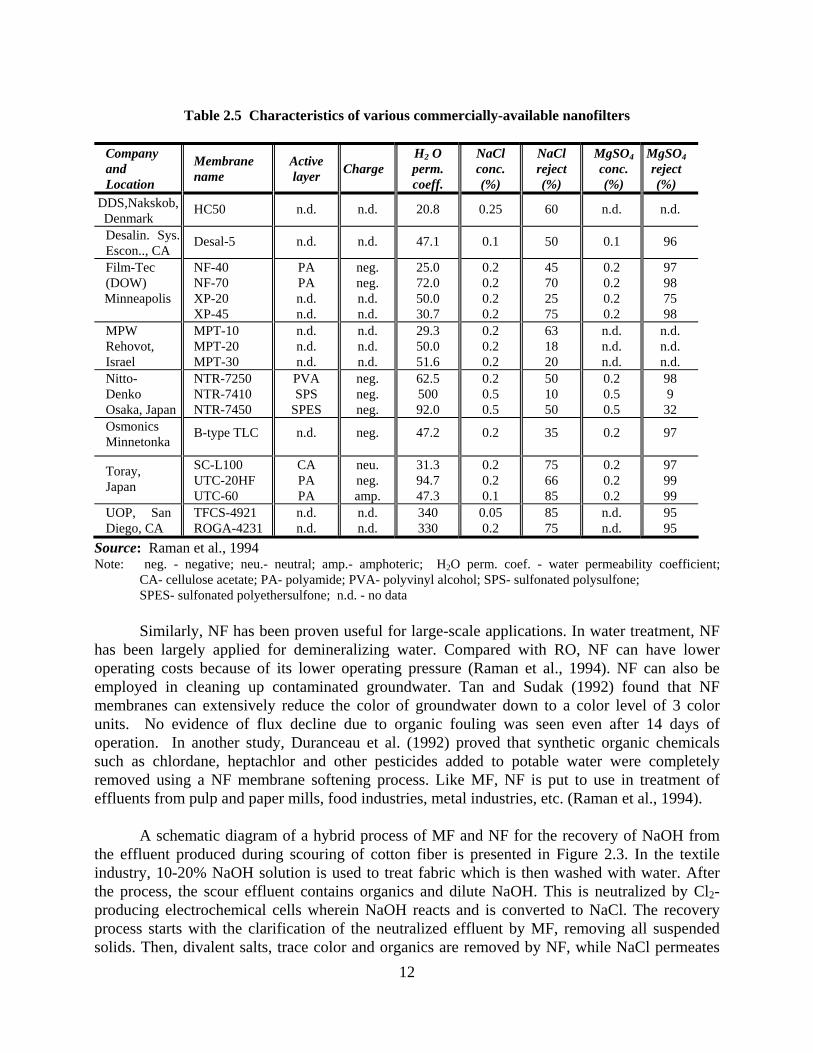
Table 2.5 Characteristics of various commercially-available nanofilters
Company and Location
Membrane name
Active layer
Charge
H2 O perm. coeff.
NaCl conc. (%)
NaCl reject (%)
MgSO4 conc. (%)
MgSO4 reject (%)
DDS,Nakskob, Denmark
HC50
n.d.
n.d.
20.8
0.25
60
n.d.
n.d.
Desalin. Sys. Escon.., CA
Desal-5
n.d.
n.d.
47.1
0.1
50
0.1
96
Film-Tec (DOW)
Minneapolis
NF-40 NF-70 XP-20 XP-45
PA PA n.d. n.d.
neg. neg. n.d. n.d.
25.0 72.0 50.0 30.7
0.2 0.2 0.2 0.2
45 70 25 75
0.2 0.2 0.2 0.2
97 98 75 98
MPW Rehovot, Israel
MPT-10 MPT-20 MPT-30
n.d. n.d. n.d.
n.d. n.d. n.d.
29.3 50.0 51.6
0.2 0.2 0.2
63 18 20
n.d. n.d. n.d.
n.d. n.d. n.d.
Nitto-Denko Osaka, Japan
NTR-7250 NTR-7410 NTR-7450
PVA SPS
SPES
neg. neg. neg.
62.5 500 92.0
0.2 0.5 0.5
50 10 50
0.2 0.5 0.5
98 9
32 Osmonics Minnetonka
B-type TLC
n.d.
neg.
47.2
0.2
35
0.2
97
Toray, Japan
SC-L100 UTC-20HF UTC-60
CA PA PA
neu. neg. amp.
31.3 94.7 47.3
0.2 0.2 0.1
75 66 85
0.2 0.2 0.2
97 99 99
UOP, San Diego, CA
TFCS-4921 ROGA-4231
n.d. n.d.
n.d. n.d.
340 330
0.05 0.2
85 75
n.d. n.d.
95 95
Source: Raman et al., 1994 Note: neg. - negative; neu.- neutral; amp.- amphoteric; H2O perm. coef. - water permeability coefficient; CA- cellulose acetate; PA- polyamide; PVA- polyvinyl alcohol; SPS- sulfonated polysulfone; SPES- sulfonated polyethersulfone; n.d. - no data Similarly, NF has been proven useful for large-scale applications. In water treatment, NF has been largely applied for demineralizing water. Compared with RO, NF can have lower operating costs because of its lower operating pressure (Raman et al., 1994). NF can also be employed in cleaning up contaminated groundwater. Tan and Sudak (1992) found that NF membranes can extensively reduce the color of groundwater down to a color level of 3 color units. No evidence of flux decline due to organic fouling was seen even after 14 days of operation. In another study, Duranceau et al. (1992) proved that synthetic organic chemicals such as chlordane, heptachlor and other pesticides added to potable water were completely removed using a NF membrane softening process. Like MF, NF is put to use in treatment of effluents from pulp and paper mills, food industries, metal industries, etc. (Raman et al., 1994). A schematic diagram of a hybrid process of MF and NF for the recovery of NaOH from the effluent produced during scouring of cotton fiber is presented in Figure 2.3. In the textile industry, 10-20% NaOH solution is used to treat fabric which is then washed with water. After the process, the scour effluent contains organics and dilute NaOH. This is neutralized by Cl2-producing electrochemical cells wherein NaOH reacts and is converted to NaCl. The recovery process starts with the clarification of the neutralized effluent by MF, removing all suspended solids. Then, divalent salts, trace color and organics are removed by NF, while NaCl permeates 12

the membrane. Finally, the permeate passes through the electrochemical cell which regenerates NaOH from NaCl.
Table 2.6 Membrane separation technologies for wastewater treatment @
FEATURE MF UF NF RO Electrodialysis Suspended Solids removal
Excellent Impractical Impractical Impractical N/A
Dissolved organic removal
N/A Excellent1 Excellent1 Excellent1 N/A
VOC removal N/A Poor Fair1 Fair-good1 N/A Dissolved inorganic removal
N/A N/A Good (function of salt species)
Very good (90-99% removal)
Osmotic pressure effects
None Minor Significant High None
Concentration capabilities
Up to 5% total solids
Up to 50% organics
Up to 15%2 Up to 15% Up to 20% (ionic
concentration) Permeate quality Excellent Excellent Good Excellent Good Operating pressure (bar)
1-3 4-7 5-20 15-70 Function of ionic
concentration Capital costs ($/m3 -day)
132-1,320 132-1,848 132-1,320 132-1,320 132-1,056
Operating cost ($/1,000 m3 feed rate)
132-1,056 132-792 198-792 264-792 132-264
1 - Function of molecular weight N/A - not applicable 2 - Function of osmotic pressure
@ Modified from Cartwright, 1994
Recovered NaOH (10-20%)
Fabric Scour saturator
Scour wash range
Water
Electrochemical membrane
Depleted
(0.05% NaCl, pH 4-7)
H2
Organics and polyvalent ions
Scour
NeutralizationChlorine
Neutralized effluent
(pH 7.5-8.5, 3-4%
MF
NF
Organics
(when needed)
Reducing agent NaOH recycle loop
Figure 2.3 NaOH recovery from textile industrial effluents using MF-NF process
Source: Raman et al., 1994 2.4 Zero Liquid Discharge in Industries 13

Problems with rising prices, droughts and increasingly stringent environmental regulations have driven beverage industries to seriously consider programs for the reduction of water consumption. Water use reduction and recycling of treated effluents can bring about considerable cost savings in terms of reduced labor, maintenance, power and chemical costs (Herer, 1992). In the United States, many manufacturing plants have benefited from water reuse which results to lower water and sewer charges. This is often brought about by process modifications implemented by the companies.
A facility called zero discharge is one systematic approach to water reuse (Byers, 1995). It means that no wastewater gets discharged to a receiving surface water. This is the aim set by manufacturing plants which consider that treatment and reuse of total plant effluent is more cost-effective than to treat it for discharge (Rosain, 1993). Zero discharge will then eliminate the reliance of a manufacturing plant on raw water. However, it has the following drawbacks:
• Scaling problems may occur due to the increase in salt concentration in water after several cycles of reuse
• Trace elements in water are also built-up • For recycling purposes, the wastewater may have to be treated unnecessarily beyond
effluent standards • Loss of company’s right to get water available in their area • Reduced plant reliability as operation is reconfigured to suit the new source of water
The general approaches to zero discharge can take many forms (Boffardi and Smith, 1995; Mooney, 1992). Reduction and reuse of wastes may be achieved by a change in the production technology and equipment for better process efficiencies or in-process recycling of potential wastes. For example, a coal-fired power plant in an arid region in the United States has successfully implemented a zero discharge program (Byers, 1995). By switching from a once-through cooling system to a cooling tower with a recirculating system, the water intake demand from the plant‘s water source was dramatically reduced. On the other hand, Cappos (1995) claims that zero discharge is an intense process which entails a series of filtering and purifying technologies to achieve discharge goals. Hence, membrane technologies which are capable of doing this can play a big role in achieving zero discharge. In the USA, a 500-megawatt Ocean State Power installation set up a zero discharge facility after it was mandated by law not to discharge liquid stream from the site (Kiernan et al., 1992). The company utilizes electrodialysis (EDR) membrane technology which removes dissolved salts from the feed water as it flows across the surface of the membrane by electrically-driven migration of ions. This system recovers water that is recycled back to the cooling tower. Likewise, the EDR unit preconcentrates the wastewater solids prior to evaporation and crystallization.
14
CHAPTER 3
Background Information on the Research Site
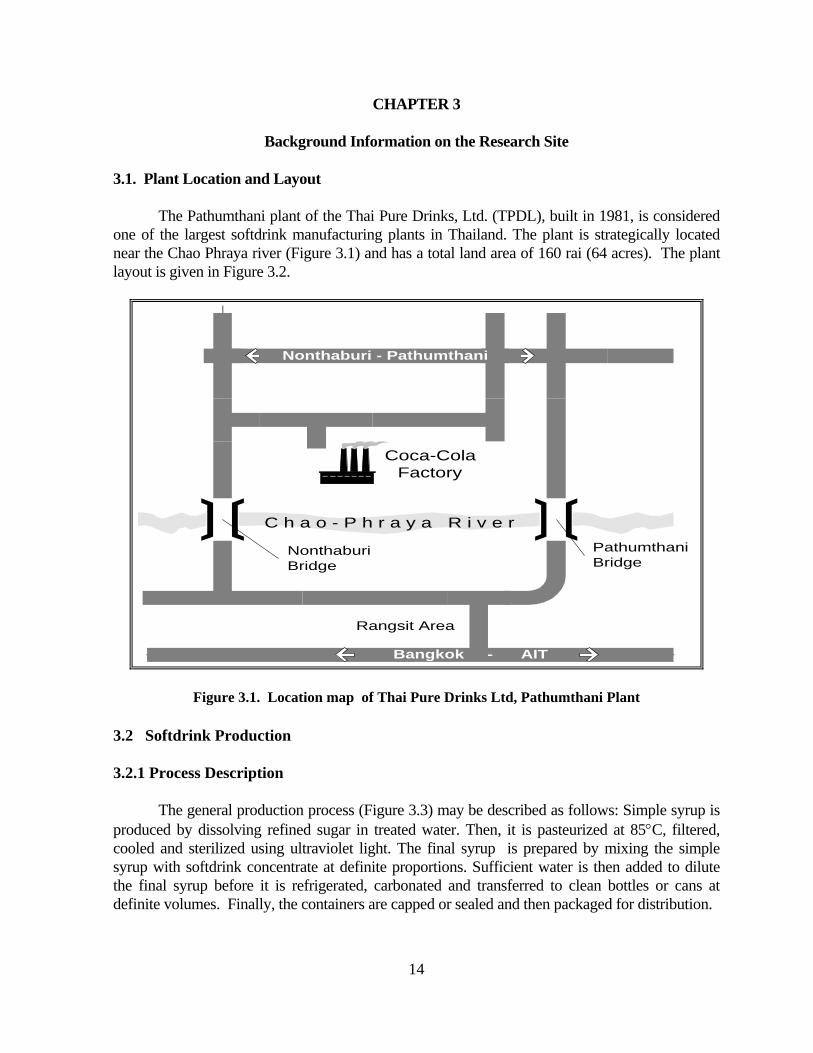
3.1. Plant Location and Layout The Pathumthani plant of the Thai Pure Drinks, Ltd. (TPDL), built in 1981, is considered one of the largest softdrink manufacturing plants in Thailand. The plant is strategically located near the Chao Phraya river (Figure 3.1) and has a total land area of 160 rai (64 acres). The plant layout is given in Figure 3.2.
Nonthaburi - Pathumthani
C h a o - P h r a y a R i v e rPathumthaniBridge
Rangsit Area
NonthaburiBridge
Coca-ColaFactory
Bangkok - AIT
Figure 3.1. Location map of Thai Pure Drinks Ltd, Pathumthani Plant
3.2 Softdrink Production 3.2.1 Process Description The general production process (Figure 3.3) may be described as follows: Simple syrup is produced by dissolving refined sugar in treated water. Then, it is pasteurized at 85°C, filtered, cooled and sterilized using ultraviolet light. The final syrup is prepared by mixing the simple syrup with softdrink concentrate at definite proportions. Sufficient water is then added to dilute the final syrup before it is refrigerated, carbonated and transferred to clean bottles or cans at definite volumes. Finally, the containers are capped or sealed and then packaged for distribution.
14

15
TRAININGCENTER
W A R E H O U S E
SALES BUILDINGCANTEEN
GATE
P A R K I N G A R E A
BW-D2
PRODUCTION LINE D2
BW-D1
BW-B
BW-A
PRODUCTION LINE D1
PRODUCTION LINE B
PRODUCTION LINE A
PRODUCTSTOCKROOM
RAW MATERIALS ROOM
POST-MIXPRODUCTION
LINE
PET PRODUCTION LINE
WATERTREATMENT
PLANT C
WATERTREATMENT
PLANT D
WATERTREATMENTPLANT AB
BOILER 1 SCRUBBER 1REFRIGERATION
PLANT 1
FINALSYRUPROOM
SIMPLESYRUPROOM
FINALSYRUPROOM
SIMPLESYRUPROOM
BOILER 2
Scrubber 2
REFRIGERATIONPLANT 2
OFFICES SUGARSTORAGE
ROOM
PETBOTTLE
STORAGEROOM
PETBLOWING
ROOM
BIOLOGICAL WASTEWATER TREATMENT PLANT
RAW WATERTREATMENT
PLANT
Figure 3.2 Plant layout of TPDL, Pathumthani Plant

16
Legend: 1 - delivery of returnable bottles 6 - bottle filling 11 - water treatment 2 - automatic uncasing 7 - bottle crowning 12 - refrigeration 3 - visual inspection of dirty bottles 8 - case packing 13 - proportionation 4 - bottle washing 9 - pallet loading 14 - carbonation 5 - empty bottle inspection 10 - case inspction 15 - syrup preparation
Figure 3.3. Process flow diagram of softdrinks production by TPDL
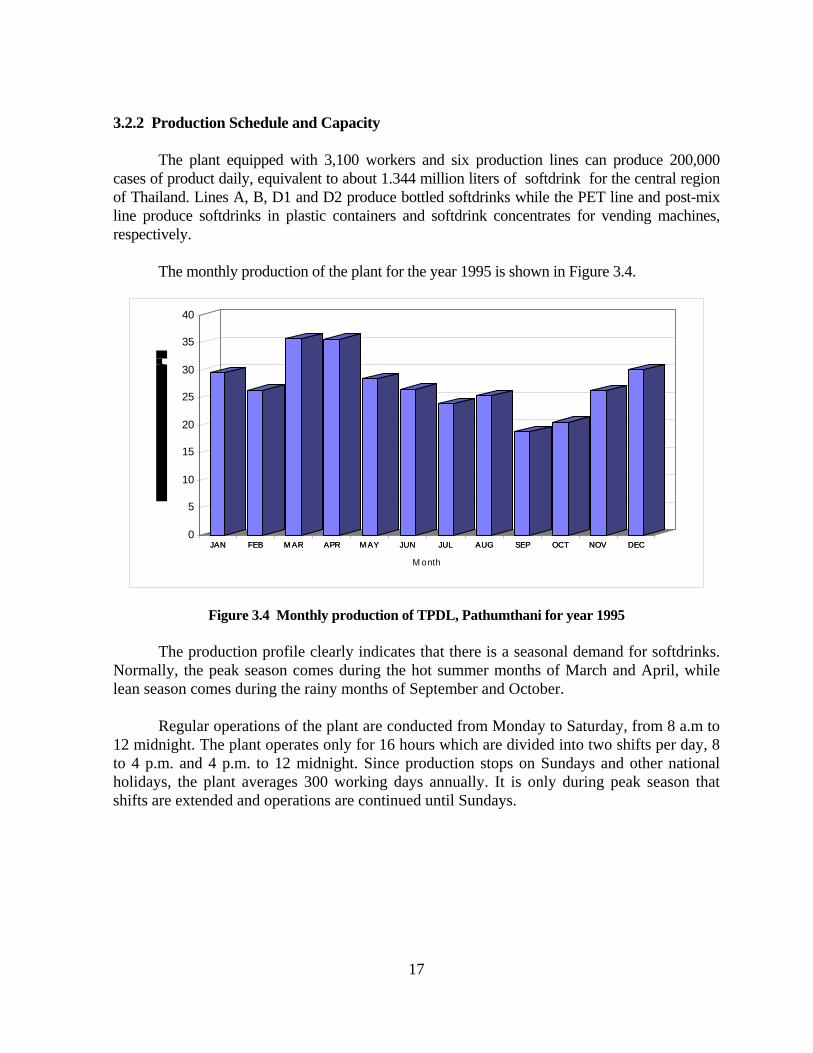
3.2.2 Production Schedule and Capacity The plant equipped with 3,100 workers and six production lines can produce 200,000 cases of product daily, equivalent to about 1.344 million liters of softdrink for the central region of Thailand. Lines A, B, D1 and D2 produce bottled softdrinks while the PET line and post-mix line produce softdrinks in plastic containers and softdrink concentrates for vending machines, respectively. The monthly production of the plant for the year 1995 is shown in Figure 3.4.
JAN FEB M AR APR M AY JUN JUL AUG SEP OCT NOV DEC0
5
10
15
20
25
30
35
40
JAN FEB M AR APR M AY JUN JUL AUG SEP OCT NOV DEC
M onth
Figure 3.4 Monthly production of TPDL, Pathumthani for year 1995
The production profile clearly indicates that there is a seasonal demand for softdrinks. Normally, the peak season comes during the hot summer months of March and April, while lean season comes during the rainy months of September and October. Regular operations of the plant are conducted from Monday to Saturday, from 8 a.m to 12 midnight. The plant operates only for 16 hours which are divided into two shifts per day, 8 to 4 p.m. and 4 p.m. to 12 midnight. Since production stops on Sundays and other national holidays, the plant averages 300 working days annually. It is only during peak season that shifts are extended and operations are continued until Sundays.
17

18
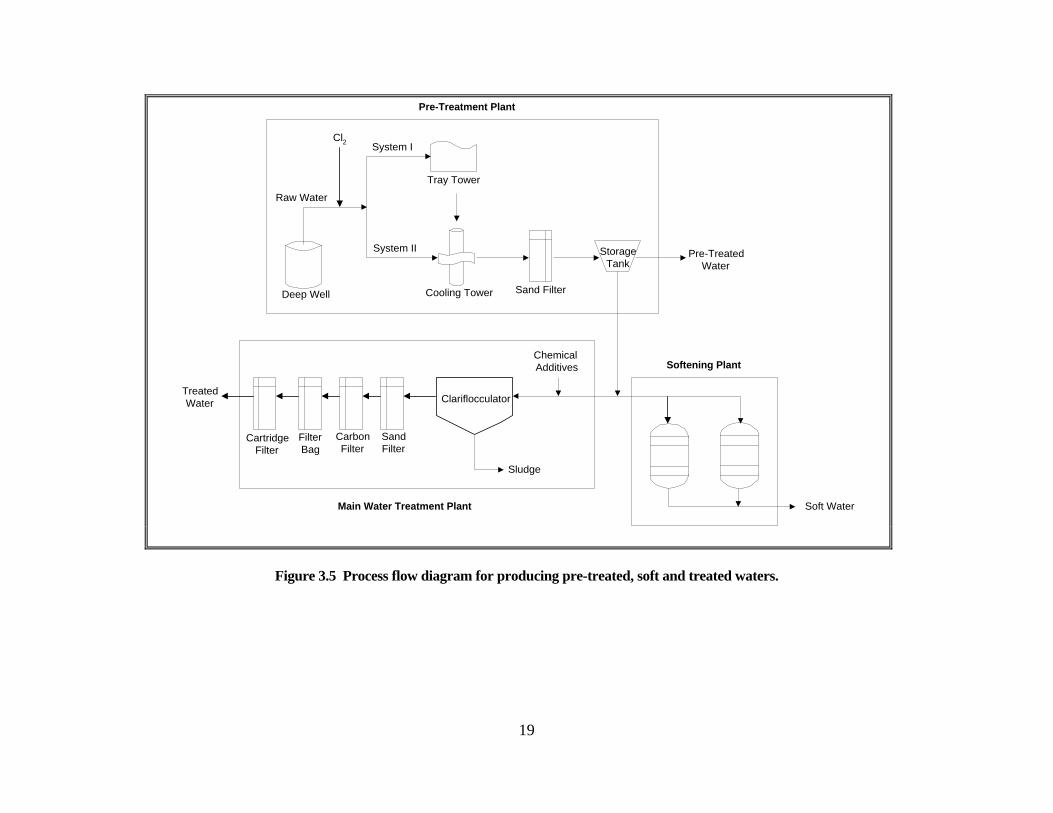
3.3 Water and Wastewater Sources and Treatment 3.3.1 Water Source and Treatment Process The plant is equipped with water treatment systems to meet the various types of need in their operations. Raw water drawn from underground sources is treated in several ways, to produce pre-treated, soft and treated waters. A schematic diagram of the treatment system is shown in Figure 3.5. There are two existing systems of treating raw water to produce pre-treated water. In System I, water pumped out of a well is chlorinated and passed through a tray tower packed with large chunks of coke before it is cooled from about 49 to 36°C by a cooling tower. The cooled water is then passed through a sand filter before it goes to a storage tank. System II follows the same process except that the water pumped from the well does not pass through the tray tower but goes straight to the cooling tower and sand filter before storage. This pre-treatment system primarily removes undesirable gases such as H2S and CO2, reduces the temperature of the process water and oxidizes iron and manganese which can affect the taste of beverages. To produce soft water needed in boilers, bottle washers, etc., the pre-treated water is passed through cation exchange columns which remove scale-causing divalent ions. The output water of each of the twelve softener tanks are collected into a common distribution pipe that leads to various unit processes. For precautionary measures, the input to boilers further goes through an additional softener tank before it enters the unit. This ensures that the water used in steam generation will not cause corrosion in the boiler or return system or form scale or other deposits (Moore, 1989). When the breakthrough point is reached - that is, when the total hardness of the exiting water reaches 30 mg/L as CaCO3, the resin in each softener tank is regenerated with 10% NaCl solution. The regeneration process starts with backwashing of the column to flush out any impurities adhering to the resin. The column is then soaked thoroughly in brine solution afterwhich it is rinsed-off. The backwash water which is loaded with calcium chloride is disposed of as waste. On the other hand, treated water is produced by further purification of the pre-treated water. From the storage tank, it is sent to an accelator (or clariflocculator) where several chemicals are added by in-line mixing. Chemicals such as calcium chloride, calcium hydroxide for neutralization, precipitation and carbonate removal, calcium hypochlorite for disinfection purposes and ferrous sulfate as flocculant are mixed with the influent to the clariflocculator. The sludge formed is drained to a sedimentation pond while the clarified water is pumped through a series of pressure filters of sand, activated carbon, filter bag and cartridge. The filter bag and cartridge filter both serve the same purpose as final polishers that remove any color, taste or odor from the treated water.
Deep Well
Raw Water
Cl2
Cooling Tower
Tray Tower
System I
System II
Sand Filter
StorageTank
Pre-TreatedWater
CartridgeFilter
FilterBag
CarbonFilter
SandFilter
Clariflocculator
Sludge
Chemical Additives
Soft Water
TreatedWater
Pre-Treatment Plant
Softening Plant
Main Water Treatment Plant
19
Figure 3.5 Process flow diagram for producing pre-treated, soft and treated waters.
20
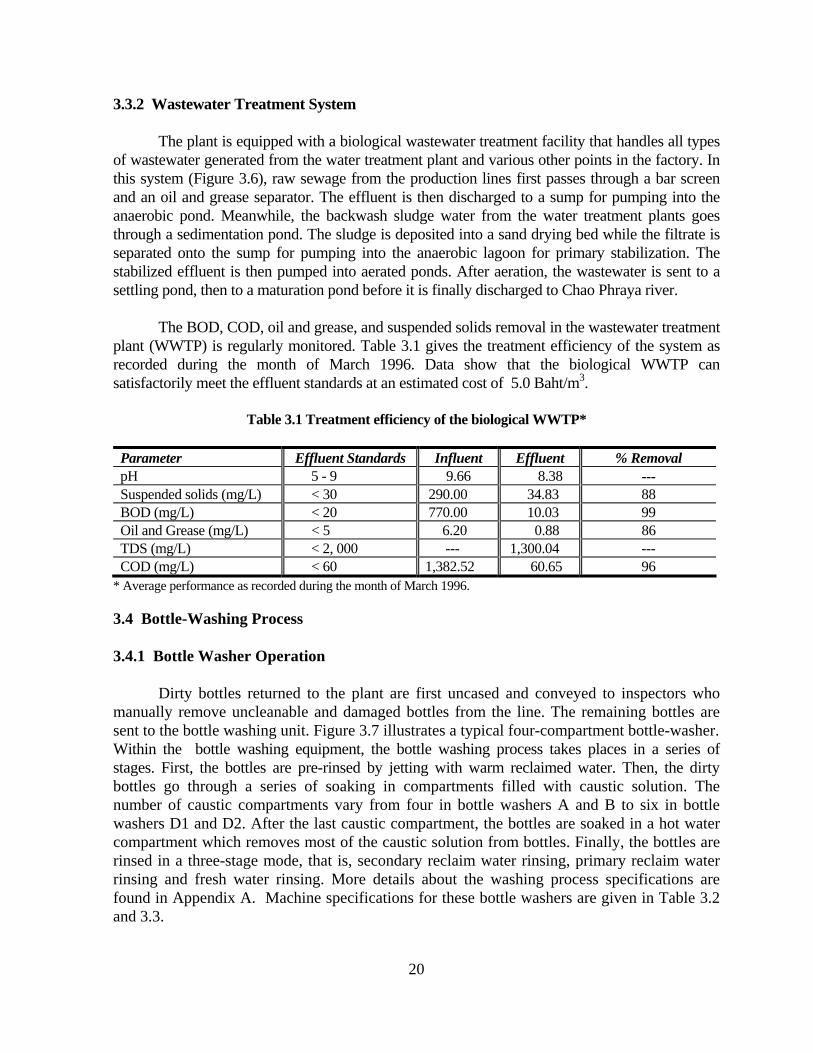
3.3.2 Wastewater Treatment System The plant is equipped with a biological wastewater treatment facility that handles all types of wastewater generated from the water treatment plant and various other points in the factory. In this system (Figure 3.6), raw sewage from the production lines first passes through a bar screen and an oil and grease separator. The effluent is then discharged to a sump for pumping into the anaerobic pond. Meanwhile, the backwash sludge water from the water treatment plants goes through a sedimentation pond. The sludge is deposited into a sand drying bed while the filtrate is separated onto the sump for pumping into the anaerobic lagoon for primary stabilization. The stabilized effluent is then pumped into aerated ponds. After aeration, the wastewater is sent to a settling pond, then to a maturation pond before it is finally discharged to Chao Phraya river. The BOD, COD, oil and grease, and suspended solids removal in the wastewater treatment plant (WWTP) is regularly monitored. Table 3.1 gives the treatment efficiency of the system as recorded during the month of March 1996. Data show that the biological WWTP can satisfactorily meet the effluent standards at an estimated cost of 5.0 Baht/m3.
Table 3.1 Treatment efficiency of the biological WWTP*
Parameter Effluent Standards Influent Effluent % Removal pH 5 - 9 9.66 8.38 --- Suspended solids (mg/L) < 30 290.00 34.83 88 BOD (mg/L) < 20 770.00 10.03 99 Oil and Grease (mg/L) < 5 6.20 0.88 86 TDS (mg/L) < 2, 000 --- 1,300.04 --- COD (mg/L) < 60 1,382.52 60.65 96
* Average performance as recorded during the month of March 1996. 3.4 Bottle-Washing Process 3.4.1 Bottle Washer Operation Dirty bottles returned to the plant are first uncased and conveyed to inspectors who manually remove uncleanable and damaged bottles from the line. The remaining bottles are sent to the bottle washing unit. Figure 3.7 illustrates a typical four-compartment bottle-washer. Within the bottle washing equipment, the bottle washing process takes places in a series of stages. First, the bottles are pre-rinsed by jetting with warm reclaimed water. Then, the dirty bottles go through a series of soaking in compartments filled with caustic solution. The number of caustic compartments vary from four in bottle washers A and B to six in bottle washers D1 and D2. After the last caustic compartment, the bottles are soaked in a hot water compartment which removes most of the caustic solution from bottles. Finally, the bottles are rinsed in a three-stage mode, that is, secondary reclaim water rinsing, primary reclaim water rinsing and fresh water rinsing. More details about the washing process specifications are found in Appendix A. Machine specifications for these bottle washers are given in Table 3.2 and 3.3.

WaterTreatment
Room
SandDryingBed
Screen
Oil andGrease
Separator
Sedimentation Pond
Sump
RainwaterSump
C H
A
O
P
H
R
A
Y
A
R
I V
E
R
Rainwater Drainage
Effluent
Influent
Raw Sewage
BackwashSludge Water
Pond 2
Pond 3A
Pond 4
Pond 5
Pond 1Pond 3B
Production Line
Legend: Pond No Type of Pond Volume capacity (m3) Hydraulic retention time (d)
1 Anaerobic Pond 46,000 10.0 2 Main Aerated Pond 19,040 4.1
3A Supplementary Aerated 20,672 4.5 3B Supplementary Aerated 20,448 4.4 4 Settling Pond 64,976 14.1 5 Maturation Pond 22,000 4.8
Figure 3.6 Wastewater treatment system of TPDL, Pathumthani Plant
21
22
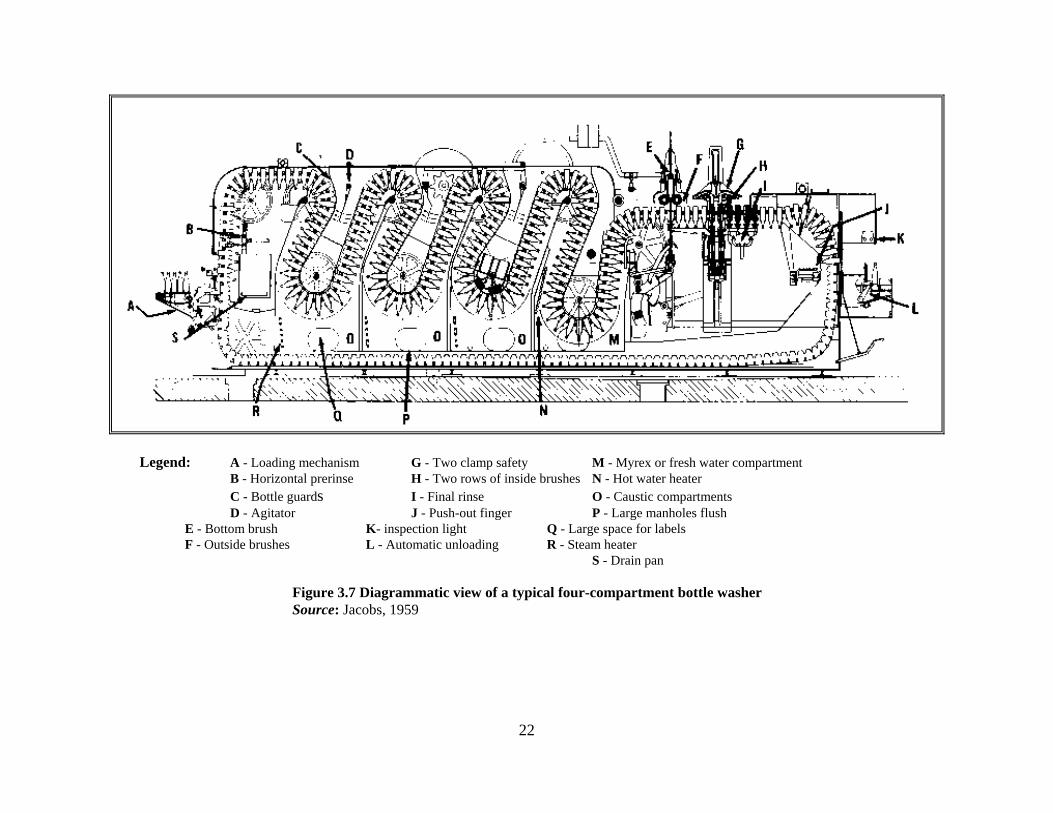
Legend: A - Loading mechanism G - Two clamp safety M - Myrex or fresh water compartment B - Horizontal prerinse H - Two rows of inside brushes N - Hot water heater C - Bottle guards I - Final rinse O - Caustic compartments D - Agitator J - Push-out finger P - Large manholes flush E - Bottom brush K- inspection light Q - Large space for labels F - Outside brushes L - Automatic unloading R - Steam heater S - Drain pan
Figure 3.7 Diagrammatic view of a typical four-compartment bottle washer Source: Jacobs, 1959
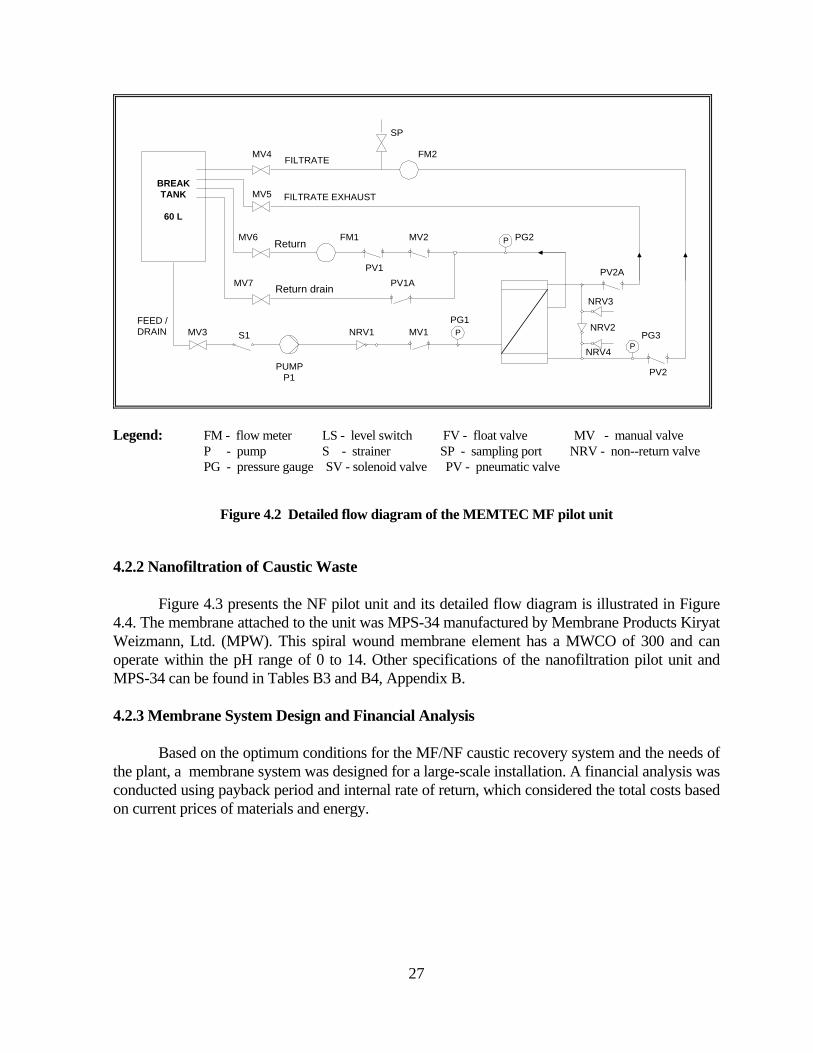
23
The bottles that come out of the bottle washers are further inspected before they can be filled by the product. It must be emphasized that these specifications for the soaking and rinsing processes, proper temperature, caustic solution concentration and contact time must be carefully observed in order to efficiently clean the bottles.
Table 3.2 Specifications of the soaking compartments of Bottle Washers A and B
Caustic Tank No. No. 1 No. 2 No. 3 No. 4 No. 5 TOTAL Capacity of Caustic Tank (m3) 15 15 25 15 9 79 No. of Immersion Carriers 36 36 48 36 17 173 Temperature of Caustic (oC) 50 65 70 55~65 40~50 --- Concentration of Caustic (%) 3 3 3 1.5 0 ---
Table 3.3 Specifications of the soaking compartments of Bottle Washers D1 and D2
Caustic Tank No. No. 1 No. 2 No. 3 No. 4,5 No. 6 No. 7 TOTAL Capacity of Caustic Tank (m3)
6.1 6.1 6.1 6.1 6.1 4.5 41.1
No. of Immersion Carriers
33 33 33 33 33 21 219
Temperature of Caustic (oC)
50 65 65 65 55~65 40~50 ---
Concentration of Caustic (%)
3 3 3 3 3 0~0.1 ---
3.4.2 Caustic Cleaning Solution In bottle-washing, caustic soda functions both as cleanser and an effective germicide. In most bottle washing plants, it is considered more profitable to use caustic solution over other available alkali mainly because it is cheaper and is less prone to thermal shock. As a hot solution, it attacks glass and softens its surface. Thus, organic matter is dissolved, grease and oil are emulsified and dirt is removed in suspension. The factory uses a 32% NaOH stock solution for their bottle washing operations. The monthly consumption of this solution in their bottle washers for the year 1995 is shown in Figure 3.8. At the price of 4.60 Baht per kilo, the plant’s expenditure on caustic soda alone reached 6.60 million Baht in 1995.

The causticity of each soaking compartment is monitored twice every shift by the quality control department. To adjust the caustic concentration according to specifications, fresh caustic solution (32%) is added to deficient compartments. Caustic solutions are totally drained out of the bottle washers only after the bottle washer reaches an operating time of 1,000 hours. This means that the caustic solution in the compartments is reused for a period of 1,000 hours. Sometime in 1994, the plant attempted to recover the caustic solution upon draining by passing the solution through a sand filter. This recovery system however was not successful as the coloring substances in the solution were retained after filtration. After a few attempts, the caustic recovery project was abandoned that same year.
JAN FEB M AR APR M AY JUN JUL AUG SEP OCT NOV DEC0
20
40
60
80
100
120
140
160
JAN FEB M AR APR M AY JUN JUL AUG SEP OCT NOV DEC
M onth
Figure 3.8. Monthly caustic soda (32% solution) consumption for the year 1995
24

25
CHAPTER 4
Methodology 4.1 Caustic Solution Characterization Weekly samplings were carried out to characterize the caustic soda used in the different soaking compartments of bottle-washers in production lines A and B. Variations in the characteristics of caustic soda solution (per compartment) as production time increased were monitored until the caustic solution was totally drained out of bottle-washer A. The characterization summary is shown in Table 4.1. All analyses were performed before the pilot-scale studies began.
Table 4.1 Parameters measured for caustic solution characterization
PARAMETERS MEASURED UNIT METHOD/EQUIPMENT pH ----- Milwaukee pH 200 portable meter Suspended Solids (SS) mg/L standard method* Total Dissolved Solids (TDS) mg/L standard method Chemical Oxygen Demand (COD) mg/L closed reflux dichromate method Apparent Color Hazen units NDH Lovibond Nesslerizer MK.3 Turbidity NTU HACH turbidimeter Model 2100A Conductivity mS/cm TOA Conduct meter, Model CM-2A NaOH concentration % (w/w) titrimetric
* SOURCE: Standard Methods, APHA, AWWA, WPCF, 1985 4.2 Pilot-scale Membrane Filtration of Caustic Waste The potentials of MF and NF in recovering caustic soda was explored using MF and NF pilot units. The caustic solution drained from the bottle washer was first passed through the MF unit, then the MF permeate was used as feed to the NF pilot unit. In each pilot run, the transmembrane pressure was varied and the corresponding permeate flux and quality were evaluated. The parameters monitored during filtration for both systems are tabulated in Table 4.2. 4.2.1 Microfiltration of Caustic Waste Figure 4.1 shows the MF pilot unit and its detailed flow diagram is schematized in Figure 4.2. The MEMTEC microfiltration unit is equipped with four modules of polypropylene hollow fiber membranes with an area of 1 m2 each. The unit has a programmable logic controller (PLC) system which enables it to indicate unit operating status at any instance. Other relevant specifications of the MF pilot unit and its membrane element are found in Tables B1 and B2, Appendix B.

26
Table 4.2 Parameters monitored during operation of the membrane filtration pilot unit
PARAMETERS
RANGE
UNIT
MEASUREMENT METHOD
1. Feed - NaOH concentration - TDS - Apparent Color - COD - Conductivity
3.11 - 3.70 48.6 - 64.2 200 - 500
8,606 - 9,848 94 - 101
% (w/w) NaOH g/L Hazen units mg/L mS/cm
titrimetric standard method1
standard method standard method standard method
2. Permeate - NaOH concentration - TDS - Apparent Color - COD and Conductivity
variable variable variable variable
% NaOH mg/L Hazen units mg/L; mS/cm
titrimetric standard method standard method standard methods
3. Operating conditions - applied pressure - feed temperature - permeate flowrate
0.75 - 17.0
30 - 31 variable
bar2
oC L/h
pressure gauge thermistor flowmeter
4. Membrane - system - configuration
MF / NF
HF/ SW3
-- --
-- --
1 SOURCE: Standard Methods, APHA, AWWA, WPCF, 1985 2 1 bar = 101 kPa 3 HF/ SW - hollow fiber / spiral wound
Figure 4.1 MEMTEC Microfiltration pilot unit
27
Return
Return drain
PV2
PG3
NRV4
NRV3
NRV2
PV2A
P
PG2P
SP
FM2MV4
MV5
MV6
MV7
FILTRATE EXHAUST
FILTRATE
FM1
PV1
MV2
PV1A
BREAKTANK
60 L
PPG1
MV1NRV1
PUMPP1
S1MV3FEED /DRAIN
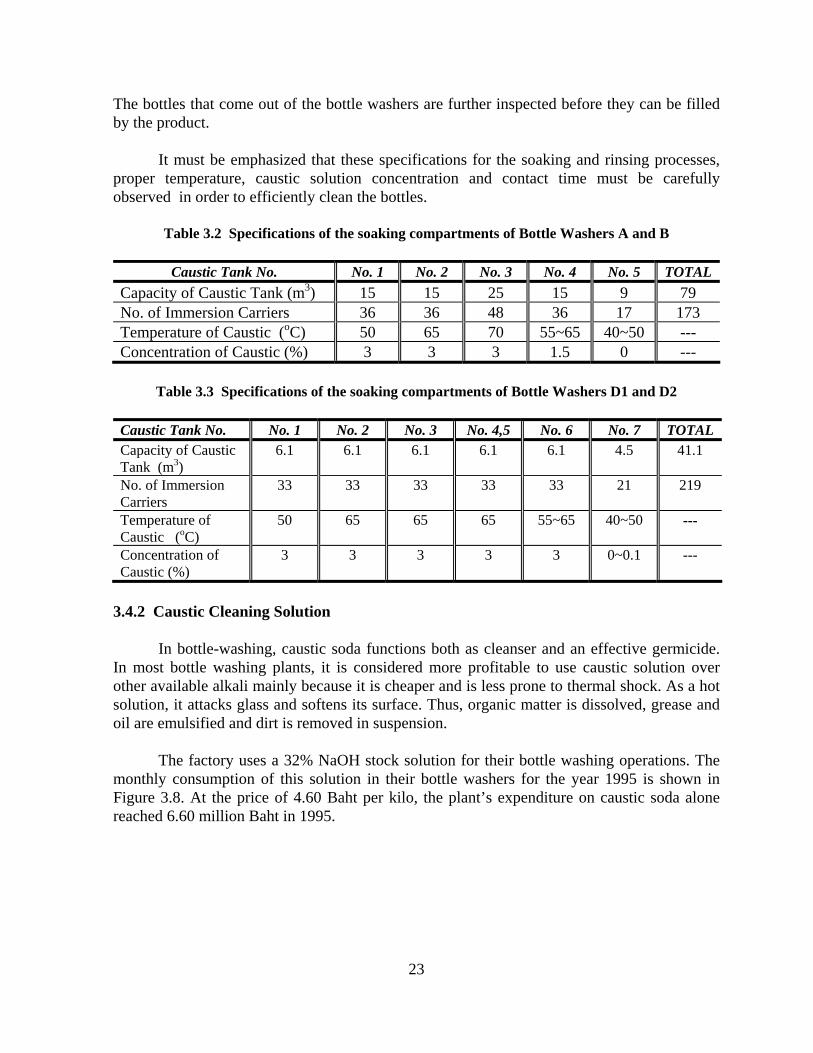
Legend: FM - flow meter LS - level switch FV - float valve MV - manual valve P - pump S - strainer SP - sampling port NRV - non--return valve PG - pressure gauge SV - solenoid valve PV - pneumatic valve
Figure 4.2 Detailed flow diagram of the MEMTEC MF pilot unit
4.2.2 Nanofiltration of Caustic Waste Figure 4.3 presents the NF pilot unit and its detailed flow diagram is illustrated in Figure 4.4. The membrane attached to the unit was MPS-34 manufactured by Membrane Products Kiryat Weizmann, Ltd. (MPW). This spiral wound membrane element has a MWCO of 300 and can operate within the pH range of 0 to 14. Other specifications of the nanofiltration pilot unit and MPS-34 can be found in Tables B3 and B4, Appendix B. 4.2.3 Membrane System Design and Financial Analysis Based on the optimum conditions for the MF/NF caustic recovery system and the needs of the plant, a membrane system was designed for a large-scale installation. A financial analysis was conducted using payback period and internal rate of return, which considered the total costs based on current prices of materials and energy.

28
Figure 4.3 Nanofiltration pilot unit, Model M204-SW by Membrane Products, Kiryat Weizmann Ltd.
4.3. Investigation on Water Consumption and Wastewater Generation Secondary data on water consumption and wastewater generation was collected from the factory. Primary data was also collected to supplement some of the vital information needed to complete the analysis. 4.3.1 Analysis of Bottle Washer Effluent Streams The effluent streams of bottle washer B were characterized in terms of temperature, pH, TDS, %NaOH, color, turbidity, conductivity, COD and suspended solids according to Standard Methods (APHA, AWWA, JWPCF, 1985). After determining the flowrates of each stream, a material balance around the bottle washer was drawn. 4.3.2 Water Quality Determination The major types of water used in the plant were characterized in terms of pH, temperature, color, total hardness, iron and manganese concentrations, SS and TDS according to standard methods (APHA, AWWA, JWPCF, 1985). The information gained served as a supplement to water quality parameters regularly monitored by the plant.

29
FeedTank
strainer
TCV
Heat Exchanger
Permeate
V4V7V6
PI3
P1P2
filterPD PT1T1S
PL1
P11
TC
F11
CoolingWater
Cooling Water
F12
LLS
T2
TI
BPCV
NFModule
PRV1 V1V2
V5
V8
PermeateReturn
PRV2
V3
LEGEND:
PRV1, PRV2 - pressure relief valves P2 - feed pump PI1, PI3 - pressure indicators BPCV - back press control valve PT1 - pressure transmitter TCV - temperature control valve PL1 - pressure digital indicator TC - temperature controller PD - pulsation dampner T2 - temperature sensor P1 - high pressure pump T1S - temperature high limit V-1 - bypass valve TI - temperature indicator V-2 - module inlet valve FI1 - concentrate flowmeter LLS - low level switch FI2 - permeate flowmeter V8 - 3-way valve V3,V4, V5,V6, V7 - drain valves
Figure 4.4 Detailed flow diagram of the M204-SW nanofiltration pilot unit 4.3.3 Data Collection for Water Consumption and Wastewater Generation Daily monitoring of water consumption and wastewater generation is conducted by the factory. Data for the period of January 1995 to April 1996 was collected from the factory. From these facts, the average daily rates of water consumption and wastewater generation were determined to aid subsequent planning for water recovery strategies in the plant. 4.4 Proposals for Water Purification and Reuse in the Factory With the aim to reduce raw water consumption and the liquid discharged from the factory, other feasible technologies for water purification and recovery in the plant were taken into consideration. The impact of each alternative was evaluated by drawing an overall water balance for the whole factory and conducting a financial analysis for each.
30
CHAPTER 5
Results and Discussion
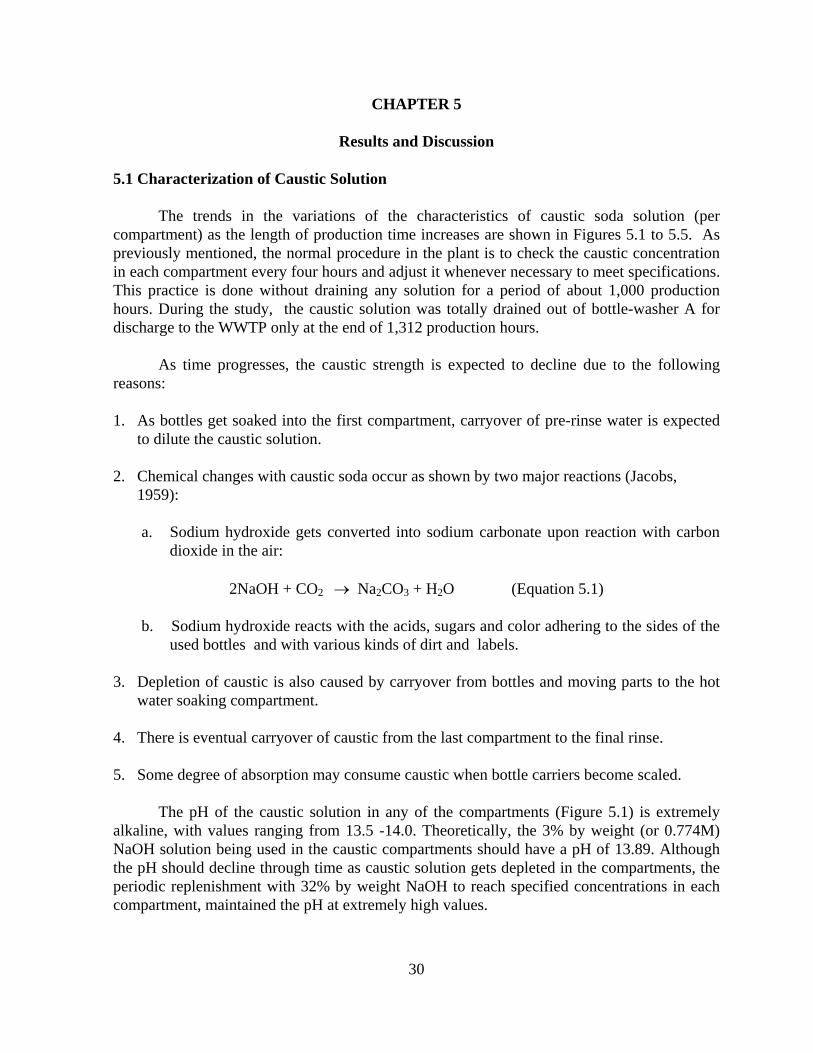
5.1 Characterization of Caustic Solution The trends in the variations of the characteristics of caustic soda solution (per compartment) as the length of production time increases are shown in Figures 5.1 to 5.5. As previously mentioned, the normal procedure in the plant is to check the caustic concentration in each compartment every four hours and adjust it whenever necessary to meet specifications. This practice is done without draining any solution for a period of about 1,000 production hours. During the study, the caustic solution was totally drained out of bottle-washer A for discharge to the WWTP only at the end of 1,312 production hours. As time progresses, the caustic strength is expected to decline due to the following reasons: 1. As bottles get soaked into the first compartment, carryover of pre-rinse water is expected
to dilute the caustic solution. 2. Chemical changes with caustic soda occur as shown by two major reactions (Jacobs,
1959):
a. Sodium hydroxide gets converted into sodium carbonate upon reaction with carbon dioxide in the air:
2NaOH + CO2 → Na2CO3 + H2O (Equation 5.1)
b. Sodium hydroxide reacts with the acids, sugars and color adhering to the sides of the
used bottles and with various kinds of dirt and labels. 3. Depletion of caustic is also caused by carryover from bottles and moving parts to the hot
water soaking compartment. 4. There is eventual carryover of caustic from the last compartment to the final rinse. 5. Some degree of absorption may consume caustic when bottle carriers become scaled. The pH of the caustic solution in any of the compartments (Figure 5.1) is extremely alkaline, with values ranging from 13.5 -14.0. Theoretically, the 3% by weight (or 0.774M) NaOH solution being used in the caustic compartments should have a pH of 13.89. Although the pH should decline through time as caustic solution gets depleted in the compartments, the periodic replenishment with 32% by weight NaOH to reach specified concentrations in each compartment, maintained the pH at extremely high values.

13.00
13.1013.20
13.30
13.4013.50
13.6013.70
13.80
13.9014.00
295 383 471 1266 1312
Production time (h)
pH
Compartment 1Compartment 2Compartment 3Compartment 4
Figure 5.1 Behavior of pH against production time per soaking compartment
The total dissolved solids (TDS) concentration, on the other hand, increases with production time (Figure 5.2). TDS is quite high, ranging from 40 to 80 g/L whereas the expected TDS of a 3% by weight of NaOH is only 31.5 g/L. This shows that other impurities account for most of the TDS analyzed in the caustic solution. P-stabilon, a chelating agent that serves as an anti-scale substance being added to the cleaning solution at a concentration of 0.25% by weight, also adds to the TDS measured. Complementary to this is the conductivity behavior shown in Figure 5.3. Since NaOH is a strong base, it completely ionizes in water. Therefore, the high concentration of dissolved ions would consequently exhibit a high conductivity, at a range of about 80 to 120 mS/cm. A pure 3% caustic solution has a specific conductivity of 134 mS/cm at 20°C (Weast, 1989).
0
10
20
30
40
50
60
70
80
295 383 471 1266 1312
Production time (h)
TDS
(g/L
)
Compartment 1Compartment 2Compartment 3Compartment 4
Figure 5.2 TDS behavior against production time per soaking compartment
31
0
20
40
60
80
100
120
295 383 471 1266 1312
Production time (h)
Con
duct
ivity
(mS/
cm)
Compartment 1Compartment 2Compartment 3Compartment 4
Figure 5.3 Conductivity behavior against production time per soaking compartment
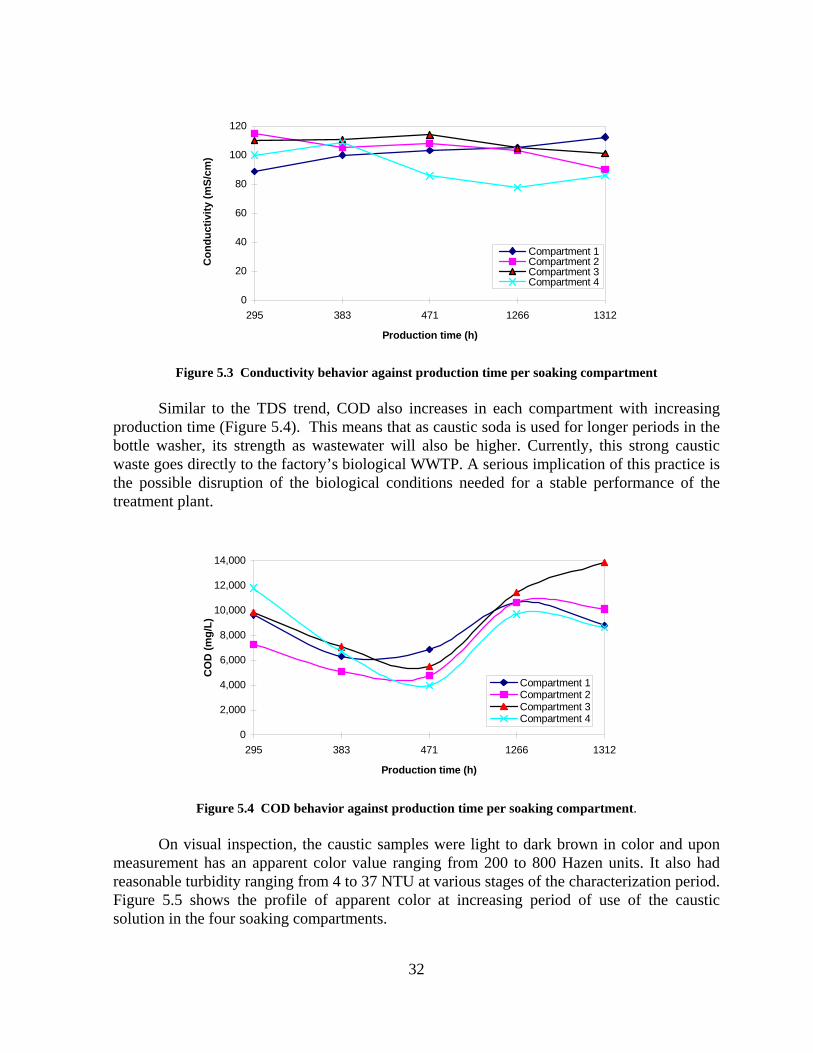
Similar to the TDS trend, COD also increases in each compartment with increasing production time (Figure 5.4). This means that as caustic soda is used for longer periods in the bottle washer, its strength as wastewater will also be higher. Currently, this strong caustic waste goes directly to the factory’s biological WWTP. A serious implication of this practice is the possible disruption of the biological conditions needed for a stable performance of the treatment plant.
0
2,000
4,000
6,000
8,000
10,000
12,000
14,000
295 383 471 1266 1312
Production time (h)
CO
D (m
g/L)
Compartment 1Compartment 2Compartment 3Compartment 4
Figure 5.4 COD behavior against production time per soaking compartment.
On visual inspection, the caustic samples were light to dark brown in color and upon measurement has an apparent color value ranging from 200 to 800 Hazen units. It also had reasonable turbidity ranging from 4 to 37 NTU at various stages of the characterization period. Figure 5.5 shows the profile of apparent color at increasing period of use of the caustic solution in the four soaking compartments.
32

0
100
200
300
400
500
600
700
800
900
295 383 471 1266 1312
Production time (h)
App
aren
t Col
or (H
azen
uni
ts) Compartment 1
Compartment 2Compartment 3Compartment 4
Figure 5.5 Apparent color profile against production time per compartment
On the otherhand, the samples obtained had very varied suspended solids content ranging from 23 - 325 mg/L (Appendix C). This is a result of the bottle washing machines being designed to collect at the bottom any settleable solids formed in the soaking compartments. Too much suspended solids in the soaking compartments are much too undesirable for the bottles. Thus, most of it such as straws, cigarette butts and the likes are already washed-off during the pre-rinse. Specifications of bottle washer A require that in Compartments 1, 2, and 3, caustic solution must be 3%, while in Compartment 4, it must only be 1.5%. However, Table C4, Appendix C shows that %NaOH in the last compartment exceed the specification level at twice its value. The carry-over of caustic solution from the first three compartments during operation therefore can imply a great loss of caustic in the process. 5.2 Microfiltration of Caustic Waste The caustic sample used in the microfiltration pilot-scale runs was taken from the batch which was drained out of bottle-washer A. A volume-proportional caustic sample prepared from each compartment served as feed to the microfiltration unit. In this way, the effect of having different soaking compartment volumes can be accounted for in the succeeding analyses. The performance of crossflow MF in improving the quality of the caustic waste was evaluated at four pressure settings. The MEMTEC MF pilot unit was equipped with 0.2 µm polypropylene hollow fiber (HF) membranes which trapped impurities in the feed on the outside of the fiber while permeate passed through the membrane wall into the hollow center of the fiber. The HF type (Figure 5.6) has several advantages over other membrane geometries. It is made up of very thin capillary membranes which are bundled together at both ends of a tubular casing, making it self-supporting (Vigneswaran et al., 1991). This
33

34
configuration results to high packing density and tolerance for concentrated and viscous materials.

34
PERMEATE
CONCENTRATE
FEED
PERMEATE
FEED
CONCENTRATE
FIBER BUNDLE
Figure 5.6 A schematic of a hollow-fiber membrane
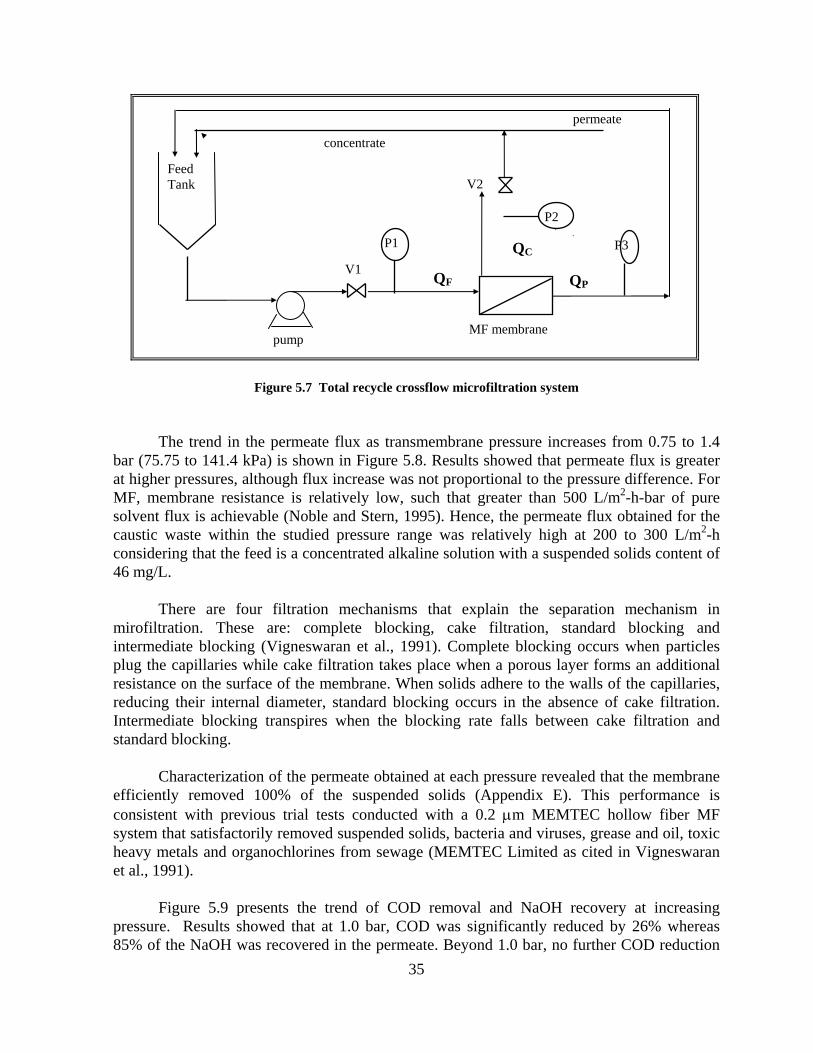
During the experimental run, a feed temperature control system was added to the unit in which cooling water was automatically pumped into a cooling coil inside the feed tank when feed temperature exceeded 30°C. To determine the flux at a specific pressure, a total recycle configuration was followed wherein concentrate and permeate were simultaneously put back into the feed tank. At a specific pressure, only a small amount of permeate was withdrawn as sample for quality determination. With minimum variation in the feed composition, permeate flux was expected to remain constant at each pressure setting. The driving force in the separation of materials in microfiltration is the pressure across the membrane or transmembrane pressure (TMP). A simplified diagram of this system (Figure 5.7) indicates that TMP defined as:
TMP = (P1 + P2) - P3 (Equation 5.2) 2
was set by controlling manual valves, V1 and V2 in the pilot unit. The permeate flux and quality at each pressure were taken at steady-state, obtained after 20 minutes run. After each run at a particular pressure, the MF unit was restored to its original performance capacity by backwashing. High pressure air was automatically forced from the center of the fibers back across the membrane. This expands the fiber and allows air to remove rejected materials from the outside of the fiber (Appendix D). This also ensures that the feed quality was maintained in all operating pressures throughout the pilot run.
pump
concentrate
Feed Tank
V1
P1
MF membrane
P3
permeate
P2
V2
QC
QPQF
Figure 5.7 Total recycle crossflow microfiltration system
The trend in the permeate flux as transmembrane pressure increases from 0.75 to 1.4 bar (75.75 to 141.4 kPa) is shown in Figure 5.8. Results showed that permeate flux is greater at higher pressures, although flux increase was not proportional to the pressure difference. For MF, membrane resistance is relatively low, such that greater than 500 L/m2-h-bar of pure solvent flux is achievable (Noble and Stern, 1995). Hence, the permeate flux obtained for the caustic waste within the studied pressure range was relatively high at 200 to 300 L/m2-h considering that the feed is a concentrated alkaline solution with a suspended solids content of 46 mg/L. There are four filtration mechanisms that explain the separation mechanism in mirofiltration. These are: complete blocking, cake filtration, standard blocking and intermediate blocking (Vigneswaran et al., 1991). Complete blocking occurs when particles plug the capillaries while cake filtration takes place when a porous layer forms an additional resistance on the surface of the membrane. When solids adhere to the walls of the capillaries, reducing their internal diameter, standard blocking occurs in the absence of cake filtration. Intermediate blocking transpires when the blocking rate falls between cake filtration and standard blocking. Characterization of the permeate obtained at each pressure revealed that the membrane efficiently removed 100% of the suspended solids (Appendix E). This performance is consistent with previous trial tests conducted with a 0.2 µm MEMTEC hollow fiber MF system that satisfactorily removed suspended solids, bacteria and viruses, grease and oil, toxic heavy metals and organochlorines from sewage (MEMTEC Limited as cited in Vigneswaran et al., 1991). Figure 5.9 presents the trend of COD removal and NaOH recovery at increasing pressure. Results showed that at 1.0 bar, COD was significantly reduced by 26% whereas 85% of the NaOH was recovered in the permeate. Beyond 1.0 bar, no further COD reduction 35
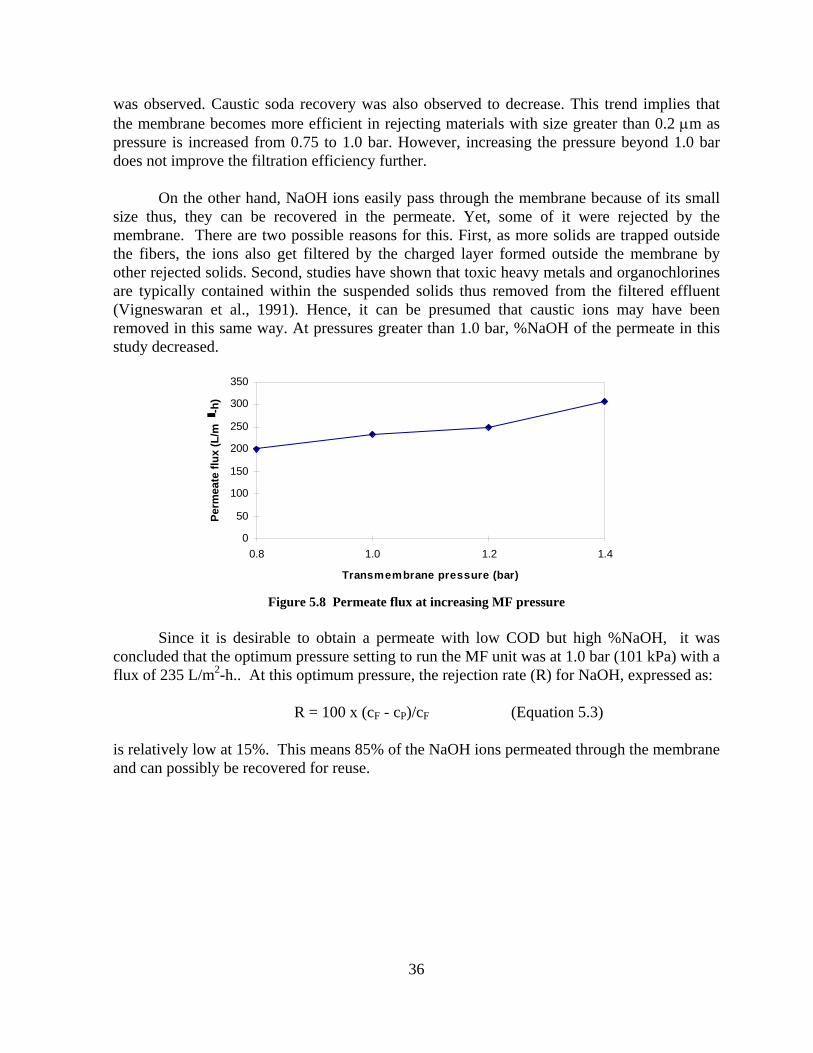
was observed. Caustic soda recovery was also observed to decrease. This trend implies that the membrane becomes more efficient in rejecting materials with size greater than 0.2 µm as pressure is increased from 0.75 to 1.0 bar. However, increasing the pressure beyond 1.0 bar does not improve the filtration efficiency further. On the other hand, NaOH ions easily pass through the membrane because of its small size thus, they can be recovered in the permeate. Yet, some of it were rejected by the membrane. There are two possible reasons for this. First, as more solids are trapped outside the fibers, the ions also get filtered by the charged layer formed outside the membrane by other rejected solids. Second, studies have shown that toxic heavy metals and organochlorines are typically contained within the suspended solids thus removed from the filtered effluent (Vigneswaran et al., 1991). Hence, it can be presumed that caustic ions may have been removed in this same way. At pressures greater than 1.0 bar, %NaOH of the permeate in this study decreased.
0
50
100
150
200
250
300
350
0.8 1.0 1.2 1.4
Transmembrane pressure (bar)
Perm
eate
flux
(L/m
-h)
Figure 5.8 Permeate flux at increasing MF pressure
Since it is desirable to obtain a permeate with low COD but high %NaOH, it was concluded that the optimum pressure setting to run the MF unit was at 1.0 bar (101 kPa) with a flux of 235 L/m2-h.. At this optimum pressure, the rejection rate (R) for NaOH, expressed as: R = 100 x (cF - cP)/cF (Equation 5.3) is relatively low at 15%. This means 85% of the NaOH ions permeated through the membrane and can possibly be recovered for reuse.
36

0102030405060708090
100
0.8 1.0 1.2 1.4
Transmembrane pressure (bar)
% C
OD
redu
ctio
n
0102030405060708090100
% N
aOH
reco
very
% COD reduction% NaOH recovery
Figure 5.9 COD removal and NaOH recovery at increasing MF pressure
Analysis of the quality of permeate however, revealed that at any pressure, MF can reduce the color by 60%, from 500 to 200 Hazen units (Figure 5.10). Laboratory filtration of the feed using a 0.45 µm pore size filter exhibited a 30% color removal. This implies that a large portion of the coloring materials were particles of size greater than 0.2 µm. The permeate COD was also still high at about 7,300 mg/L. These figures indicate that soluble organic contaminants are still retained in the aqueous caustic solution after mirofiltration. Therefore, MF alone can not satisfactorily treat the caustic waste. Further treatment was necessary, if the caustic waste were to be reused in the bottle washing units. Ho and Sirkar (1992) recommend pre-treatment of the feed containing organic foulants by MF before passing the stream through an NF membrane.
0
50
100
150
200
250
0.75 1.00 1.20 1.39
Transmembrane pressure (bar)
App
aren
t col
or (H
azen
uni
ts)
0102030405060708090100
% C
olor
rem
oval
Apparent color%Color removal
Figure 5.10 Apparent color reduction by microfiltration
37
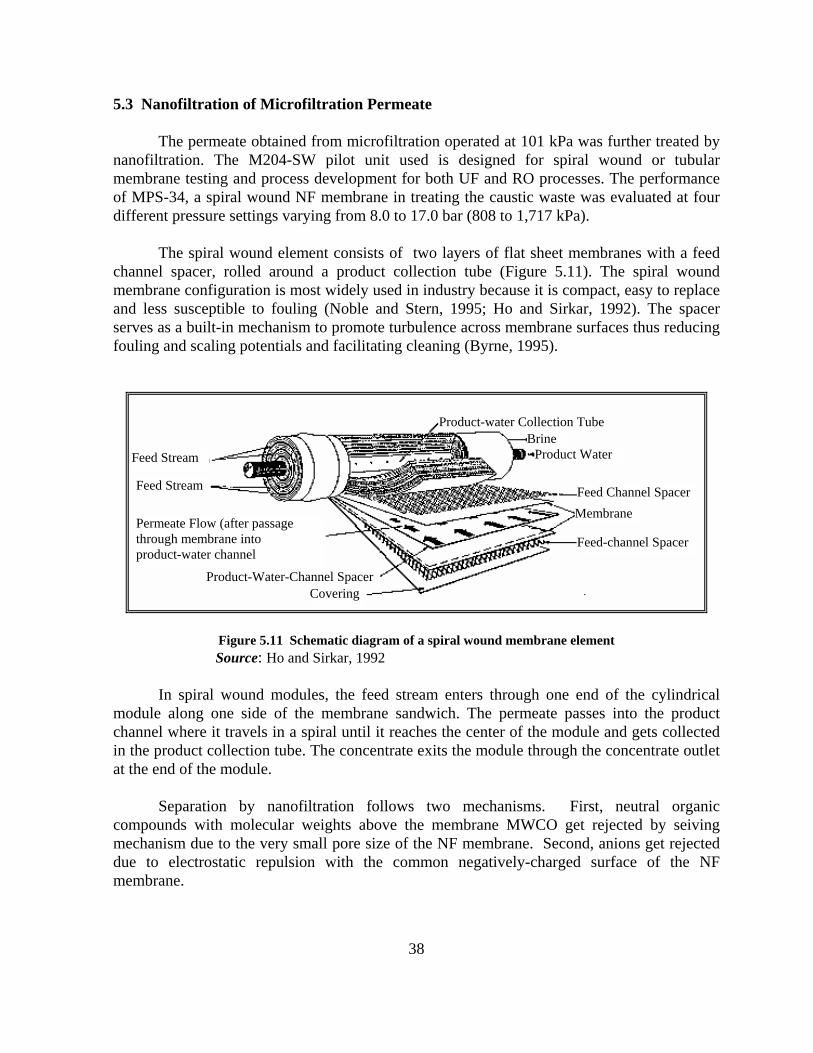
5.3 Nanofiltration of Microfiltration Permeate The permeate obtained from microfiltration operated at 101 kPa was further treated by nanofiltration. The M204-SW pilot unit used is designed for spiral wound or tubular membrane testing and process development for both UF and RO processes. The performance of MPS-34, a spiral wound NF membrane in treating the caustic waste was evaluated at four different pressure settings varying from 8.0 to 17.0 bar (808 to 1,717 kPa). The spiral wound element consists of two layers of flat sheet membranes with a feed channel spacer, rolled around a product collection tube (Figure 5.11). The spiral wound membrane configuration is most widely used in industry because it is compact, easy to replace and less susceptible to fouling (Noble and Stern, 1995; Ho and Sirkar, 1992). The spacer serves as a built-in mechanism to promote turbulence across membrane surfaces thus reducing fouling and scaling potentials and facilitating cleaning (Byrne, 1995).
Product-water Collection Tube Brine
Product Water Feed Stream
Feed Stream
Membrane Feed Channel Spacer
Product-Water-Channel SpacerCovering
Permeate Flow (after passage through membrane into product-water channel
Feed-channel Spacer
Figure 5.11 Schematic diagram of a spiral wound membrane element
Source: Ho and Sirkar, 1992 In spiral wound modules, the feed stream enters through one end of the cylindrical module along one side of the membrane sandwich. The permeate passes into the product channel where it travels in a spiral until it reaches the center of the module and gets collected in the product collection tube. The concentrate exits the module through the concentrate outlet at the end of the module. Separation by nanofiltration follows two mechanisms. First, neutral organic compounds with molecular weights above the membrane MWCO get rejected by seiving mechanism due to the very small pore size of the NF membrane. Second, anions get rejected due to electrostatic repulsion with the common negatively-charged surface of the NF membrane.
38

The operational configuration used was the batch recycle system wherein the concentrate was recycled back to the feed tank while the permeate flowrate was determined. The permeate flux was observed to increase with pressure (Figure 5.12). The flux obtained within 8-17 bar ranged from 5-24 L/m2-h. The flux value is expectedly low because of the extremely high TDS content of the feed at 47,000 mg/L. Manufacturers of MPS-34 claim a water flux of 60 L/m2-h at 30 bar and 30°C. Literatures reveal that at a transmembrane pressure of 15 bar, a spiral wound NF membrane, UTC-20HR, manufactured by Toray, gave a permeate flux of 102 L/m2-h for a feed containing 1,500 mg/L NaCl. On the other hand, for a feed which contains 35,000 mg/L of NaCl, MPT-20, a tubular module by MPW gave a permeate flux of 42.5 L/m2-h at a pressure of 25 bar (Ho and Sirkar, 1992). It can be inferred from the performance of these other commercial membranes that MPS-34 gave a reasonable permeate flux given the characteristics of the caustic feed and the operating conditions employed in this study.
0
5
10
15
20
25
8.0 11.0 14.0 17.0Transmembrane pressure (bar)
Perm
eate
flux
(L/m
2 -h)
Figure 5.12 Permeate flux at increasing NF pressure
Analysis of the permeate quality showed high reductions in COD and apparent color resulting to a better quality caustic solution (Appendix E). About 70 to 80% was achieved in COD reduction (Figure 5.13). This is comparable to the performance of the Alkasave technology described in Section 2.2 which claims a COD reduction of 80% (Anonymous II, 1995). In this study, MPS-34 was able to reduce a high feed value of 8,606 mg/L COD to about 1,500 mg/L at 14-17 bar. Despite the high reductions however, it was apparent that impurities with molecular weights lower than 300 still remained in the permeate because the COD of a pure 3% (w/w) aqueous NaOH solution with 0.25% (w/w) P-stabilon additive was found to be 860 mg/L only. The NF study also registered a 97.5% reduction of the apparent color from the feed at pressures 11.0 bar and higher (Figure 5.14). It can be deduced that the colored impurities easily rejected from the caustic were organic materials with molecular weights higher than 300. Samples of the streams taken after MF and NF treatment (Figure 5.15) exhibited great improvement in the appearance of the caustic solution obtained in the permeate.
39

0
500
1,000
1,500
2,000
2,500
3,000
8.0 11.0 14.0 17.0
Transmembrane pressure (bar)
Perm
eate
CO
D (m
g/L)
0102030405060708090100
%C
OD
redu
ctio
n
Permeate COD
% COD reduction
Figure 5. 13 COD reduction after nanofiltration at diffent pressures
Figure 5.14 also presents the rate of caustic recovery in the permeate at each transmembrane pressure. Results show that there was no significant difference in the solute recovery as the NF process was operated from 11 to 17 bar. The recovery rate ranging between 88 to 91% implies a rejection range of 12 to 9 % for NaOH. According to the manufacturers, MPS-34 has a rated rejection rate of 35% for a 5% NaCl feed when operated at conditions of 30°C and 30 bar.
0102030405060708090
100
8.0 11.0 14.0 17.0
Transmembrane pressure (bar)
% C
olor
rem
oval
0102030405060708090100
% N
aOH
reco
very
% Color removal% NaOH recovery
Figure 5.14 Color reduction and NaOH recovery at different NF pressures
From these results, it can be concluded that the optimum transmembrane pressure for the NF operation is 14 bar (1,414 kPa) since at this pressure setting, both COD reduction and color removal were relatively high. The membrane also exhibited a relatively good permeate flux of 15 L/m2-h and satisfactory recovery rate of NaOH at 91% was achieved.
40

Figure 5.15 Appearance of caustic solution after MF and NF filtration
To sum up, Figure 5.16 compares the treatment efficiencies of MF and NF at the optimum pressures of 101 kPa and 1,414 kPa respectively.
0102030405060708090
100
% CODreduction
% Colorreduction
% NaOHrecovery
MF NF
Figure 5. 16 Treatment efficiencies of MF and NF at the optimum pressure
41

42
5.4 Membrane System Design for Caustic Recovery The success in operating a membrane system for a specific application in the industry is heavily dependent on the knowledge about feed and membrane interactions. Whatever available information often comes only from membrane manufacturers themselves or from membrane equipment contractors. Thus, the pilot-scale testing for caustic recovery would be essential in designing a system to fit the exact need of the plant. Scale-up from tests carried out on pilot scale equipment is relatively straightforward because of the modular nature of the membrane plant (Noble and Stern, 1995). 5.4.1 Caustic Consumption in the Plant Data for the consumption of 32% caustic solution in the plant as illustrated in Figure 3.6 gave an average rate of 119,434.2 kg (or 88.47 m3) usage per month. This value records the total amount of caustic used for:
1. the fresh caustic solutions placed in the soaking compartments of the four bottle washers after periodical draining;
2. caustic solution for post-mix container washing; and 3. daily adjustment of concentration in the soaking compartments of all bottle washers.
Upon analysis of the caustic consumption rates for each purpose mentioned above (Appendix F), it was found that the plant uses up a total of 4,289 kg/day of 32% caustic solution in replenishing the caustic compartments of the four bottle washers. This implies that about 23% by weight of the total caustic solution in the bottle washers are lost from the system everyday for reasons enumerated in Section 5.1. The loss of caustic from the system was investigated further and a material balance around bottle washer B was drawn (Figure 5.17). Soft water is supplied for rinsing at the rate of 427 m3 /day. As described in Chapter 3, this final rinse water is reclaimed twice in the final rinse compartment. A part of the final rinse is then sent to the pre-rinse section where it is discharged as a highly organic wastewater while the rest of it is drained to the WWTP. In the larger bottle washers, A or B, the amount of 32% caustic solution added averages 1,352 kg/day, equivalent to 432 kg of pure caustic. Since the 32% caustic stock solution has a density of 1.35 kg/L, then the volume of caustic solution for daily replenishment is approximately 1 m3. The pre-rinse effluent was discharged at the rate of 143 m3/day. Analysis of this exiting stream showed that it contains 0.640 kg/m3 of caustic soda and 3.584 kg/m3 of TDS. The hot water soaking compartment which is drained at 9 m3 daily after shutdown was found to contain 1.280 kg/m3 of caustic soda and a TDS concentration of 2.572 kg/m3. By material balance (Equation 5.4), the discharge rate of the final rinse effluent to the underdrain is 276 m3 /day. This waste stream was analyzed to have a caustic concentration of 0.72 kg/m3 and a TDS of 1.832 kg/m3. These figures were used in deriving some mass balance equations primarily to account for the magnitude of caustic drained out of the bottle washing unit.
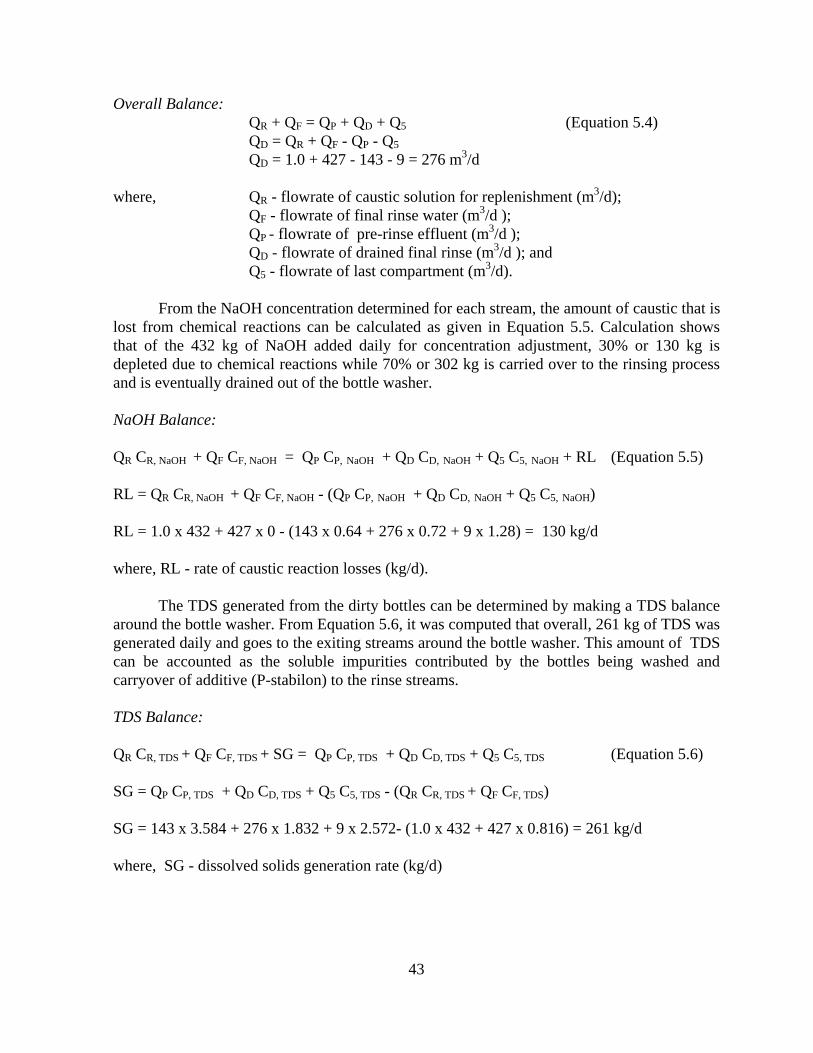
43
Overall Balance: QR + QF = QP + QD + Q5 (Equation 5.4) QD = QR + QF - QP - Q5 QD = 1.0 + 427 - 143 - 9 = 276 m3/d where, QR - flowrate of caustic solution for replenishment (m3/d); QF - flowrate of final rinse water (m3/d ); QP - flowrate of pre-rinse effluent (m3/d ); QD - flowrate of drained final rinse (m3/d ); and Q5 - flowrate of last compartment (m3/d). From the NaOH concentration determined for each stream, the amount of caustic that is lost from chemical reactions can be calculated as given in Equation 5.5. Calculation shows that of the 432 kg of NaOH added daily for concentration adjustment, 30% or 130 kg is depleted due to chemical reactions while 70% or 302 kg is carried over to the rinsing process and is eventually drained out of the bottle washer. NaOH Balance: QR CR, NaOH + QF CF, NaOH = QP CP, NaOH + QD CD, NaOH + Q5 C5, NaOH + RL (Equation 5.5) RL = QR CR, NaOH + QF CF, NaOH - (QP CP, NaOH + QD CD, NaOH + Q5 C5, NaOH) RL = 1.0 x 432 + 427 x 0 - (143 x 0.64 + 276 x 0.72 + 9 x 1.28) = 130 kg/d where, RL - rate of caustic reaction losses (kg/d). The TDS generated from the dirty bottles can be determined by making a TDS balance around the bottle washer. From Equation 5.6, it was computed that overall, 261 kg of TDS was generated daily and goes to the exiting streams around the bottle washer. This amount of TDS can be accounted as the soluble impurities contributed by the bottles being washed and carryover of additive (P-stabilon) to the rinse streams. TDS Balance: QR CR, TDS + QF CF, TDS + SG = QP CP, TDS + QD CD, TDS + Q5 C5, TDS (Equation 5.6) SG = QP CP, TDS + QD CD, TDS + Q5 C5, TDS - (QR CR, TDS + QF CF, TDS) SG = 143 x 3.584 + 276 x 1.832 + 9 x 2.572- (1.0 x 432 + 427 x 0.816) = 261 kg/d where, SG - dissolved solids generation rate (kg/d)

PRE-
RINSE
1
C = 30 g/L
V = 15 m3
2
C = 30 g/L
V = 15 m3
3
C = 30 g/L
V = 215 m3
4
C = 15 g/L
V = 15 m3
5
C = 0 g/L
V = 9 m3
CP, NaOH = 0.64 kg/m3
CP, TDS = 3.584 kg/m3CF, NaOH = 0 CF, TDS = 0. 816 kg/ m3
C5, NaOH = 1.280 kg/m3
C5, TDS = 2.572 kg/m3
CD, NaOH = 0.72 kg/m3
CD, TDS = 1.832 kg/m3
QD = 276 m3/d
Q5 = 9 m3/d
QR = 1.0 m3/d CR, NaOH = 432 kg/ m3
FINAL
RINSE QF = 427 m3/d Soft Water
Figure 5.17 Material balance around Bottle Washer B
44
QP = 143 m3/d
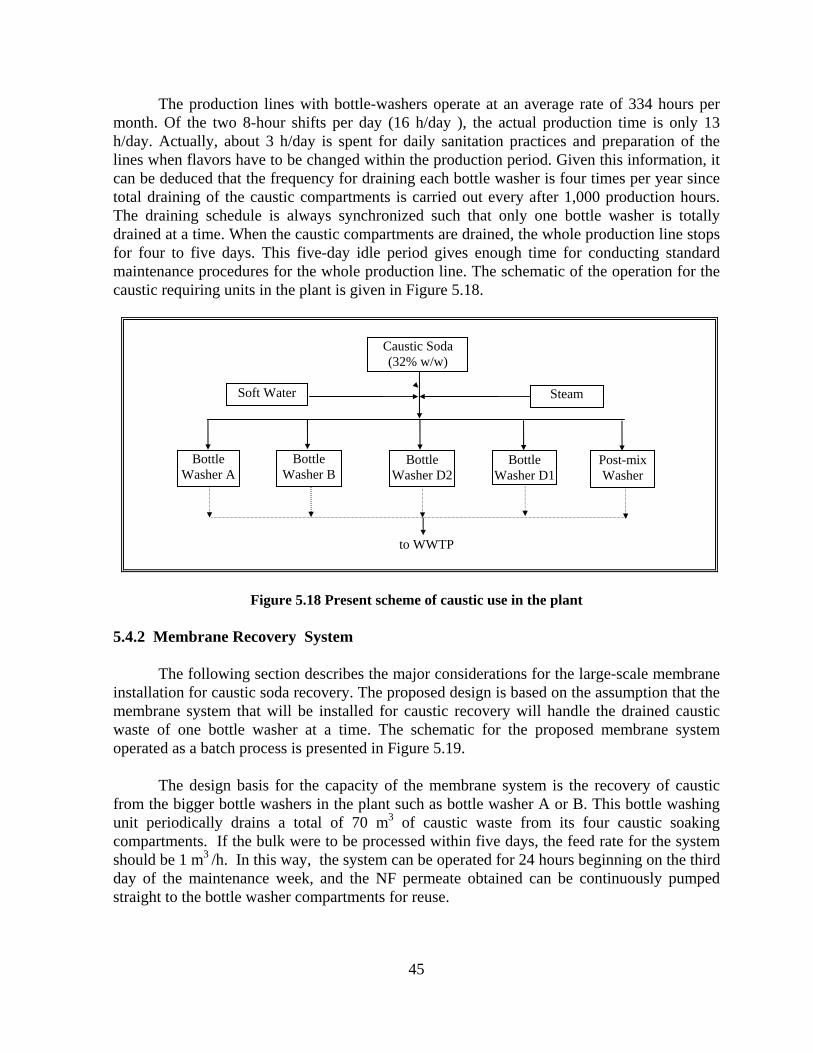
The production lines with bottle-washers operate at an average rate of 334 hours per month. Of the two 8-hour shifts per day (16 h/day ), the actual production time is only 13 h/day. Actually, about 3 h/day is spent for daily sanitation practices and preparation of the lines when flavors have to be changed within the production period. Given this information, it can be deduced that the frequency for draining each bottle washer is four times per year since total draining of the caustic compartments is carried out every after 1,000 production hours. The draining schedule is always synchronized such that only one bottle washer is totally drained at a time. When the caustic compartments are drained, the whole production line stops for four to five days. This five-day idle period gives enough time for conducting standard maintenance procedures for the whole production line. The schematic of the operation for the caustic requiring units in the plant is given in Figure 5.18.
Steam Soft Water
Bottle Washer A
Bottle Washer B
Bottle Washer D2
Bottle Washer D1
Post-mix Washer
to WWTP
Caustic Soda (32% w/w)
Figure 5.18 Present scheme of caustic use in the plant
5.4.2 Membrane Recovery System The following section describes the major considerations for the large-scale membrane installation for caustic soda recovery. The proposed design is based on the assumption that the membrane system that will be installed for caustic recovery will handle the drained caustic waste of one bottle washer at a time. The schematic for the proposed membrane system operated as a batch process is presented in Figure 5.19. The design basis for the capacity of the membrane system is the recovery of caustic from the bigger bottle washers in the plant such as bottle washer A or B. This bottle washing unit periodically drains a total of 70 m3 of caustic waste from its four caustic soaking compartments. If the bulk were to be processed within five days, the feed rate for the system should be 1 m3 /h. In this way, the system can be operated for 24 hours beginning on the third day of the maintenance week, and the NF permeate obtained can be continuously pumped straight to the bottle washer compartments for reuse.
45

As the caustic waste is drained from the bottle washer, it will be collected in a feed tank. This is the same feed tank used for the caustic recovery attempted in the past by sand filtration. From the feed tank it will be pumped to the MF unit through a cartridge filter. Assuming a permeate yield of 85% at 101 kPa, the MF unit will require a membrane surface area of 4 m2. Thus, the MF unit will comprise four discrete modules of 0.2 µm hollow fiber membranes, each having a surface area of 1 m2. Periodic backflushing of the MF unit with compressed air will be automatically started every 15-20 minutes for a period of 100-200 seconds. The backwash stream must be directed to the WWTP. Since caustic soda acts as a detergent and germicide, chemical cleaning of the membranes is considered unnecessary.
BW-1
BW-4
BW-3
BW-2 Caustic Waste tank
Feed pump
Cartridge filter
MF system
Feed puimp
Cartridge filter
MF Product tank
Feed pump
recycling to bottle washers
Concentrate drain to WWTP
Concentrate drain to WWTP
Booster pump
NF system
1 m3 /h
0.85 m3 /h 0.6375 m3 /hRecovered caustic tank
to MF product tank
Figure 5.19 Caustic recovery system design schematic
The permeate collected in a MF permeate tank will then be fed to a cartridge filter before it is boosted at a pressure of 1,414 kPa as it enters the NF unit at the rate of 0.85 m3 /h. With a permeate yield of 75%, the permeate flowrate will be 0.6375 m3 /h, with a solute recovery of 90%. The nanofiltered caustic will be piped away into a NF permeate tank, ready for reuse. The NF concentrate will have to be directed back to the MF permeate tank where it will eventually get drained from. At a flux of 15 L/m2-h, the required membrane surface area for the NF unit is 42.5 m2. The industrial size for MPS-34 membrane element is available with a surface area of 6.2 m2, hence, seven modules of 40”x40” elements are needed for the NF unit. The pressure vessels suitable for this type of application should be stainless steel housings to withstand high alkalinity and pressures. Since the system requires a small flow, pipes of small diameter which can be easily bent and fitted to the system design during construction are appropriate. For the required flowrate of 1 m3/h, pipes with inside diameter of 1.905 cm (0.75 in) will suit the purpose (Byrne, 1995). The maximum crossflow velocity in the recovery system will then be 0.98 m/s.
46

47
The recommended membrane installation, therefore, will have the following equipment specifications:
Table 5. 1 Major components of the membrane system design
Feed pumps Type Model Capacity / Head Power consumption Quantity
Horizontal multistage centrifugal pumps Groundfos CHI2-40 1 - 3 m3/h / 40 m 0.6 hp; 0. 45 kW 3 pcs
Cartridge filter before MF unit Pore size Material Quantity
500 microns polypropylene 1 set filter with housing; replaceable quarterly
Microfiltration membrane element Quanitity Material Working pressure Pore size Temperature / pH tolerance
4 modules of 1 m2 each polypropylene 101 - 202 kPa (1- 2 bar) 0.2 microns 5 - 40 °C / 2-14
Air compressor Quantity Type Maximum pressure Power consumption
1 set PT-21 10 kg/cm2
0.75 kW; 1 hp Feed/Permeate tanks
Quantity Capacity Material
2 units 1 m3
polypropylene Nanofiltration membrane element
Quanitity Model / MWCO Configuration Temperature / pH tolerance Pressure vessel
seven modules of 6.2 m2 surface area each MPS-34 / 300 spiral wound 45°C / 0-14 stainless steel housing
High pressure pump Type Model Capacity Head Power consumption Quantity
Vertical multistage centrifugal pumps Groundfos CRN2-180 1 - 3 m3/h 170 m 3 hp; 2.2 kW one piece
Cartridge before NF unit Pore size Material Quantity
5 microns polypropylene 1 set filter with housing; replaceable quarterly

48
5.5 Financial Analysis of the Membrane Installation 5.5.1 Projected Savings When the membrane recovery system is in place, it will work as a batch process for each of the bottle washers four times per year. Since the assumed overall permeate yield is 63.75% and the evaluated solute recovery rate for the whole system is 77%, then from a 3% caustic solution, a purified solution with 2.3% caustic will be recovered from the MF-NF system. Table 5.2 gives the savings for the recovered caustic from each bottle washer, which amounts to 183,890 Baht per year. Since the volume of the caustic waste is very small, the savings on wastewater treatment cost is considered insignificant.
Table 5.2 Value of recoverable caustic from the four Bottle washers SOURCE OF FEED
Volume of caustic
(m3)
Volume of NF permeate/run1
(m3)
NaOH2 concentration
(kg/m3)
No. of recovery
runs/ year
Equiv. mass as 32% (w/w) soln.
(kg/y)
Value of recovered3 NaOH as 32% soln.
(Baht/year) BW-A 70 44.6 23.55 4 13,129 60,393.40 BW-B 70 44.6 23.55 4 13,129 60,393.40
BW-D1 36.6 23.3 23.55 4 6,859 31,551.40 BW-D2 36.6 23.3 23.55 4 6,859 31,551.40 TOTAL 213.2 135.8 -- 16 39,976 183,889.60
1 Overall permeate recovered from MF/NF system = 63.8% by volume2 NaOH concentration by weight = 2.3% 3 Cost of 1 kg 32% (w/w) NaOH solution = 4.60 Baht 5.5.2 Payback Period and Internal Rate of Return The summary of the pertinent costs for the membrane installation is presented in Table 5.3. Equipment and operating cost details can be found in Appendix G. Financial analysis shows that the payback period for installing the large-scale membrane system for caustic recovery is seven years and the internal rate of return (IRR) is 13.7%, with a net present value (NPV) of 120,800 Baht. These values indicate that the membrane system is an expensive installation that brings little returns for the plant. This means that recovering caustic soda by membrane filtration is not a viable solution in this situation, primarily because the system will be underutilized, operating only for 853 h/yr for the four bottle washers.
Table 5.3 Financial analysis of the MF/NF recovery system

49
INSTALLATION COST1 490,060 Baht2
Microfiltration unit - 57,195 Baht Nanofiltration unit - 261,345 Baht
DEPRECIATION COST3 40,389 Baht/yr Useful life - 12 yrs Salvage value - nil
OPERATING COSTS 72,556 Baht/yr Power - 6,023 Baht/yr Membrane replacement cost 4 - 63,333 Baht/yr Cartridge replacement cost - 3,200 Baht/yr
NET ANNUAL SAVINGS 70,081 Baht/yr NET PRESENT VALUE 120,800 Baht PAYBACK PERIOD (Installation cost/Net annual savings) 7 years
INTERNAL RATE of RETURN 13.7 % 1 Piping, framework and controls is 35% of the total installation cost 2 25 Baht = 1 US$ 3 Using straight-line basis on 12 yr useful life 4 Membranes replaceable every three years
5.6 Demand for Water in the Plant As described in Chapter 3, groundwater undergoes different treatment systems to meet three types of process water in the plant. The characteristics of each type (Table 5.4) reveal that the conventional water treatment system of the plant is performing satisfactorily in terms of removing undesirable substances such as Fe, Mn, carbonates, etc. from the groundwater source. In the absence of municipal water supply, a deep well source most easily satisfies good water quality factors of safety, temperature, appearance, taste, and odor (Davis and Cornwell,1991).
Table 5.4 Characteristics of different types of process water available in the plant
PARAMETERS RAW WATER
PRE-TREATED WATER
SOFT WATER
TREATED WATER
pH 7.81 7.97 8.0-9.0 9.0 - 9.5 Temperature (°C) 37-49 28-30 28-30 28-30 Apparent Color (Hazen units) <5 <5 <5 <5 Fe (mg/L) 6.62 1.93 n.d. n.d. Mn (mg/L) n.d. n.d. n.d. n.d. Turbidity (NTU) 0.90 1.40 1.35 0.90 Total Dissolved Solids (mg/L) 656 642 816 636 Total Hardness (mg/L CaCO3) 150-155 75-80 0-30 <100 Chlorine content (mg/L) --- --- 3.0-4.0 0

For the purpose of monitoring the plant’s demand for water, 25 water meters have been installed along each major stream around the plant. These meters are read daily and records are compiled on a monthly basis so that they can serve as indicator of possible water losses or irregularities in the processing lines. Considering the fluctuations in the production rate of the plant over the year and the consequent variation in the amount of water consumed, the daily consumption rate was taken as the average values over a one-year period. For each metered stream, the basis is the May 1995 to April 1996 records, unless otherwise specified. 5.6.1 Raw water consumption The sole source of water for all plant operations is groundwater drawn from four deepwell facilities inside the plant. The plant does not have any city water supplement for their needs. Groundwater is treated prior to consumption for any purpose inside the factory. Results of the monthly monitoring of volume drawn are shown in Table H1 in Appendix H. Based on these figures, the average volume of raw water drawn daily is 5,598 m3 /day. The government currently charges the plant 3.75 Baht per cubic meter of groundwater. This translates to a daily cost of 20,992 Baht/day for raw water alone. Consumption values indicate that one liter of beverage produced requires 5.08 liters of raw water. 5.6.2 Pre-treated water consumption The raw water drawn at an average rate of 5,598 m3 /day is processed to produce pre-treated water. The pre-treated type of water is used for operations which are not directly connected to softdrink production. Table H2 in Appendix H is a record of the monthly consumption of pre-treated water in the plant for May 1995 to April 1996. Water used for cleaning trucks and delivery vehicles recorded by the plant as “fleet maintenance” and “park used” is used at an average rate of 123 m3 /day. Water used for wet scrubbers (“dust-1” and “dust-2”) that serve as air pollution control devices for boilers, is normally supplied continuously while boilers are in operation. Therefore in Table H2, the absence of values for the month merely indicate that either the meter is not working or the meter was not read for that period. To get a more reasonable water consumption rate of the scrubbers, first, the average daily input water was determined from existing records for scrubbers 1 and 2. From the June and December, 1995 and March and April, 1996 figures, this averages 8.61 m3 /day. Then, by assuming this value for those months where significant boiler feedwater consumption has been recorded, the average amount of pre-treated water supplied for both scrubbers is 10 m3/day. The average consumption of water for backwashing softeners during regeneration of the resin (recorded as “backwash”) is 338 m3 /day. This value had to be taken from the January to December 1995 records because data for February and April 1996 are missing. Likewise, the water for manual cleaning of dirty bottles and cases (recorded as “stock washing”) which averages 117 m3 /day is based on the April 1995-March 1996 records because the April 1996 figure is unusually low. This water is used when workers manually check the returned bottles and cases, and separate the damaged and uncleanable ones from the line. The training center also uses up pre-treated water at an average rate of 22 m3 /day. This
50

51
center regularly accommodates people trained by the sales department. The plant’s canteen also consumes pre-treated water at the rate of 21 m3 /day. This source is made potable by passing it though additional units of one softener and one activated carbon filter before it is used for cooking and drinking purposes. Pre-treated water is also used for cleaning floors of production areas. In Line D, a water meter was recently installed and records an average daily consumption of 49 m3/day. Other uses for pre-treated water includes water for cleaning floors of other production lines, toilets, machines, watering of surrounding grounds, etc. The consumption rate for such miscellaneous usage can merely be estimated by considering all other consumption rates obtained from actual metered process water streams, and possible losses in each treatment system. By material balance, it was determined that the pre-treated water consumed for “other” purposes is 1,071 m3/day. 5.6.3 Soft water consumption The monthly consumption of soft water for different purposes are tabulated in Table H3, Appendix H. Lines D1 and D2 require soft water to dissolve the lubricant used for the conveyors in the line. The average daily consumption for this purpose is 40 m3 /day. Likewise, the PET line uses up 35 m3 /day to lubricate its line and rinse PET bottles before filling. On the other hand, post-mix container washing consumes 96 m3 /day of soft water. In the refrigeration plants, cooling water is used in hot compressors at the rate of 307 m3 /day while boilers use up an average amount of 68 m3 /day. Soft water for bottle washers are mainly used for daily replacement of water in the hot water soaking compartment of each washer and as steady supply for final rinse. The four bottle washing units use up an average of 1,708 m3 /day. Overall, the average ratio of soft water consumption to beverage production is 2.05. 5.6.4 Treated water consumption The average consumption for treated water is 1,226 m3/day. Most of this is converted to end product at an average daily rate of 1,101 m3 /day. This indicates that for every liter of beverage produced, 1.11 liters of treated water is required. Treated water is also consumed at the rate of 125 m3 /day for other purposes such as washing of syrup tanks and other equipment in the production lines (pipelines for different flavorings); supply in taps of quality control laboratories and drinking water for all workers. In the above discussion, the amount of water input to each unit process within the plant was determined from the daily meter readings. In Figure 5.20, the overall water balance is shown. Assumptions were made regarding the losses of water incurred in each water treatment system. According to Davis and Cornwell (1991) about 3% of the treatment plant flow is used for filter backwash. Therefore, in producing treated water, 5% of the input was assumed lost in filter backwashing and clarification. Likewise, 5% of the input water is lost in pre-treated water production due to evaporation and periodical backwashing of the filters. In the softening plant, the assumption made was that at least 1% of the input water is lost for preparation of the

50
Manual stock washing
Lubrication of Line D
Softener Backwashing
Cleaning of vehicles
Others - toilets and floor cleanings, etc.
Line D Cleaning
Training Center
Bottle-washers
Cooling Water
Wet scrubbers
Post-mix line
PET Line
Canteen
Boilers
Backwash water (losses)
280 m3/d
RAW WATER
WATER TREATMENT
PLANT
5, 598 m3/d
1,290 m3/d
PRE-TREATMENT PLANT
1,751 m3/d
117 m3/d
338 m3/d
21 m3/d
22 m3/d
10 m3/d
123 m3/d
1,071 m3/d
3,567 m3/d
2,277 m3/d
Product 125 m3/d
1,101 m3/d
Cleaning; Drinking;
Backwash water (losses)
64 m3/d
SOFTENING PLANT
40 m3/d
2,254 m3/d
1,708 m3/d
307 m3/d
68 m3/d
35 m3/d
96 m3/d
23 m3/d
Reg ioneneration Solut
(losses)
5,318 m3/d
49 m3/d
Figure 5.20 Overall water usage balance in the plant
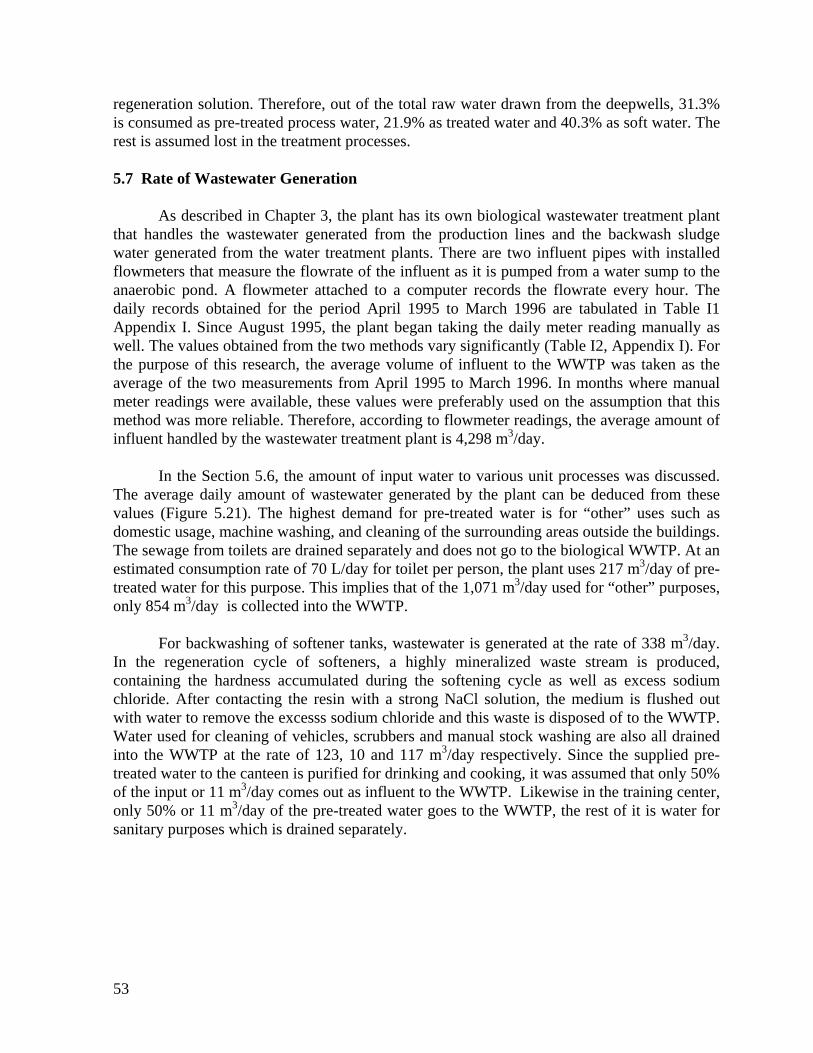
regeneration solution. Therefore, out of the total raw water drawn from the deepwells, 31.3% is consumed as pre-treated process water, 21.9% as treated water and 40.3% as soft water. The rest is assumed lost in the treatment processes. 5.7 Rate of Wastewater Generation As described in Chapter 3, the plant has its own biological wastewater treatment plant that handles the wastewater generated from the production lines and the backwash sludge water generated from the water treatment plants. There are two influent pipes with installed flowmeters that measure the flowrate of the influent as it is pumped from a water sump to the anaerobic pond. A flowmeter attached to a computer records the flowrate every hour. The daily records obtained for the period April 1995 to March 1996 are tabulated in Table I1 Appendix I. Since August 1995, the plant began taking the daily meter reading manually as well. The values obtained from the two methods vary significantly (Table I2, Appendix I). For the purpose of this research, the average volume of influent to the WWTP was taken as the average of the two measurements from April 1995 to March 1996. In months where manual meter readings were available, these values were preferably used on the assumption that this method was more reliable. Therefore, according to flowmeter readings, the average amount of influent handled by the wastewater treatment plant is 4,298 m3/day. In the Section 5.6, the amount of input water to various unit processes was discussed. The average daily amount of wastewater generated by the plant can be deduced from these values (Figure 5.21). The highest demand for pre-treated water is for “other” uses such as domestic usage, machine washing, and cleaning of the surrounding areas outside the buildings. The sewage from toilets are drained separately and does not go to the biological WWTP. At an estimated consumption rate of 70 L/day for toilet per person, the plant uses 217 m3/day of pre-treated water for this purpose. This implies that of the 1,071 m3/day used for “other” purposes, only 854 m3/day is collected into the WWTP. For backwashing of softener tanks, wastewater is generated at the rate of 338 m3/day. In the regeneration cycle of softeners, a highly mineralized waste stream is produced, containing the hardness accumulated during the softening cycle as well as excess sodium chloride. After contacting the resin with a strong NaCl solution, the medium is flushed out with water to remove the excesss sodium chloride and this waste is disposed of to the WWTP. Water used for cleaning of vehicles, scrubbers and manual stock washing are also all drained into the WWTP at the rate of 123, 10 and 117 m3/day respectively. Since the supplied pre-treated water to the canteen is purified for drinking and cooking, it was assumed that only 50% of the input or 11 m3/day comes out as influent to the WWTP. Likewise in the training center, only 50% or 11 m3/day of the pre-treated water goes to the WWTP, the rest of it is water for sanitary purposes which is drained separately.
53
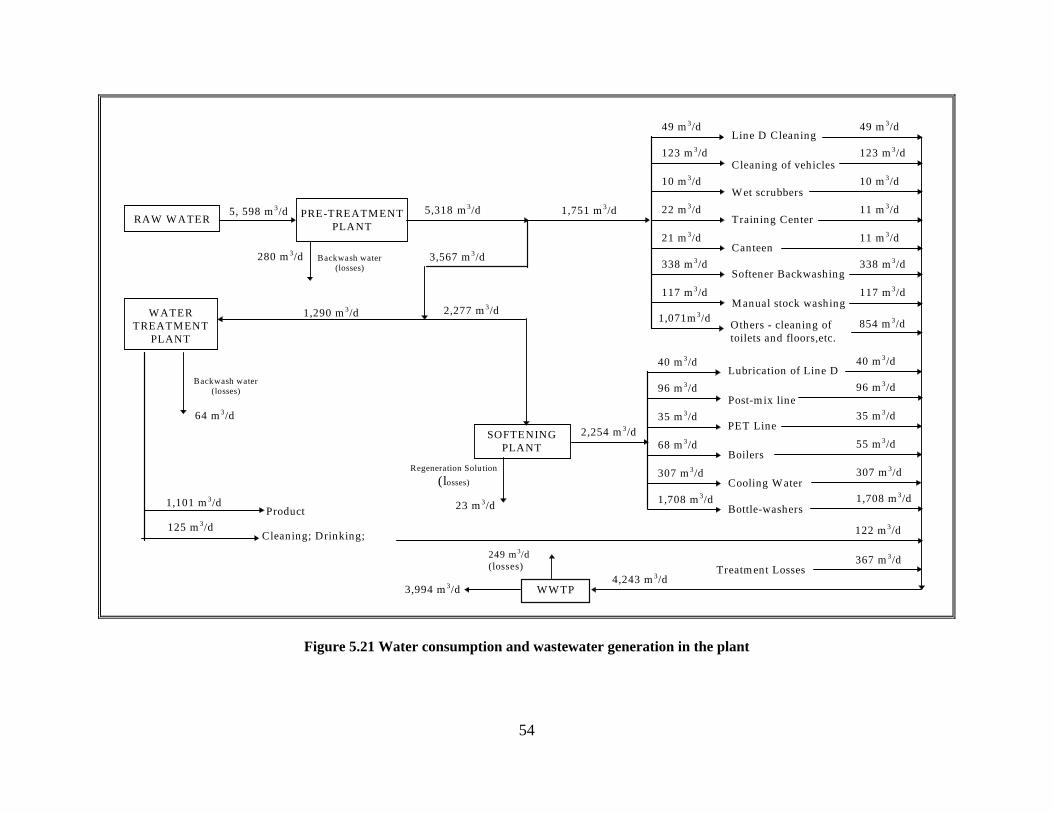
RAW WATER
WATERTREATMENT
PLANT
5, 598 m 3/d
1,290 m 3/d
PRE-TREATMENTPLANT
Line D Cleaning
Cleaning of vehicles
M anual stock washing
Softener Backwashing
Canteen
Training Center
Wet scrubbers
1,751 m 3/d
49 m 3/d
117 m 3/d
338 m 3/d
21 m 3/d
22 m 3/d
10 m 3/d
123 m 3/d
1,071m 3/d Others - cleaning oftoilets and floors,etc.
3,567 m 3/d
2,277 m 3/d
Product125 m 3/d
1,101 m 3/d
Cleaning; Drinking;
5,318 m 3/d
SOFTENINGPLANT
49 m 3/d
117 m 3/d
338 m 3/d
11 m 3/d
11 m 3/d
10 m 3/d
123 m 3/d
122 m 3/d
PET Line
Lubrication of Line D
Post-mix line
Bottle-washers
Cooling Water
Boilers
40 m 3/d
2,254 m 3/d
1,708 m 3/d
307 m 3/d
68 m 3/d
35 m 3/d
96 m 3/d
40 m 3/d
1,708 m 3/d
307 m 3/d
55 m 3/d
35 m 3/d
96 m 3/d
4,243 m 3/d
854 m 3/d
Treatm ent Losses367 m 3/d
Backwash water(losses)
280 m 3/d
64 m 3/d
Backwash water(losses)
23 m 3/d
Regeneration Solution(losses)
WWTP
249 m3/d(losses)
3,994 m 3/d
Figure 5.21 Water consumption and wastewater generation in the plant
54
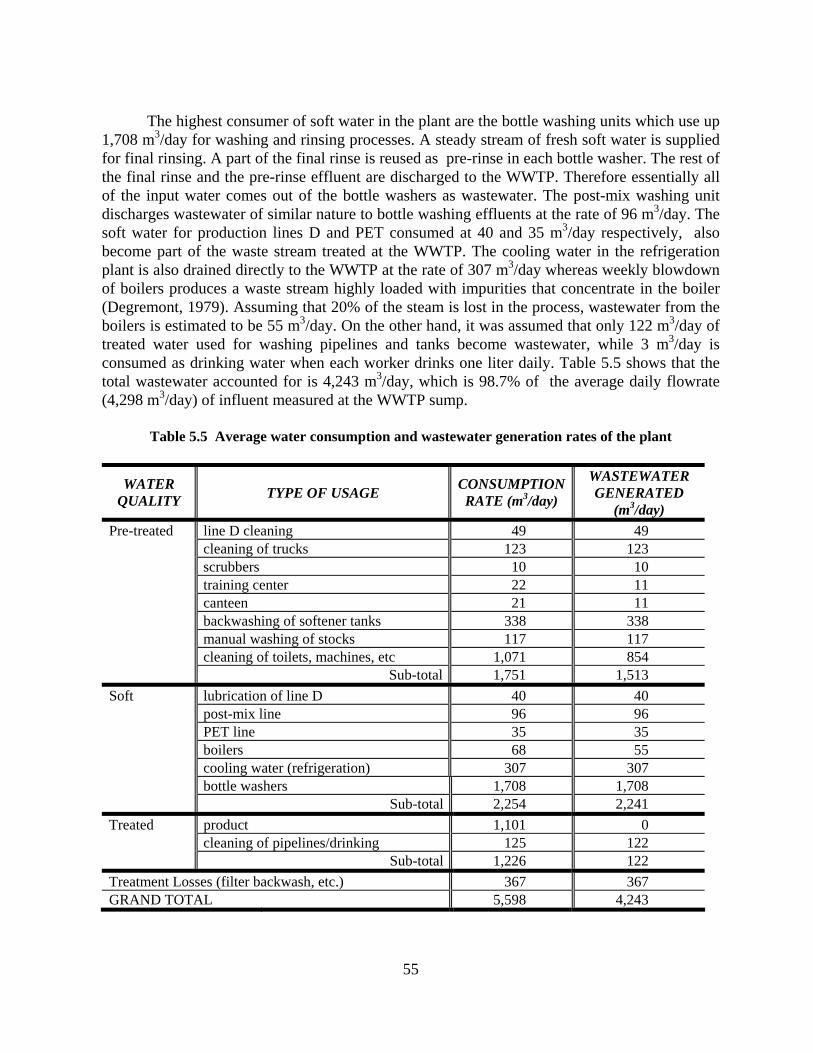
55
The highest consumer of soft water in the plant are the bottle washing units which use up 1,708 m3/day for washing and rinsing processes. A steady stream of fresh soft water is supplied for final rinsing. A part of the final rinse is reused as pre-rinse in each bottle washer. The rest of the final rinse and the pre-rinse effluent are discharged to the WWTP. Therefore essentially all of the input water comes out of the bottle washers as wastewater. The post-mix washing unit discharges wastewater of similar nature to bottle washing effluents at the rate of 96 m3/day. The soft water for production lines D and PET consumed at 40 and 35 m3/day respectively, also become part of the waste stream treated at the WWTP. The cooling water in the refrigeration plant is also drained directly to the WWTP at the rate of 307 m3/day whereas weekly blowdown of boilers produces a waste stream highly loaded with impurities that concentrate in the boiler (Degremont, 1979). Assuming that 20% of the steam is lost in the process, wastewater from the boilers is estimated to be 55 m3/day. On the other hand, it was assumed that only 122 m3/day of treated water used for washing pipelines and tanks become wastewater, while 3 m3/day is consumed as drinking water when each worker drinks one liter daily. Table 5.5 shows that the total wastewater accounted for is 4,243 m3/day, which is 98.7% of the average daily flowrate (4,298 m3/day) of influent measured at the WWTP sump.
Table 5.5 Average water consumption and wastewater generation rates of the plant
WATER QUALITY
TYPE OF USAGE CONSUMPTION
RATE (m3/day)
WASTEWATER GENERATED
(m3/day) Pre-treated line D cleaning 49 49 cleaning of trucks 123 123 scrubbers 10 10 training center 22 11 canteen 21 11 backwashing of softener tanks 338 338 manual washing of stocks 117 117 cleaning of toilets, machines, etc 1,071 854 Sub-total 1,751 1,513 Soft lubrication of line D 40 40 post-mix line 96 96 PET line 35 35 boilers 68 55 cooling water (refrigeration) 307 307 bottle washers 1,708 1,708 Sub-total 2,254 2,241 Treated product 1,101 0 cleaning of pipelines/drinking 125 122 Sub-total 1,226 122 Treatment Losses (filter backwash, etc.) 367 367 GRAND TOTAL 5,598 4,243
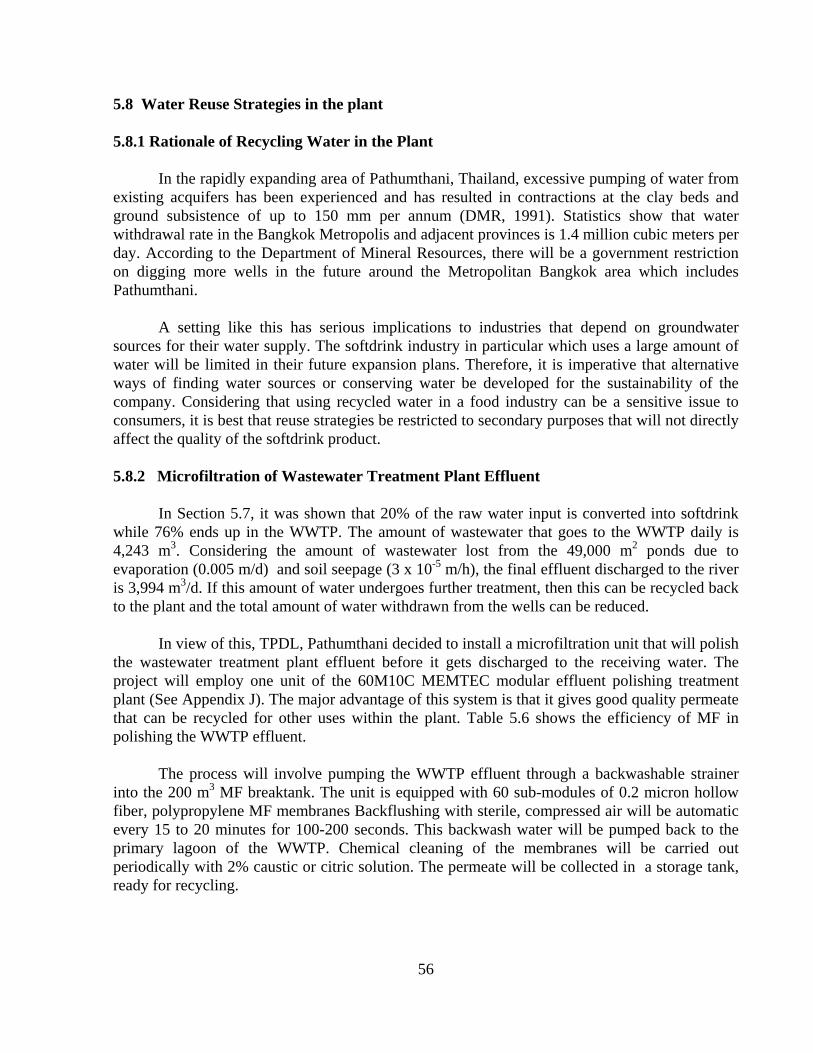
56
5.8 Water Reuse Strategies in the plant 5.8.1 Rationale of Recycling Water in the Plant In the rapidly expanding area of Pathumthani, Thailand, excessive pumping of water from existing acquifers has been experienced and has resulted in contractions at the clay beds and ground subsistence of up to 150 mm per annum (DMR, 1991). Statistics show that water withdrawal rate in the Bangkok Metropolis and adjacent provinces is 1.4 million cubic meters per day. According to the Department of Mineral Resources, there will be a government restriction on digging more wells in the future around the Metropolitan Bangkok area which includes Pathumthani. A setting like this has serious implications to industries that depend on groundwater sources for their water supply. The softdrink industry in particular which uses a large amount of water will be limited in their future expansion plans. Therefore, it is imperative that alternative ways of finding water sources or conserving water be developed for the sustainability of the company. Considering that using recycled water in a food industry can be a sensitive issue to consumers, it is best that reuse strategies be restricted to secondary purposes that will not directly affect the quality of the softdrink product. 5.8.2 Microfiltration of Wastewater Treatment Plant Effluent In Section 5.7, it was shown that 20% of the raw water input is converted into softdrink while 76% ends up in the WWTP. The amount of wastewater that goes to the WWTP daily is 4,243 m3. Considering the amount of wastewater lost from the 49,000 m2 ponds due to evaporation (0.005 m/d) and soil seepage (3 x 10⁻⁵ m/h), the final effluent discharged to the river is 3,994 m3/d. If this amount of water undergoes further treatment, then this can be recycled back to the plant and the total amount of water withdrawn from the wells can be reduced. In view of this, TPDL, Pathumthani decided to install a microfiltration unit that will polish the wastewater treatment plant effluent before it gets discharged to the receiving water. The project will employ one unit of the 60M10C MEMTEC modular effluent polishing treatment plant (See Appendix J). The major advantage of this system is that it gives good quality permeate that can be recycled for other uses within the plant. Table 5.6 shows the efficiency of MF in polishing the WWTP effluent. The process will involve pumping the WWTP effluent through a backwashable strainer into the 200 m3 MF breaktank. The unit is equipped with 60 sub-modules of 0.2 micron hollow fiber, polypropylene MF membranes Backflushing with sterile, compressed air will be automatic every 15 to 20 minutes for 100-200 seconds. This backwash water will be pumped back to the primary lagoon of the WWTP. Chemical cleaning of the membranes will be carried out periodically with 2% caustic or citric solution. The permeate will be collected in a storage tank, ready for recycling.
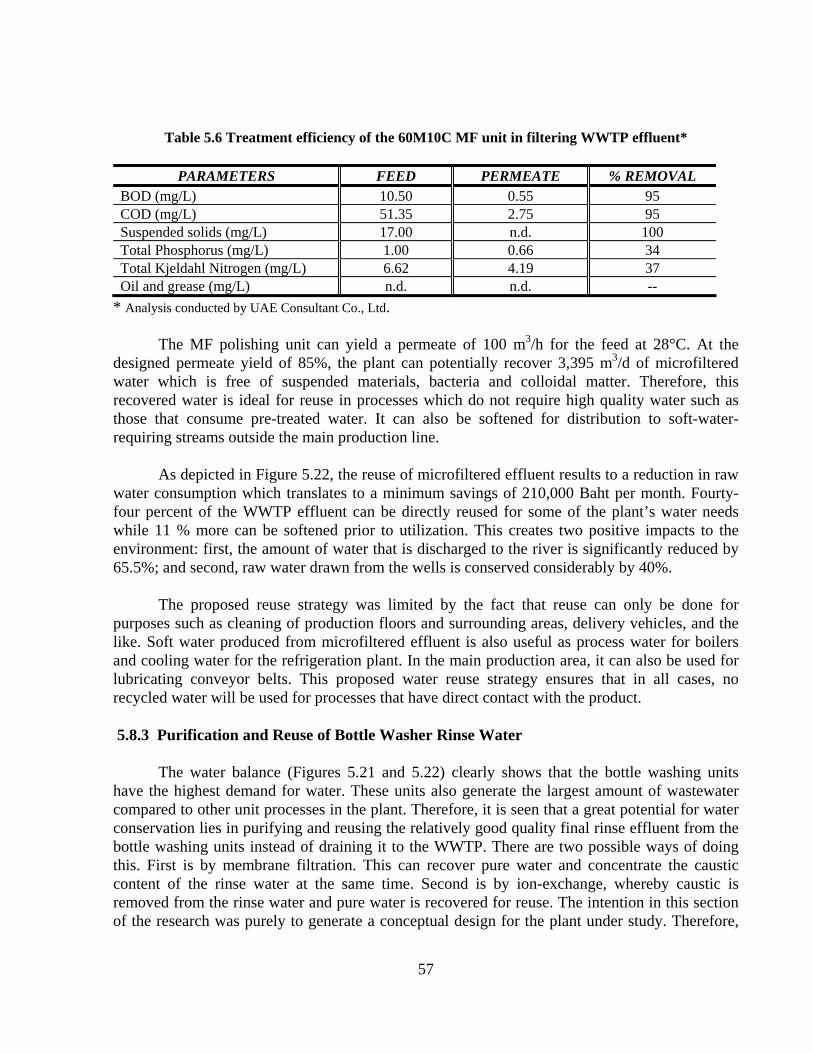
57
Table 5.6 Treatment efficiency of the 60M10C MF unit in filtering WWTP effluent*
PARAMETERS FEED PERMEATE % REMOVAL BOD (mg/L) 10.50 0.55 95 COD (mg/L) 51.35 2.75 95 Suspended solids (mg/L) 17.00 n.d. 100 Total Phosphorus (mg/L) 1.00 0.66 34 Total Kjeldahl Nitrogen (mg/L) 6.62 4.19 37 Oil and grease (mg/L) n.d. n.d. --
* Analysis conducted by UAE Consultant Co., Ltd. The MF polishing unit can yield a permeate of 100 m3/h for the feed at 28°C. At the designed permeate yield of 85%, the plant can potentially recover 3,395 m3/d of microfiltered water which is free of suspended materials, bacteria and colloidal matter. Therefore, this recovered water is ideal for reuse in processes which do not require high quality water such as those that consume pre-treated water. It can also be softened for distribution to soft-water-requiring streams outside the main production line. As depicted in Figure 5.22, the reuse of microfiltered effluent results to a reduction in raw water consumption which translates to a minimum savings of 210,000 Baht per month. Fourty-four percent of the WWTP effluent can be directly reused for some of the plant’s water needs while 11 % more can be softened prior to utilization. This creates two positive impacts to the environment: first, the amount of water that is discharged to the river is significantly reduced by 65.5%; and second, raw water drawn from the wells is conserved considerably by 40%. The proposed reuse strategy was limited by the fact that reuse can only be done for purposes such as cleaning of production floors and surrounding areas, delivery vehicles, and the like. Soft water produced from microfiltered effluent is also useful as process water for boilers and cooling water for the refrigeration plant. In the main production area, it can also be used for lubricating conveyor belts. This proposed water reuse strategy ensures that in all cases, no recycled water will be used for processes that have direct contact with the product. 5.8.3 Purification and Reuse of Bottle Washer Rinse Water The water balance (Figures 5.21 and 5.22) clearly shows that the bottle washing units have the highest demand for water. These units also generate the largest amount of wastewater compared to other unit processes in the plant. Therefore, it is seen that a great potential for water conservation lies in purifying and reusing the relatively good quality final rinse effluent from the bottle washing units instead of draining it to the WWTP. There are two possible ways of doing this. First is by membrane filtration. This can recover pure water and concentrate the caustic content of the rinse water at the same time. Second is by ion-exchange, whereby caustic is removed from the rinse water and pure water is recovered for reuse. The intention in this section of the research was purely to generate a conceptual design for the plant under study. Therefore,

58
pilot-scale studies are a must to confirm the actual viability of the following proposed alternatives.

56
RAW WATER
3,358 m3/d
PRE-TREATMENT PLANT
Line D Cleaning
Cleaning of vehicles
Manual stock washing
Softener Backwashing
Canteen
Training Center
Wet scrubbers43 m3/d
1,708 m3/d
117 m3/d
338 m3/d
21 m3/d
22 m3/d
10 m3/d
123 m3/d
1,071 m3/dOther uses
3,147 m3/d
Product 125 m3/d
1,101 m3/d
Cleaning; Drinking;
3,190 m3/d
117 m3/d
338 m3/d
11 m3/d
11 m3/d
10 m3/d
123 m3/d
PET Line
Lubrication of Line D
Cooling Water
Boilers
40 m3/d
415 m3/d 307 m3/d
68 m3/d
35 m3/d
40 m3/d
122 m3/d
307 m3/d
55 m3/d
35 m3/d
Post-mix line
Bottle-washers1,708 m3/d
96 m3/d
1,708 m3/d
96 m3/d
854 m3/d
Treatment Losses 255 m3/d
168 m3/d
WATER TREATMENT
PLANT 1,290 m3/d
249 m3/d(losses)
1,839 m3/d
64 m3/d
Backwash water (losses) SOFTENING
PLANT
23 m3/d
Reg ioneneration Solut
(losses)
420 m3/d
1,857 m3/d
Backwash water (losses)
2,504 m3/dpermeate
Water for Reuse
2,128 m3/d Microfiltration Polishing Unit
WWTP
1,754 m3/d (to river)
concentrate
4,131 m3/d
49 m3/d
Figure 5.22 Water balance showing the reuse of microfiltered WWTP effluent
49 m3/d
59
A. Membrane Filtration of Bottle Washer Rinse Water A research by Tay and Jeyaseelan (1996) revealed that bottle washing wastewater can be treated by UF or RO for reuse. The study further showed that it was economically feasible because the membrane filtration treatment systems did not only reduce the consumption of input water but energy was conserved as hot water was recovered in the process. The characteristics of the wastewater studied by Tay and Jeyaseelan were found similar to those of the bottle washer effluent discharged by TPDL, Pathumthani (Table 5.7). Therefore, membrane technology for water recovery will also be viable in the case of TPDL.
Table 5.7 Comparison of the bottle washer wastewater characteristics
PARAMETER Bottle washing wastewater (Tay and Jeyaseelan,1996)
Final Rinse Effluent (TPDL, Pathumthani)
Temperature (°C) 40-50 40-50 pH 8.5 10-11 Color (Hazen units) 90 5-10 Turbidity (NTU) 11 5.2 TDS (mg/L) 3,370 1,832 Conductivity (µS/cm) 3,360 1,628 Suspended solids (mg/L) no data 32 COD (mg/L) 680 393
Conceptually, the RO system will produce an effluent that is better than potable water, thus it will be acceptable for reuse in the bottle washing units. It is proposed that a MF unit be installed as a pre-treatment unit for such a system. If the MF/RO system were employed for the recovery of the wastewater from the last compartment and the final rinse effluent that is directly discharged to the WWTP, then, 285 m3/d of rinse water is potentially recoverable from each bottle washer. At the same time, the caustic drained from the system can be recovered as a concentrate in the RO system. Assuming an overall yield of 83% for the MF/RO system, then a total of 237 m3/d of soft water and 5 m3 of 3% (w/w) of caustic solution (containing 170 kg of NaOH) can be recycled back to the bottle washers (Figure 5.23) daily. This reduces the amount of input rinse water by 56% and the input caustic soda by 60%. The impact of this recovery system on the overall water balance in the plant is illustrated in Figure 5.24. Considering that the microfiltered effluent is utilized as suggested earlier, then, purification and reuse of rinse water will further reduce raw water consumption by 30% from 3,358 m3/d to 2,350 m3/d. This reuse strategy will have a corresponding effect on the wastewater generation of the plant and will reduce the water discharged to the river from 1,754 m3/d to 740 m3/d, equivalent to 57.8% reduction. A financial analysis conducted for this recovery system gave a payback period of 3.2 years and an IRR of 31.3%, with a NPV of 5.5 M Baht. The savings taken into account included the value of recovered soft water and caustic solution, and the savings on wastewater treatment cost (Table K1, Appendix K).

60
To avoid plugging the resin with particulates, it is recommended that the rinse wastewater be pre-treated by dual-media filtration (DF) before it passes through the IE column. For a continuous process to be possible, there must be two units each of the prefilter and the IE column installed for each bottle washer to accommodate the regeneration cycle of the resin (Figure 5.25). At a designed recovery rate of 80%, the IE system will recover 228 m3/d of water that can be reused back to the bottle washer.
Figure 5.23 Schematic of the proposed MF/RO system for caustic and water recovery
B. Recovery of Bottle Washer Rinse Water by Ion Exchange Ion exchange (IE) can remove a variety of dissolved solids. In water softening, IE is extensively used to remove calcium and magnesium ions in water by replacing them with another non-hardness cation, usually sodium. This exchange occurs at a solids interface. For the purpose of purifying the final rinse water contaminated with NaOH, a weak acid cation exchange column can be employed. As the alkaline water is contacted with the resin, the following generalized reaction occurs:
R- COOH + NaOH R-COONa + H2O (Equation 5.7) As long as exchange sites are available in the medium, reaction will be virtually instantaneous and complete. However, when all exchange sites are utilized, regeneration of the resin should be carried out by contacting it with 35% HCl solution. The strength of the regenerant solution overrides the selectivity of the adsorption sites (Peavy et al., 1985) and sodium is replaced by hydrogen as shown in the following reaction:
R-COONa + HCl R-COOH + NaCl (Equation 5.8)
Purified soft water for reuse
Bottle Washer 285 m3/d
211 kg/d NaOH
Final rinse wastewater
MF
Concentrated (3% w/w) caustic solution for reuse, 5 m3/d
to WWTP
RO 190 m3/d 427 m3/d
237 m3/d
242 m3/d 170 kg/d NaOH
Caustic soda tank
Soft Water
237 m3/d water
170 kg/d NaOH

RAW WATER
2,350 m3/d
PRE-TREATMENT PLANT
Line D Cleaning
Cleaning of vehicles
Manual stock washing
Softener Backwashing
Canteen
Training Center
Wet scrubbers
43 m3/d
1,708 m3/d
117 m3/d
338 m3/d
21 m3/d
22 m3/d
10 m3/d
123 m3/d
1,071 m3/dOther uses
2,190 m3/d
Product
125 m3/d
1,101 m3/d
Cleaning; Drinking;
2,233 m3/d
117 m3/d
338 m3/d
Backwash water (losses)
117 m3/d
11 m3/d
11 m3/d
10 m3/d
123 m3/d
PET Line
Lubrication of Line D
Cooling Water
Boilers
40 m3/d
415 m3/d 307 m3/d
68 m3/d
35 m3/d
40 m3/d
122 m3/d
307 m3/d
55 m3/d
35 m3/d
Post-mix linereuse (4.85 m3/d)
Bottle-washers96 m3/d
791 m3/d
96 m3/d
854 m3/d
Treatment Losses 194 m3/d
3,117 m3/d
WATER
TREATMENT PLANT
1,290 m3/d
249 m3/d(losses)
SOFTENING PLANT
420 m3/d
900 m3/d
MF/RO recovery system
948 m3/d rinse water760 m3/d
1,140 m3/d
Water for Reuse
2,504 m3/dMicrofiltration Polishing Unit
2,128 m3/d WWTP
13 m3/d
Regeneration Solution (losses)
64 m3/d
Backwash water (losses)
740 m3/d (to river)
concentrate
permeate
Pre-rinse effluent and MF concentrate
Recovered caustic for
49 m3/d
59Figure 5.24 Water balance showing the reuse of membrane filtered rinse water
49 m3/d

62
Financial analysis of the proposed DF/IE installation gave a payback period of 3.4 years and an IRR of 30.5%, with a NPV of 2.2 M Baht. Details of the costs involved and the savings on wastewater treatment and soft water recovery can be found in Table K2, Appendix K. The overall impact of this alternative on the water balance of the plant as depicted in Figure 5.26 will be similar to that of the MF/RO system. Raw water input will be reduced by 29% and the make-up rinse water for the bottle washers will be reduced by 53%. However, the introduction of the 35% HCl regenerant solution in this water recovery strategy will produce additional 0.5 mP
3P/d of
wastewater loaded with NaCl.
Figure 5.25 Design schematic of the DF/IE system for final rinse recovery
Designing a scheme for reduced water consumption and wastewater generation for a specific plant often requires a compromise among water quality needs, wastewater constituents, operating costs and capital equpment costs. A comparison of the two proposed rinse water recovery systems is presented in Table 5.8. Each alternative has its own pros and cons - choosing an optimum system is simply a matter of corporate decision among company executives.
Table 5.8 Comparison of proposed rinse water recovery systems
PARAMETER MF/RO System
DF/IE System
1. Raw water consumption (mP
3P/d) 2,350 2,388
2. Water discharged to river (mP
3P/d) 740 779
3. Soft water recovered (mP
3P/d) 948 912
4. Caustic soda recovered (kg/d) 170 0 5. Installation cost (Baht/ BW unit) 4,200,000 1,780,000 6. Net annual savings (Baht/ BW unit) 1,322,000 525,184 7 Net Present Value (Baht/BW unit) 5,500,000 2,200,000 8. Payback period (years/ BW unit) 3.2 3.4 9. Internal rate of return (%/ BW unit) 31.3 30.5
228 mP
3P/d
Bottle Washer
285 mP
3P/d
211 kg/d NaOH
Final rinse wastewater
1
2
1
2
Dual-media filter
Ion-exchange column
Purified soft water for reuse
Soft Water
427 mP
3P/d
228 mP
3P/d
199 mP
3P/d

63
RAW WATER
2,388 mP
3P/d
PRE-TREATMENT PLANT
Line D Cleaning
Cleaning of vehicles
Manual stock washing
Softener Backwashing
Canteen
Training Center
Wet scrubbers
43 mP
3P/d
1,708 mP
3P/d
49 mP
3P/d
117 mP
3P/d
338 mP
3P/d
21 mP
3P/d
22 mP
3P/d
10 mP
3P/d
123 mP
3P/d
1,071 mP
3P/d
Other uses
2,226 mP
3P/d
Product
125 mP
3P/d
1,101 mP
3P/d
Cleaning; Drinking;
2,269 mP
3P/d
49 mP
3P/d
117 mP
3P/d
338 mP
3P/d
Backwash water (losses)
119 mP
3P/d
11 mP
3P/d
11 mP
3P/d
10 mP
3P/d
123 mP
3P/d
PET Line
Lubrication of Line D
Cooling Water
Boilers
40 mP
3P/d
415 mP
3P/d 307 mP
3P/d
68 mP
3P/d
35 mP
3P/d
40 mP
3P/d
122 mP
3P/d
307 mP
3P/d
55 mP
3P/d
35 mP
3P/d
Post-mix lineBottle-washers96 mP
3P/d
791 mP
3P/d
96 mP
3P/d
854 mP
3P/d
Treatment Losses 197 mP
3P/d
3,156 mP
3P/d
WATER
TREATMENT PLANT
1,290 mP
3P/d
249 mP
3P/d
(losses)
SOFTENING PLANT
420 mP
3P/d
936 mP
3P/d
Ion exchange recovery system
912 mP
3P/d rinse water
796 mP
3P/d
1,140 mP
3P/d
Water for Reuse
2,504 mP
3P/dMicrofiltration
Polishing Unit 2,128 mP
3P/d
WWTP
14 mP
3P/d
Regeneration Solution (losses)
64 mP
3P/d
Backwash water (losses)
779 mP
3P/d (to
river) concentrate
permeate
Pre-rinse effluent and spent brine solution d
Figure 5.26 Water balance showing the reuse of recovered rinse water by ion exchange
35% HCl for regeneration
64
CHAPTER 6
Conclusions and Recommendations
The following conclusions were reached from this study: 1. The characteristics of caustic soda in terms of pH, TDS, COD, color and conductivity in
the different soaking compartments of the bottle washer vary with length of production time. Generally, as production time increases, the strength of caustic as waste also increases.
2. Pilot-scale membrane filtration of spent caustic soda using 0.2 µm MEMTEC hollow fiber
membranes revealed that MF can successfully remove 100% of suspended solids, 26% of COD and 60% of color from the waste. Based on permeate quality and flux, the optimum applied pressure for MF was found to be 101 kPa (1.0 bar), with a caustic recovery of 85%.
3. Nanofiltration of the microfiltered caustic using MPS-34 (MWCO=300) showed that at the
optimum applied pressure of 1,414 kPa (14 bar), removal efficiencies greater than 95% for color and 80% for COD were achieved. Caustic recovery was found to be 91%. The purified caustic is fit for reuse in the bottle washers.
4. The designed large-scale MF/NF system for caustic recovery was not economically
feasible. The payback period of seven years is very high, and at the same time, the internal rate of return (13.7%) is very low. Moreover, the system will be under-utilized since operation only totals 853 hours per year. This in turn is caused by the caustic being drained only every after three months of use per bottle washer.
5. Of the 432 kg of caustic added to the bottle washer per day, 70% is drained out of the unit
with the rinse water, while 30% is lost in the chemical reactions. Therefore, there is a great potential in recovering the caustic from the rinse water.
6. Water consumption profile of the plant revealed that raw water is drawn from deepwells at
an average rate of 5,598 m3/d. Out of this volume, 31.3% (1,752 m3/d) is consumed as pre-treated process water, 21.9% (1,226 m3/d) as treated water and 40.3% (2,256 m3/d) as soft water. The amount of wastewater treated in the biological WWTP averages 4,243 m3/d, of which 40% comes from the bottle washing units.
7. Microfiltration of WWTP effluent and recycling of the permeate in unit processes which
are not directly in contact with the product leads to cosiderable reductions in raw water input by 40% and liquid discharged to the river by 65.5%.

65
8. There are two proposed alternatives for purification of final rinse effluent for reuse in bottle washing units. These are membrane filtration by MF/RO and ion exchange. The MF/RO system recovers pure water and caustic solution in the process. This gave a payback period of 3.2 years and an IRR of 31.3%. On the other hand, treatment of rinse water by ion exchange recovers only water. The payback period for this system is 3.4 years while IRR is 30.5%.
From these findings, it is recommended that: 1. further investigation on the chemical reactions of caustic with impurities from bottle
washing be conducted, to explain the high COD content of the NF permeate ; 2. comparative studies be carried out to evaluate the performance of other commercially-
available MF and NF membranes for caustic soda recovery; 3. actual pilot-runs be performed on the proposed treatment of final rinse effluent by MF/RO
system and ion-exchange to verify their applicability to the specific waste being generated at the TPDL;
References ANONYMOUS I, 1994. SelRo membranes: a new class of solvent, caustic, acid stable membranes. Asian Water and Sewage, Sep.-Oct., p.36. ANONYMOUS II, 1995. Green ALKASAVE membrane system cost-effective. Asian Water and Sewage, Jul-Aug., p. 36-37. BARISH, N.N. and S. KAPLAN, 1978. Economic Analysis for Engineering and Managerial Decision Making. 2nd ed, New York: McGraw-Hill Book Co.
BEN AIM, R. and S. VIGNESWARAN, 1988. Application of Membrane Processes in Water and Wastewater Treatment. ENFO, 10, 1: pp. 3-6. BOFFARDI, B.P. and A.L. SMITH, 1995. Chemical Treatment Makes Cooling Water Reusable. Chemical Engineering, 102, 7:106-108. BYERS, B., 1995. Zero Discharge: A systematic Approach to Water Reuse. Chemical Engineering, 102, 7: 96-100. BYRNE, W., 1995. Reverse Osmosis, A practical Guide for Industrial Users. USA: Tall Oaks Publishing. CAPOBIANCO, D.J. and F.C. BLANC, 1990. Treatment of Softdrink Syrup and Bottling Wastewater using Anaerobic Upflow Packed Bed Reactors, in Proceedings of the 44th Industrial Waste Conference May 9-11, 1989 Purdue University. Michigan: Lewis Publishers. CAPPOS, S., 1995. Membranes Minimize Liquid Discharge. Chemical Engineering, 102, 7: 102-104. CARTWRIGHT, P., 1994. Pollution Prevention Drives Membrane Technologies. Chemical Engineering, 101, 9: 84-87. DAVIS, M.L. and D.A. CORNWELL,1991. Introduction to Environmental Engineering. 2nd ed., Singapore:McGraw-Hill Book Co. DEGREMONT, 1979. Water Trt. Handbook. 5th ed, New York: Halsted Press. DMR (Department of Mineral Resources), 1995. Document on state of groundwater souces in Bankok, Thailand. DURANCEAU S.J., J.S. TAYLOR and L.A. MULFORD, 1992. SOC Removal in a Membrane Softening Process. J. AWWA, 84, 1: 68-78.
66
FRESNIUS, W., W. SCHNEIDER, B. BOHNKE and K. POPPINGHAUS, eds., 1989. Waste Water Technology: Origin, Collection, Treatment and Analysis of Wastewater. Springer-Verlag, Berlin, Germany, pp. 164-166. HAUCK, J. and S. MASOOMIAN, 1990. Alternative Technologies for Wastewater Treatment. Pollution Enginnering, 22, 5: 81-84. HERER, D.O., 1992. Wastewater Pretreatment. Pollution Engineering, 24, 10: 35-39. HO, W.S. W. and K.K. SIRKAR (eds.), 1992. Membrane Handbook. New York: Chapman Hall. JACOBS, M.B., 1959. Manufacture and Analysis of Carbonated Beverages. New York: Chemical Engineering Co., Inc. KIERNAN, J.C., W.T. HARVEY and D. BURRAGE, 1992. Electrodialysis Reversal Brine Concentration for Zero Liquid Discharge: The Ocean State Power Story. USA: Tall Oaks Publishing, Inc. MICHAELS, S.L., 1989. Crossflow Microfilters: The Ins and Outs. Chemical Engineering, 96, 1: 84-91. MOONEY, G.A., 1992. Polution Prevention: Shrinking the Waste Streams. Pollution Engineering, 24, 5: 36-41. MOORE, J.W., 1989. Balancing the Needs of Water Use.New York: Springer-Verlag.268 pp. MPW (Membrane Products Worldwide), 1994. Recovery of Spent Caustic Cleaning Solution from Food Processing Equipment. Company Catalogue. NEMEROW, N.L., 1978. Industrial Water Pollution: Origin, Characteristics and Treatment. USA: Addison-Wesley Publishing Co., Inc. NOBLE, R.O. and S.A. STERN (eds.), 1995. Membrane Separations Technology, Principles and Applications. Netherlands: Elsevier Science B.V. PEAVY, H.S., D.R. ROWE and G. TCHOBANOGLOUS, 1985. Environmental Engineering. Singapore: Mc-Graw-Hill Book Co. PEPPER, D., 1981. Recovery of Materials from Effluents by Membrane Systems, in Food Industry Wastes: Disposal and Recovery. A. Herzka and R.G. Booth, eds. Great Britain: Applied Science Publishers, Ltd., pp. 204-209. RAMAN, L.P., M. CHERYAN and N. RAJAGOPALAN, 1994. Consider Nanofiltration for Membrane Separations. Chem. Engg. Progress, 90, 3: 68-74.
67

RAUTENBACH, R. and R. ALBRECHT, 1989. Membrane Processes. New York: John Wiley and Sons. ROSAIN, R.M., 1993. Reusing Water in CPI Plants. Chem. Engg. Progress, 89, 4: 28-35. ROY, P.K., 1995. Nanofiltration as a Tertiary Treatment for Phosphate Removal from Wastewater. Master’s Thesis, AIT, Thailand. SHUKLA, S.D. and G.N. PANDEY, 1979. A Textbook of Chemical Technology, Vol. II (organic). Delhi: Vikas Publishing House, Pvt., Ltd. Standard Methods for Examination of Water and Wastewater, 1985. 16th, APHA.AWWA.WPCF. TAN, L. and R.G. SUDAK, 1992. Removing Color from a Groundwater Source. J. AWWA, 84,1: 79-87. TAY, J. and S. JEYASEELAN, 1994. Reuse of Wastewater from Beverage Industry by Membrane Filtration. Proceedings of the ASEAN-Europe Workshop on Membrane Technology in Agro-based Industry, 26-30 July 1994, KL, Malaysia,. 28-43. TZENG, W.C. and R.R. ZALL, 1990. Combining Polymers with Chemical, Thermal and Turbulent Conditions to Clean Ultrafiltration Membrane Fouled with Milk. Process Biochem International, 25, 3: 71-78. VIGNESWARAN, S., VIGNESWARAN, B and R. BEN AIM, 1991. Application of Microfiltration for Water and Wastewater Treatment. ENSIC No. 31, AIT, Bangkok, Thailand. VIRARAGHAN, T., 1994. Pollution Control in the Dairy Industry, in Process Engineering for Pollution Control and Waste Minimization. D.L. Wise and D.J. Trantolo, eds. New York: Marcel-Dekker, Inc., pp. 705-709. WEAST , R.C., (chief ed.), 1989. Handbook of Chemistry and Physics. Florida: CRC Press, 69th ed. WEISNER, M.R. et al, 1992. Committee Report: Membrane Processes in Potable Water Treatment. J. AWWA, 84, 1: 59-67. YUANZHEN, W., 1995. Water Treatment by Membrane Filtration. Master’s Thesis, AIT, Thailand.
68

69
APPENDIX A
Table 1. Washing process specifications for the Bottle-washers
PROCESS SPECIFICATIONS Bottle Washers A and B Bottle Washers D1 and D21. PRE-RINSING with warm reclaimed water
Outside jets: 2 rows Inside jets: 3 rows
Outside jets: 2 rows Inside jets: 2 rows
2. CAUSTIC SOAKING which includes jetting
Caustic contact time: 9.4 mins. at 970 BPM Caustic immersion time: 6.4 mins. at 970 BPM
Caustic contact time: 10 mins. at 1,100 BPM Caustic immersion time: 7.2 mins.at 1,100 BPM
3. CAUSTIC JETTING Radial inside jets: 2 rows outside jets: 2 times Horizontal inside jet: 6 rows
Radial inside jets: 2 rows outside jets: 3 times Horizontal inside jet: 6 rows
4 .HOT WATER SOAKING which removes most of the caustic solution from bottles
Contact time: 0.6 min. at 970 BPM
Contact time: 0.8 min. at 1,100 BPM
5. SECONDARY RECLAIM WATER RINSING
Outside jets: 2 rows Inside jets: 4 rows
Outside jets: 2 rows Inside jets: 3 rows
6. PRIMARY RECLAIM WATER RINSING
Inside jets: 4 rows Inside jets: 2 rows Outside jets: 3 rows
7. FRESH WATER RINSING Outside jets: 2 rows Inside jets: 3 rows
Outside jets: 2 rows Inside jets: 3 rows

70
APPENDIX B
Table B1. Specifications of MEMTECH Microfiltration Pilot Unit
1. OPERATING CONDITIONS - circulating flow rate (maximum) - backwash pressure setting
6 m3/h 600 kPa
2. MAIN STRUCTURE - construction material
SS 304
3. FEED TANK - Volume - Material
60L polyvinyl chloride
4. PUMPING SYSTEM - Flow - Filtration Direction - Wetted materials
Centrifugal pump Crossflow polypropylene
5. MEASURING and CONTROL ELEMENTS
Programmable Logic Controller - Hitachi E-20 HR
6. CONTROL PANEL includes: - Start/stop, Membrane test, Manual backwash, Ancillary, and Membrane rewet push buttons - Backwash interval timer - Power requirements
1 phase, 240 V/50 Hz, neutral and earth
Table B2. Specifications of the MF membrane element used
Physical details Manufacturer MEMTEC Membrane Material polypropylene Membrane Type hollow fiber Filtration direction outside in Pore size (nominal) 0.2 micrometer Design surface area 4 x 1 m2
Operating limits Temperature range 5 to 40°C pH range 2-14 Maximum transmembrane pressure 200 kPa Maximum feed pressure 600 kPa Maximum total chlorine/chloramine <0.05 ppm

71
Table B3. Specifications of M204-SW pilot unit for the NF membrane system. 1. OPERATING CONDITIONS - circulating flow rate (maximum) - operating pressure (maximum) - operating temperature
19 L / min 4,040 kPa (40 bar) 70oC
2. MAIN STRUCTURE - construction material - approximate dimensions (L/W/H) - mounted on 4 casters
SS 304 1.2 x 0.7 x 1.5 meters
3. FEED TANK - Volume - Material
40 L SS 316
4. PUMPING SYSTEM - Positive displacement pump: Flow (maximum) Pressure (maximum) Temperature (maximum) - Feed pump - Centrifugal pump Flow Pressure Wetted materials
SS 316 19 L /min 4,040 kPa (40 bar) 70oC 19 L per minute ~ 101 kPa (1 bar) polypropeylene
6. CONTROL PANEL includes: - Start/stop push buttons - Alarm lights and safety interlocks for high/low pressure; high temperature; low level in feed tank; and temperature controller - Power requirements
3 phase, 380 V/50 Hz
Table B4. Specifications of the MPS-34 NF membrane element
Physical details Manufacturer Membrane Products Kiryat Weizmann, Ltd. Membrane Material polypropylene Membrane Type spiral wound Element diameter and length 2.5” x 40” (6.4 cm x 101.6 cm) Feed spacer 30 mil (0.08 cm) , symmetrical, diamond Design surface area 1.6 m2
Operating limits Maximum temperature 45°C pH range 0-14 Feed flowrate range 6-26.5 L/min Maximum operating pressure 4,040 kPa (40 bar)

APPENDIX C
Table C1. Characteristics of caustic wastewater in Compartment 1 Volume of soaking solution: 15 m3
PARAMETERS Length of production hours in use (h) 295 383 471 1266 1312 pH 13.90 13.64 13.78 13.61 13.90 Temperature (oC) 48 47 52 50 n.d.*NaOH concn. (%) 2.3 3.0 3.0 2.4 4.17** Total Solids (mg/L) 37,580 40,422 41,799 50,388 59,763 SS (mg/L) 54 37.5 48 23 23 TDS (mg/L) 37,526 40,384 41,751 50,365 59,730 Apparent Color (Hazen units) 300 150 150 800 600 Turbidity (NTU) 17 20 23 8 8 COD (mg/L) 9,639 6,295 6,857 10,667 8,813 Conductivity (mS/cm) 88.7 100 103 105 112.5 * n.d. - no data **Based on caustic analyis carried out in AIT laboratory. Other values taken from the factory.
Table C2. Characteristics of caustic wastewater in Compartment 2 Volume of soaking solution: 15 m3
PARAMETERS Length of production hours in use (h)
295 383 471 1266 1312 pH 13.90 13.81 13.80 13.70 13.87 Temperature (oC) 66 66 68 65 n.d.*NaOH concn. (%) 3.3 2.9 3.2 2.9 3.37** Total Solids (mg/L) 56,032 42,735 45,399 59,246 61,775 SS (mg/L) 110 325 59 25 30 TDS (mg/L) 55,922 42,702 45,340 59,221 61,745 Apparent Color (Hazen units) 300 133 150 600 600 Turbidity (NTU) 19 22 18 7 4 COD (mg/L) 7,278 5,115 4,762 10,667 10,125 Conductivity (mS/cm) 115 105 108 103 90 * n.d. - no data **Based on caustic analyis carried out in AIT laboratory. Other values taken from factory analysis.
72
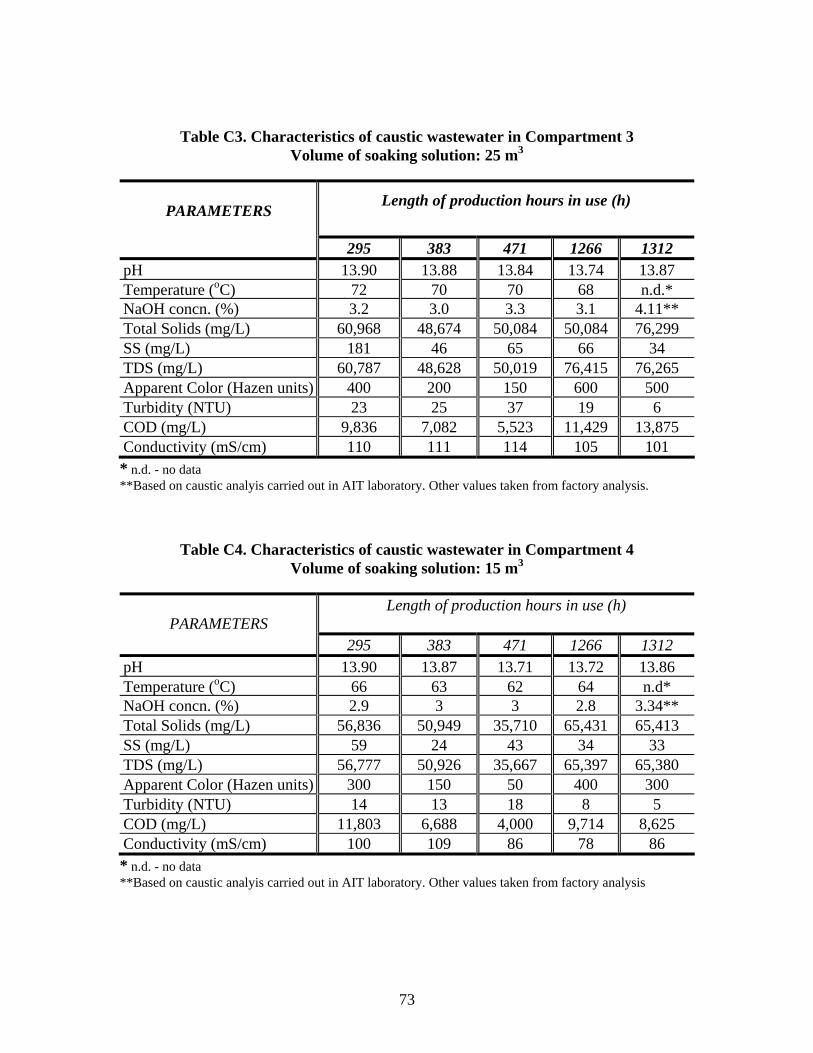
Table C3. Characteristics of caustic wastewater in Compartment 3 Volume of soaking solution: 25 m3
PARAMETERS Length of production hours in use (h)
295 383 471 1266 1312 pH 13.90 13.88 13.84 13.74 13.87 Temperature (oC) 72 70 70 68 n.d.*NaOH concn. (%) 3.2 3.0 3.3 3.1 4.11** Total Solids (mg/L) 60,968 48,674 50,084 50,084 76,299 SS (mg/L) 181 46 65 66 34 TDS (mg/L) 60,787 48,628 50,019 76,415 76,265 Apparent Color (Hazen units) 400 200 150 600 500 Turbidity (NTU) 23 25 37 19 6 COD (mg/L) 9,836 7,082 5,523 11,429 13,875 Conductivity (mS/cm) 110 111 114 105 101 * n.d. - no data **Based on caustic analyis carried out in AIT laboratory. Other values taken from factory analysis.
Table C4. Characteristics of caustic wastewater in Compartment 4 Volume of soaking solution: 15 m3
PARAMETERS Length of production hours in use (h)
295 383 471 1266 1312 pH 13.90 13.87 13.71 13.72 13.86 Temperature (oC) 66 63 62 64 n.d*NaOH concn. (%) 2.9 3 3 2.8 3.34** Total Solids (mg/L) 56,836 50,949 35,710 65,431 65,413 SS (mg/L) 59 24 43 34 33 TDS (mg/L) 56,777 50,926 35,667 65,397 65,380 Apparent Color (Hazen units) 300 150 50 400 300 Turbidity (NTU) 14 13 18 8 5 COD (mg/L) 11,803 6,688 4,000 9,714 8,625 Conductivity (mS/cm) 100 109 86 78 86 * n.d. - no data **Based on caustic analyis carried out in AIT laboratory. Other values taken from factory analysis
73
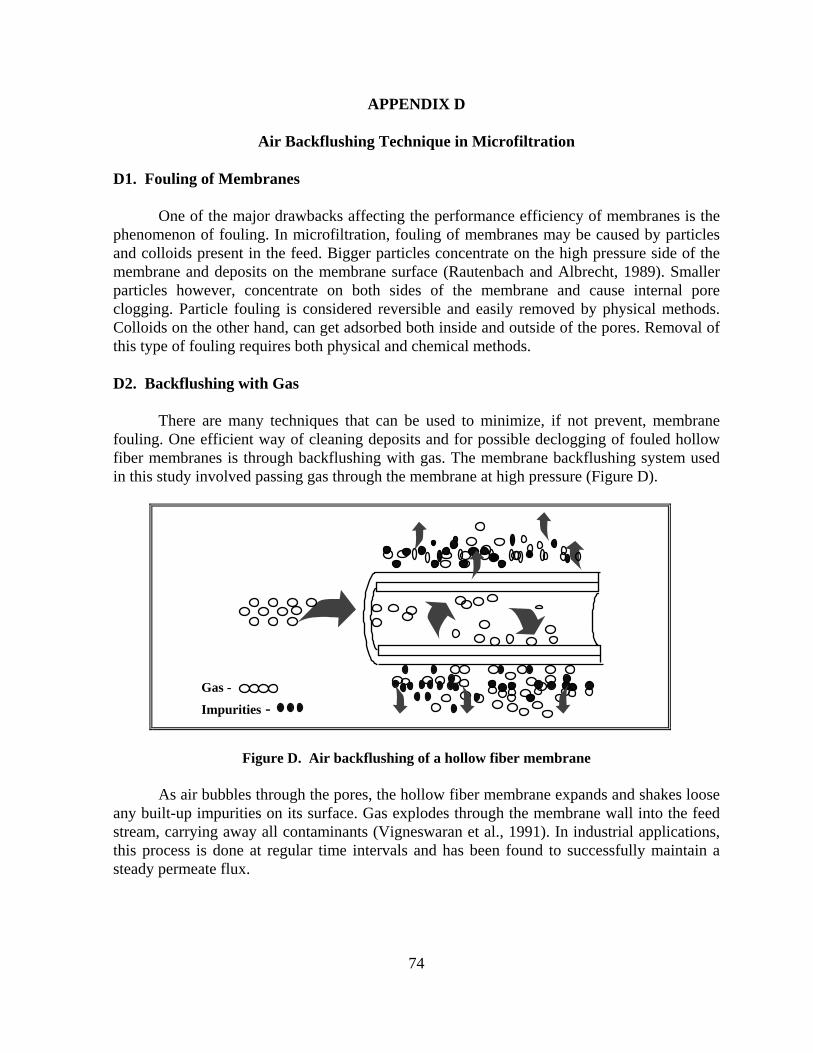
APPENDIX D
Air Backflushing Technique in Microfiltration D1. Fouling of Membranes One of the major drawbacks affecting the performance efficiency of membranes is the phenomenon of fouling. In microfiltration, fouling of membranes may be caused by particles and colloids present in the feed. Bigger particles concentrate on the high pressure side of the membrane and deposits on the membrane surface (Rautenbach and Albrecht, 1989). Smaller particles however, concentrate on both sides of the membrane and cause internal pore clogging. Particle fouling is considered reversible and easily removed by physical methods. Colloids on the other hand, can get adsorbed both inside and outside of the pores. Removal of this type of fouling requires both physical and chemical methods. D2. Backflushing with Gas There are many techniques that can be used to minimize, if not prevent, membrane fouling. One efficient way of cleaning deposits and for possible declogging of fouled hollow fiber membranes is through backflushing with gas. The membrane backflushing system used in this study involved passing gas through the membrane at high pressure (Figure D).
Gas -
Impurities -
Figure D. Air backflushing of a hollow fiber membrane As air bubbles through the pores, the hollow fiber membrane expands and shakes loose any built-up impurities on its surface. Gas explodes through the membrane wall into the feed stream, carrying away all contaminants (Vigneswaran et al., 1991). In industrial applications, this process is done at regular time intervals and has been found to successfully maintain a steady permeate flux.
74

APPENDIX E
Table E1. Microfiltration permeate characteristics at different operating pressures
Permeate Feed Transmembrane pressure (bar)1
characteristics 0.75 1.00 1.20 1.39Flux (L/m2-h) -- 200 235 250 308pH 13.98 14.0 14.0 14.0 14.0 Turbidity (NTU) 9.0 1.9 2.0 1.8 1.8 Apparent Color (Hazen units) 500 200 200 200 200 Color Reduction (%) -- 60 60 60 60 Conductivity (mS/cm) 100.9 92.9 93.1 91.3 94.1 COD (mg/L) 9,848 8,944 7,301 7,848 8,213 COD Reduction (%) -- 9.2 25.9 20.3 16.6 NaOH concentration. (%) 3.698 2.978 3.110 2.948 2.963 NaOH Recovery (%) -- 80.5 84 79.7 80.2 Suspended solids (mg/L) 46 ND2 ND ND ND TDS (mg/L) 64,205 50,531 50,851 52,899 49,449
1 1 bar = 101 kPa 2 ND - non-detectable Table E2. Nanofiltration permeate quality at different transmembrane pressures
Permeate Characteristics Feed Transmembrane pressure (bar)1
8.0 11.0 14.0 17.0 Flux (L/m2 -h) -- 4.75 6.75 14.9 23.5 pH 14.0 14 14 14 14 Turbidity (NTU) 1.32 0.50 0.32 0.44 0.33 Apparent color (Hazen units) 200 50 <5 <5 <5 Color Reduction (%) -- 75 >97.5 >97.5 >97.5 Conductivity (mS/cm) 94.0 93.3 95.5 95.5 94.0 COD (mg/L) 8,606 2,235 2,616 1,646 1,681 COD Reduction (%) -- 74 69.6 80.9 80.5 TDS (mg/L) 48,620 30,685 37,040 29,310 30,202 NaOH concentration (%) 3.110 2.757 2.854 2.832 2.742 NaOH Recovery (%) -- 88.6 91.8 91.1 88.2
1 1 bar = 101 kPa
75

76
APPENDIX F
Table F1. Data for overall monthly caustic consumption for the year 1995:
MONTH Consumption of 32% NaOH solution (kg) MONTH Consumption of 32%
NaOH solution (kg) January 130,960 July 110,370
February 116,450 August 115,360 March 151,970 September 93,700 April 147,350 October 90,940 May 120,370 November 112,990 June 116,760 December 125,990
Total amount ot 32% caustic solution used = 1,433,210 kg/year Table F2. Caustic required for bottle washers A and B COMPARTMENT 1 2 3 4 5 TOTAL Volume capacity (m3) 15 15 25 15 9 70 NaOH concentration (%) 3.0 3.0 3.0 1.5 0 -- Required 32% NaOH (kg) 1406.25 1406.25 2,344 703.13 0 5,860
Total amount of 32% solution for bottle washers A and B: 5,860 x 2 = 11,720 kg Table F3. Caustic required for bottle washers D1 and D2 COMPARTMENT 1 2 3 4 5 6 7 TOTAL Volume capacity (m3) 6.1 6.1 6.1 6.1 6.1 6.1 4.5 36.6 NaOH concentration (%) 3.0 3.0 3.0 3.0 3.0 3.0 0 -- Required 32% NaOH (kg) 572 572 572 572 572 572 0 3,431
Total amount of 32% caustic solution for bottle washers D1 and D2: 3,431 x 2 = 6,862 kg Total amount of 32% caustic solution for all 4 bottle washers (11,720 + 6,862) = 18,582 kg Total 32% NaOH solution used after each drainage (18,582 kg/drain x 4 drains/yr) = 74,328 kg/yr Amount used for post-mix container washing (240 kg/day x 300 d/yr) = 72,000 kg/yr Total 32% NaOH for replenishment in the 4 bottle washers (1,433,210 -74,328 - 72,000) = 1,286,882 kg/yr Ave. daily consumption rate of caustic for adjustment of concentration (1,286,882/300) = 4,289 kg/day IMPLICATION: About 23% (4,289 kg /18,582 kg) of the caustic in all the bottle washers are lost in the system everyday, thus being replaced regularly by addition of caustic into the caustic compartments. Assuming the same rate of loss in all bottle washers, then the average amount of caustic added daily to each is:
Bottle Washer as 32% Solution (kg/day)
mass NaOH (kg/day)
A 0.23 (5,860 kg) 1,352 432 B 0.23 (5,860 kg) 1,352 432
D1 0.23 (3,431 kg) 792 253 D2 0.23 (3,431 kg) 792 253

77
APPENDIX G
Financial Analysis details for the MF/NF caustic recovery system
Table G1. Details of Equipment Cost
System
Microfiltration1
Nanofiltration1
Components Qty Unit price (Baht)2
Total Cost (Baht)
Qty Unit price (Baht)
Total Cost (Baht)
1. membrane 4 modules of 1 m2
3,750 15,000 7 modules of 6.2 m2
25,000 175,000
2. feed pump 1 9,900 9,900 2 9,900 19,800 3. high pressure
pump 0 -- 0 1 39,450 39,450
4. cartridge 1 3,000 3,000 1 3,000 3,000 5. backwash
equipment 1 25,000 25,000 0 --
6. permeate tank 1 4,295 4,295 1 4,295 4,295 Total 57,195 261,345
1 These comprise only 65% of the total installation cost; the remaining 35% is for pipes, valves, frameworks and controls (Noble and Stern, 1995). The total installation cost therefore, amounts to 490,060 Baht.
2 25 Baht - 1 US$
Table G2. Details of operating costs SAVINGS 183,890 Baht/yr DEPRECIATION COSTS 40,838 Baht/yr OPERATING COSTS 72,556 Baht/yr
Power feed pumps (3) - 0.45 kW pressure pump - 2.2 kW air compressor - 0.75 kW costs of power - 1.90 Baht/kW-h working hours- 14 hrs/day backwash frequency - 200 sec/15 min. operating time -560 hrs/year
6,023 Baht/yr
Replacement cartridge filters MF/NF system - 400 Baht/pc. *(set replaced quarterly)
3,200 Baht/yr
Replacement Membranes MF - 15,000 Baht /set NF - 175,000 Baht/set *(set replaced every 3 years)
63,333 Baht/yr
NET ANNUAL SAVINGS 70,496 Baht/yr PAYBACK PERIOD (Installation cost/Net annual savings) 7.0 years INTERNAL RATE of RETURN 13.7 %
Sample calculations for PP, IRR and NPV
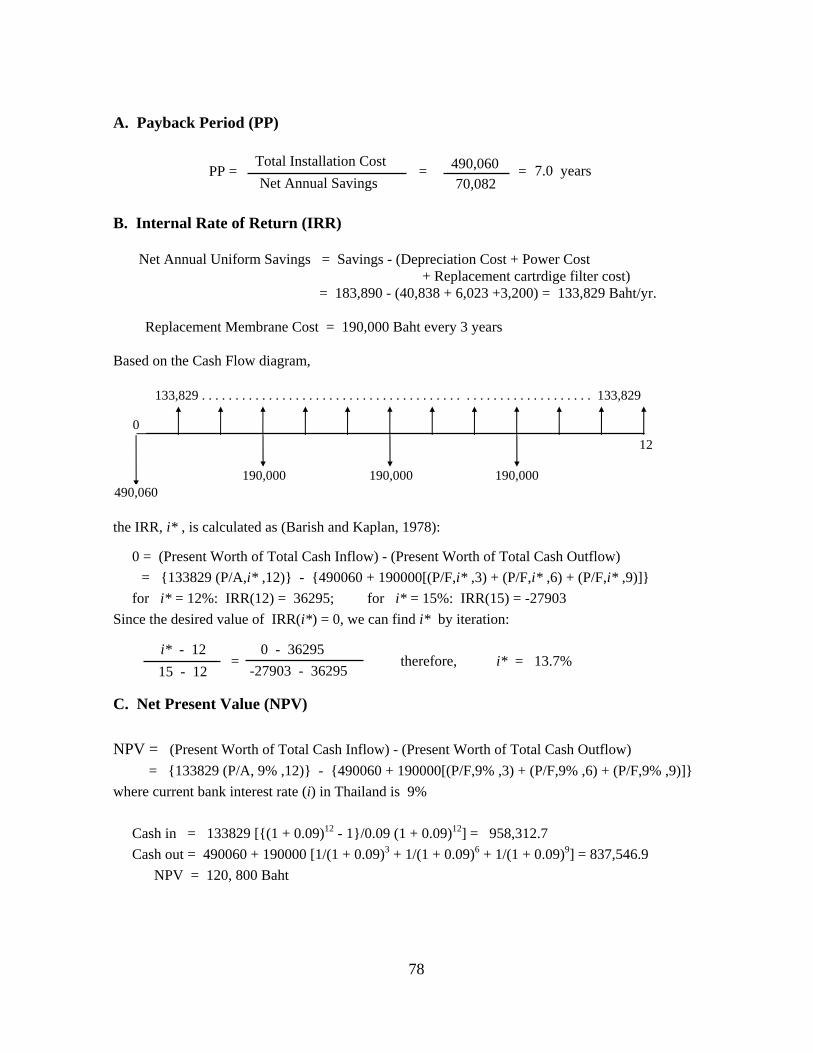
A. Payback Period (PP) PP = = = B. Internal Rate of Return (IRR) Net Annual Uniform Savings = Savings - (Depreciation Cost + Power Cost
+ Replacement cartrdige filter cost) = 183,890 - (40,838 + 6,023 +3,200) = 133,829 Baht/yr.
Replacement Membrane Cost = 190,000 Baht every 3 years
Based on the Cash Flow diagram, the IRR, i* , is calculated as (Barish and Kaplan, 1978):
0 = (Present Worth of Total Cash Inflow) - (Present Worth of Total Cash Outflow)
= {133829 (P/A,i* ,12)} - {490060 + 190000[(P/F,i* ,3) + (P/F,i* ,6) + (P/F,i* ,9)]} for i* = 12%: IRR(12) = 36295; for i* = 15%: IRR(15) = -27903
Since the desired value of IRR(i*) = 0, we can find i* by iteration: , = therefore, i* = 13.7%
Total Installation Cost Net Annual Savings
490,06070,082
490,060
0 12
133,829 . . . . . . . . . . . . . . . . . . . . . . . . . . . . . . . . . . . . . . . . . . . . . . . . . . . . . . . . . . 133,829
190,000 190,000 190,000
0 - 36295 -27903 - 36295
7.0 years
i* - 12 15 - 12
C. Net Present Value (NPV) NPV = (Present Worth of Total Cash Inflow) - (Present Worth of Total Cash Outflow)
= {133829 (P/A, 9% ,12)} - {490060 + 190000[(P/F,9% ,3) + (P/F,9% ,6) + (P/F,9% ,9)]} where current bank interest rate (i) in Thailand is 9%
Cash in = 133829 [{(1 + 0.09)12 - 1}/0.09 (1 + 0.09)12] = 958,312.7 Cash out = 490060 + 190000 [1/(1 + 0.09)3 + 1/(1 + 0.09)6 + 1/(1 + 0.09)9] = 837,546.9 NPV = 120, 800 Baht
78

79

80

APPENDIX H
Table H1. Monthly raw water consumption (m3) in the plant (1995-1996)
SOURCE
MAY
JUN
JUL
AUG
SEP
OCT
NOV
DEC
JAN
FEB
MAR
APR
Total
Average rate
(m3/d) Well-1 0 30,676 31,602 33,094 26,163 27,342 28,024 33,011 50,638 47,291 19,169 15,975 342,985 1,143 Well-2 89,021 70,723 40,316 40,305 37,287 34,495 30,578 30,455 52,255 54,809 27,940 24,350 532,534 1,775 Well-3 73,260 51,874 79,733 79,437 58,953 65,358 71,544 71,100 14,254 12,698 0 0 578,211 1,927 Well-4 23 0 0 0 0 0 0 0 0 11,089 104,034 110,550 225,696 752 TOTAL 162,304 153,273 151,651 152,836 122,403 127,195 130,146 134,566 117,147 125,887 151,143 150,875 1,679,426 5,598
Table H2. Monthly consumption of pre-treated water (m3) in the plant (1995-1996)
MONTH
MAY
JUN
JUL
AUG
SEP
OCT
NOV
DEC
JAN
FEB
MAR
APR
TOTAL
Average rate
(m3/day) Fleet Maintenance 5,067 5,583 4,509 1,754 1,157 1052 1144 992 1307 881 1086 1266 25,798 86 Park used 387 964 1,022 1,498 881 1130 949 911 672 1100 655 801 10,970 37 Training Center 457 456 450 405 733 149 167 1106 899 1,100 706 566 6,749 22 Canteen 705 764 767 727 553 562 105 459 418 394 396 404 6,254 21 Dust-1 --- 97 577 --- --- --- --- 161 --- --- --- --- 835 3 Dust-2 --- --- --- --- --- --- --- --- --- --- 184 179 363 1 Backwash 7,055 6,411 6,208 10,042 8,835 11611 9507 9863 4,375 --- 8,018 --- 81,925 273 Stock washing 4,355 5,087 4,044 4,276 969 1383 1766 1128 2,464 2,297 3,608 445 31,822 106 Line D --- --- --- --- --- 783 310 1286 1,385 1,311 1,326 1,447 7,848 26 Others 49,665 46,583 53,617 48,364 32,333 30,785 28,086 25,639 25,879 37,827 38,659 45,407 462,844 1,543 TOTAL 67,691 65,945 71,194 67,066 45,461 47,455 42,034 41,545 36,014 43,154 53,312 49,068 62,560 2,092
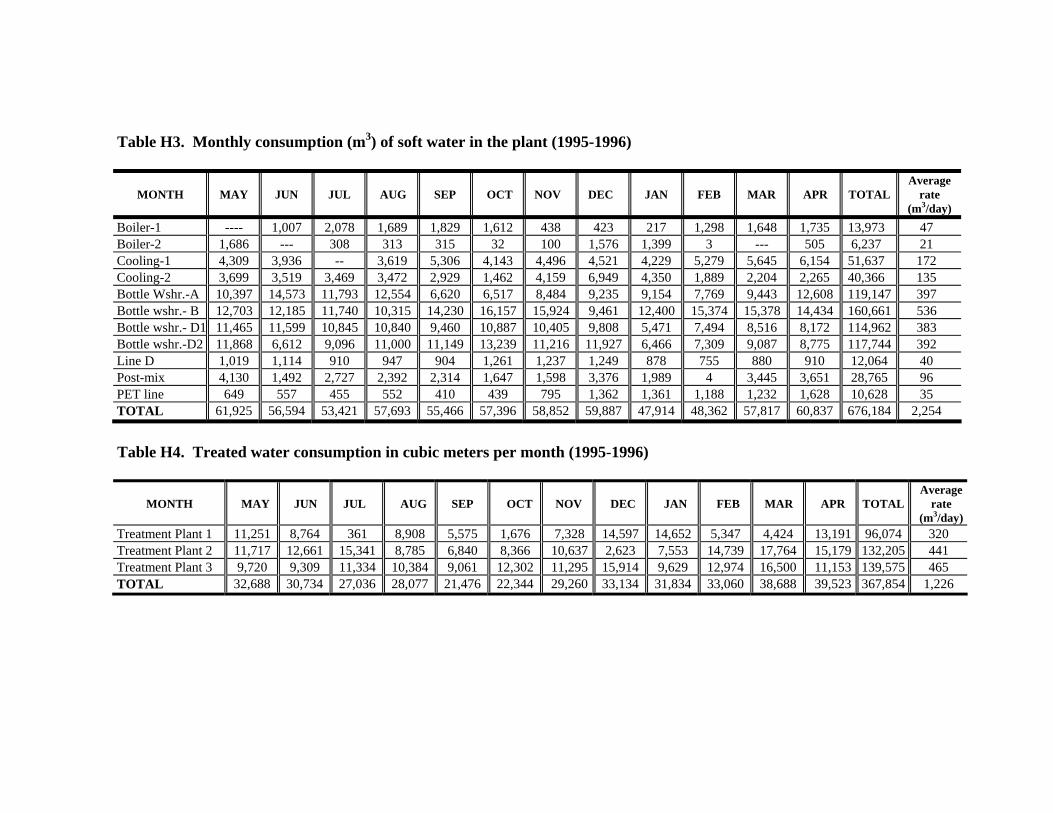
Table H3. Monthly consumption (m3) of soft water in the plant (1995-1996)
MONTH
MAY
JUN
JUL
AUG
SEP
OCT
NOV
DEC
JAN
FEB
MAR
APR
TOTAL
Average rate
(m3/day) Boiler-1 ---- 1,007 2,078 1,689 1,829 1,612 438 423 217 1,298 1,648 1,735 13,973 47 Boiler-2 1,686 --- 308 313 315 32 100 1,576 1,399 3 --- 505 6,237 21 Cooling-1 4,309 3,936 -- 3,619 5,306 4,143 4,496 4,521 4,229 5,279 5,645 6,154 51,637 172 Cooling-2 3,699 3,519 3,469 3,472 2,929 1,462 4,159 6,949 4,350 1,889 2,204 2,265 40,366 135 Bottle Wshr.-A 10,397 14,573 11,793 12,554 6,620 6,517 8,484 9,235 9,154 7,769 9,443 12,608 119,147 397 Bottle wshr.- B 12,703 12,185 11,740 10,315 14,230 16,157 15,924 9,461 12,400 15,374 15,378 14,434 160,661 536 Bottle wshr.- D1 11,465 11,599 10,845 10,840 9,460 10,887 10,405 9,808 5,471 7,494 8,516 8,172 114,962 383 Bottle wshr.-D2 11,868 6,612 9,096 11,000 11,149 13,239 11,216 11,927 6,466 7,309 9,087 8,775 117,744 392 Line D 1,019 1,114 910 947 904 1,261 1,237 1,249 878 755 880 910 12,064 40 Post-mix 4,130 1,492 2,727 2,392 2,314 1,647 1,598 3,376 1,989 4 3,445 3,651 28,765 96 PET line 649 557 455 552 410 439 795 1,362 1,361 1,188 1,232 1,628 10,628 35 TOTAL 61,925 56,594 53,421 57,693 55,466 57,396 58,852 59,887 47,914 48,362 57,817 60,837 676,184 2,254
Table H4. Treated water consumption in cubic meters per month (1995-1996)
MONTH
MAY
JUN
JUL
AUG
SEP
OCT
NOV
DEC
JAN
FEB
MAR
APR
TOTAL
Averagerate
(m3/day)Treatment Plant 1 11,251 8,764 361 8,908 5,575 1,676 7,328 14,597 14,652 5,347 4,424 13,191 96,074 320 Treatment Plant 2 11,717 12,661 15,341 8,785 6,840 8,366 10,637 2,623 7,553 14,739 17,764 15,179 132,205 441 Treatment Plant 3 9,720 9,309 11,334 10,384 9,061 12,302 11,295 15,914 9,629 12,974 16,500 11,153 139,575 465 TOTAL 32,688 30,734 27,036 28,077 21,476 22,344 29,260 33,134 31,834 33,060 38,688 39,523 367,854 1,226
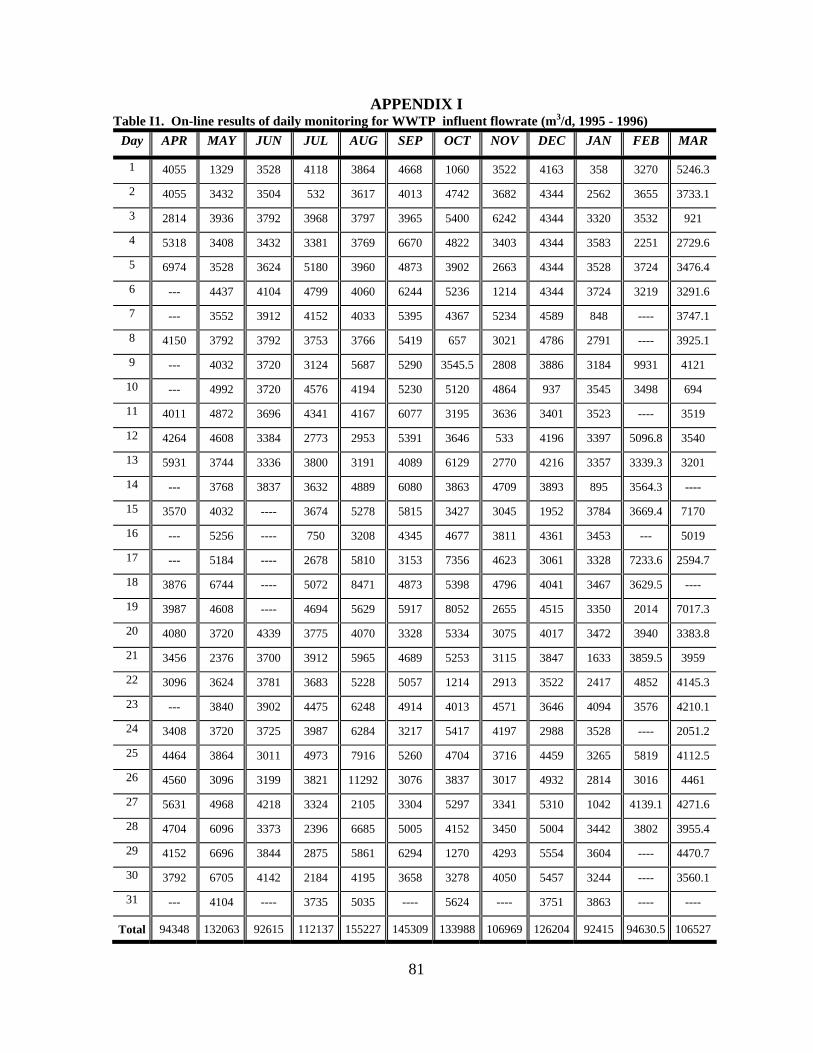
81
APPENDIX I Table I1. On-line results of daily monitoring for WWTP influent flowrate (m3/d, 1995 - 1996)
Day APR MAY JUN JUL AUG SEP OCT NOV DEC JAN FEB MAR
1 4055 1329 3528 4118 3864 4668 1060 3522 4163 358 3270 5246.3
2 4055 3432 3504 532 3617 4013 4742 3682 4344 2562 3655 3733.1
3 2814 3936 3792 3968 3797 3965 5400 6242 4344 3320 3532 921
4 5318 3408 3432 3381 3769 6670 4822 3403 4344 3583 2251 2729.6
5 6974 3528 3624 5180 3960 4873 3902 2663 4344 3528 3724 3476.4
6 --- 4437 4104 4799 4060 6244 5236 1214 4344 3724 3219 3291.6
7 --- 3552 3912 4152 4033 5395 4367 5234 4589 848 ---- 3747.1
8 4150 3792 3792 3753 3766 5419 657 3021 4786 2791 ---- 3925.1
9 --- 4032 3720 3124 5687 5290 3545.5 2808 3886 3184 9931 4121
10 --- 4992 3720 4576 4194 5230 5120 4864 937 3545 3498 694
11 4011 4872 3696 4341 4167 6077 3195 3636 3401 3523 ---- 3519
12 4264 4608 3384 2773 2953 5391 3646 533 4196 3397 5096.8 3540
13 5931 3744 3336 3800 3191 4089 6129 2770 4216 3357 3339.3 3201
14 --- 3768 3837 3632 4889 6080 3863 4709 3893 895 3564.3 ----
15 3570 4032 ---- 3674 5278 5815 3427 3045 1952 3784 3669.4 7170
16 --- 5256 ---- 750 3208 4345 4677 3811 4361 3453 --- 5019
17 --- 5184 ---- 2678 5810 3153 7356 4623 3061 3328 7233.6 2594.7
18 3876 6744 ---- 5072 8471 4873 5398 4796 4041 3467 3629.5 ----
19 3987 4608 ---- 4694 5629 5917 8052 2655 4515 3350 2014 7017.3
20 4080 3720 4339 3775 4070 3328 5334 3075 4017 3472 3940 3383.8
21 3456 2376 3700 3912 5965 4689 5253 3115 3847 1633 3859.5 3959
22 3096 3624 3781 3683 5228 5057 1214 2913 3522 2417 4852 4145.3
23 --- 3840 3902 4475 6248 4914 4013 4571 3646 4094 3576 4210.1
24 3408 3720 3725 3987 6284 3217 5417 4197 2988 3528 ---- 2051.2
25 4464 3864 3011 4973 7916 5260 4704 3716 4459 3265 5819 4112.5
26 4560 3096 3199 3821 11292 3076 3837 3017 4932 2814 3016 4461
27 5631 4968 4218 3324 2105 3304 5297 3341 5310 1042 4139.1 4271.6
28 4704 6096 3373 2396 6685 5005 4152 3450 5004 3442 3802 3955.4
29 4152 6696 3844 2875 5861 6294 1270 4293 5554 3604 ---- 4470.7
30 3792 6705 4142 2184 4195 3658 3278 4050 5457 3244 ---- 3560.1
31 --- 4104 ---- 3735 5035 ---- 5624 ---- 3751 3863 ---- ----
Total 94348 132063 92615 112137 155227 145309 133988 106969 126204 92415 94630.5 106527

82
*- Taken from manual readings of the flowmeters Table I2. Comparison of computer and manual readings for WWTP influent flowrate (m3/d, 1995 - 1996)
FLOWMETER 1
FLOWMETER 2 Manual
Computer
Deviation
MONTH
Final meter
reading
Initial meter
reading
Volume(m3)
Final meter
reading
Initial meter
reading
Volume (m3)
TOTAL (m3/mth)
TOTAL (m3/mth)
(%)
AUG 109201.3 108237.0 964.3 789101.4 653592.7 135,508.7 136,473 155,227 12.1
SEP 110277.4 109201.3 1,076.1 905580.6 789101.4 116,479.2 117,553 145,309 19.1
OCT 113976.5 110277.4 3,699.1 1015973.0 905580.6 110,392.4 114,092 133,988 14.8
NOV 114058.1 113976.5 81.6 1110289.0 1015973.0 95,316.0 94,398 106,969 11.7
DEC 117042.2 114058.1 2,984.1 1202162.0 1110289.0 91,873.0 94,857 126,204 24.8
JAN 119671.2 117042.2 2,629 1299077.0 1202162.0 96,915.0 99,544 92,415 -7.7
FEB 142975.7 119671.2 23,304.5 1371003.0 1299677.0 71,326.0 94,630.5 --- ---
MAR 201230.6 142975.7 58,254.9 1424037.0 1375765.0 48,272.0 106,526.9 --- ---

APPENDIX J
Microfiltration Polishing Unit
2500 2500 6290
2300 5800
Process Air In CIP OUTLET
Backwash #2
Filtrate ExhaustBackwash #1
CIP OUT
2050
750 REAR
Feed Backwash FeedPermeate
Control Air In
Permeate
Figure J. MEMCOR 60M10C
83

84
APPENDIX K
Table K1. Installation and operating costs for MF/RO recovery system for one bottle washer unit INSTALLATION COST1 4,200,000 Baht2
Microfiltration unit Capacity - 10-12 m3/h Reverse Osmosis unit Capacity - 10 m3/h
2,400,000 Baht
1,800,000 Baht
DEPRECIATION COST3 350,000 Baht/yr Useful life - 12 yrs Salvage value - nil
SAVINGS 2,154,000 Baht/yr a. Soft water cost - 15 Baht/m3
Volume of recovered water - 237 m3/d Operating days - 300 d/yr
1,066,500 Baht/yr
b. Volume of caustic soda recovered - 4.85 m3/d NaOH content - 35 kg/ m3
Equivalent amount of 32% caustic solution - 530.5 kg Price of 32% caustic solution - 4.60 Baht/kg
732,000 Baht/yr
c. Wastewater treament cost - 5 Baht/ m3 355,500 Baht/yr OPERATING COSTS 482,000 Baht/yr
a. Power 342,000 Baht/yr MF power requirement- 5 kW - 68,400 Baht/yr RO power requirement - 20 kW - 273,600 Baht/yr Costs of power - 1.90 Baht/kW-h Working hours- 24 hrs/day Operating days -300 days /year
b. Membrane replacement cost 4 (10% of installation cost)
140,000 Baht/yr
NET ANNUAL SAVINGS 1,322,000 Baht/yr NET PRESENT VALUE 5,500,000 Baht PAYBACK PERIOD (Installation cost/Net annual savings) 3.2 years
INTERNAL RATE of RETURN 31.3 % 1 Installation cost inclusive of piping, framework and controls 2 25 Baht = 1 US$ 3 Using straight-line basis on 12 yr useful life 4 Membrane replaceable every three years
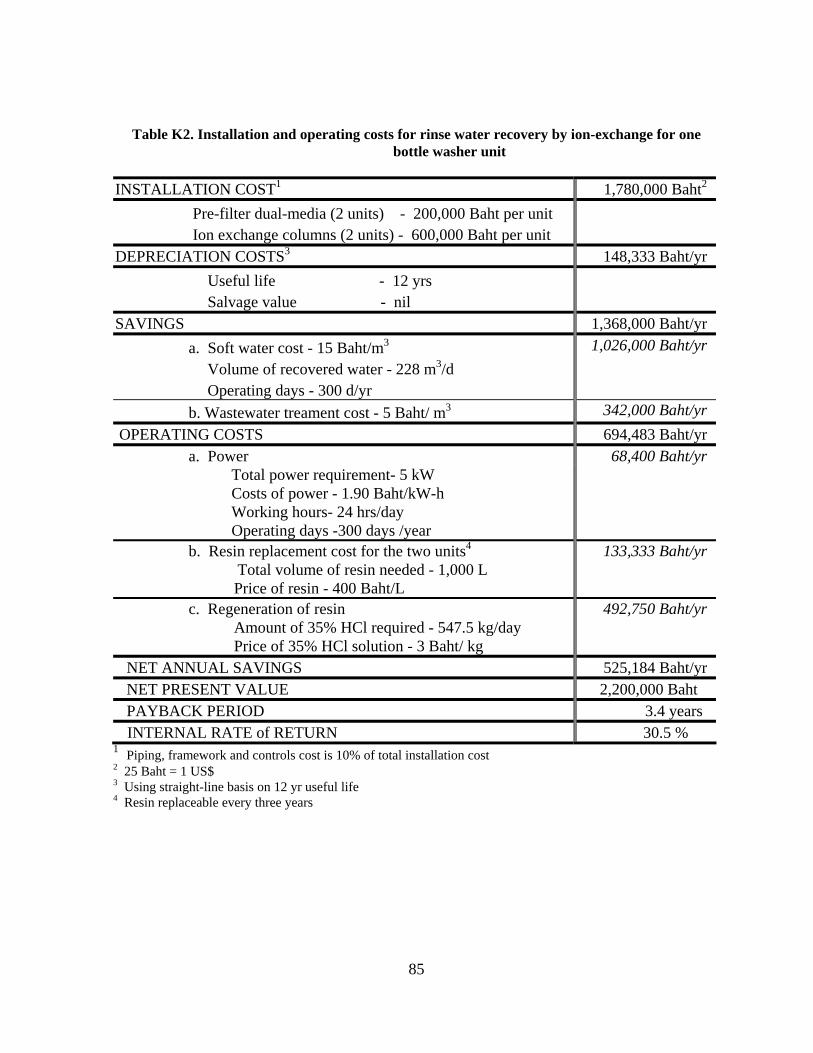
85
Table K2. Installation and operating costs for rinse water recovery by ion-exchange for one bottle washer unit
INSTALLATION COST1 1,780,000 Baht2
Pre-filter dual-media (2 units) - 200,000 Baht per unit Ion exchange columns (2 units) - 600,000 Baht per unit
DEPRECIATION COSTS3 148,333 Baht/yr Useful life - 12 yrs Salvage value - nil
SAVINGS 1,368,000 Baht/yr a. Soft water cost - 15 Baht/m3
Volume of recovered water - 228 m3/d Operating days - 300 d/yr
1,026,000 Baht/yr
b. Wastewater treament cost - 5 Baht/ m3 342,000 Baht/yr OPERATING COSTS 694,483 Baht/yr
a. Power 68,400 Baht/yr Total power requirement- 5 kW Costs of power - 1.90 Baht/kW-h Working hours- 24 hrs/day Operating days -300 days /year
b. Resin replacement cost for the two units4
Total volume of resin needed - 1,000 L Price of resin - 400 Baht/L
133,333 Baht/yr
c. Regeneration of resin Amount of 35% HCl required - 547.5 kg/day Price of 35% HCl solution - 3 Baht/ kg
492,750 Baht/yr
NET ANNUAL SAVINGS 525,184 Baht/yr NET PRESENT VALUE 2,200,000 Baht PAYBACK PERIOD 3.4 years
INTERNAL RATE of RETURN 30.5 % 1 Piping, framework and controls cost is 10% of total installation cost 2 25 Baht = 1 US$ 3 Using straight-line basis on 12 yr useful life 4 Resin replaceable every three years