caustic & chlorine outlook in russia /eastern europe · 2019-11-22 · caustic & chlorine...
TRANSCRIPT

Caustic & Chlorine Outlook in Russia /Eastern Europe
Sergey Yaremenko,MRC (Market Report Company)
4 th Russia / CEE ChlorVinyls3-4 June 2008, Kiev, Radisson SAS Hotel

Market Report Company
We cooperate with 50 biggest worldwide chemical and
petrochemical companies from TOP-100
2

Caustic & Chlorine Outlook in Russia /Eastern Europe
Sergey Yaremenko,MRC (Market Report Company)
4 th Russia / CEE ChlorVinyls3-4 June 2008, Kiev, Radisson SAS Hotel

Agenda
General figures for CEE & CIS (macroeconomics, PVC, caustic soda)
World Caustic Soda Market
Outlook of Russian production till 2012
4
Biggest Russian consumers of Caustic Soda
Caustic Soda Market in CEE & Russia
Current Russian Caustic Soda Production
Agenda
General figures for CEE & CIS (macroeconomics, PVC, caustic soda)
5
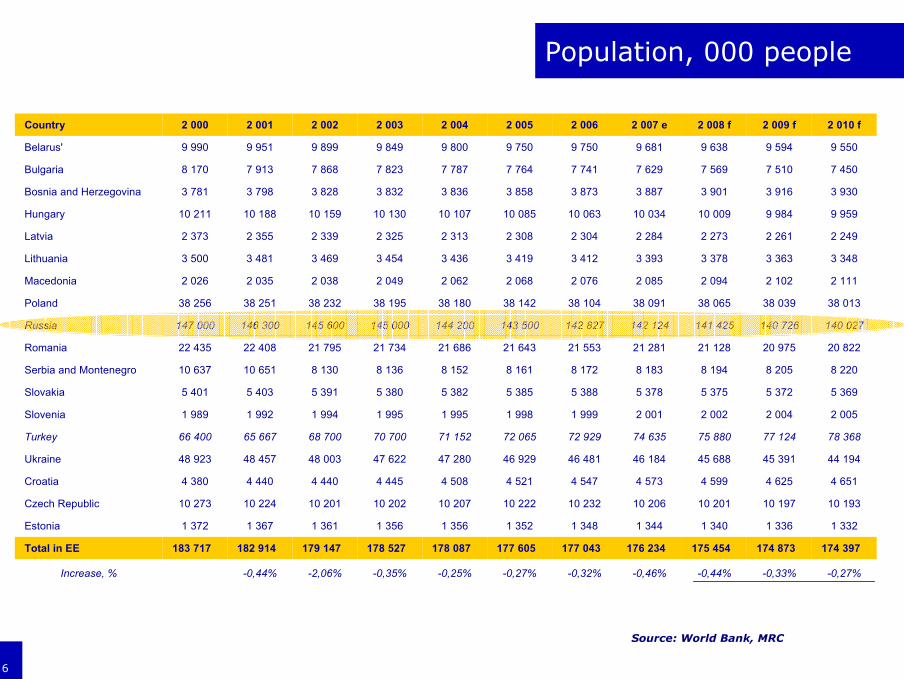
Population, 000 people
6
-0,27%-0,33%-0,44%-0,46%-0,32%-0,27%-0,25%-0,35%-2,06%-0,44%Increase, %
174 397174 873175 454176 234177 043177 605178 087178 527179 147182 914183 717Total in EE
1 3321 3361 3401 3441 3481 3521 3561 3561 3611 3671 372Estonia
10 19310 19710 20110 20610 23210 22210 20710 20210 20110 22410 273Czech Republic
4 6514 6254 5994 5734 5474 5214 5084 4454 4404 4404 380Croatia
44 19445 39145 68846 18446 48146 92947 28047 62248 00348 45748 923Ukraine
78 36877 12475 88074 63572 92972 06571 15270 70068 70065 66766 400Turkey
2 0052 0042 0022 0011 9991 9981 9951 9951 9941 9921 989Slovenia
5 3695 3725 3755 3785 3885 3855 3825 3805 3915 4035 401Slovakia
8 2208 2058 1948 1838 1728 1618 1528 1368 13010 65110 637Serbia and Montenegro
20 82220 97521 12821 28121 55321 64321 68621 73421 79522 40822 435Romania
140 027140 726141 425142 124142 827143 500144 200145 000145 600146 300147 000Russia
38 01338 03938 06538 09138 10438 14238 18038 19538 23238 25138 256Poland
2 1112 1022 0942 0852 0762 0682 0622 0492 0382 0352 026Macedonia
3 3483 3633 3783 3933 4123 4193 4363 4543 4693 4813 500Lithuania
2 2492 2612 2732 2842 3042 3082 3132 3252 3392 3552 373Latvia
9 9599 98410 00910 03410 06310 08510 10710 13010 15910 18810 211Hungary
3 9303 9163 9013 8873 8733 8583 8363 8323 8283 7983 781Bosnia and Herzegovina
7 4507 5107 5697 6297 7417 7647 7877 8237 8687 9138 170Bulgaria
9 5509 5949 6389 6819 7509 7509 8009 8499 8999 9519 990Belarus'
2 010 f2 009 f2 008 f2 007 e2 0062 0052 0042 0032 0022 0012 000Country
Source: World Bank, MRC
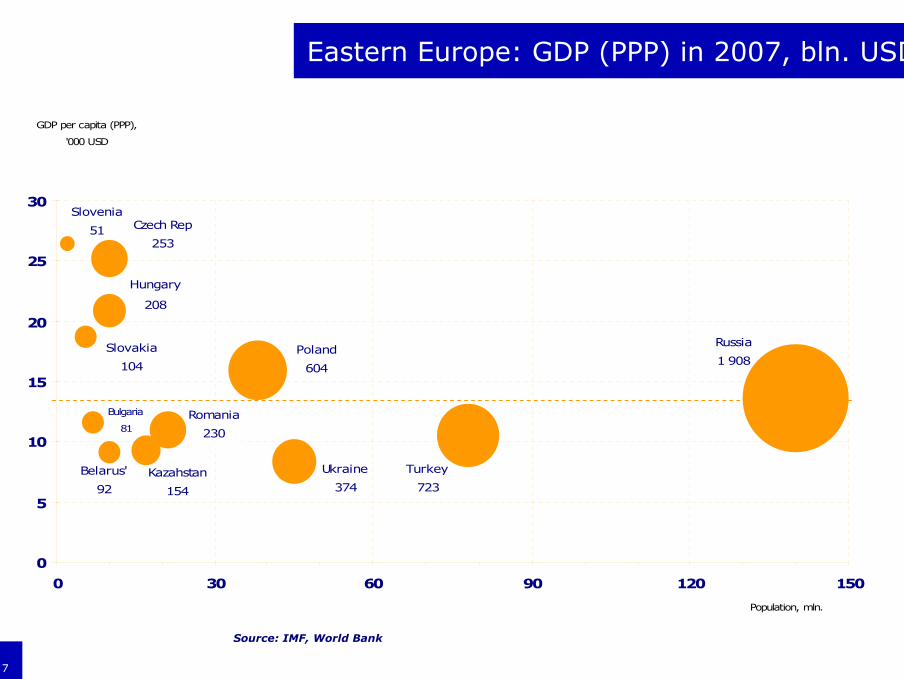
Source: IMF, World Bank
Eastern Europe: GDP (PPP) in 2007, bln. USD
7
Hungary
208
Poland
604
Turkey
723Belarus'
92
Slovenia
51
Romania
230
Bulgaria
81
Czech Rep
253
Russia
1 908
Kazahstan
154
Ukraine
374
Slovakia
104
0
5
10
15
20
25
30
0 30 60 90 120 150
Population, mln.
GDP per capita (PPP),
'000 USD

Kazahstan 21
Poland472
Hungary119
Czech Rep60
Romania89
Belarus'12
Ukraine156Azerbaijan
24
Estonia5
43Slovakia Ex-Yugoslavia
100
Russia996
Turkey894
Lithuania26
0
3
6
9
12
15
0% 5% 10% 15%
Market increase 06-10,%
PVC per capita, kg
WorldWorld
ChinaChina
Western EuropeWestern Europe
Source: Harriman Chemsult, MRC
Forecast: consumption of PVC in 2010, KT
8
Agenda
9
The World Caustic Soda Market

The world market
CMAI: Asia will continue to add a lot of chlor-alkali capacities.
There are no major capacity additions scheduled in the European and American regions until 2008.
The continued acceleration of chlor-alkali capacity expansion in China to support the vinyls industry is expected to result in a caustic surplus in this region.
World Caustic Soda market, mn mt
0
20
40
60
1990 1991 1992 1993 1994 1995 1996 1997 1998 1999 2000 2001 2002 2003 2004 2005 2006 2007 2008
Others NA EE & CIS WE Asia
Source: Harriman Chemsult
10

Major Caustic Soda flows, 1996,2000,2006 (000 mt)
Source: Harriman Chemsult
11

The biggest world importers & exporters
Source: Harriman Chemsult
12

Agenda
Caustic Soda Market in CEE & Russia
13
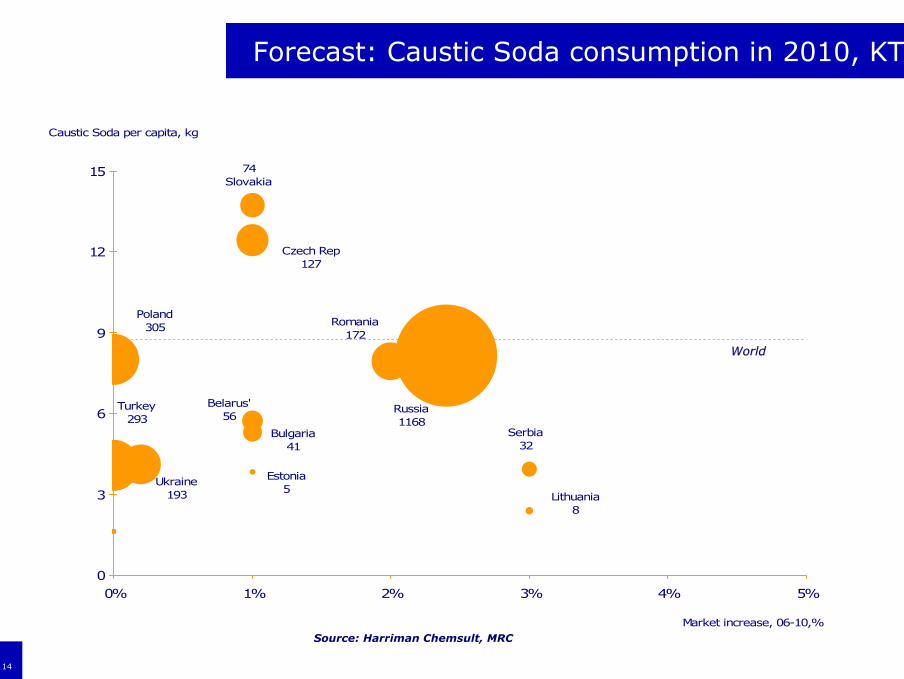
Bulgaria 41
Poland305
Czech Rep127
Romania172
Belarus'56
Ukraine193
Estonia5
74Slovakia
Serbia32
Russia1168
Turkey293
Lithuania8
0
3
6
9
12
15
0% 1% 2% 3% 4% 5%
Market increase, 06-10,%
Caustic Soda per capita, kg
WorldWorld
Source: Harriman Chemsult, MRC
Forecast: Caustic Soda consumption in 2010, KT
14
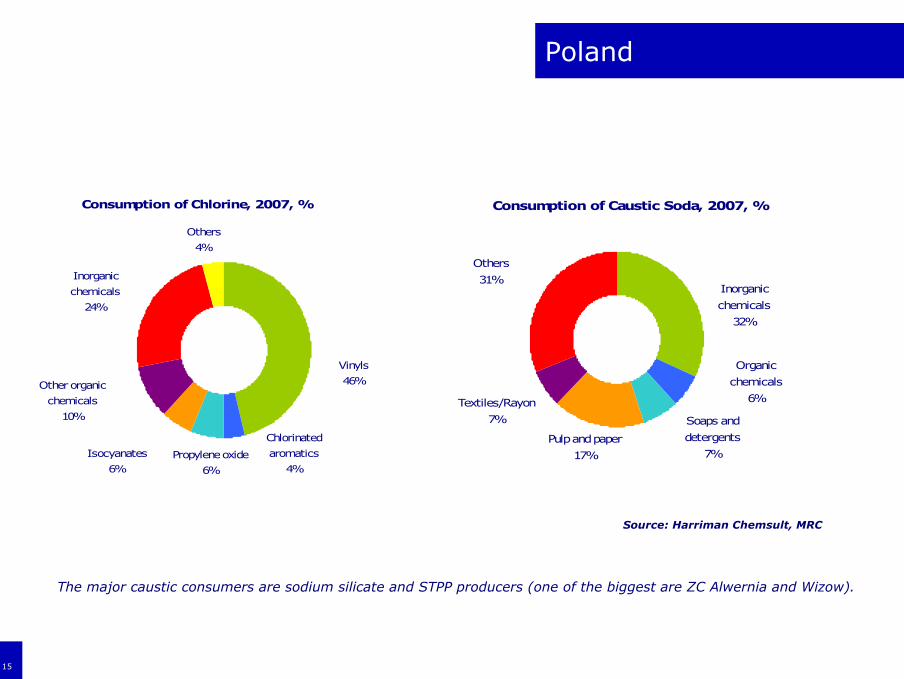
Poland
Consumption of Chlorine, 2007, %
Chlorinated
aromatics
4%
Vinyls
46%
Isocyanates
6%Propylene oxide
6%
Others
4%
Other organic
chemicals
10%
Inorganic
chemicals
24%
Consumption of Caustic Soda, 2007, %
Organic
chemicals
6%
Inorganic
chemicals
32%
Pulp and paper
17%
Soaps and
detergents
7%
Textiles/Rayon
7%
Others
31%
The major caustic consumers are sodium silicate and STPP producers (one of the biggest are ZC Alwernia and Wizow).
Source: Harriman Chemsult, MRC
15
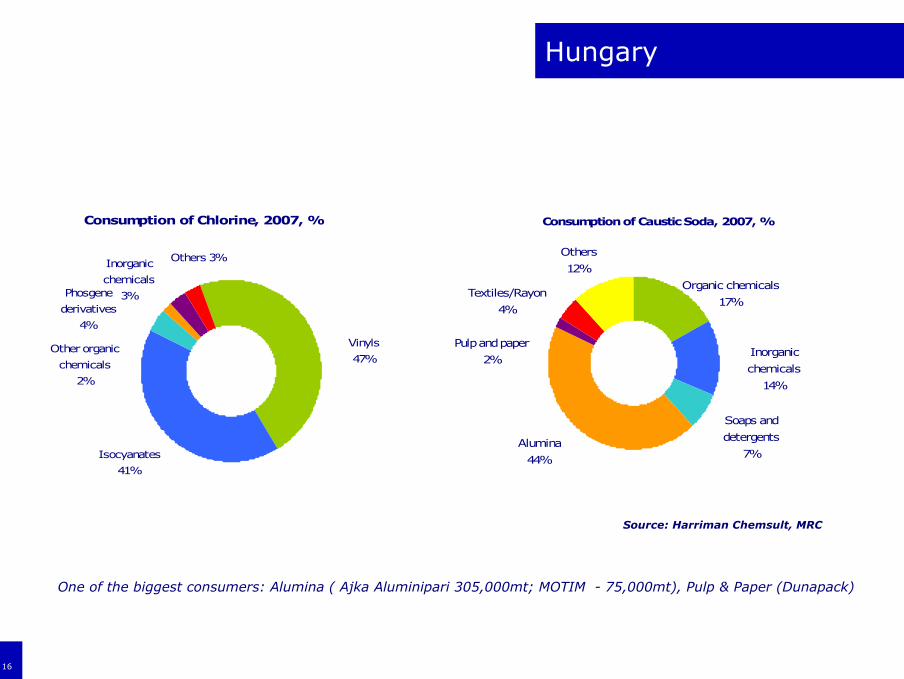
Hungary
Consumption of Chlorine, 2007, %
Isocyanates
41%
Vinyls
47%Other organic
chemicals
2%
Phosgene
derivatives
4%
Inorganic
chemicals
3%
Others 3%
Consumption of Caustic Soda, 2007, %
Inorganic
chemicals
14%
Organic chemicals
17%
Alumina
44%
Soaps and
detergents
7%
Others
12%
Pulp and paper
2%
Textiles/Rayon
4%
One of the biggest consumers: Alumina ( Ajka Aluminipari 305,000mt; MOTIM - 75,000mt), Pulp & Paper (Dunapack)
Source: Harriman Chemsult, MRC
16
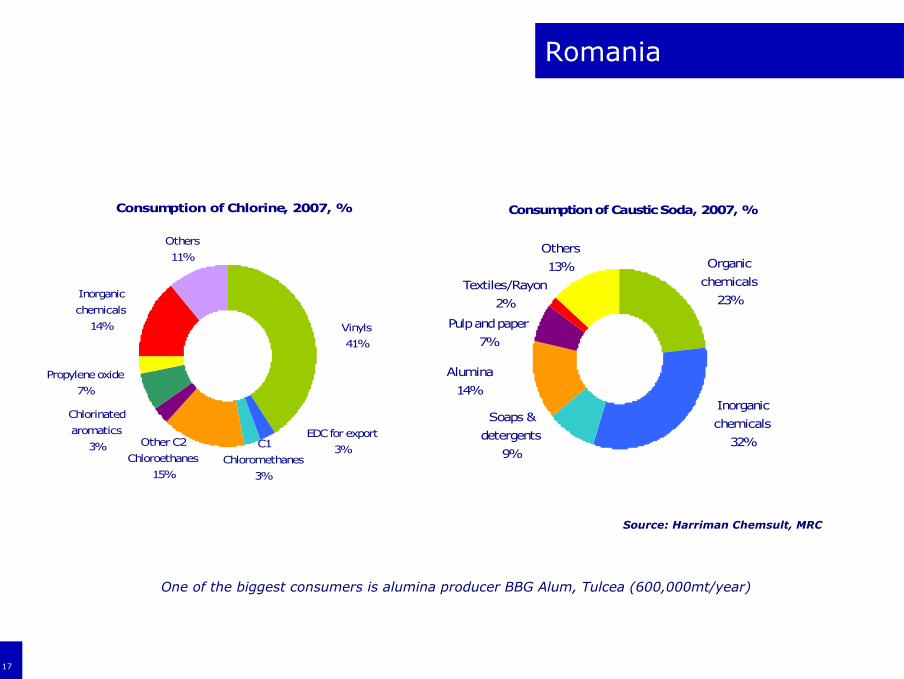
Romania
Consumption of Chlorine, 2007, %
Others
11%
Inorganic
chemicals
14%
EDC for export
3%
Vinyls
41%
Other C2
Chloroethanes
15%
C1
Chloromethanes
3%
Chlorinated
aromatics
3%
Propylene oxide
7%
Consumption of Caustic Soda, 2007, %
Inorganic
chemicals
32%
Organic
chemicals
23%
Alumina
14%
Soaps &
detergents
9%
Others
13%
Pulp and paper
7%
Textiles/Rayon
2%
One of the biggest consumers is alumina producer BBG Alum, Tulcea (600,000mt/year)
Source: Harriman Chemsult, MRC
17
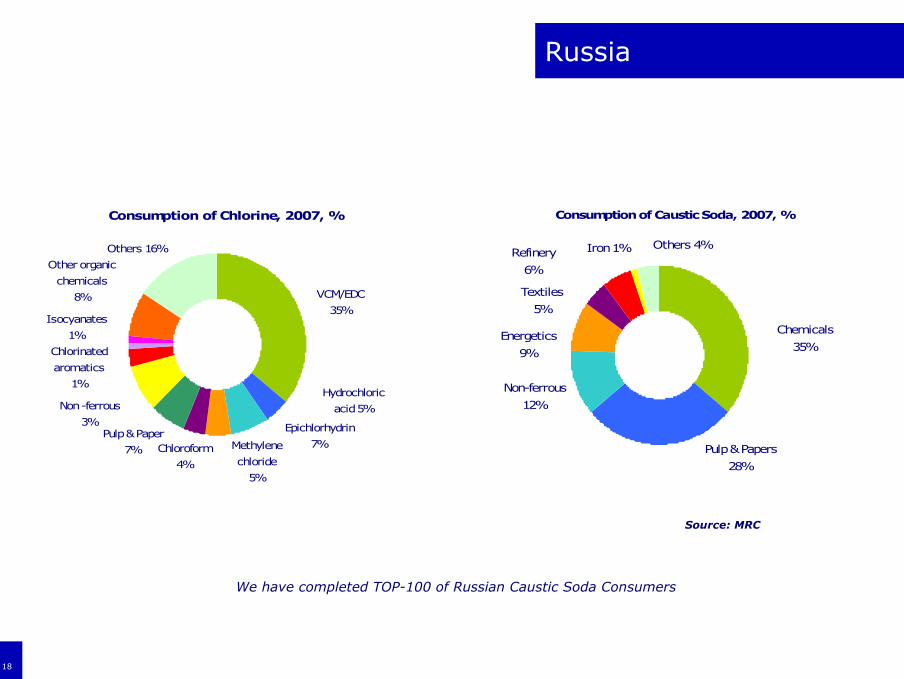
Russia
Consumption of Chlorine, 2007, %
Chlorinated
aromatics
1%
Other organic
chemicals
8%
Others 16%
Isocyanates
1%
Non -ferrous
3%
Hydrochloric
acid 5%
VCM/EDC
35%
Methylene
chloride
5%
Epichlorhydrin
7%Chloroform
4%
Pulp & Paper
7%
Consumption of Caustic Soda, 2007, %
Refinery
6%
Textiles
5%
Iron 1%
Non-ferrous
12%
Energetics
9%
Chemicals
35%
Pulp & Papers
28%
Others 4%
Source: MRC
18
We have completed TOP-100 of Russian Caustic Soda Consumers
Agenda
Biggest Russian consumers of Caustic Soda
19

Top-10 Russian consumers: whole market
47,70%529 002Total
2,30%25 286LCSSayanskchemplastSverdlovsk oblast'non-ferrousBogoslovskiy aluminium plant10
2,70%29 879LCSChemprom, VolgogradSaratov oblast'textilesBalkovskiy plant of fibre materials9
4,00%43 791LCSAzot, NovomoskovskLeningrad oblast'chemicalsFosforit8
4,00%44 510LCSChemprom, KemerovoKemerovo oblast'chemicalsAzot, Kemerovo7
4,00%44 858LCSCaustic, SterlitamakSamara oblast'chemicalsKuybyshevazot6
4,80%53 566LCSCaustic, SterlitamakVolgograd oblast'chemicalsVolzhskiy Orgsintez5
5,00%55 928LCSUsolyechempromKomypulp and paperMondi Business Syktyvkarskiy LPK4
5,10%56 257LCSUsolyechempromArhangelsk oblast'pulp and paperArkhangelsk pulp&paper plant3
6,60%72 594LCSSayanskchemplastSverdlovsk oblast'non-ferrousSiberian-Ural aluminium company2
9,20%102 333LCSIlimchempromIrkutsk oblast'pulp and paperUst-Ulimskiy pulp&paper plant1
Market share, %Volume, MTProductMain SupplierLocationSectorCompany#
20
Source: MRC
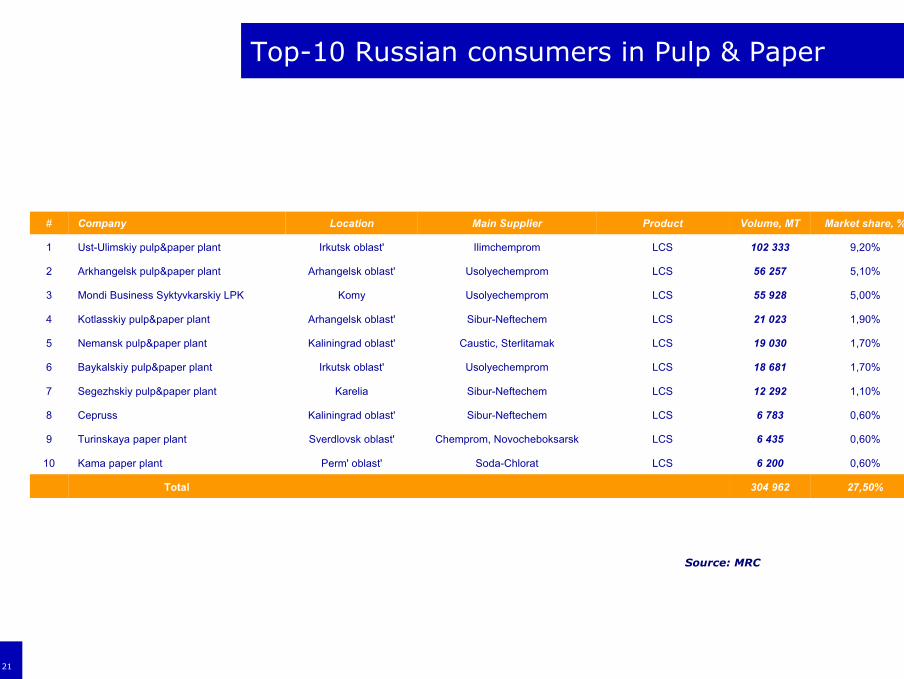
Top-10 Russian consumers in Pulp & Paper
27,50%304 962Total
0,60%6 200LCSSoda-ChloratPerm' oblast'Kama paper plant10
0,60%6 435LCSChemprom, NovocheboksarskSverdlovsk oblast'Turinskaya paper plant9
0,60%6 783LCSSibur-NeftechemKaliningrad oblast'Cepruss8
1,10%12 292LCSSibur-NeftechemKareliaSegezhskiy pulp&paper plant7
1,70%18 681LCSUsolyechempromIrkutsk oblast'Baykalskiy pulp&paper plant 6
1,70%19 030LCSCaustic, SterlitamakKaliningrad oblast'Nemansk pulp&paper plant5
1,90%21 023LCSSibur-NeftechemArhangelsk oblast'Kotlasskiy pulp&paper plant4
5,00%55 928LCSUsolyechempromKomyMondi Business Syktyvkarskiy LPK3
5,10%56 257LCSUsolyechempromArhangelsk oblast'Arkhangelsk pulp&paper plant2
9,20%102 333LCSIlimchempromIrkutsk oblast'Ust-Ulimskiy pulp&paper plant1
Market share, %Volume, MTProductMain SupplierLocationCompany#
21
Source: MRC
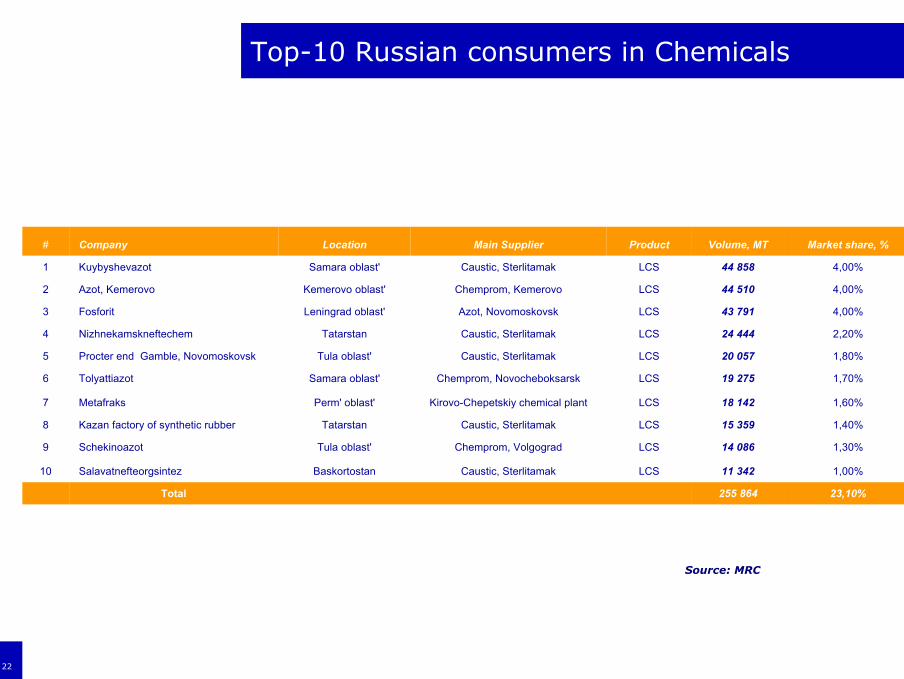
Top-10 Russian consumers in Chemicals
23,10%255 864Total
1,00%11 342LCSCaustic, SterlitamakBaskortostanSalavatnefteorgsintez10
1,30%14 086LCSChemprom, VolgogradTula oblast'Schekinoazot9
1,40%15 359LCSCaustic, SterlitamakTatarstanKazan factory of synthetic rubber8
1,60%18 142LCSKirovo-Chepetskiy chemical plantPerm' oblast'Metafraks7
1,70%19 275LCSChemprom, NovocheboksarskSamara oblast'Tolyattiazot6
1,80%20 057LCSCaustic, SterlitamakTula oblast'Procter end Gamble, Novomoskovsk5
2,20%24 444LCSCaustic, SterlitamakTatarstanNizhnekamskneftechem4
4,00%43 791LCSAzot, NovomoskovskLeningrad oblast'Fosforit3
4,00%44 510LCSChemprom, KemerovoKemerovo oblast'Azot, Kemerovo2
4,00%44 858LCSCaustic, SterlitamakSamara oblast'Kuybyshevazot1
Market share, %Volume, MTProductMain SupplierLocationCompany#
22
Source: MRC

Top-10 Russian consumers in Non-ferrous
12,90%142 285Total
0,20%2 558LCSChemprom, VolgogradKabardino-BalkariaGidrometallurg7
0,50%5 110LCSKirovo-Chepetskiy chemical plantMurmansk oblast'Apatit6
0,60%6 093LCSSayanskchemplastIrkutsk oblast'Rusal Bratsk5
0,70%8 116LCSCaustic, SterlitamakChelyabinsk' oblast'Ufaleynikel'4
2,00%22 528LCSSayanskchemplastSverdlovsk oblast'Sredneuralskiy copper factory3
2,30%25 286LCSSayanskchemplastSverdlovsk oblast'Bogoslovskiy aluminium plant2
6,60%72 594LCSSayanskchemplastSverdlovsk oblast'Siberian-Ural aluminium company1
Market share, %Volume, MTProductMain SupplierLocationCompany#
23
Source: MRC
Agenda
Current Russian Caustic Soda Production
24
Source: MRC
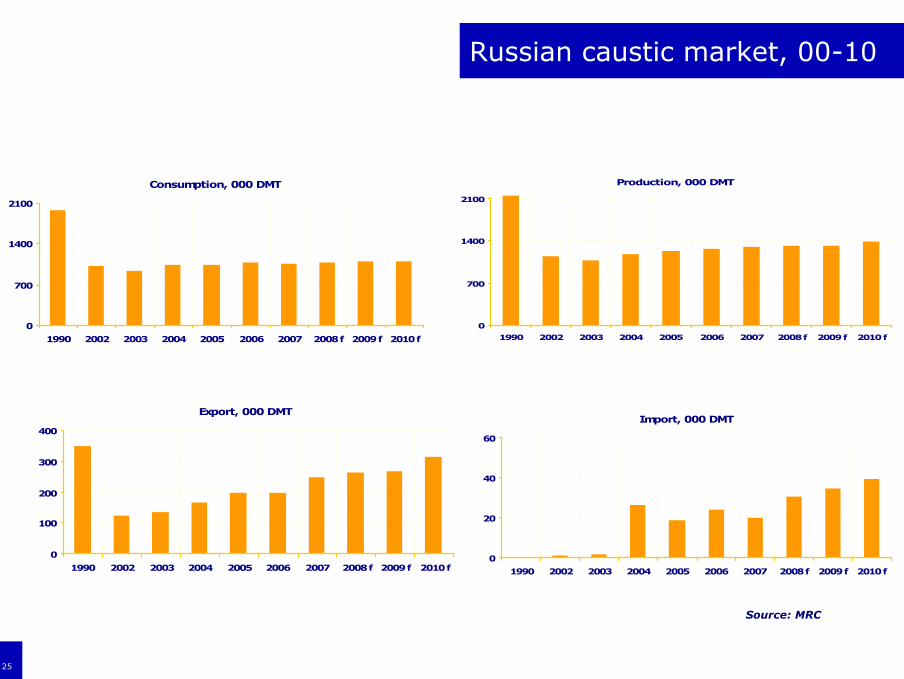
Russian caustic market, 00-10
Consumption, 000 DMT
0
700
1400
2100
1990 2002 2003 2004 2005 2006 2007 2008 f 2009 f 2010 f
Export, 000 DMT
0
100
200
300
400
1990 2002 2003 2004 2005 2006 2007 2008 f 2009 f 2010 f
Production, 000 DMT
0
700
1400
2100
1990 2002 2003 2004 2005 2006 2007 2008 f 2009 f 2010 f
Import, 000 DMT
0
20
40
60
1990 2002 2003 2004 2005 2006 2007 2008 f 2009 f 2010 f
25
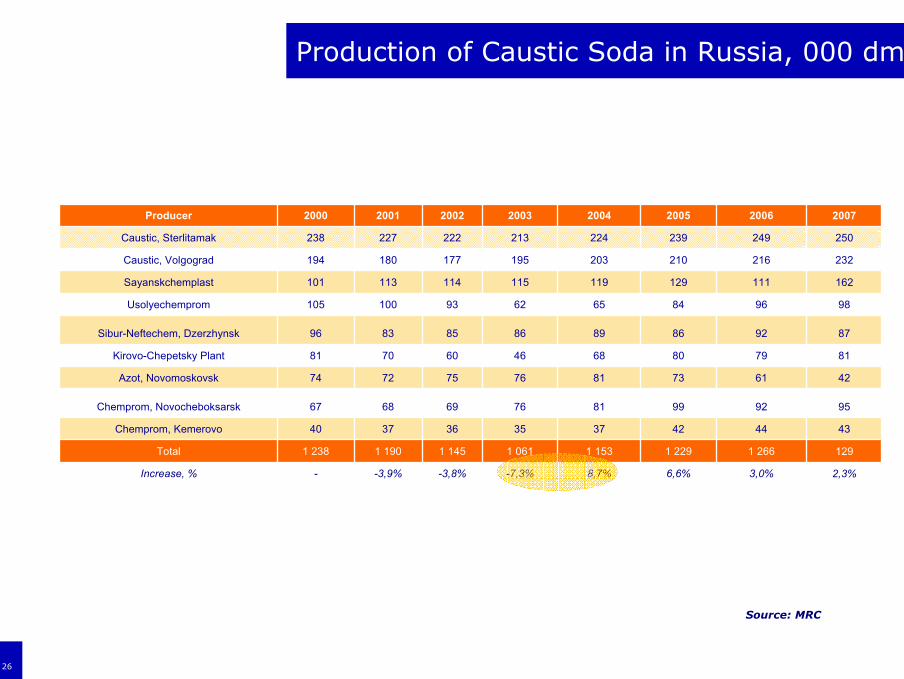
Production of Caustic Soda in Russia, 000 dmt
2,3%3,0%6,6%8,7%-7,3%-3,8%-3,9%-Increase, %
1291 2661 2291 1531 0611 1451 1901 238Total
4344423735363740Chemprom, Kemerovo
9592998176696867Chemprom, Novocheboksarsk
4261738176757274Azot, Novomoskovsk
8179806846607081Kirovo-Chepetsky Plant
8792868986858396Sibur-Neftechem, Dzerzhynsk
989684656293100105Usolyechemprom
162111129119115114113101Sayanskchemplast
232216210203195177180194Caustic, Volgograd
250249239224213222227238Caustic, Sterlitamak
20072006200520042003200220012000Producer
26
Source: MRC
Source: MRC
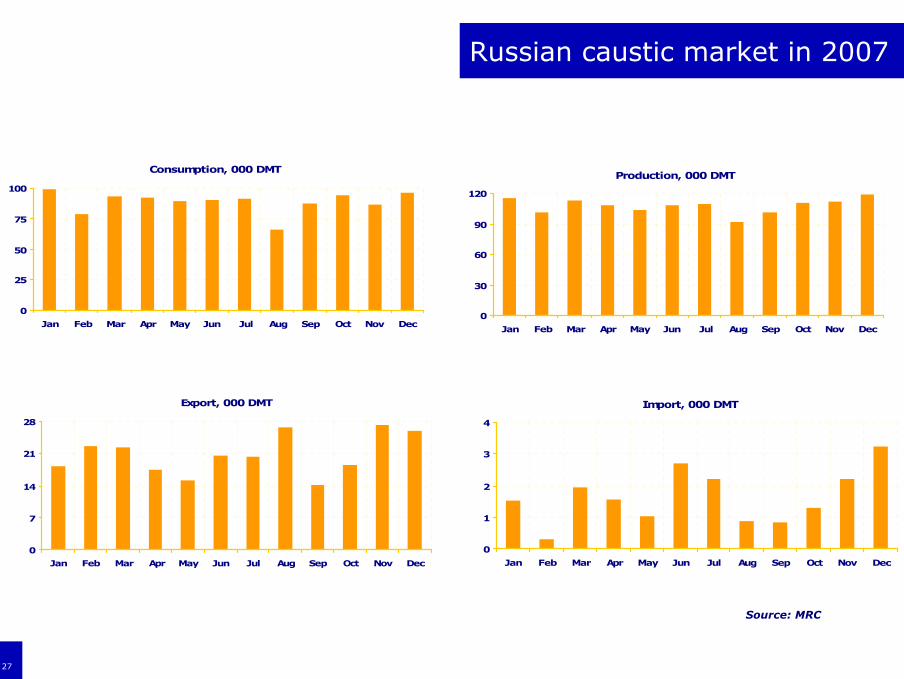
Russian caustic market in 2007
Consumption, 000 DMT
0
25
50
75
100
Jan Feb Mar Apr May Jun Jul Aug Sep Oct Nov Dec
Production, 000 DMT
0
30
60
90
120
Jan Feb Mar Apr May Jun Jul Aug Sep Oct Nov Dec
Export, 000 DMT
0
7
14
21
28
Jan Feb Mar Apr May Jun Jul Aug Sep Oct Nov Dec
Import, 000 DMT
0
1
2
3
4
Jan Feb Mar Apr May Jun Jul Aug Sep Oct Nov Dec
27
Source: MRC
28
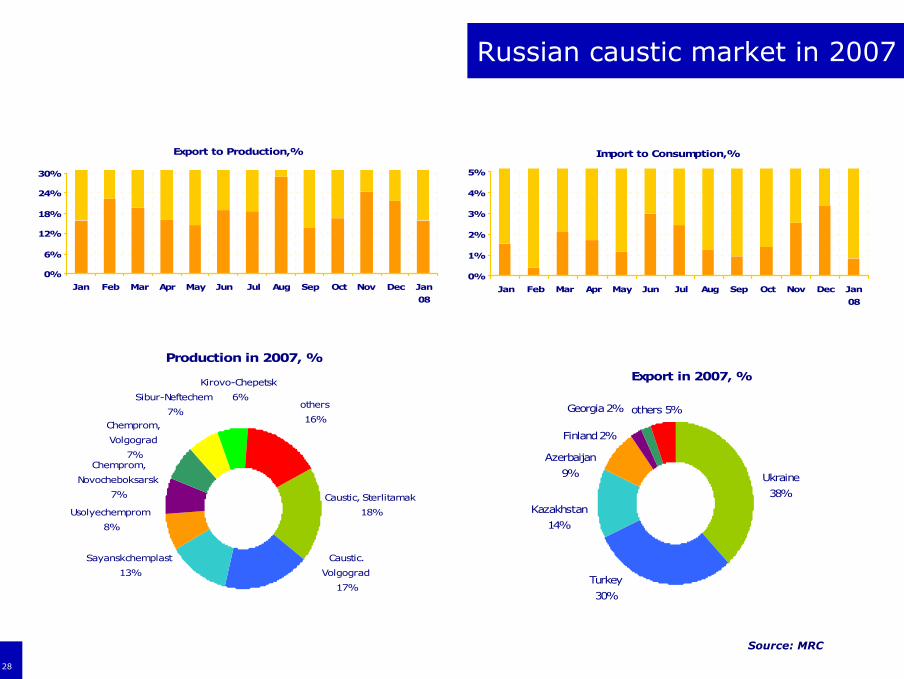
Russian caustic market in 2007
Export to Production,%
0%
6%
12%
18%
24%
30%
Jan Feb Mar Apr May Jun Jul Aug Sep Oct Nov Dec Jan
08
Import to Consumption,%
0%
1%
2%
3%
4%
5%
Jan Feb Mar Apr May Jun Jul Aug Sep Oct Nov Dec Jan
08
Production in 2007, %
others
16%
Kirovo-Chepetsk
6%Sibur-Neftechem
7%Chemprom,
Volgograd
7%
Usolyechemprom
8%
Chemprom,
Novocheboksarsk
7%
Sayanskchemplast
13%
Caustic.
Volgograd
17%
Caustic, Sterlitamak
18%
Export in 2007, %
Georgia 2% others 5%
Finland 2%
Azerbaijan
9% Ukraine
38%
Turkey
30%
Kazakhstan
14%
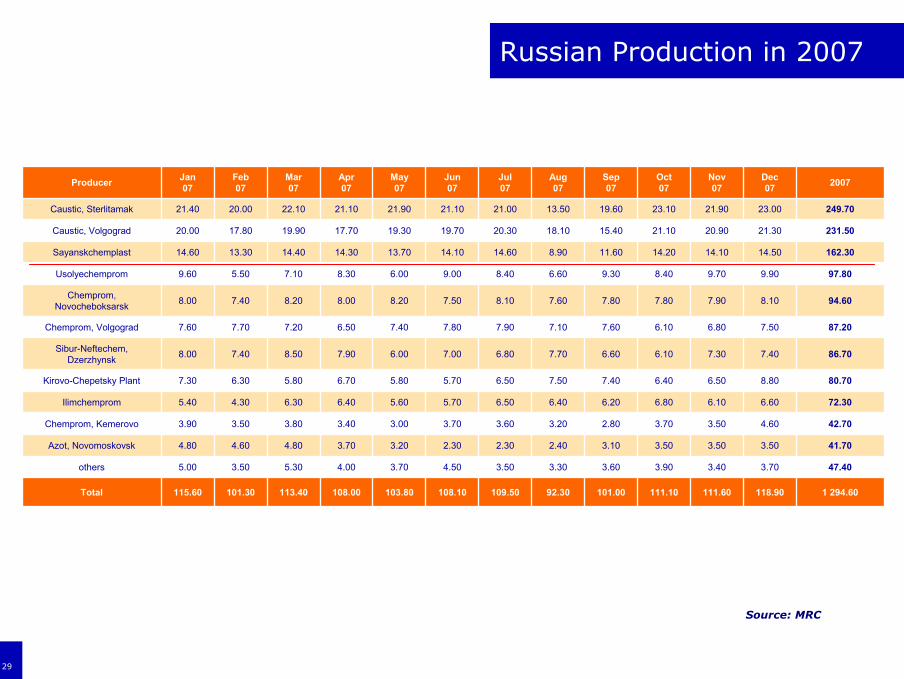
1 294.60118.90111.60111.10101.0092.30109.50108.10103.80108.00113.40101.30115.60Total
47.403.703.403.903.603.303.504.503.704.005.303.505.00others
41.703.503.503.503.102.402.302.303.203.704.804.604.80Azot, Novomoskovsk
42.704.603.503.702.803.203.603.703.003.403.803.503.90Chemprom, Kemerovo
72.306.606.106.806.206.406.505.705.606.406.304.305.40Ilimchemprom
80.708.806.506.407.407.506.505.705.806.705.806.307.30Kirovo-Chepetsky Plant
86.707.407.306.106.607.706.807.006.007.908.507.408.00Sibur-Neftechem, Dzerzhynsk
87.207.506.806.107.607.107.907.807.406.507.207.707.60Chemprom, Volgograd
94.608.107.907.807.807.608.107.508.208.008.207.408.00Chemprom, Novocheboksarsk
97.809.909.708.409.306.608.409.006.008.307.105.509.60Usolyechemprom
162.3014.5014.1014.2011.608.9014.6014.1013.7014.3014.4013.3014.60Sayanskchemplast
231.5021.3020.9021.1015.4018.1020.3019.7019.3017.7019.9017.8020.00Caustic, Volgograd
249.7023.0021.9023.1019.6013.5021.0021.1021.9021.1022.1020.0021.40Caustic, Sterlitamak
2007Dec07
Nov07
Oct07
Sep07
Aug07
Jul07
Jun07
May07
Apr07
Mar07
Feb07
Jan07Producer
Russian Production in 2007
29
Source: MRC

Source: MRC
PVC-S, KT
0
200
400
600
2000 2001 2002 2003 2004 2005 2006 2007 2008 2009 2010
Production Export Import
PVC-E, KT
0
40
80
120
2000 2001 2002 2003 2004 2005 2006 2007 2008 2009 2010
Russian PVC resin market: time of Import
30
+25%
+80%

Source: MRC
Production, KT
0
15
30
45
60
Jan Feb Mar Apr May Jun Jul Aug Sep Oct Nov Dec Jan
08
Import, KT
0
10
20
30
40
Jan Feb Mar Apr May Jun Jul Aug Sep Oct Nov Dec Jan
08
Import to Apparent Consumption,%
0%
15%
30%
45%
60%
Jan Feb Mar Apr May Jun Jul Aug Sep Oct Nov Dec Jan
08
Russian PVC resin market in 2007
Apparent Consumption, KT
0
20
40
60
80
Jan Feb Mar Apr May Jun Jul Aug Sep Oct Nov Dec Jan
08
31
!
Source: MRC
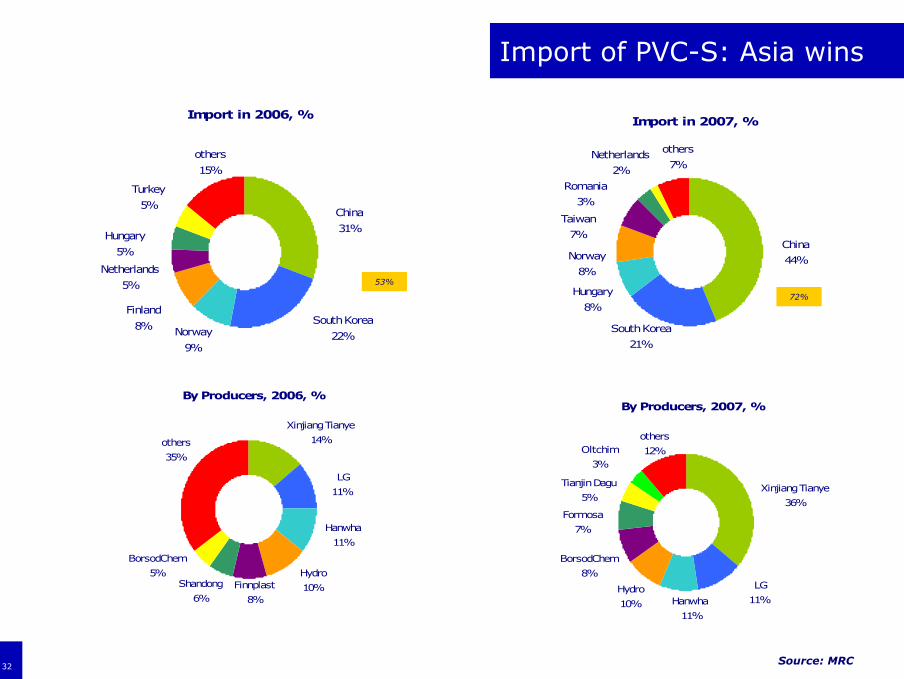
Import in 2007, %
others
7%
South Korea
21%
China
44%Norway
8%
Hungary
8%
Netherlands
2%
Taiwan
7%
Romania
3%
Import in 2006, %
others
15%
South Korea
22%
China
31%
Finland
8% Norway
9%
Turkey
5%
Netherlands
5%
Hungary
5%
By Producers, 2007, %
others
12%Oltchim
3%
LG
11%
Xinjiang Tianye
36%
Hydro
10% Hanwha
11%
Tianjin Dagu
5%
BorsodChem
8%
Formosa
7%
By Producers, 2006, %
others
35%
LG
11%
Xinjiang Tianye
14%
Hydro
10%
Hanwha
11%
BorsodChem
5%Finnplast
8%
Shandong
6%
32
Import of PVC-S: Asia wins
53%
72%
Source: MRC
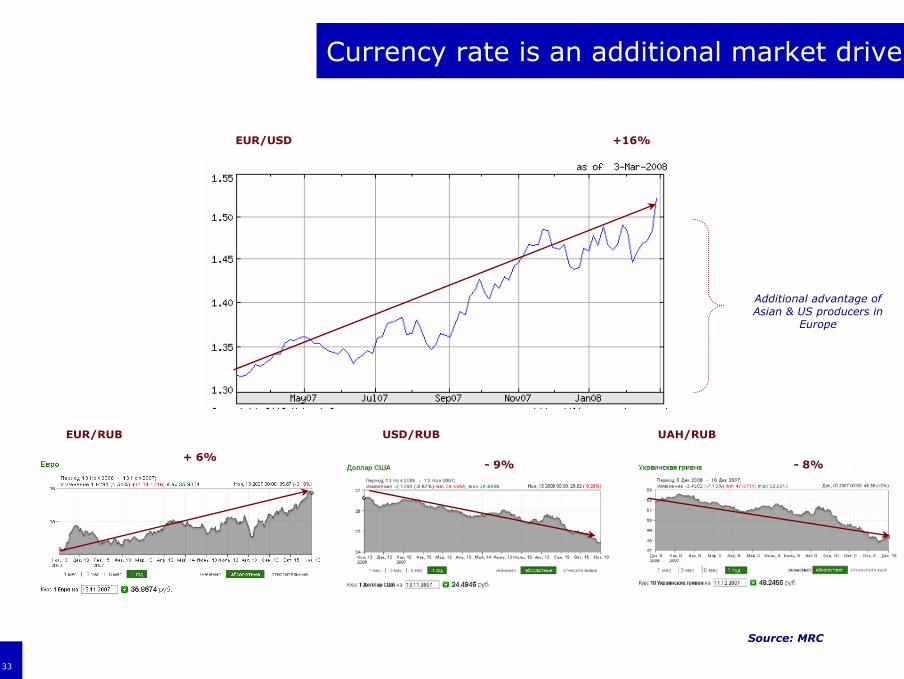
- 8%
EUR/RUB USD/RUB UAH/RUB
EUR/USD
- 9%+ 6%
Currency rate is an additional market driver
33
+16%
Additional advantage of Asian & US producers in
Europe
Agenda
24
Outlook of Russian production till 2012
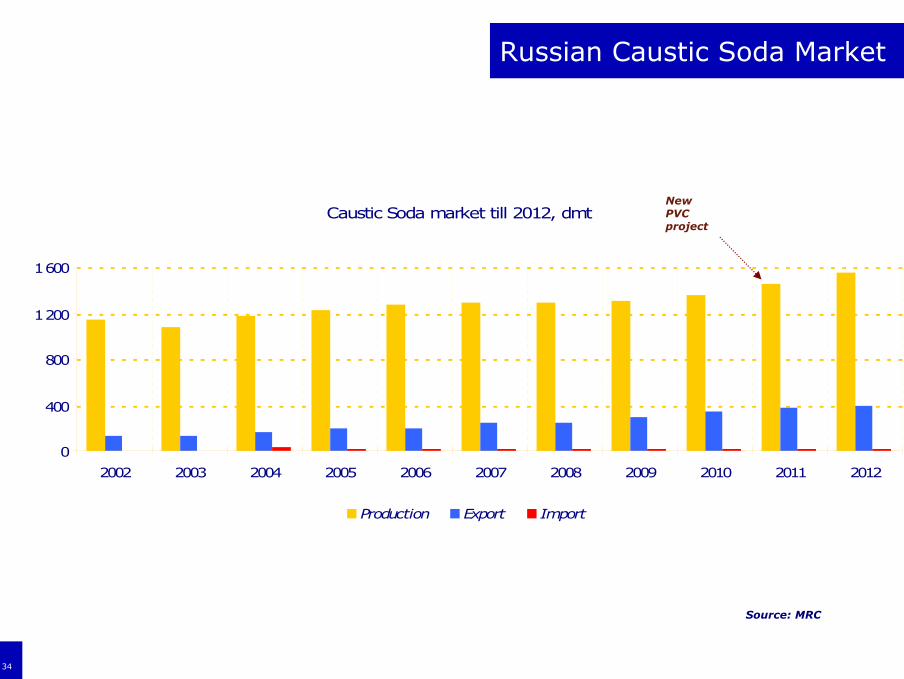
Russian Caustic Soda Market
Caustic Soda market till 2012, dmt
0
400
800
1 200
1 600
2002 2003 2004 2005 2006 2007 2008 2009 2010 2011 2012
Production Export Import
34
Source: MRC
New PVC project
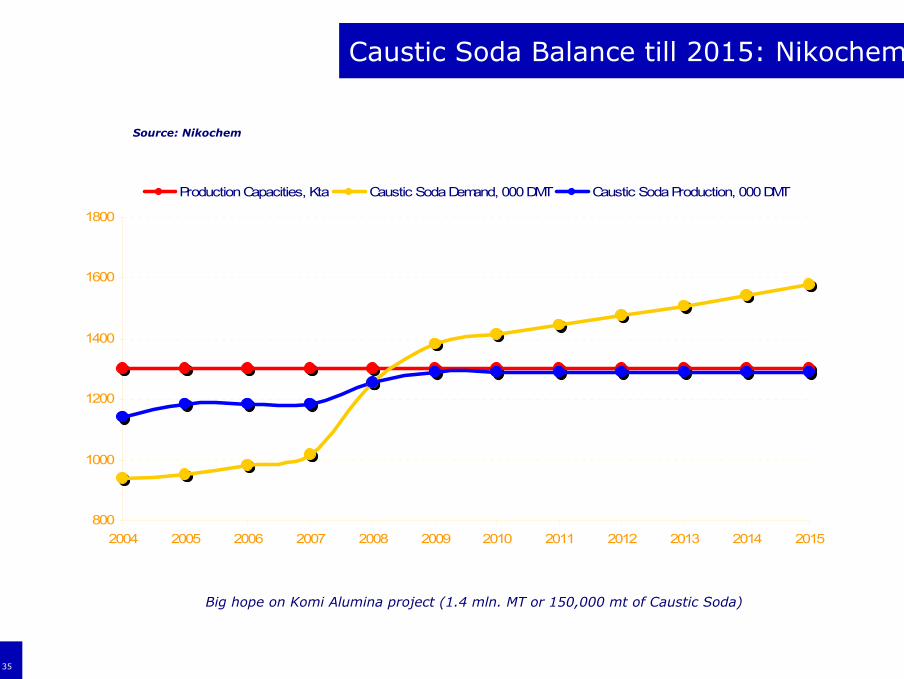
Source: Nikochem
35
Caustic Soda Balance till 2015: Nikochem
800
1000
1200
1400
1600
1800
2004 2005 2006 2007 2008 2009 2010 2011 2012 2013 2014 2015
Production Capacities, Kta Caustic Soda Demand, 000 DMT Caustic Soda Production, 000 DMT
Big hope on Komi Alumina project (1.4 mln. MT or 150,000 mt of Caustic Soda)
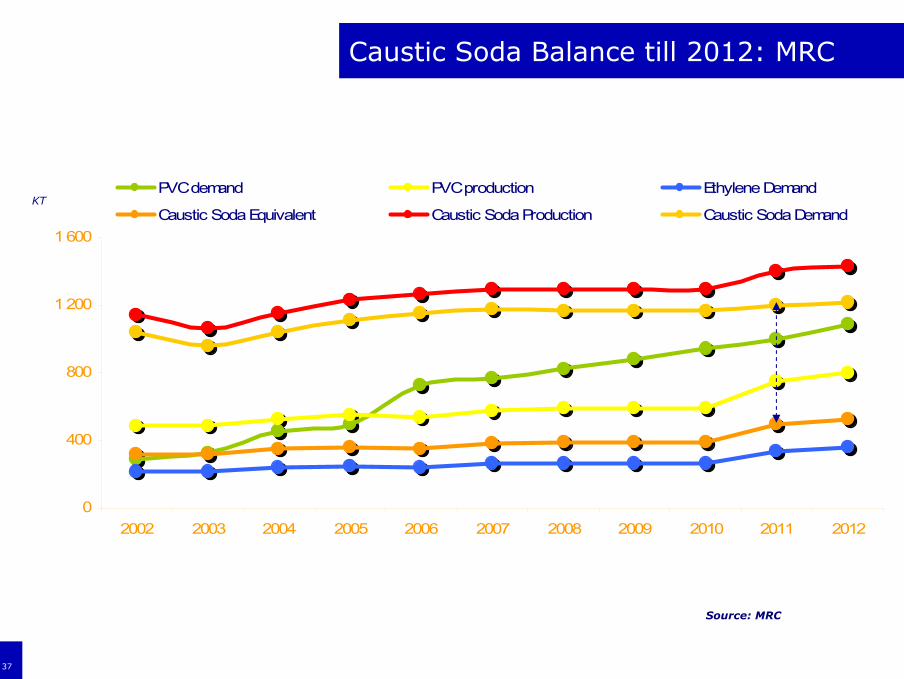
Source: MRC
37
0
400
800
1 200
1 600
2002 2003 2004 2005 2006 2007 2008 2009 2010 2011 2012
PVC demand PVC production Ethylene Demand
Caustic Soda Equivalent Caustic Soda Production Caustic Soda Demand
Caustic Soda Balance till 2012: MRC
KT

Caustic and ethylene Caustic and ethylene –– key limitations key limitations for Russian PVC producersfor Russian PVC producersChlorine Caustic
Ethylene
EDC VCM PVC
Oxychloride Hydrochloric acid
Oxygen
1 MT1,03 MT0,57 MT
0,43 MT
0,66 MT
Production chain of PVC
38
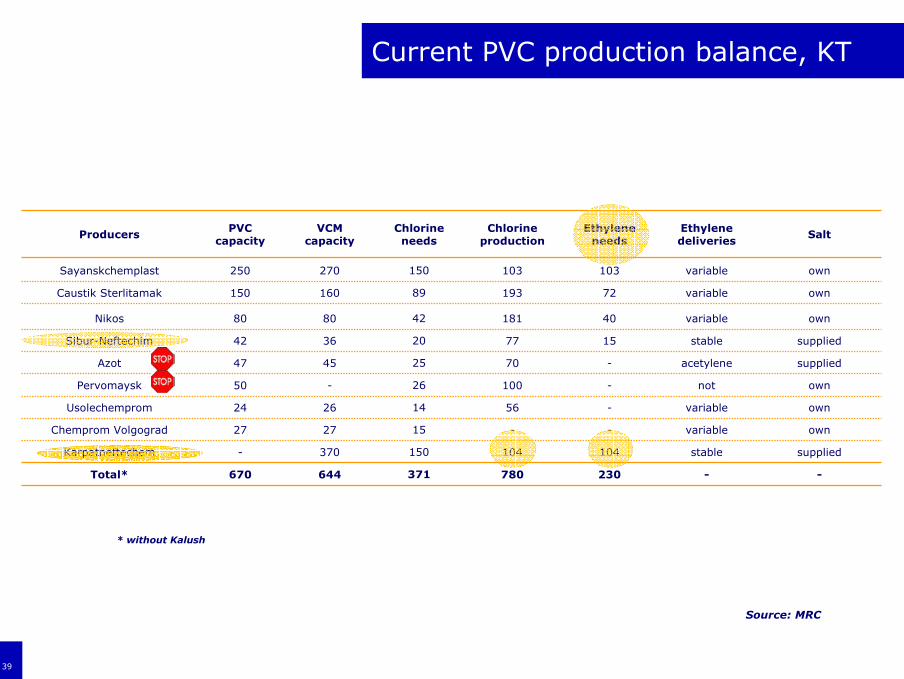
ownnot-10026-50Pervomaysk
suppliedstable104104150370-Karpatneftechem
ownvariable--152727Chemprom Volgograd
SaltEthylene deliveries
Ethylene needs
Chlorine production
Chlorine needs
VCM capacity
PVC capacity
Producers
780
56
70
77
181
193
103 ownvariable103150270250Sayanskchemplast
--230371644670Total*
ownvariable-142624Usolechemprom
suppliedacetylene-254547Azot
suppliedstable15203642Sibur-Neftechim
ownvariable40428080Nikos
ownvariable7289160150Caustik Sterlitamak
* without Kalush
Source: MRC
39
Current PVC production balance, KT
Resume
40
• Eastern European production balance generally will not change in future
• New PVC production in Russia will increase the supply of Caustic Soda
• Export of Caustic Soda will be correlated with Komi project performance
• We will not observe the deficit of Caustic Soda in Russia till 2012
• Chinese producers have to find the balance in chlorine /caustic soda

Sergey Yaremenko,Managing Director,
Market Report Company
[email protected]; www.mrcplast.comMoscow +7 495 543 91 94; Kiev +38 044 599 29 50
Thank you!