caustic soda. russia - mrc · producers mean enterprises directly engaged in caustic soda...
TRANSCRIPT
May 28, 2007 1 © MRC
■ London ■ Moscow ■ Kiev www.mrcplast.com
MRC (Market Report Company) co-operates with the biggest petrochemical companies of the world. Our task is to provide professional reviews of the markets of polymers, pigments and packaging in Eastern Europe and the CIS countries.
Moscow: +7 495 543 91 94
General questions:
Kyiv: +38 044 240 82 35 Vyacheslav Mitskevich [email protected]
www.mrcplast.ru Olga Savina [email protected]
Caustic Soda. Russia May 28, 2007
Monthly Report: May Editor: Olga Shelepova ([email protected])
The Report has been made up on the basis of statistical information provided by the statistical institutions of the Russian Federation and may contain certain inaccuracies connected with the
incorrect distribution of data by types of polymers based on the Foreign Trade Codes in the customs statistics of the Federal Customs Service or on codes of the Federal Service of State Statistics of the Russian Federation on production statistics. The Quarterly Report contains data corrected on the basis of MRC methods. The most detailed market information by consumers, producers and
their brands can be found in our Annual Reports. The information presented in this Report is intended for the exclusive use of MRC clients. The information presented herein is strictly the opinion of MRC and is based on data collected within the public sector and on data prepared by the specialists of MRC. MRC furnishes no security or warranty and assumes no liability as to consequences of
decisions taken in regard to the information presented in this Report.
Consumption, 000 DMT
0
25
50
75
100
Apr May Jun Jul Aug Sep Oct Nov Dec Jan Feb Mar Apr
Production, 000 DMT
0
30
60
90
120
Apr May Jun Jul Aug Sep Oct Nov Dec Jan Feb Mar Apr
Export, 000 DMT
0
6
12
18
24
Apr May Jun Jul Aug Sep Oct Nov Dec Jan Feb Mar Apr
Import, 000 DMT
0
1
2
3
4
Apr May Jun Jul Aug Sep Oct Nov Dec Jan Feb Mar Apr
Export to Production,%
0%
5%
10%
15%
20%
25%
Apr May Jun Jul Aug Sep Oct Nov Dec Jan Feb Mar Apr
Import to Consumption,%
0%
1%
2%
3%
4%
5%
Apr May Jun Jul Aug Sep Oct Nov Dec Jan Feb Mar Apr
Solid Caustic Soda Export Price, DAF, border of Russia, USD/MT
340
355
370
385
400
Apr May Jun Jul Aug Sep Oct Nov Dec Jan Feb Mar Apr
Liquid Caustic Soda Export Price, DAF, border of Russia, USD/MT
120
130
140
150
160
Apr May Jun Jul Aug Sep Oct Nov Dec Jan Feb Mar Apr
* converted into 100% of the main substance (in dry metric tons)
General Indexes. Caustic Soda*

Monthly Report. Russia. Caustic Soda
May 28, 2007 2 © MRC
Apparent consumption of Caustic Soda*, 000 DMT
Year Jan Feb Mar Apr May Jun Jul Aug Sep Oct Nov Dec Growth1.% From the
beginning of the year2
Growth3.%
2002 88.41 82.25 86.70 84.58 90.46 81.95 77.96 82.07 86.56 89.89 83.50 87.88 - 1 022.21 -
2003 81.91 73.44 88.63 76.34 81.35 79.75 76.96 67.93 75.48 75.72 78.38 86.01 -10% 941.90 -6%
2004 91.62 76.45 85.89 81.74 92.28 83.82 86.26 84.85 83.96 89.21 86.28 93.41 7% 1 035.77 5%
2005 92.88 77.87 90.86 83.40 83.84 80.50 85.12 88.31 94.18 86.42 88.82 97.53 2% 1 049.73 3%
2006 96.28 84.79 91.75 94.44 88.38 85.17 85.15 86.79 97.06 89.81 93.31 97.35 13% 1 090.28 6%
2007 98.89 78.99 93.00 92.10 - - - - - - - - -2% 362.98 -1%
Production of Caustic Soda*, 000 DMT
Year Jan Feb Mar Apr May Jun Jul Aug Sep Oct Nov Dec Growth1.% From the
beginning ofthe year2
Growth3.%
2002 100.00 90.90 95.60 93.80 98.50 91.50 87.50 92.80 96.60 101.00 97.60 98.80 - 1 144.60 -
2003 93.30 83.70 97.30 84.40 91.30 89.60 88.00 79.30 87.50 90.40 90.40 99.50 -10% 1 074.70 -6%
2004 97.20 86.90 95.70 92.40 101.00 92.80 97.20 98.80 99.50 101.00 104.00 109.00 9% 1 175.50 4%
2005 103.00 94.60 104.00 101.00 101.00 97.80 103.00 104.00 105.00 103.00 104.00 110.00 9% 1 230.40 8%
2006 106.00 99.30 104.00 106.00 104.00 95.70 102.00 101.00 109.00 109.10 112.00 117.30 5% 1 265.40 3%
2007 115.60 101.30 113.40 108.00 - - - - - - - - 2% 438.30 6%
Export of Caustic Soda*, 000 DMT
Year Jan Feb Mar Apr May Jun Jul Aug Sep Oct Nov Dec Growth1.% From the
beginning ofthe year2
Growth3.%
2002 11.62 8.71 9.05 9.29 8.15 9.61 9.63 10.86 10.33 11.33 14.31 11.20 - 124.09 -
2003 11.42 10.26 8.84 8.14 10.09 9.96 11.26 11.50 12.41 14.80 12.49 13.83 -12% 135.00 0%
2004 5.98 11.76 12.07 12.63 11.56 11.45 13.80 16.10 18.00 13.76 20.25 18.68 55% 166.04 10%
2005 12.02 18.50 15.77 19.25 19.69 19.77 18.83 16.18 11.53 17.24 16.90 13.78 52% 199.46 54%
2006 11.46 15.06 14.22 13.47 17.10 13.31 19.13 17.95 13.72 21.42 20.48 21.77 -30% 199.09 -17%
2007 18.25 22.61 22.36 17.47 - - - - - - - - 30% 80.69 49%
Import of Caustic Soda*, 000 DMT
Year Jan Feb Mar Apr May Jun Jul Aug Sep Oct Nov Dec Growth1.% From the
beginning ofthe year2
Growth3.%
2002 0.03 0.06 0.15 0.07 0.11 0.06 0.09 0.13 0.29 0.21 0.20 0.28 - 1.68 -
2003 0.03 0.00 0.16 0.09 0.14 0.11 0.22 0.13 0.39 0.12 0.47 0.35 29% 2.21 -10%
2004 0.40 1.30 2.26 1.97 2.84 2.48 2.86 2.15 2.46 1.97 2.53 3.09 - 26.31 -
2005 1.90 1.76 2.63 1.66 2.54 2.47 0.94 0.48 0.71 0.67 1.72 1.31 -16% 18.79 34%
2006 1.74 0.55 1.97 1.91 1.48 2.78 2.28 3.74 1.78 2.13 1.79 1.82 15% 23.97 -22%
2007 1.54 0.30 1.96 1.57 - - - - - - - - -18% 5.37 -13%
* converted into 100% of the main substance (in dry metric tons)
1 – growth regarding the same month last year 2 – from the beginning of the year up to the analyzed month inclusive 3- growth regarding the same period last year
Monthly Report. Russia. PVC
Market Analysis: Domestic Market, Europe, Asia ………………………………………………………………………………………………………
4
Caustic Soda: General Indexes..……………………………………………………………………………………………………………………………. 5
Caustic Soda: Production …………………………………………………………….…………………………………………………………………………………………………………………. 5
Liquid Caustic Soda: Export………………………………….…………………………………………………………………………………………………………………………………………. 8
Liquid Caustic Soda: Import……..……………………………………………………………………………………………………………………………………………………………………. 11
Solid Caustic Soda: Export…………………………………….………………………………………………………………………………………………………………………………………… 12
Solid Caustic Soda: Import……………………….……………………………………………………………………………………………………………………………………………………… 15
Key Economic and Social Figures in the Russian Federation …………………………………………………………………………………….. 16
News ………………………………………………………………………………………………………………………………………………………………… 17
General
The Report has been made up on the basis of statistical information provided by
the statistical institutions of the Russian Federation and may contain certain
inaccuracies connected with the incorrect distribution of data by types of Caustic
Soda based on the Foreign Trade Codes in the customs statistics of the Federal
Customs Service. The most detailed market information by consumers and
producers can be found in our Annual Report. The information presented in this
Report is intended for the exclusive use of MRC clients. The information presented
herein is strictly the opinion of MRC and is based on data collected within the
public sector and on data prepared by the specialists of MRC. MRC furnishes no
security or warranty and assumes no liability as to consequences of decisions
taken in regard to the information presented in this Report.
Classification of Products
The Report contains information on: Solid Caustic Soda – solid Caustic Soda;
Liquid Caustic Soda – liquid Caustic Soda. The special ratio is used for
calculation of data in dry metric tons.
Producers
Producers mean enterprises directly engaged in Caustic Soda production; i.e. the
analysis does not include all trading, intermediary and offshore companies. The
names of producers are given without inverted comas, their organizational and
legal forms are omitted, and we use general names of groups of companies
without names of their subsidiaries.
Consumption
The consumption rate is defined as the calculated one, i.e. it equals to the
formula “production + import - export”. This figure does not account stock
remainders, and cannot conform to the level of the end consumption.
Prices
In our Reports, we try to represent prices of deals on sales of raw materials as
accurate as possible. At the formation of prices we consider prices of the
current month.
Diagrams and Tables
Diagrams in the Report are often doubled by the corresponding tables. This has
been done deliberately, since diagrams help define either one or anothers trend,
while corresponding accurate figures from tables are needed for more prices
analysis.
Designations
In our Report we used the following designations: MT – ton, thous. - thousand,
mln. – million, RUB – Russian ruble, USD – US dollar, EUR – Euro, DMT-dry
metric ton.
Growth Rates
As a rule, a growth rates in tables is the ratio of an index during the analyzed
period to the previous period. In case of illogically high (low) indexes, for
example, 900%, we put “-“.
References in the Text
1 – growth regarding the same period last year;
2 – aggregate data from the beginning of the year up to the present month
inclusive;
3 – growth regarding the same period last year.
More detailed schedule of publications can be found here: http://www.market-cis.com/docs/MRC_schedule_Rus.pdf
Prices for subscription and discounts can be found here: http://www. market-cis.com/docs/MRC_prices_Rus.pdf
Payment forms can be found here: http://www.market-cis.com/docs/MRC_payments_Rus.pdf
Contents
Legend
Methodology
- force majeure - growth/decrease since the trend turning point
Our Contacts: Sales: [email protected] Olga Savina [email protected] Telephones: Moscow: + 7 495 543 91 94
General questions: [email protected] Vyacheslav Mitskevich [email protected] Kyiv: + 38044 240 82 35
Monthly Report. Russia. Caustic Soda
May 28, 2007 4 © MRC
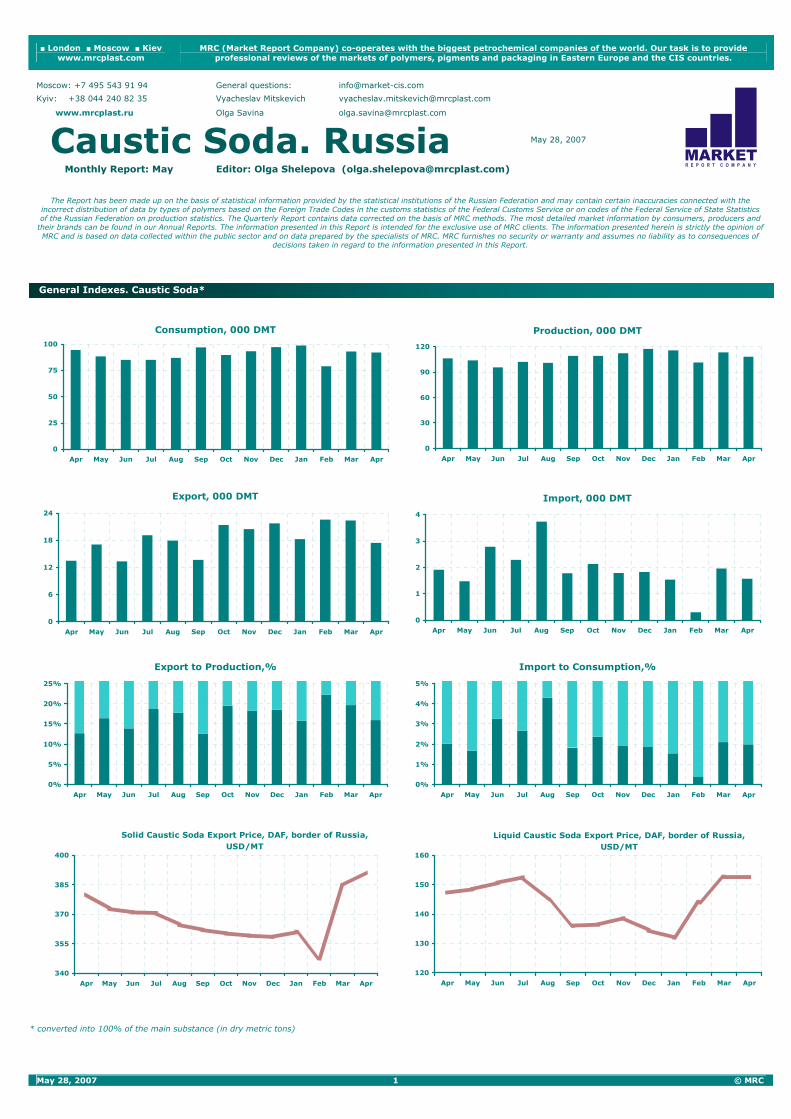
During the four months of the current year, the output of caustic
soda (here and further in DMT - for 100% of the base material)
increased by 6% regarding the same period in 2006 and constituted
438.30 thous. DMT.
The estimated consumption during the same period decreased
from 367.26 thous. DMT in the previous year down to 362.98 thous.
DMT in the current year.
Export shipments increased by 49%, up to 80.69 thous. DMT. At
the same time, the export of caustic in April decreased by 22%
regarding the same figure in April of the current year.
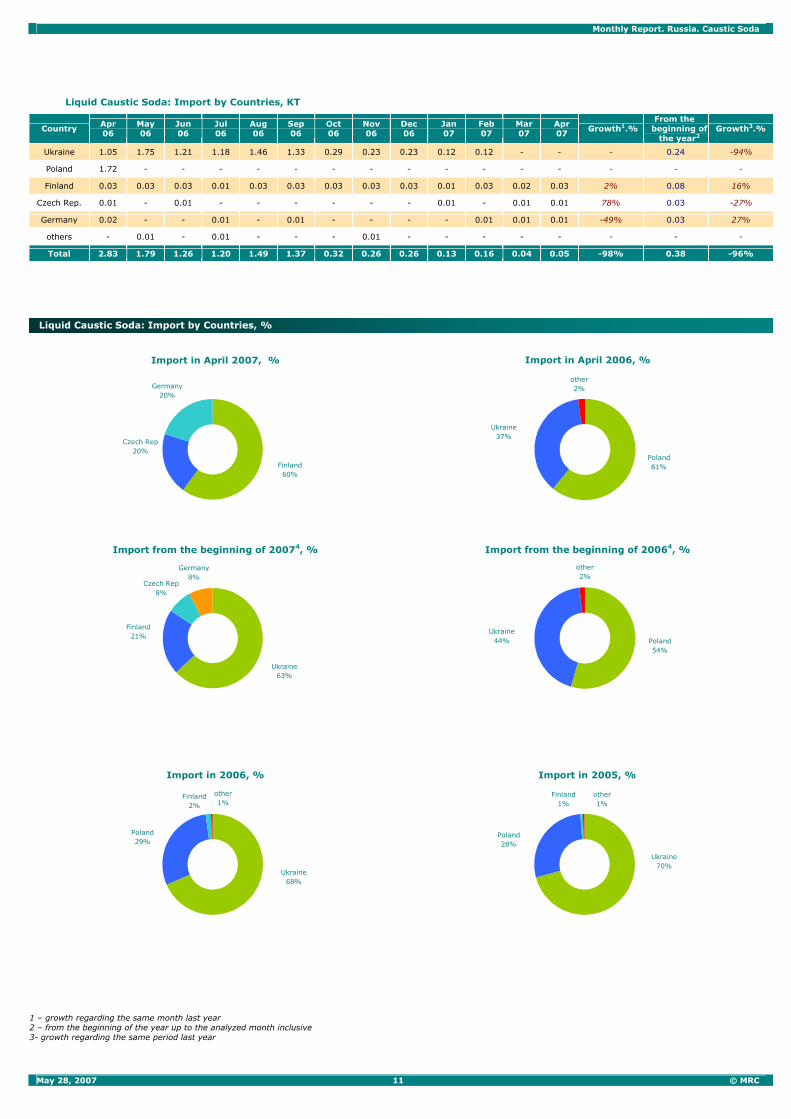
Import supplies of caustic soda this year are lower than the
figure of the previous year. Thus, according to the results of the four
months of 2007, the import of caustic made up 5.37 thous. DMT
[page 2].
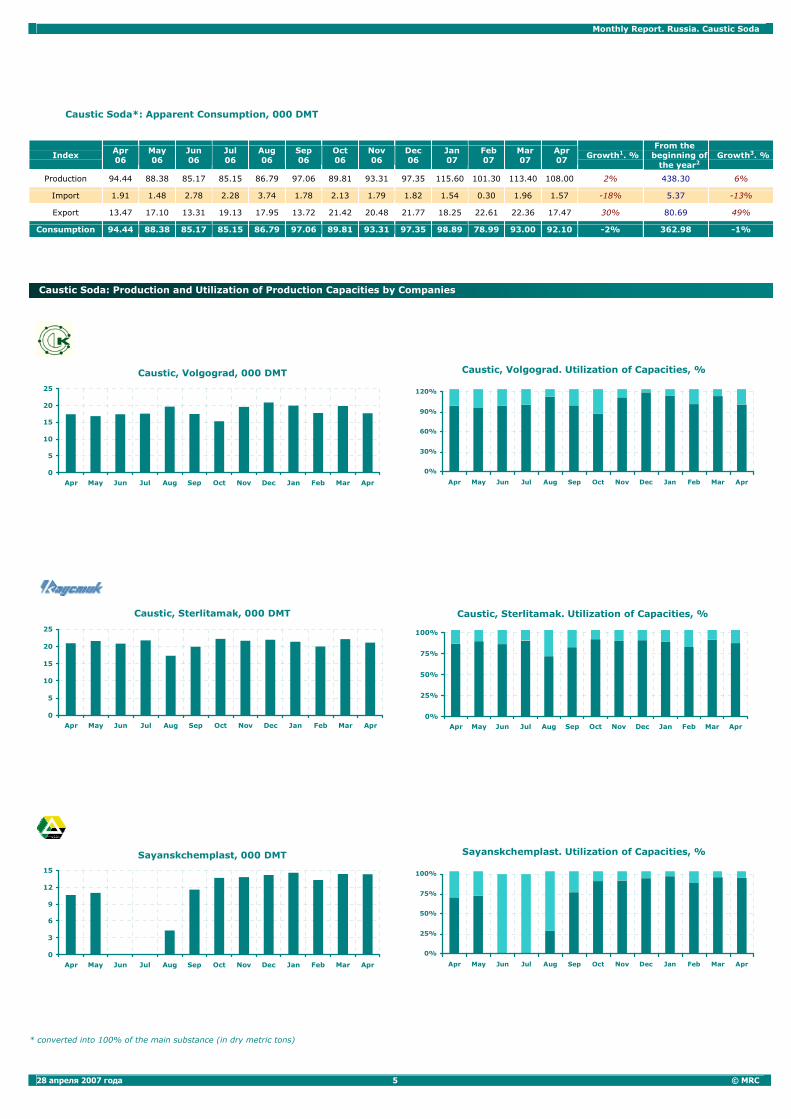
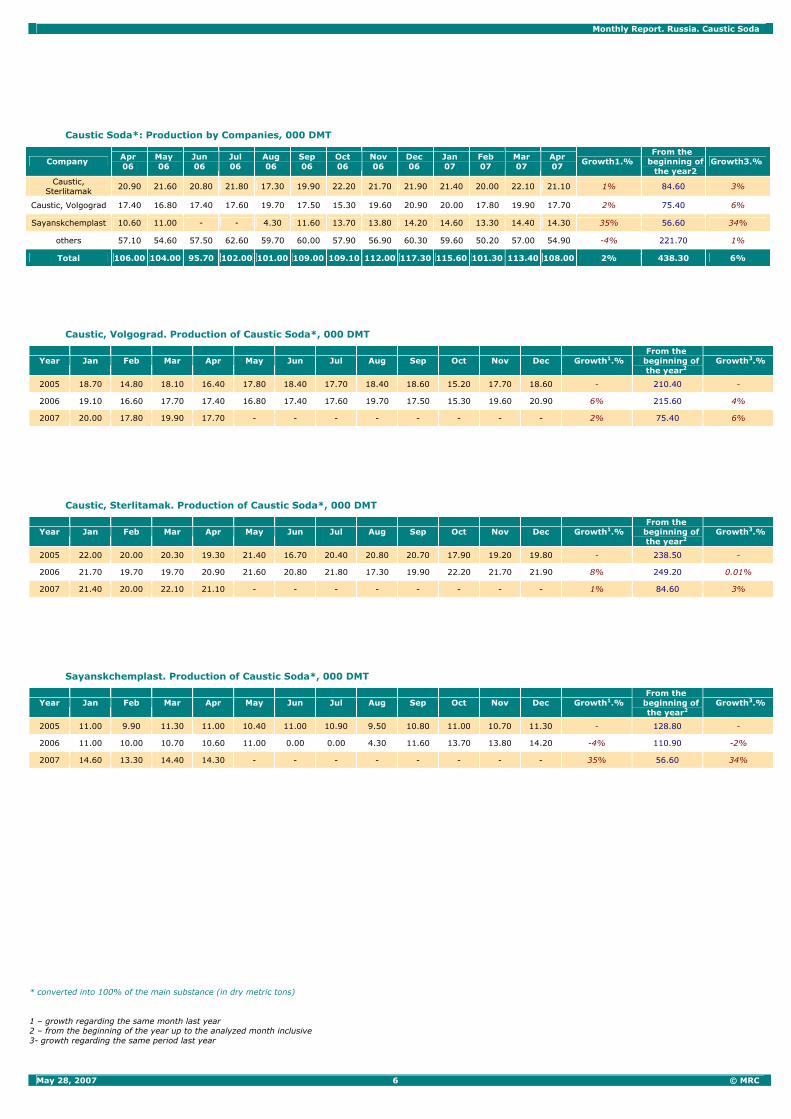
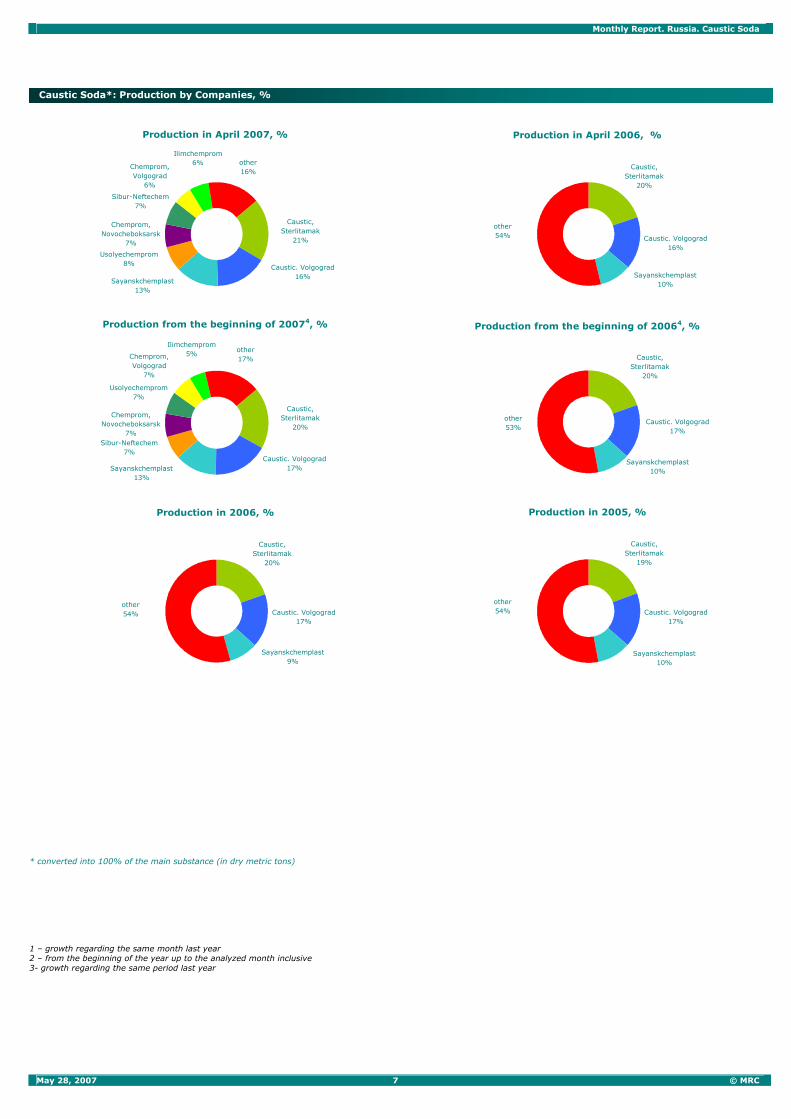
During January-April, Russian producers of caustic soda
increased their output. Thus, Caustic (Sterlitamak) produced 84.60
KT, which was by 3% more than last year; Caustic (Volgograd)
increased its output volumes by 6%, up to 75.4 thous. DMT.
Sayanskchemplast is increasing its production volumes as well.
According to the results of the four months, the enterprise produced
more alkali by 34% (56.6 thous. DMT) comparing with the same
period in 2006 [page 6].
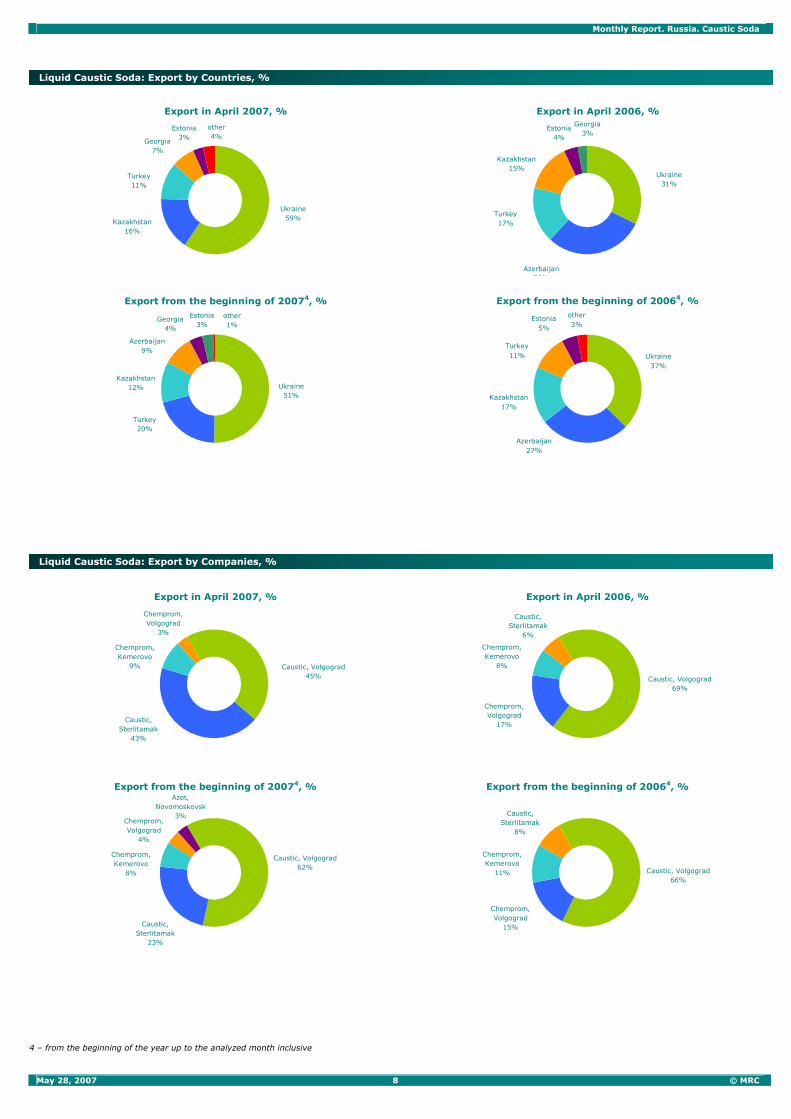
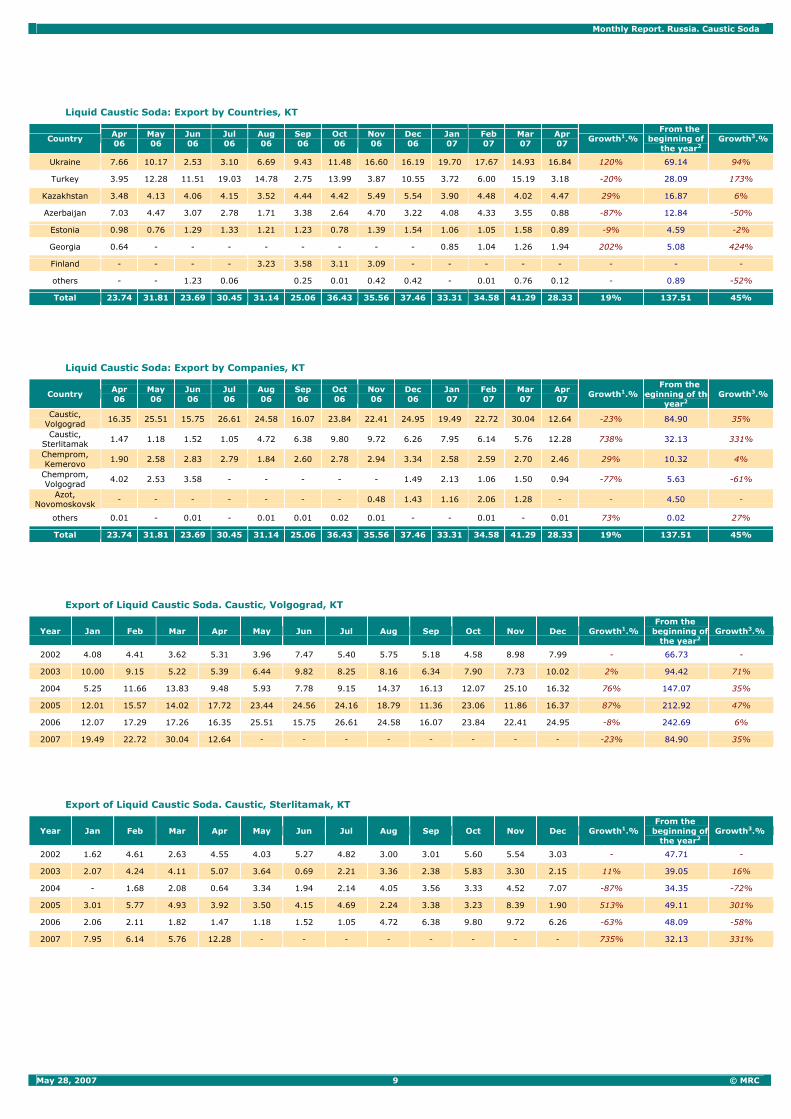
According to the results of the four months, export supplies of
liquid caustic soda increased by 45%, comparing with the previous
year, and constituted 137.51 KT.
In April, about 59% of the overall export of liquid caustic soda
belonged to Ukraine. During January-April, the share of export of
liquid caustic to Ukraine constituted 51% in the overall volume.
This year, Ukrainian caustic producers decreased their output
volumes (during January-April 2007, the output of caustic soda
decreased by 40.5%, down to 44.9 KT, comparing with the same
period in 2006). Within the nearest months, we expect increasing
export shipments to Ukraine, particularly to Nickolayev Alumina Plant.
In Ukraine the deal for Dneproazot is in process now. The
possible buyer of Dneproazot could be the state corporation Ukrnafta.
The second and the third in terms of liquid caustic supplies were
Turkey and Kazakhstan with the share of 20% and 12% in the overall
volume, correspondingly [page 8].
The Uzbek government wants to display for sale shares of nine
plants united by the state company “Uzchemprom”. The interest in the
Uzbek chemical industry is shown by Russian companies as well.
Particularly, “Caustic” (Volgograd) and the OJSC “Navoiazot”, on the
basis of the Uzbek enterprise, a joint venture to manufacture organic
synthesis products. The cost of the enterprise is about USD200 million.
In compliance with the preliminary feasibility studies, the joint venture
plans to build a complex to produce 80 KT of caustic soda and 120 KT
of PVC annually on the basis of the acetylene production of the OJSC
“Navoiazot” [page 18].
Most probably, in May the export supplies of liquid caustic in
Russia would exceed the figure recorded in April; in June, there may
be an insignificant decrease. At the same time, export prices for
liquid caustic remained at the same level and made up USD 150–
155 /MT DAF, border of Russia.
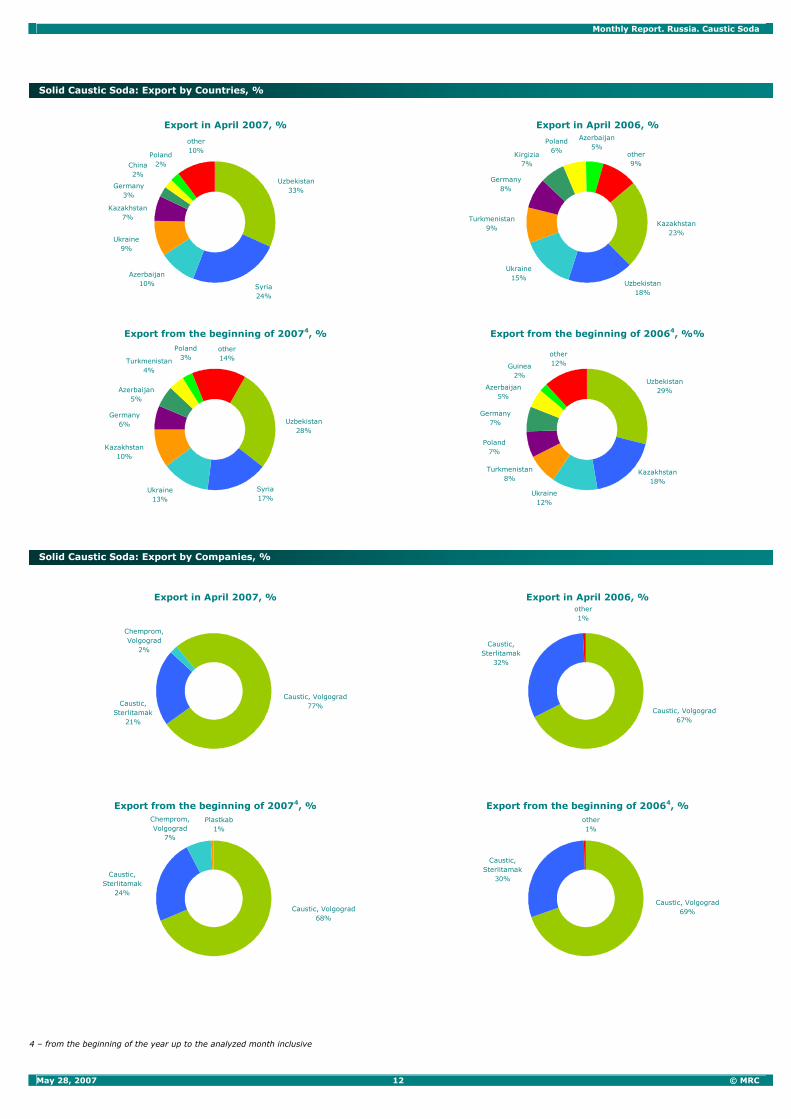
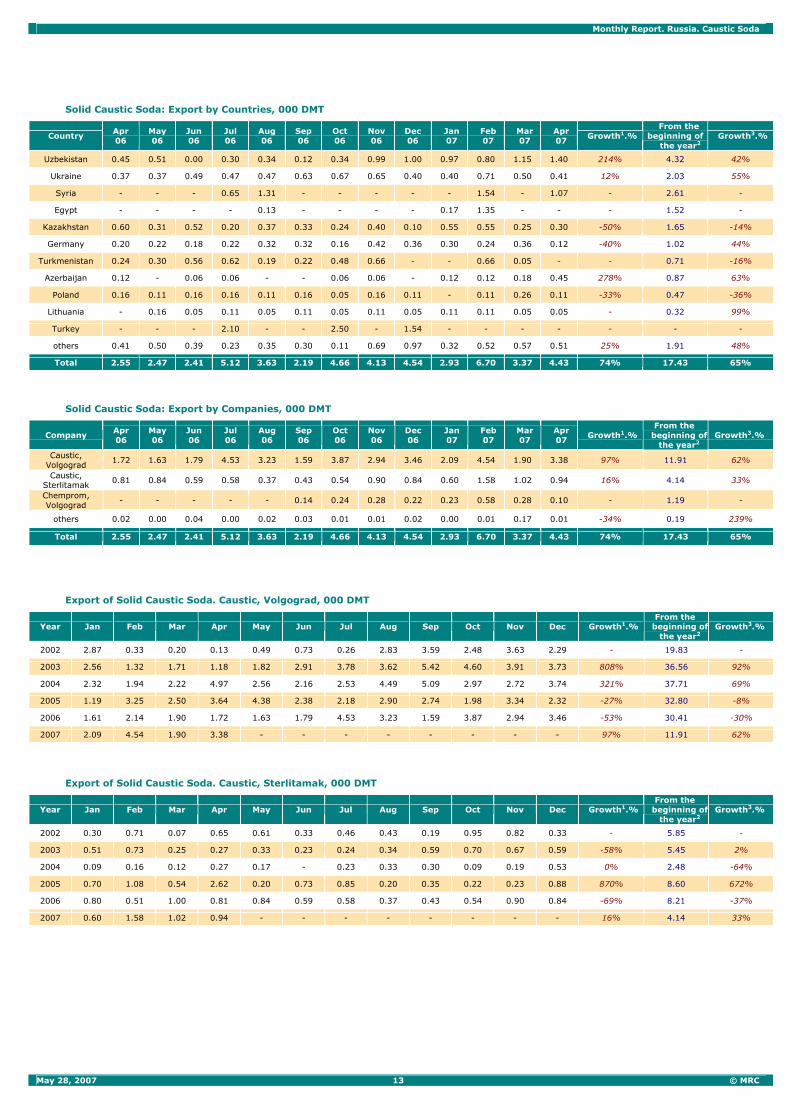
Commencing 2007 export supplies of solid caustic increased
by practically 65%, comparing with the same period in 2006, and
constituted 17.4 thous. DMT. The biggest export volumes of solid
caustic this year belong to Uzbekistan – about 28%.
In April, quotations of export prices for solid caustic increased
in average by USD 5 – 10 /DMT and constituted 385–395
USD/DMT DAF, border of Russia.
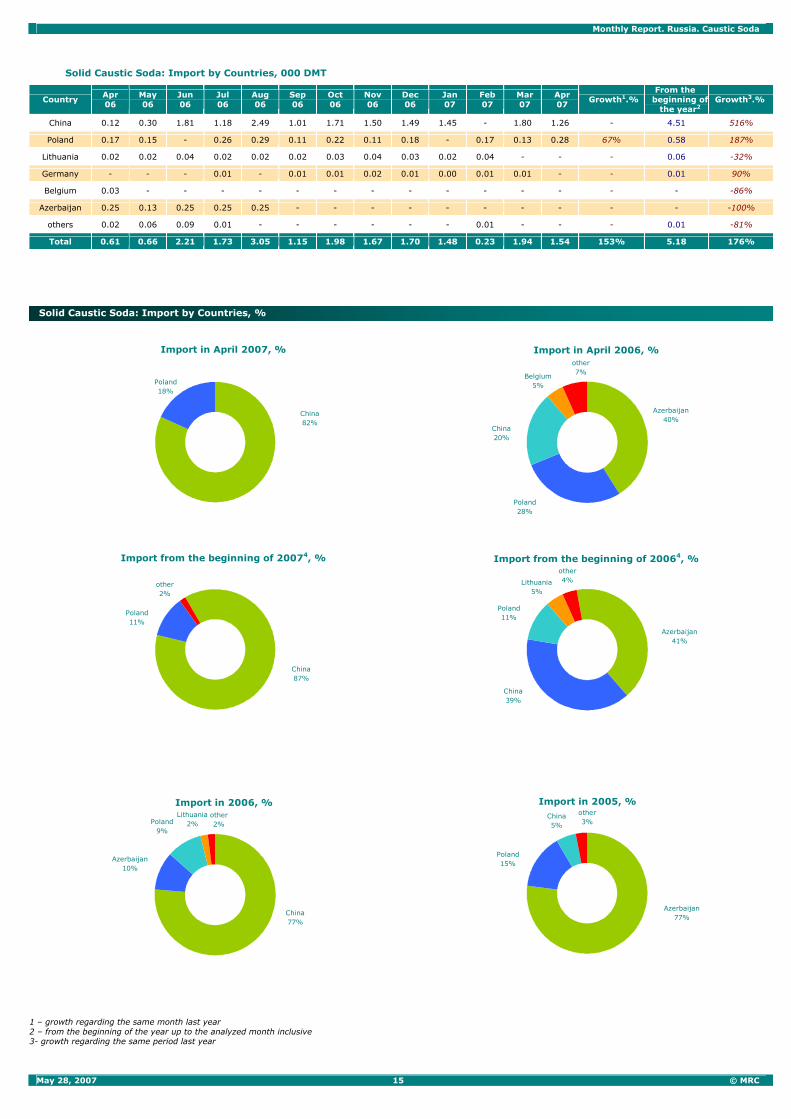
The import of solid caustic soda constituted 1.54 thous. DMT
in April. The share of Chinese caustic in the overall import
constituted about 82%; the remaining 18% were supplies of Anwil
of Poland.
During January-April of the current year, the demand exceeded
supply in the caustic market. Though European manufacturers
increased the output of caustic soda by more than 4%, up to 3732.4
thous. DMT, during that period, comparing with 2006, that was not
enough to meet the demand.
Stock resources kept on increasing in April. They increased by
almost 19.000 DMT, comparing with March, and constituted more
than 322.000 DMT; that was the highest figure since February 2006.
However, according to experts, the scale of that increase was very
frugal regarding the potential decrease of output in May when some
plants reduce output volumes due to scheduled maintenance.
In May 2007, quotations of prices for caustic remained at the
level recorded in April: the price for solid caustic varied within the
range of USD 410-430/DMT, FD NWE, spot. At the same time,
prices for liquid caustic soda varied within the range of USD 280-
305/DMT, FD NWE, spot.
With the beginning of the second quarter, the Asian market of
caustic soda somewhat rallied. Currently, the market is mainly
oriented towards export supplies. Discussions of prices for the
Australian alumina market was the main peculiarity of the Asian
market in May.
In the second quarter of 2007, they plan to suspend caustic
soda production in Japan, South Korea, China, Indonesia and
Taiwan.
Kanoria Chemicals & Industries of India plans to increase
production of caustic soda up to 130 KT a year.
In May, export prices for caustic soda increased by USD 5-
10/DMT, up to USD 250-275/DMT, FOB Asia, spot. At the same time,
domestic prices varied within the range of USD 300-310/DMT, CFR
Asia, spot.
Domestic Market
Europe
Asia
Monthly Report. Russia. Caustic Soda
28 апреля 2007 года 5 © MRC
Caustic Soda*: Apparent Consumption, 000 DMT
Index Apr 06
May 06
Jun 06
Jul 06
Aug 06
Sep 06
Oct 06
Nov 06
Dec 06
Jan 07
Feb 07
Mar 07
Apr 07
Growth1. % From the
beginning ofthe year2
Growth3. %
Production 94.44 88.38 85.17 85.15 86.79 97.06 89.81 93.31 97.35 115.60 101.30 113.40 108.00 2% 438.30 6%
Import 1.91 1.48 2.78 2.28 3.74 1.78 2.13 1.79 1.82 1.54 0.30 1.96 1.57 -18% 5.37 -13%
Export 13.47 17.10 13.31 19.13 17.95 13.72 21.42 20.48 21.77 18.25 22.61 22.36 17.47 30% 80.69 49%
Consumption 94.44 88.38 85.17 85.15 86.79 97.06 89.81 93.31 97.35 98.89 78.99 93.00 92.10 -2% 362.98 -1%
Caustic, Volgograd, 000 DMT
0
5
10
15
20
25
Apr May Jun Jul Aug Sep Oct Nov Dec Jan Feb Mar Apr
Caustic, Volgograd. Utilization of Capacities, %
0%
30%
60%
90%
120%
Apr May Jun Jul Aug Sep Oct Nov Dec Jan Feb Mar Apr
Caustic, Sterlitamak, 000 DMT
0
5
10
15
20
25
Apr May Jun Jul Aug Sep Oct Nov Dec Jan Feb Mar Apr
Caustic, Sterlitamak. Utilization of Capacities, %
0%
25%
50%
75%
100%
Apr May Jun Jul Aug Sep Oct Nov Dec Jan Feb Mar Apr
Sayanskchemplast, 000 DMT
0
3
6
9
12
15
Apr May Jun Jul Aug Sep Oct Nov Dec Jan Feb Mar Apr
Sayanskchemplast. Utilization of Capacities, %
0%
25%
50%
75%
100%
Apr May Jun Jul Aug Sep Oct Nov Dec Jan Feb Mar Apr
* converted into 100% of the main substance (in dry metric tons)
Caustic Soda: Production and Utilization of Production Capacities by Companies
Monthly Report. Russia. Caustic Soda
May 28, 2007 6 © MRC
Caustic Soda*: Production by Companies, 000 DMT
Company Apr 06
May 06
Jun 06
Jul 06
Aug 06
Sep 06
Oct 06
Nov 06
Dec 06
Jan 07
Feb 07
Mar 07
Apr 07
Growth1.% From the
beginning of the year2
Growth3.%
Caustic, Sterlitamak
20.90 21.60 20.80 21.80 17.30 19.90 22.20 21.70 21.90 21.40 20.00 22.10 21.10 1% 84.60 3%
Caustic, Volgograd 17.40 16.80 17.40 17.60 19.70 17.50 15.30 19.60 20.90 20.00 17.80 19.90 17.70 2% 75.40 6%
Sayanskchemplast 10.60 11.00 - - 4.30 11.60 13.70 13.80 14.20 14.60 13.30 14.40 14.30 35% 56.60 34%
others 57.10 54.60 57.50 62.60 59.70 60.00 57.90 56.90 60.30 59.60 50.20 57.00 54.90 -4% 221.70 1%
Total 106.00 104.00 95.70 102.00 101.00 109.00 109.10 112.00 117.30 115.60 101.30 113.40 108.00 2% 438.30 6%
Caustic, Volgograd. Production of Caustic Soda*, 000 DMT
Year Jan Feb Mar Apr May Jun Jul Aug Sep Oct Nov Dec Growth1.% From the
beginning of the year2
Growth3.%
2005 18.70 14.80 18.10 16.40 17.80 18.40 17.70 18.40 18.60 15.20 17.70 18.60 - 210.40 -
2006 19.10 16.60 17.70 17.40 16.80 17.40 17.60 19.70 17.50 15.30 19.60 20.90 6% 215.60 4%
2007 20.00 17.80 19.90 17.70 - - - - - - - - 2% 75.40 6%
Caustic, Sterlitamak. Production of Caustic Soda*, 000 DMT
Year Jan Feb Mar Apr May Jun Jul Aug Sep Oct Nov Dec Growth1.% From the
beginning of the year2
Growth3.%
2005 22.00 20.00 20.30 19.30 21.40 16.70 20.40 20.80 20.70 17.90 19.20 19.80 - 238.50 -
2006 21.70 19.70 19.70 20.90 21.60 20.80 21.80 17.30 19.90 22.20 21.70 21.90 8% 249.20 0.01%
2007 21.40 20.00 22.10 21.10 - - - - - - - - 1% 84.60 3%
Sayanskchemplast. Production of Caustic Soda*, 000 DMT
Year Jan Feb Mar Apr May Jun Jul Aug Sep Oct Nov Dec Growth1.% From the
beginning of the year2
Growth3.%
2005 11.00 9.90 11.30 11.00 10.40 11.00 10.90 9.50 10.80 11.00 10.70 11.30 - 128.80 -
2006 11.00 10.00 10.70 10.60 11.00 0.00 0.00 4.30 11.60 13.70 13.80 14.20 -4% 110.90 -2%
2007 14.60 13.30 14.40 14.30 - - - - - - - - 35% 56.60 34%
* converted into 100% of the main substance (in dry metric tons)
1 – growth regarding the same month last year 2 – from the beginning of the year up to the analyzed month inclusive 3- growth regarding the same period last year
Monthly Report. Russia. Caustic Soda
May 28, 2007 7 © MRC
Production in April 2007, %
Caustic, Sterlitamak
21%
Caustic. Volgograd16%
Sayanskchemplast13%
Chemprom, Novocheboksarsk
7%
Usolyechemprom8%
Sibur-Neftechem7%
Chemprom, Volgograd
6%
Ilimchemprom6% other
16%
Production in April 2006, %
Caustic, Sterlitamak
20%
Caustic. Volgograd16%
Sayanskchemplast10%
other54%
Production from the beginning of 20074, %
Caustic, Sterlitamak
20%
Caustic. Volgograd17%Sayanskchemplast
13%
Chemprom, Novocheboksarsk
7%Sibur-Neftechem
7%
Usolyechemprom7%
Chemprom, Volgograd
7%
Ilimchemprom5%
other17%
Production from the beginning of 20064, %
other53%
Sayanskchemplast10%
Caustic. Volgograd17%
Caustic, Sterlitamak
20%
Production in 2006, %
Caustic, Sterlitamak
20%
Caustic. Volgograd17%
Sayanskchemplast9%
other54%
Production in 2005, %
Caustic, Sterlitamak
19%
Caustic. Volgograd17%
Sayanskchemplast10%
other54%
* converted into 100% of the main substance (in dry metric tons)
1 – growth regarding the same month last year 2 – from the beginning of the year up to the analyzed month inclusive 3- growth regarding the same period last year
Caustic Soda*: Production by Companies, %
Monthly Report. Russia. Caustic Soda
May 28, 2007 8 © MRC
Export in April 2007, %
other4%
Estonia3%Georgia
7%
Ukraine59%Kazakhstan
16%
Turkey11%
Export in April 2006, %Georgia
3%Estonia
4%
Kazakhstan15%
Ukraine31%
Azerbaijan30%
Turkey17%
Export from the beginning of 20074, %Estonia
3%other1%
Georgia4%
Azerbaijan9%
Ukraine51%
Turkey20%
Kazakhstan12%
Export from the beginning of 20064, %other3%
Estonia5%
Turkey11% Ukraine
37%
Azerbaijan27%
Kazakhstan17%
Export in April 2007, %
Chemprom, Kemerovo
9%
Chemprom, Volgograd
3%
Caustic, Sterlitamak
43%
Caustic, Volgograd45%
Export in April 2006, %
Caustic, Volgograd69%
Chemprom, Volgograd
17%
Caustic, Sterlitamak
6%
Chemprom, Kemerovo
8%
Export from the beginning of 20074, %
Chemprom, Kemerovo
8%
Chemprom, Volgograd
4%
Azot, Novomoskovsk
3%
Caustic, Sterlitamak
23%
Caustic, Volgograd62%
Export from the beginning of 20064, %
Chemprom, Kemerovo
11%
Caustic, Sterlitamak
8%
Chemprom, Volgograd
15%
Caustic, Volgograd66%
4 – from the beginning of the year up to the analyzed month inclusive
Liquid Caustic Soda: Export by Countries, %
Liquid Caustic Soda: Export by Companies, %
Monthly Report. Russia. Caustic Soda
May 28, 2007 9 © MRC
Liquid Caustic Soda: Export by Countries, KT
Country Apr 06
May 06
Jun 06
Jul 06
Aug 06
Sep 06
Oct 06
Nov 06
Dec 06
Jan 07
Feb 07
Mar 07
Apr 07
Growth1.% From the
beginning of the year2
Growth3.%
Ukraine 7.66 10.17 2.53 3.10 6.69 9.43 11.48 16.60 16.19 19.70 17.67 14.93 16.84 120% 69.14 94%
Turkey 3.95 12.28 11.51 19.03 14.78 2.75 13.99 3.87 10.55 3.72 6.00 15.19 3.18 -20% 28.09 173%
Kazakhstan 3.48 4.13 4.06 4.15 3.52 4.44 4.42 5.49 5.54 3.90 4.48 4.02 4.47 29% 16.87 6%
Azerbaijan 7.03 4.47 3.07 2.78 1.71 3.38 2.64 4.70 3.22 4.08 4.33 3.55 0.88 -87% 12.84 -50%
Estonia 0.98 0.76 1.29 1.33 1.21 1.23 0.78 1.39 1.54 1.06 1.05 1.58 0.89 -9% 4.59 -2%
Georgia 0.64 - - - - - - - - 0.85 1.04 1.26 1.94 202% 5.08 424%
Finland - - - - 3.23 3.58 3.11 3.09 - - - - - - - -
others - - 1.23 0.06 0.25 0.01 0.42 0.42 - 0.01 0.76 0.12 - 0.89 -52%
Total 23.74 31.81 23.69 30.45 31.14 25.06 36.43 35.56 37.46 33.31 34.58 41.29 28.33 19% 137.51 45%
Liquid Caustic Soda: Export by Companies, KT
Country Apr 06
May 06
Jun 06
Jul 06
Aug 06
Sep 06
Oct 06
Nov 06
Dec 06
Jan 07
Feb 07
Mar 07
Apr 07
Growth1.% From the
beginning of theyear2
Growth3.%
Caustic, Volgograd
16.35 25.51 15.75 26.61 24.58 16.07 23.84 22.41 24.95 19.49 22.72 30.04 12.64 -23% 84.90 35%
Caustic, Sterlitamak
1.47 1.18 1.52 1.05 4.72 6.38 9.80 9.72 6.26 7.95 6.14 5.76 12.28 738% 32.13 331%
Chemprom, Kemerovo
1.90 2.58 2.83 2.79 1.84 2.60 2.78 2.94 3.34 2.58 2.59 2.70 2.46 29% 10.32 4%
Chemprom, Volgograd
4.02 2.53 3.58 - - - - - 1.49 2.13 1.06 1.50 0.94 -77% 5.63 -61%
Azot, Novomoskovsk
- - - - - - - 0.48 1.43 1.16 2.06 1.28 - - 4.50 -
others 0.01 - 0.01 - 0.01 0.01 0.02 0.01 - - 0.01 - 0.01 73% 0.02 27%
Total 23.74 31.81 23.69 30.45 31.14 25.06 36.43 35.56 37.46 33.31 34.58 41.29 28.33 19% 137.51 45%
Export of Liquid Caustic Soda. Caustic, Volgograd, KT
Year Jan Feb Mar Apr May Jun Jul Aug Sep Oct Nov Dec Growth1.% From the
beginning ofthe year2
Growth3.%
2002 4.08 4.41 3.62 5.31 3.96 7.47 5.40 5.75 5.18 4.58 8.98 7.99 - 66.73 -
2003 10.00 9.15 5.22 5.39 6.44 9.82 8.25 8.16 6.34 7.90 7.73 10.02 2% 94.42 71%
2004 5.25 11.66 13.83 9.48 5.93 7.78 9.15 14.37 16.13 12.07 25.10 16.32 76% 147.07 35%
2005 12.01 15.57 14.02 17.72 23.44 24.56 24.16 18.79 11.36 23.06 11.86 16.37 87% 212.92 47%
2006 12.07 17.29 17.26 16.35 25.51 15.75 26.61 24.58 16.07 23.84 22.41 24.95 -8% 242.69 6%
2007 19.49 22.72 30.04 12.64 - - - - - - - - -23% 84.90 35%
Export of Liquid Caustic Soda. Caustic, Sterlitamak, KT
Year Jan Feb Mar Apr May Jun Jul Aug Sep Oct Nov Dec Growth1.% From the
beginning ofthe year2
Growth3.%
2002 1.62 4.61 2.63 4.55 4.03 5.27 4.82 3.00 3.01 5.60 5.54 3.03 - 47.71 -
2003 2.07 4.24 4.11 5.07 3.64 0.69 2.21 3.36 2.38 5.83 3.30 2.15 11% 39.05 16%
2004 - 1.68 2.08 0.64 3.34 1.94 2.14 4.05 3.56 3.33 4.52 7.07 -87% 34.35 -72%
2005 3.01 5.77 4.93 3.92 3.50 4.15 4.69 2.24 3.38 3.23 8.39 1.90 513% 49.11 301%
2006 2.06 2.11 1.82 1.47 1.18 1.52 1.05 4.72 6.38 9.80 9.72 6.26 -63% 48.09 -58%
2007 7.95 6.14 5.76 12.28 - - - - - - - - 735% 32.13 331%

Monthly Report. Russia. Caustic Soda
May 28, 2007 10 © MRC
Export of Liquid Caustic Soda. Chemprom, Kemerovo, KT
Year Jan Feb Mar Apr May Jun Jul Aug Sep Oct Nov Dec Growth1.% From the
beginning ofthe year2
Growth3.%
2002 1.76 1.65 1.78 2.13 2.17 1.27 2.35 1.61 1.15 1.32 1.85 2.50 - 21.54 -
2003 1.59 0.88 1.33 1.96 1.38 0.71 0.93 0.56 1.25 1.43 1.54 2.54 -8% 16.10 -21%
2004 0.12 2.26 1.90 2.88 2.67 2.52 2.75 1.48 2.85 1.88 2.16 2.63 47% 26.10 24%
2005 2.61 3.20 2.58 2.39 2.51 2.68 1.27 3.41 2.47 2.90 2.49 2.67 -17% 31.18 51%
2006 2.34 2.96 2.75 1.90 2.58 2.83 2.79 1.84 2.60 2.78 2.94 3.34 -21% 31.65 -8%
2007 2.58 2.59 2.70 2.46 - - - - - - - - 29% 10.33 4%
Export of Liquid Caustic Soda by Countries. Caustic, Volgograd, KT
Country Apr 06
May 06
Jun 06
Jul 06
Aug 06
Sep 06
Oct 06
Nov 06
Dec 06
Jan 07
Feb 07
Mar 07
Apr 07
Growth1.% From the
beginning of the year2
Growth3.%
Turkey 3.95 12.28 11.51 19.03 14.78 2.75 13.99 3.87 9.60 3.72 6.00 15.19 3.18 -20% 28.09 173%
Ukraine 6.18 9.46 1.64 3.10 6.69 8.36 6.31 12.28 10.12 9.72 10.73 8.95 6.30 2% 35.69 9%
Azerbaijan 4.49 2.64 0.37 2.78 1.71 3.38 2.64 4.70 3.22 3.85 3.68 2.78 - - 10.32 -26%
Estonia 0.98 0.76 1.29 1.33 1.21 1.23 0.78 1.39 1.54 1.06 1.05 1.58 0.89 -9% 4.59 -2%
Kazakhstan 0.12 0.37 0.25 0.30 0.20 0.36 0.11 0.17 0.35 0.28 0.23 0.11 0.28 143% 0.91 133%
Georgia 0.64 - - - - - - - - 0.85 1.04 1.26 1.94 204% 5.08 426%
Lithuania - - 0.05 0.06 - - - - - - - 0.17 - 0.17 -
others - - 0.62 - - - - - 0.12 - - - 0.06 - 0.06 -
Total 16.35 25.51 15.75 26.61 24.58 16.07 23.84 22.41 24.95 19.49 22.72 30.04 12.64 -23% 84.90 35%
Export of Liquid Caustic Soda by Countries. Caustic, Sterlitamak, KT
Country Apr 06
May 06
Jun 06
Jul 06
Aug 06
Sep 06
Oct 06
Nov 06
Dec 06
Jan 07
Feb 07
Mar 07
Apr 07
Growth1.% From the
beginning of the year2
Growth3.%
Ukraine - - - - - 1.07 5.17 3.84 3.28 6.92 4.47 3.97 10.55 - 25.91 -
Kazakhstan 1.47 1.18 0.98 1.05 1.49 1.48 1.52 2.38 1.73 1.03 1.66 1.20 1.74 19% 5.64 0.2%
Finland - - - - 3.23 3.58 3.11 3.09 - - - - - - - -
Uzbekistan - - 0.54 - - 0.25 - 0.41 0.29 - - 0.59 - - 0.59 -68%
Turkey - - - - - - - - 0.96 - - - - - - - -
Total 1.47 1.18 1.52 1.05 4.72 6.38 9.80 9.72 6.26 7.95 6.14 5.76 12.28 738% 32.13 331%
Export of Liquid Caustic Soda by Countries. Chemprom, Kemerovo, KT
Country Apr 06
May 06
Jun 06
Jul 06
Aug 06
Sep 06
Oct 06
Nov 06
Dec 06
Jan 07
Feb 07
Mar 07
Apr 07
Growth1.% From the
beginning of the year2
Growth3.%
Kazakhstan 1.90 2.58 2.83 2.79 1.84 2.60 2.78 2.94 3.34 2.58 2.59 2.70 2.46 29% 10.32 4%
Total 1.90 2.58 2.83 2.79 1.84 2.60 2.78 2.94 3.34 2.58 2.59 2.70 2.46 29% 10.32 4%
1 – growth regarding the same month last year 2 – from the beginning of the year up to the analyzed month inclusive 3- growth regarding the same period last year
Monthly Report. Russia. Caustic Soda
May 28, 2007 11 © MRC
Liquid Caustic Soda: Import by Countries, KT
Country Apr 06
May 06
Jun 06
Jul 06
Aug 06
Sep 06
Oct 06
Nov 06
Dec 06
Jan 07
Feb 07
Mar 07
Apr 07
Growth1.% From the
beginning ofthe year2
Growth3.%
Ukraine 1.05 1.75 1.21 1.18 1.46 1.33 0.29 0.23 0.23 0.12 0.12 - - - 0.24 -94%
Poland 1.72 - - - - - - - - - - - - - - -
Finland 0.03 0.03 0.03 0.01 0.03 0.03 0.03 0.03 0.03 0.01 0.03 0.02 0.03 2% 0.08 16%
Czech Rep. 0.01 - 0.01 - - - - - - 0.01 - 0.01 0.01 78% 0.03 -27%
Germany 0.02 - - 0.01 - 0.01 - - - - 0.01 0.01 0.01 -49% 0.03 27%
others - 0.01 - 0.01 - - - 0.01 - - - - - - - -
Total 2.83 1.79 1.26 1.20 1.49 1.37 0.32 0.26 0.26 0.13 0.16 0.04 0.05 -98% 0.38 -96%
Import in April 2007, %
Germany20%
Finland60%
Czech Rep20%
Import in April 2006, %
other2%
Poland61%
Ukraine37%
Import from the beginning of 20074, %
Czech Rep8%
Germany8%
Ukraine63%
Finland21%
Import from the beginning of 20064, %
other2%
Poland54%
Ukraine44%
Import in 2006, %
Finland2%
other1%
Ukraine68%
Poland29%
Import in 2005, %
Poland28%
Ukraine70%
other1%
Finland1%
1 – growth regarding the same month last year 2 – from the beginning of the year up to the analyzed month inclusive 3- growth regarding the same period last year
Liquid Caustic Soda: Import by Countries, %
Monthly Report. Russia. Caustic Soda
May 28, 2007 12 © MRC
Export in April 2007, %
Poland2%
other10%
China2%
Germany3%
Kazakhstan7%
Ukraine9%
Azerbaijan10% Syria
24%
Uzbekistan33%
Export in April 2006, %Azerbaijan
5%other9%
Poland6%
Kirgizia7%
Germany8%
Turkmenistan9%
Ukraine15%
Uzbekistan18%
Kazakhstan23%
Export from the beginning of 20074, %
Uzbekistan28%
Syria17%
Ukraine13%
Kazakhstan10%
Germany6%
Azerbaijan5%
Turkmenistan4%
other14%
Poland3%
Export from the beginning of 20064, %%
Guinea2%
other12%
Azerbaijan5%
Germany7%
Poland7%
Turkmenistan8%
Ukraine12%
Kazakhstan18%
Uzbekistan29%
Export in April 2007, %
Chemprom, Volgograd
2%
Caustic, Sterlitamak
21%
Caustic, Volgograd77%
Export in April 2006, %other1%
Caustic, Sterlitamak
32%
Caustic, Volgograd67%
Export from the beginning of 20074, %Plastkab
1%Chemprom, Volgograd
7%
Caustic, Sterlitamak
24%
Caustic, Volgograd68%
Export from the beginning of 20064, %other1%
Caustic, Sterlitamak
30%
Caustic, Volgograd69%
4 – from the beginning of the year up to the analyzed month inclusive
Solid Caustic Soda: Export by Countries, %
Solid Caustic Soda: Export by Companies, %
Monthly Report. Russia. Caustic Soda
May 28, 2007 13 © MRC
Solid Caustic Soda: Export by Countries, 000 DMT
Country Apr 06
May 06
Jun 06
Jul 06
Aug 06
Sep 06
Oct 06
Nov 06
Dec 06
Jan 07
Feb 07
Mar 07
Apr 07
Growth1.% From the
beginning of the year2
Growth3.%
Uzbekistan 0.45 0.51 0.00 0.30 0.34 0.12 0.34 0.99 1.00 0.97 0.80 1.15 1.40 214% 4.32 42%
Ukraine 0.37 0.37 0.49 0.47 0.47 0.63 0.67 0.65 0.40 0.40 0.71 0.50 0.41 12% 2.03 55%
Syria - - - 0.65 1.31 - - - - - 1.54 - 1.07 - 2.61 -
Egypt - - - - 0.13 - - - - 0.17 1.35 - - - 1.52 -
Kazakhstan 0.60 0.31 0.52 0.20 0.37 0.33 0.24 0.40 0.10 0.55 0.55 0.25 0.30 -50% 1.65 -14%
Germany 0.20 0.22 0.18 0.22 0.32 0.32 0.16 0.42 0.36 0.30 0.24 0.36 0.12 -40% 1.02 44%
Turkmenistan 0.24 0.30 0.56 0.62 0.19 0.22 0.48 0.66 - - 0.66 0.05 - - 0.71 -16%
Azerbaijan 0.12 - 0.06 0.06 - - 0.06 0.06 - 0.12 0.12 0.18 0.45 278% 0.87 63%
Poland 0.16 0.11 0.16 0.16 0.11 0.16 0.05 0.16 0.11 - 0.11 0.26 0.11 -33% 0.47 -36%
Lithuania - 0.16 0.05 0.11 0.05 0.11 0.05 0.11 0.05 0.11 0.11 0.05 0.05 - 0.32 99%
Turkey - - - 2.10 - - 2.50 - 1.54 - - - - - - -
others 0.41 0.50 0.39 0.23 0.35 0.30 0.11 0.69 0.97 0.32 0.52 0.57 0.51 25% 1.91 48%
Total 2.55 2.47 2.41 5.12 3.63 2.19 4.66 4.13 4.54 2.93 6.70 3.37 4.43 74% 17.43 65%
Solid Caustic Soda: Export by Companies, 000 DMT
Company Apr 06
May 06
Jun 06
Jul 06
Aug 06
Sep 06
Oct 06
Nov 06
Dec 06
Jan 07
Feb 07
Mar 07
Apr 07
Growth1.% From the
beginning ofthe year2
Growth3.%
Caustic, Volgograd
1.72 1.63 1.79 4.53 3.23 1.59 3.87 2.94 3.46 2.09 4.54 1.90 3.38 97% 11.91 62%
Caustic, Sterlitamak
0.81 0.84 0.59 0.58 0.37 0.43 0.54 0.90 0.84 0.60 1.58 1.02 0.94 16% 4.14 33%
Chemprom, Volgograd
- - - - - 0.14 0.24 0.28 0.22 0.23 0.58 0.28 0.10 - 1.19 -
others 0.02 0.00 0.04 0.00 0.02 0.03 0.01 0.01 0.02 0.00 0.01 0.17 0.01 -34% 0.19 239%
Total 2.55 2.47 2.41 5.12 3.63 2.19 4.66 4.13 4.54 2.93 6.70 3.37 4.43 74% 17.43 65%
Export of Solid Caustic Soda. Caustic, Volgograd, 000 DMT
Year Jan Feb Mar Apr May Jun Jul Aug Sep Oct Nov Dec Growth1.% From the
beginning ofthe year2
Growth3.%
2002 2.87 0.33 0.20 0.13 0.49 0.73 0.26 2.83 3.59 2.48 3.63 2.29 - 19.83 -
2003 2.56 1.32 1.71 1.18 1.82 2.91 3.78 3.62 5.42 4.60 3.91 3.73 808% 36.56 92%
2004 2.32 1.94 2.22 4.97 2.56 2.16 2.53 4.49 5.09 2.97 2.72 3.74 321% 37.71 69%
2005 1.19 3.25 2.50 3.64 4.38 2.38 2.18 2.90 2.74 1.98 3.34 2.32 -27% 32.80 -8%
2006 1.61 2.14 1.90 1.72 1.63 1.79 4.53 3.23 1.59 3.87 2.94 3.46 -53% 30.41 -30%
2007 2.09 4.54 1.90 3.38 - - - - - - - - 97% 11.91 62%
Export of Solid Caustic Soda. Caustic, Sterlitamak, 000 DMT
Year Jan Feb Mar Apr May Jun Jul Aug Sep Oct Nov Dec Growth1.% From the
beginning ofthe year2
Growth3.%
2002 0.30 0.71 0.07 0.65 0.61 0.33 0.46 0.43 0.19 0.95 0.82 0.33 - 5.85 -
2003 0.51 0.73 0.25 0.27 0.33 0.23 0.24 0.34 0.59 0.70 0.67 0.59 -58% 5.45 2%
2004 0.09 0.16 0.12 0.27 0.17 - 0.23 0.33 0.30 0.09 0.19 0.53 0% 2.48 -64%
2005 0.70 1.08 0.54 2.62 0.20 0.73 0.85 0.20 0.35 0.22 0.23 0.88 870% 8.60 672%
2006 0.80 0.51 1.00 0.81 0.84 0.59 0.58 0.37 0.43 0.54 0.90 0.84 -69% 8.21 -37%
2007 0.60 1.58 1.02 0.94 - - - - - - - - 16% 4.14 33%
Monthly Report. Russia. Caustic Soda
May 28, 2007 14 © MRC
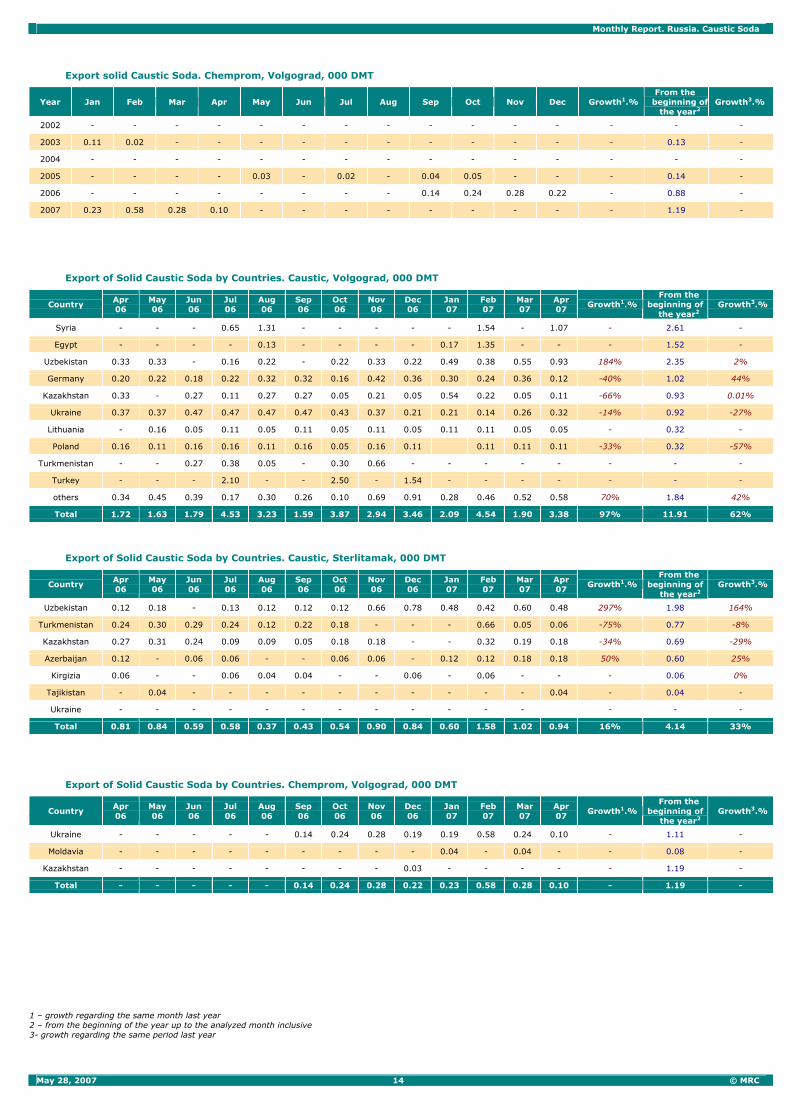
Export solid Caustic Soda. Chemprom, Volgograd, 000 DMT
Year Jan Feb Mar Apr May Jun Jul Aug Sep Oct Nov Dec Growth1.% From the
beginning ofthe year2
Growth3.%
2002 - - - - - - - - - - - - - - -
2003 0.11 0.02 - - - - - - - - - - - 0.13 -
2004 - - - - - - - - - - - - - - -
2005 - - - - 0.03 - 0.02 - 0.04 0.05 - - - 0.14 -
2006 - - - - - - - - 0.14 0.24 0.28 0.22 - 0.88 -
2007 0.23 0.58 0.28 0.10 - - - - - - - - - 1.19 -
Export of Solid Caustic Soda by Countries. Caustic, Volgograd, 000 DMT
Country Apr 06
May 06
Jun 06
Jul 06
Aug 06
Sep 06
Oct 06
Nov 06
Dec 06
Jan 07
Feb 07
Mar 07
Apr 07
Growth1.% From the
beginning of the year2
Growth3.%
Syria - - - 0.65 1.31 - - - - - 1.54 - 1.07 - 2.61 -
Egypt - - - - 0.13 - - - - 0.17 1.35 - - - 1.52 -
Uzbekistan 0.33 0.33 - 0.16 0.22 - 0.22 0.33 0.22 0.49 0.38 0.55 0.93 184% 2.35 2%
Germany 0.20 0.22 0.18 0.22 0.32 0.32 0.16 0.42 0.36 0.30 0.24 0.36 0.12 -40% 1.02 44%
Kazakhstan 0.33 - 0.27 0.11 0.27 0.27 0.05 0.21 0.05 0.54 0.22 0.05 0.11 -66% 0.93 0.01%
Ukraine 0.37 0.37 0.47 0.47 0.47 0.47 0.43 0.37 0.21 0.21 0.14 0.26 0.32 -14% 0.92 -27%
Lithuania - 0.16 0.05 0.11 0.05 0.11 0.05 0.11 0.05 0.11 0.11 0.05 0.05 - 0.32 -
Poland 0.16 0.11 0.16 0.16 0.11 0.16 0.05 0.16 0.11 0.11 0.11 0.11 -33% 0.32 -57%
Turkmenistan - - 0.27 0.38 0.05 - 0.30 0.66 - - - - - - - -
Turkey - - - 2.10 - - 2.50 - 1.54 - - - - - - -
others 0.34 0.45 0.39 0.17 0.30 0.26 0.10 0.69 0.91 0.28 0.46 0.52 0.58 70% 1.84 42%
Total 1.72 1.63 1.79 4.53 3.23 1.59 3.87 2.94 3.46 2.09 4.54 1.90 3.38 97% 11.91 62%
Export of Solid Caustic Soda by Countries. Caustic, Sterlitamak, 000 DMT
Country Apr 06
May 06
Jun 06
Jul 06
Aug 06
Sep 06
Oct 06
Nov 06
Dec 06
Jan 07
Feb 07
Mar 07
Apr 07
Growth1.% From the
beginning of the year2
Growth3.%
Uzbekistan 0.12 0.18 - 0.13 0.12 0.12 0.12 0.66 0.78 0.48 0.42 0.60 0.48 297% 1.98 164%
Turkmenistan 0.24 0.30 0.29 0.24 0.12 0.22 0.18 - - - 0.66 0.05 0.06 -75% 0.77 -8%
Kazakhstan 0.27 0.31 0.24 0.09 0.09 0.05 0.18 0.18 - - 0.32 0.19 0.18 -34% 0.69 -29%
Azerbaijan 0.12 - 0.06 0.06 - - 0.06 0.06 - 0.12 0.12 0.18 0.18 50% 0.60 25%
Kirgizia 0.06 - - 0.06 0.04 0.04 - - 0.06 - 0.06 - - - 0.06 0%
Tajikistan - 0.04 - - - - - - - - - - 0.04 - 0.04 -
Ukraine - - - - - - - - - - - - - - -
Total 0.81 0.84 0.59 0.58 0.37 0.43 0.54 0.90 0.84 0.60 1.58 1.02 0.94 16% 4.14 33%
Export of Solid Caustic Soda by Countries. Chemprom, Volgograd, 000 DMT
Country Apr 06
May 06
Jun 06
Jul 06
Aug 06
Sep 06
Oct 06
Nov 06
Dec 06
Jan 07
Feb 07
Mar 07
Apr 07
Growth1.% From the
beginning of the year2
Growth3.%
Ukraine - - - - - 0.14 0.24 0.28 0.19 0.19 0.58 0.24 0.10 - 1.11 -
Moldavia - - - - - - - - - 0.04 - 0.04 - - 0.08 -
Kazakhstan - - - - - - - - 0.03 - - - - - 1.19 -
Total - - - - - 0.14 0.24 0.28 0.22 0.23 0.58 0.28 0.10 - 1.19 -
1 – growth regarding the same month last year 2 – from the beginning of the year up to the analyzed month inclusive 3- growth regarding the same period last year
Monthly Report. Russia. Caustic Soda
May 28, 2007 15 © MRC
Solid Caustic Soda: Import by Countries, 000 DMT
Country Apr 06
May 06
Jun 06
Jul 06
Aug 06
Sep 06
Oct 06
Nov 06
Dec 06
Jan 07
Feb 07
Mar 07
Apr 07
Growth1.% From the
beginning ofthe year2
Growth3.%
China 0.12 0.30 1.81 1.18 2.49 1.01 1.71 1.50 1.49 1.45 - 1.80 1.26 - 4.51 516%
Poland 0.17 0.15 - 0.26 0.29 0.11 0.22 0.11 0.18 - 0.17 0.13 0.28 67% 0.58 187%
Lithuania 0.02 0.02 0.04 0.02 0.02 0.02 0.03 0.04 0.03 0.02 0.04 - - - 0.06 -32%
Germany - - - 0.01 - 0.01 0.01 0.02 0.01 0.00 0.01 0.01 - - 0.01 90%
Belgium 0.03 - - - - - - - - - - - - - - -86%
Azerbaijan 0.25 0.13 0.25 0.25 0.25 - - - - - - - - - - -100%
others 0.02 0.06 0.09 0.01 - - - - - - 0.01 - - - 0.01 -81%
Total 0.61 0.66 2.21 1.73 3.05 1.15 1.98 1.67 1.70 1.48 0.23 1.94 1.54 153% 5.18 176%
Import in April 2007, %
China82%
Poland18%
Import in April 2006, %
Poland28%
Azerbaijan40%
Belgium5%
China20%
other7%
Import from the beginning of 20074, %
Poland11%
China87%
other2%
Import from the beginning of 20064, %other4%
Poland11%
Lithuania5%
Azerbaijan41%
China39%
Import in 2006, %other2%Poland
9%
Lithuania2%
China77%
Azerbaijan10%
Import in 2005, %China5%
other3%
Azerbaijan77%
Poland15%
1 – growth regarding the same month last year 2 – from the beginning of the year up to the analyzed month inclusive 3- growth regarding the same period last year
Solid Caustic Soda: Import by Countries, %
Monthly Report. Russia. Caustic Soda
May 28, 2007 16 © MRC
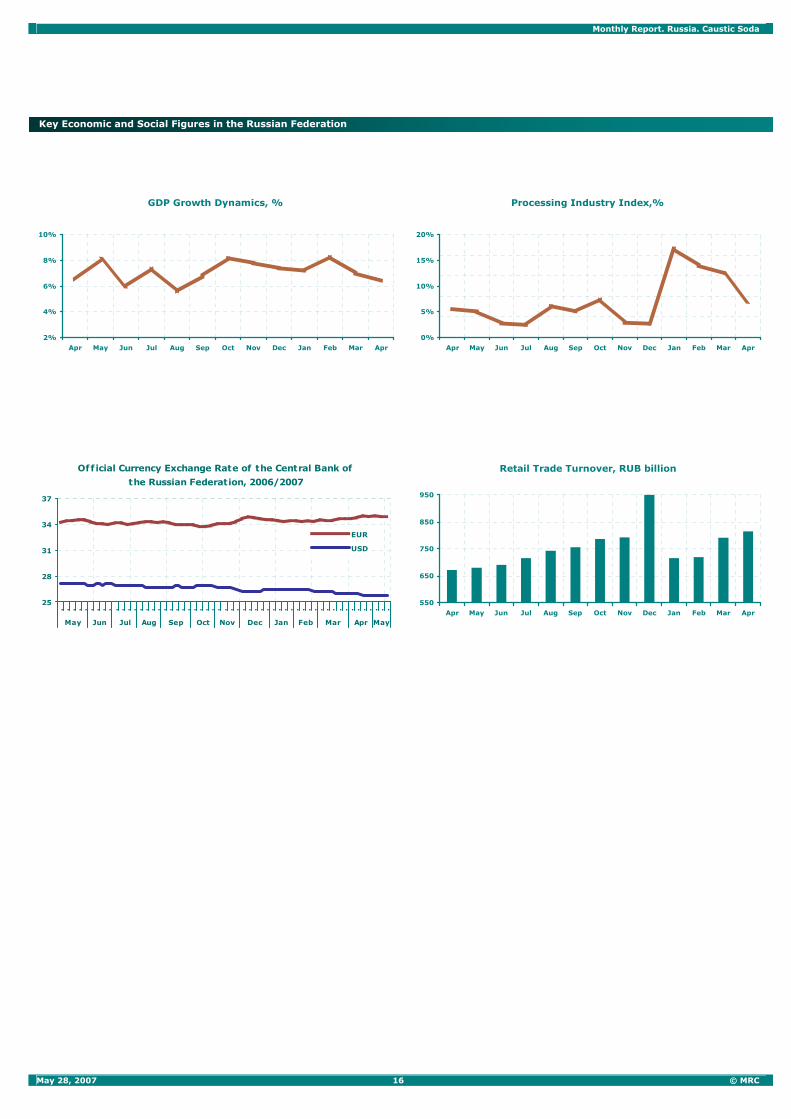
GDP Growth Dynamics, %
2%
4%
6%
8%
10%
Apr May Jun Jul Aug Sep Oct Nov Dec Jan Feb Mar Apr
Processing Industry Index,%
0%
5%
10%
15%
20%
Apr May Jun Jul Aug Sep Oct Nov Dec Jan Feb Mar Apr
Official Currency Exchange Rate of the Central Bank of
the Russian Federation, 2006/2007
25
28
31
34
37
. . . . . . . . . . . . . . . . . . . . . . . . . . . . . . . . . . . . . . . . . . . . . . . . . . . . . . .
May Jun Jul Aug Sep Oct Nov Dec Jan Feb Mar Apr May
EUR
USD
Retail Trade Turnover, RUB billion
550
650
750
850
950
Apr May Jun Jul Aug Sep Oct Nov Dec Jan Feb Mar Apr
Key Economic and Social Figures in the Russian Federation
Monthly Report. Russia. Caustic Soda
May 28, 2007 17 © MRC
May 23, 2007
“Caustic” was refused again
On Tuesday, May 22, the board of appeals of Moscow Arbitrage
Court remained in force the decision of the court of original
jurisdiction on allowance of claims of the OJSC “Caustic”
(Volgograd) about invalidation of the decision and order of the
Federal Antimonopoly Service of Russia (FAS), according to which
“Caustic” was declared an infringer of the antimonopoly legislation
with respect to the OJSC “Chemprom” (Volgograd). That was
informed by the press service of the enterprise.
We would like to remind that in August 2006, “Chemprom” turned
to the FAS with a request to take actions envisaged by the
antimonopoly legislation to avoid Caustic’s abusing owing to its
dominating position in the brine market, which is the main raw
material in production of chlorine and caustic. The thing was that on
June 23rd “Caustic” stopped supplying of brine to “Chemprom”.
Production of brine is the object designed and constructed in the
Soviet times to serve both enterprises, but as a result of
privatization it was passed into the ownership of “Caustic”. Since
then, being the owner of the only production of underground brine
in Volgograd Region, Caustic has been demonstrating a tough
position regarding supplies of this product to the neighboring
enterprise. Constant increase of prices for brine and irregular
supplies introduced a destabilizing element into the work of the
company.
On December 20, the Federal Antimonopoly Service of Russia
pronounced a judgment on breach of the antimonopoly legislation
by the OJSC “Caustic” in stoppage of supplies of underground brine
to the OJSC “Chemprom”, as well as in the establishment of
monopoly-high prices for this product. “Caustic” was ordered to stop
abusing its dominating position and to make an agreement with
“Chemprom” before January 31, 2007 on supplies of the brine in
volumes needed to ensure production activities of the enterprise at
economically based prices.
Specialists of the FAS indicated that the price for these raw
materials supplied to the OJSC “Chemprom” was monopoly high
since it exceeded the amount of costs and profit required for
production and sales of such products. Particularly, in December of
2003, the General Director of “Caustic”, Mr. Eldor Azizov, took a
decision on inclusion of the investment component for construction
and development of additional brine wells into the price of the
product for other consumers. At the same time, the enterprise was
not able to confirm the validity of plans on increase of brine
production with the indication of objects and volumes of
investments, period of construction and commissioning of additional
wells, and to present respective documents to the FAS of Russia.
On January 9, “Chemprom” forwarded a letter to “Caustic” with a
proposal to make an agreement in accordance with the order of the
Federal Antimonopoly Service. However, “Chemprom” got a written
refusal from “Caustic” on January 25. The main reason was the
price for the brine offered by “Chemprom” — RUB46 per one cubic
meter. Notwithstanding the order of the FAS of Russia, «Caustic”
insisted on the former price — RUB165 per one cubic meter.
“Chemprom” had to turn to Arbitrage of Volgograd Region with a
claim on compulsion of “Caustic” to make an agreement on supply
of brine to the enterprise. “Caustic” also turned to Arbitrage of
Moscow claiming to nullify decisions and orders of the Federal
Antimonopoly Service pertinent to the enterprise. The legal
investigation in Volgograd Arbitrage was suspended till the
pronouncement of the decision by Arbitrage of Moscow.
In connection with the absence of legal grounds for invalidation of
decisions and orders of the FAS of Russia, the board of appeals of
Moscow Arbitrage ratified the decision of court of original jurisdiction
on denial of counts of “Caustic”.
May 23, 2007
Chemprom of Uzbekistan has been displayed for sale
In the nearest future, the State Property Committee of Uzbekistan is
going to sell controlling share holdings of almost all biggest
enterprises, “Expert” informs. In the meantime, the government
wants to leave assets only in the fuel and energy complex, minerals
industry and telecommunications.
We would like to remind that still at the beginning of July last year,
the government of Uzbekistan declared about a large-scale program
on de-stating of property for 2006–2008. Already at the beginning
of May, Maxam Corp. SAU of Spain acquired 49% of shares of the
OJSC “Electrochemprom” (Chirchik, Tashkent Region), which is
among the three biggest chemical plants of Uzbekistan, for USD22
million.
The government wants to display for sale shares of nine plants
united by the state company “Uzchemprom”. Currently, they are
accomplishing tender procedures regarding two biggest chemical
enterprises: OJSC “Navoiazot” and OJSC “Ammofos”.
In the nearest future, they plan to sell three more plants based in
Fergana: “Ferganaazot”, a furane compounds plant and a chemical
fiber plant, and Samarkand Chemical Plant.
The interest in the Uzbek chemical industry is shown by Russian
companies as well. Particularly, “Caustic” (Volgograd) and the OJSC
“Navoiazot”, on the basis of the Uzbek enterprise, a joint venture to
manufacture organic synthesis products. The cost of the enterprise
is about USD200 million.
News
Monthly Report. Russia. Caustic.
In compliance with the preliminary feasibility studies, the joint
venture plans to build a complex to produce 80 KT of caustic soda
and 120 KT of PVC annually on the basis of the acetylene production
of the OJSC “Navoiazot”.
The chemical industry of Uzbekistan is attractive due to its access to
cheap gas and possibility to produce mineral fertilizers with a
relatively low prime cost.
Experts also agree that Uzbek assets shall rouse investors; interest
in access to cheap gas, and, consequently, in possibility to produce
nitric fertilizers, which is one of the main competitive products of
the Uzbek chemical industry with a relatively low prime cost.
Purchasing companies will have to modernize acquired enterprises
since they were built in the 60–70s, now they are morally and
technically obsolete.
May 23-24, 2007
Kanoria Chemicals&Industries expands its production of
caustic soda
Kanoria Chemicals&Industries of India is planning to expand
production of caustic soda up to 130 KT a year. This is informed by
“Evraziyskiy Chemicheskiy Rynok” (“Eurasian Chemical Market”).
The project will be financed by the International Finance Corporation
(IFC). The volume of required investments will constitute USD 20
million, 15 of them IFC will provide as a loan, and 5 million will be
used to buy shares of Kanoria Chemicals & Industries. The
accomplishment of the project is planned for 2008.
Kanoria Chemicals & Industries produces caustic soda at two
enterprises: Renukoot in the State of Uttar-Pradesh and Ankleshwar
in the state of Gudjarat.
KCI produces 20 brands of chemical substances. The share of the
company constitutes 18% of the market of formaldehyde, which is
widely used in the production of plastics. The share of the company
in the hexamine market makes up 38%.
May 18-25, 2007
The commodity output of “Caustic” constituted RUB 1 098,8
million
During January-April 2007, the commodity output of “Caustic” (the
managing company is “Nikochem”) constituted RUB 1098,8 million,
which was by 3.6% more than during the same period last year in
comparable prices.
During that period, the company produced: liquid caustic soda –
49.3 KT, granulated caustic soda – 22.4 KT, chlorine – 16.8 KT,
synthetic hydrochloric acid – 83.0 KT, anti-icing material “AGS” –
20.5 KT, liquid chlorinated paraffin wax – 2.9 KT.
The growth of output volumes during January-April 2007 by main
types of products, comparing with the same period last year,
constituted: 6.7% by liquid caustic soda, 3.4% by garanulated
caustic soda, 10.6% by chlorine, 5.1% by synthetic hydrochloric
acid, 17.4% by liquid chlorinated paraffin wax, 270% by anti-icing
material “AGS”.
May 28, 2007
“Sibur-Neftechem” summed up results of its production
activities in April
“Sibur-Neftechem” summed up results of its production activities in
April 2007. All three plants of the company – “Petrochemical Plant”
in Kstovo, “Ethylene and Glycol Oxide Plant” and “Kaprolaktam” in
Dzerzhynsk successfully fulfilled plans by the majority of products.
In April 2007, “Petrochemical Plant” processed 59.4 KT of raw
materials on pyrolysis furnaces, which constituted 92%, comparing
with the same period last year. In April 2007, the plant produced:
20.7 KT of ethylene, 9.5 KT of propylene, 5.3 MT of butane-
butadiene fraction (BBF), and 2.5 KT of heavy pyrolized resin. In
April 2007, the enterprise went over the quota in terms and BBF
production; it fulfilled the plan on benzol production.
In April 2007, “Ethylene and Glycol Oxide” Plant produced: 5.7 KT of
ethylene oxide, 19.2 KT of monoethyleneglycol (MEG), 2.04 MT of
diethyleneglycol (DEG), 122.4 MT of triethyleneglycol (TEG).
“Kaprolaktam” (Dzerzhynsk) produced: 1.4 MT of liquid chlorine in
tanks and containers, 1.2 KT of ethylene chlorohydrin, 7.8 MT. In
April 2007, the plant went over the quota in terms of production of
hydrochloric acid, ethylene chlorohydrin, aluminum sulfate, caustic,
PVC resin and compounds.
May 29, 2007
“Usolyechemprom” will borrow RUB 68.5 million from
“Alpha-Bank”
“Usolyechemprom” Ltd. (Usolye-Sibirskoye, a member of “Nitol”
Group) will take a credit from the OJSC “Alpha-Bank” for the
amount of RUB 68.5 at three-month MosIBOR +4.5% interest per
annum. This is informed in the statement of “Nitol Group” Ltd.,
which is the warrantor of the credit.
The credit will be granted for the period of 1 year.
“Usolyechemprom” specializes in production of calcium hypochlorite,
calcium carbide, caustic soda, hydrogen peroxide, PVC,
trichlorethylene and epichlorhydrin. Apart from “Usolyechemprom”,
the daughter enterprises of the “Nitol” Group include “Chemical
Group Nitol” Ltd., “Chemstroymontazh” Ltd., “Nitol-Cellulose Ethers”
Ltd., “Usolye-Sibirskiy Silicon” Ltd. and “Chembyt” Ltd.
Our Contacts: Sales: [email protected] Olga Savina [email protected] Telephones: Moscow: + 7 495 543 91 94
General questions: [email protected] Vyacheslav Mitskevich [email protected] Kyiv: + 38044 240 82 35