category: performance improvementefficiency.missionenergy.org/presentations/gsecl-abtadvi.pdfname of...
TRANSCRIPT

CATEGORY: Performance improvement
GUJARAT STATE ELECTRICITY CORPORATION LIMITEDWANAKBORI THERMAL POWER STATION
Name-A.B. TadviDesignation-Executive EngineerEmail- [email protected]
GSECL Incorporated in 1993 under Companies Act, 1956 as anobjective of restructuring of Power sector utility.
As Individual Power Producer after unbundling of GEB in 2005 as perElectricity Act 2003.
Primarily engaged in generation of Electricity by Coal, Gas, Wind &Solar power generation.
Vision : To become one of the most efficient Power GeneratingCompanies globally.
Mission : To generate Power by adopting global best practices through
• Professional Excellence
• Transparency
• Value Addition
• Highest level of Productivity
• Nation Building
• Safety, Self discipline
• Customers Satisfaction
• Participative work culture
• Pride of belongingness
• Excellence
• Being ethically & Socially
responsive

Name of Power Station Units (MW) Capacity (in MW )
Base Fuel
WTPS 7x210 + 1* 800 (Under Comm.) 1470 +800 Coal
GTPS 3x210 630 Coal
UTPS 2x200 + 1x210 + 1 x 500 1110 Coal
KLTPS 2 x 70 + 2 x 75 290 Coal (Lignite)
Ukai Hydro 4 x 75 + 2x2.5 (Mini Hydro) 305 Hydro
Kadana Hydro 4x60 + 2x1 (Panam) 242 Hydro
UGBPS 1 x 375 375 Gas
DGBPS 107+112+376 595 Gas
STPS 2 x 270 540 Coal
Windmills 10 10 Wind
Solar plant at GTPS & KLTPS 1 2 Solar
Solar Plant at Sanad 1 1 Solar
Total 5570 MW
Gujarat State Electricity Corporation LtdGenerating Capacity

WANAKBORI TPS WANAKBORI TPS -- OVERVIEWOVERVIEW
Stage UnitDate of
CommissioningCapacity
MW Make/Type
I
1 23.03.1982 210
BHEL / LMZ2 15.01.1983 210
3 15.03.1984 210
II
4 09.03.1986 210
BHEL/KWU5 23.09.1986 210
6 18.03.1987 210 III 7 31.12.1998 210
Ext. 8Zero Date – Oct 14Commissioning Activities Up-progress
800 BHEL/KWU
Power Evacuation
400 KV 3 lines
220 KV 7 lines
ICT(400 KV/220 KV,
500 MVA )

Daily Monitoring of Plant Parameters:Daily Monitoring of Plant Parameters: Every Day Plant related Data reviewed & checked. If any parameters
deviated from design value than we take action for optimize that parameters up-to design value.
Performance test of each unit carried out ones in month at full load. – out comes of test also convey to concern maintenance and operation sections for necessary corrective action for improvement of plant performance.
Daily Report sheet display in next sheet for ref. - Page No.1 Generation Data of previous day- Page No.2 Plant parameters details at 06:00 AM (Parameters which
affect the performance of plant)- Page No.3 Water balance sheet (For optimization of Water
consumption


For Reduction of Auxiliary For Reduction of Auxiliary consumptionconsumption
Daily basis 6.6 kv Auxiliary consumption reviewed.• To check healthiness of all HT auxiliaries we measured vibration every
forth night.• Mill grinding roller and bullring segment running hrs is maintained also
observed once in month during meeting.• Loading and unloading of service and instrument air compressor is
observed and if required corrective action is to be initiated.• During Reserved Shut down period – minimum / required auxiliary run
only.• Coro coating of CW pump is done to improve flow of CW pump.

STATION GROSS HEAT RATE (kcal/kwh)STATION GROSS HEAT RATE (kcal/kwh)
2016-17 2017-18 2018-19
UNIT #1 2733 2667 2681
UNIT #2 2716 2674 2654
UNIT #3 2718 2485* 2326
UNIT #4 2584 2553 2561
UNIT #5 2608 2563 2575
UNIT #6 2619 2551 2573
UNIT #7 2490 2450 2454
UNIT #1 TO 6 2661 2580 2539
UNIT #1 TO 7 2621 2555 2524
* Unit#3 turbine and boiler retrofitting was carried out in Dec-2017. After that Heat-rate improved. Details mention in slide no. 11,12.

Auxiliary Power consumption in %Auxiliary Power consumption in %2016-17 2017-18 2018-19 2019-20
UNIT #1 9.66 9.49 9.79 9.84
UNIT #2 9.11 8.99 8.83 8.92
UNIT #3 9.09 8.63 8.36 8.45
UNIT #4 9.92 8.94 8.88 9.13
UNIT #5 9.98 8.96 8.94 9.01
UNIT #6 10.96 9.39 9.58 9.78
UNIT #7 9.59 9.07 9.09 9.17
UNIT #1 TO 6 9.75 9.09 9.00 9.11
UNIT #1 TO 7 9.71 9.08 9.02 9.12

SPECIFIC OIL CONSUMPTION (ml/kwh)SPECIFIC OIL CONSUMPTION (ml/kwh)
2016-17 2017-18 2018-19
UNIT #1 2.49 0.94 1.48
UNIT #2 1.73 1.37 0.86
UNIT #3 2.29 2.71 0.50
UNIT #4 1.81 0.58 0.63
UNIT #5 1.88 0.84 1.17
UNIT #6 2.86 0.78 0.97
UNIT #7 1.42 0.32 0.17
UNIT #1 TO 6 2.13 1.10 0.87
UNIT #1 TO 7 1.96 0.95 0.75
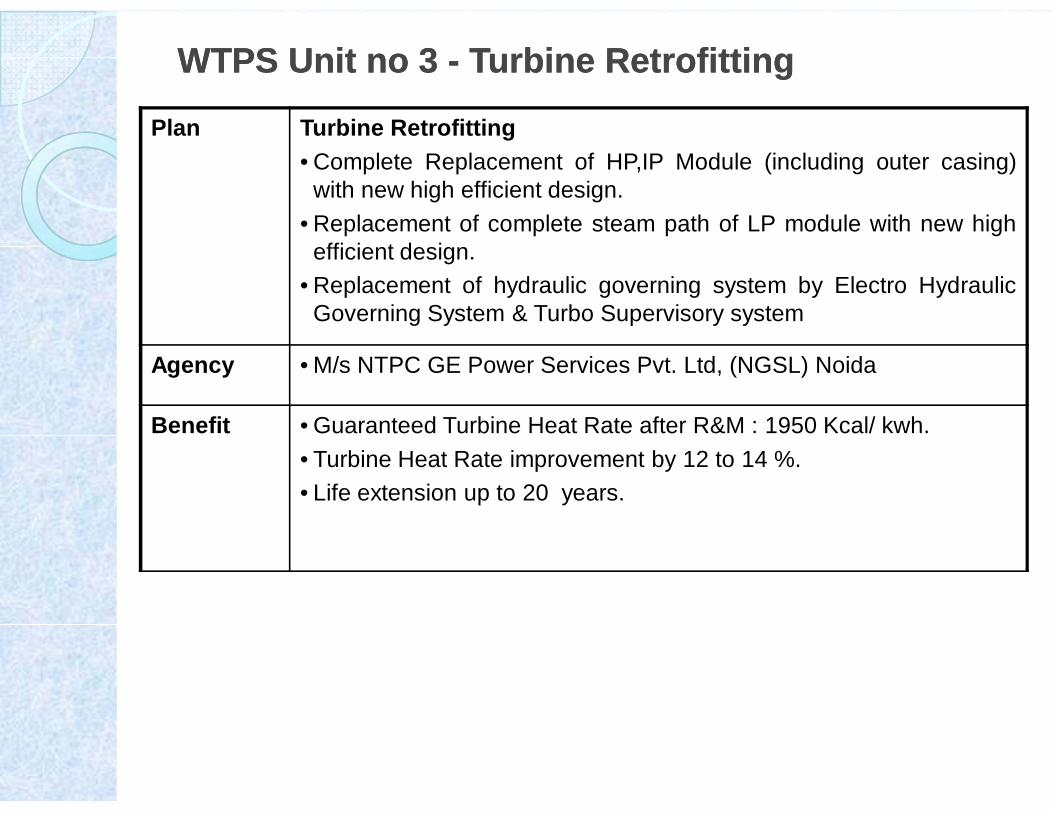
WTPS Unit no 3 WTPS Unit no 3 -- Turbine Retrofitting Turbine Retrofitting
Plan Turbine Retrofitting• Complete Replacement of HP,IP Module (including outer casing)
with new high efficient design.• Replacement of complete steam path of LP module with new high
efficient design.• Replacement of hydraulic governing system by Electro Hydraulic
Governing System & Turbo Supervisory system
Agency • M/s NTPC GE Power Services Pvt. Ltd, (NGSL) Noida
Benefit • Guaranteed Turbine Heat Rate after R&M : 1950 Kcal/ kwh.• Turbine Heat Rate improvement by 12 to 14 %.• Life extension up to 20 years.
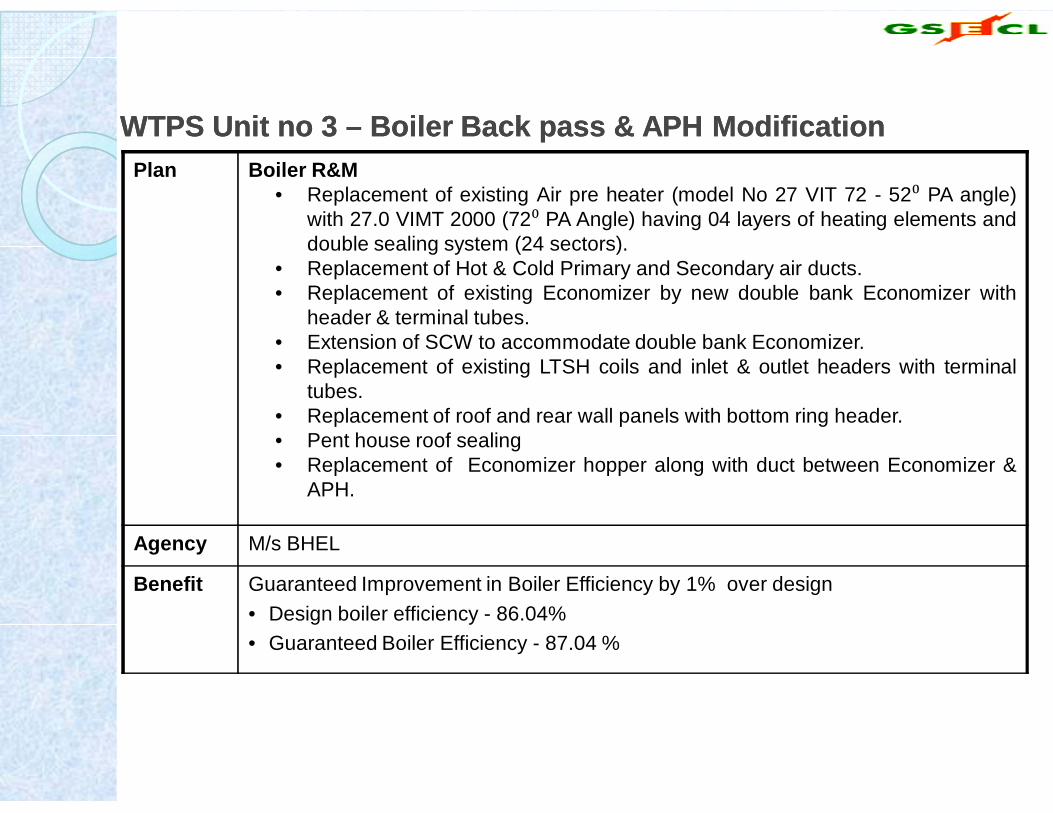
WTPS Unit no 3 WTPS Unit no 3 –– Boiler Back pass & APH ModificationBoiler Back pass & APH ModificationPlan Boiler R&M
• Replacement of existing Air pre heater (model No 27 VIT 72 - 52⁰ PA angle)with 27.0 VIMT 2000 (72⁰ PA Angle) having 04 layers of heating elements anddouble sealing system (24 sectors).
• Replacement of Hot & Cold Primary and Secondary air ducts.• Replacement of existing Economizer by new double bank Economizer with
header & terminal tubes.• Extension of SCW to accommodate double bank Economizer.• Replacement of existing LTSH coils and inlet & outlet headers with terminal
tubes.• Replacement of roof and rear wall panels with bottom ring header.• Pent house roof sealing• Replacement of Economizer hopper along with duct between Economizer &
APH.
Agency M/s BHEL
Benefit Guaranteed Improvement in Boiler Efficiency by 1% over design• Design boiler efficiency - 86.04%• Guaranteed Boiler Efficiency - 87.04 %

WTPS Unit-3 Saving after R&M
MonthHeat-rate PLF Gen APC CV CF SOC
HR DEVIATI
ONHeat Saved Coal To Be
savedTotal
Saving
Kcal/Kwh % MW % Kcal/Kg MT/MW ml/Kwh Kcal/Kwh Mcal MT Rs in Cr.Up to 30June 2017 2669 72.4 332066 8.45 3897 0.68 0.46
Dec-17 2394 52.36 0.001 9.14 3835 0.6 7.91 19 0.01900 0.00000 0.02477Jan-18 2322 90.99 142156 8.09 3916 0.59 0.79 347 49328132 12596.6 6.30Feb-18 2320 76.98 108632 8.24 3945 0.59 0.64 349 37912568 9610.3 4.81Mar-18 2323 93.4 145923 8.08 3993 0.58 0.48 346 50489358 12644.5 6.32Apr-18 2314 95.38 144211 8.01 4114 0.562 0.37 355 51147002 12433.5 6.22May-18 2321 97.36 152115 8.20 4026 0.576 0.39 348 52920194 13144.4 6.57Jun-18 2319 96.11 145314 8.28 4094 0.566 0.00 350 50914862 12437.0 6.22Jul-18 2328 80.52 125797 8.64 3913 0.593 0.58 341 42959546 10979.9 5.49
Aug-18 2327 70.48 110120 8.63 3952 0.588 0.44 342 37664809 9529.7 4.76Sep-18 2333 80.01 120970 8.59 4075 0.569 1.31 336 40655318 9976.7 4.99Oct-18 2318 93.92 146733 8.31 4040 0.572 0.57 351 51549648 12759.0 6.38Nov-18 2324 68.04 102870 8.65 3861 0.600 0.83 345 35469068 9187.3 4.59Dec-18 2322 86.48 135114 8.41 3852 0.602 0.32 347 46926901 12182.1 6.09
During Year 2328 83 1579955 8.41 3970 0.58 1.12 321 507648941 127857.5 68.77* Considering Cost of Coal at 5000 Rs/MT
Total R&M Cost
Description Rs in Cr.
R&M Cost 165
Fuel FO+LDO 4.7
APC during R&M 0.91
Total R&M Cost 170.61

Plant Performance improvement Plant Performance improvement
• WTPS has designed one internal web site, Based on running plant dataour engineer can easily calculate and evaluate the Condenserperformance, Feed water Heater performance and Air pre-heaterperformance. It’s help to improve the plant performance.
• Data of Daily and monthly and yearly key parameters like KPI, Fuel,Stock, Unit running hrs, APC, water report are available for reference.
• Also by continuous monitoring on Schedule, Frequency and Sent outWTPS earns from DSM. Details mentions as under.
YEAR WTPS-1-6 (Rs. In Cr)
WTPS-7(Rs. In Cr)
WTPS-1-7(Rs. In Cr)
FY-2017-18 8.19 1.35 9.55
FY-2018-19 2.47 1.24 3.71

Monitoring performance of condenser
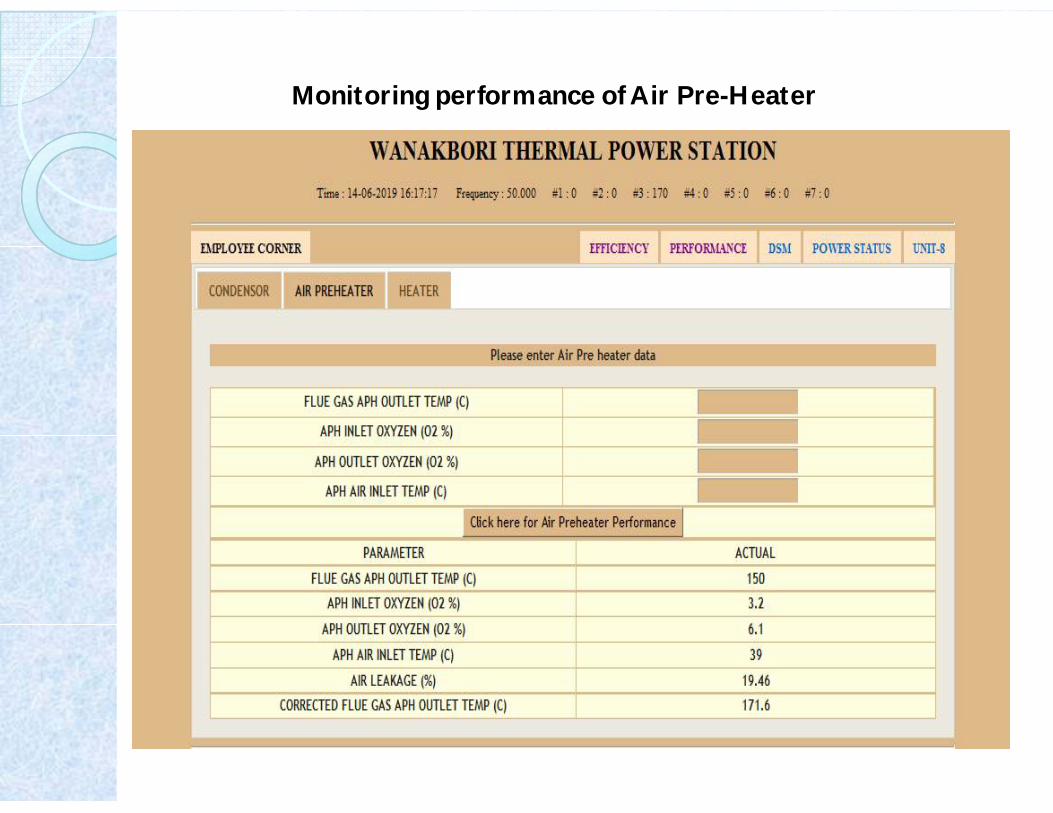
Monitoring performance of Air Pre-Heater

Monitoring performance of Feed Water Heaters
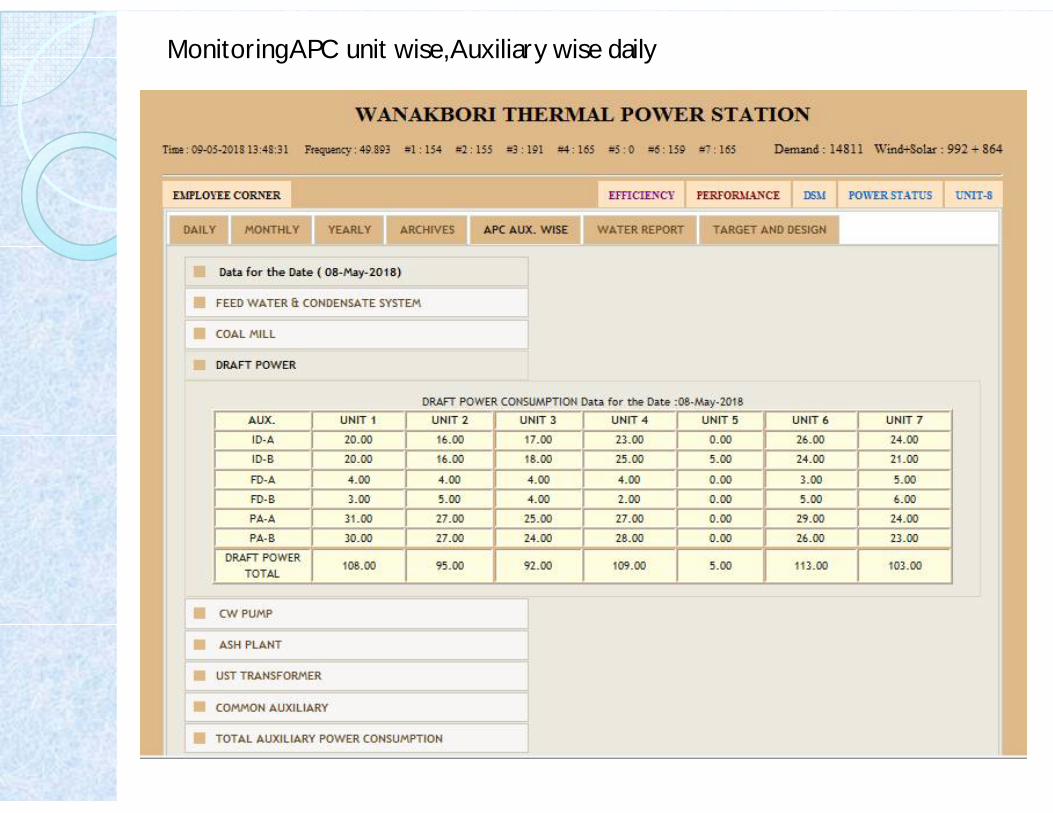
Monitoring APC unit wise, Auxiliary wise daily


